

Evaluation of Long-Term Outcomes of Direct Acting Antiviral Agents in Chronic Kidney Disease Subjects: A Single Center Cohort Study

 , , and
Abstract
1. Introduction
2. Materials and Methods
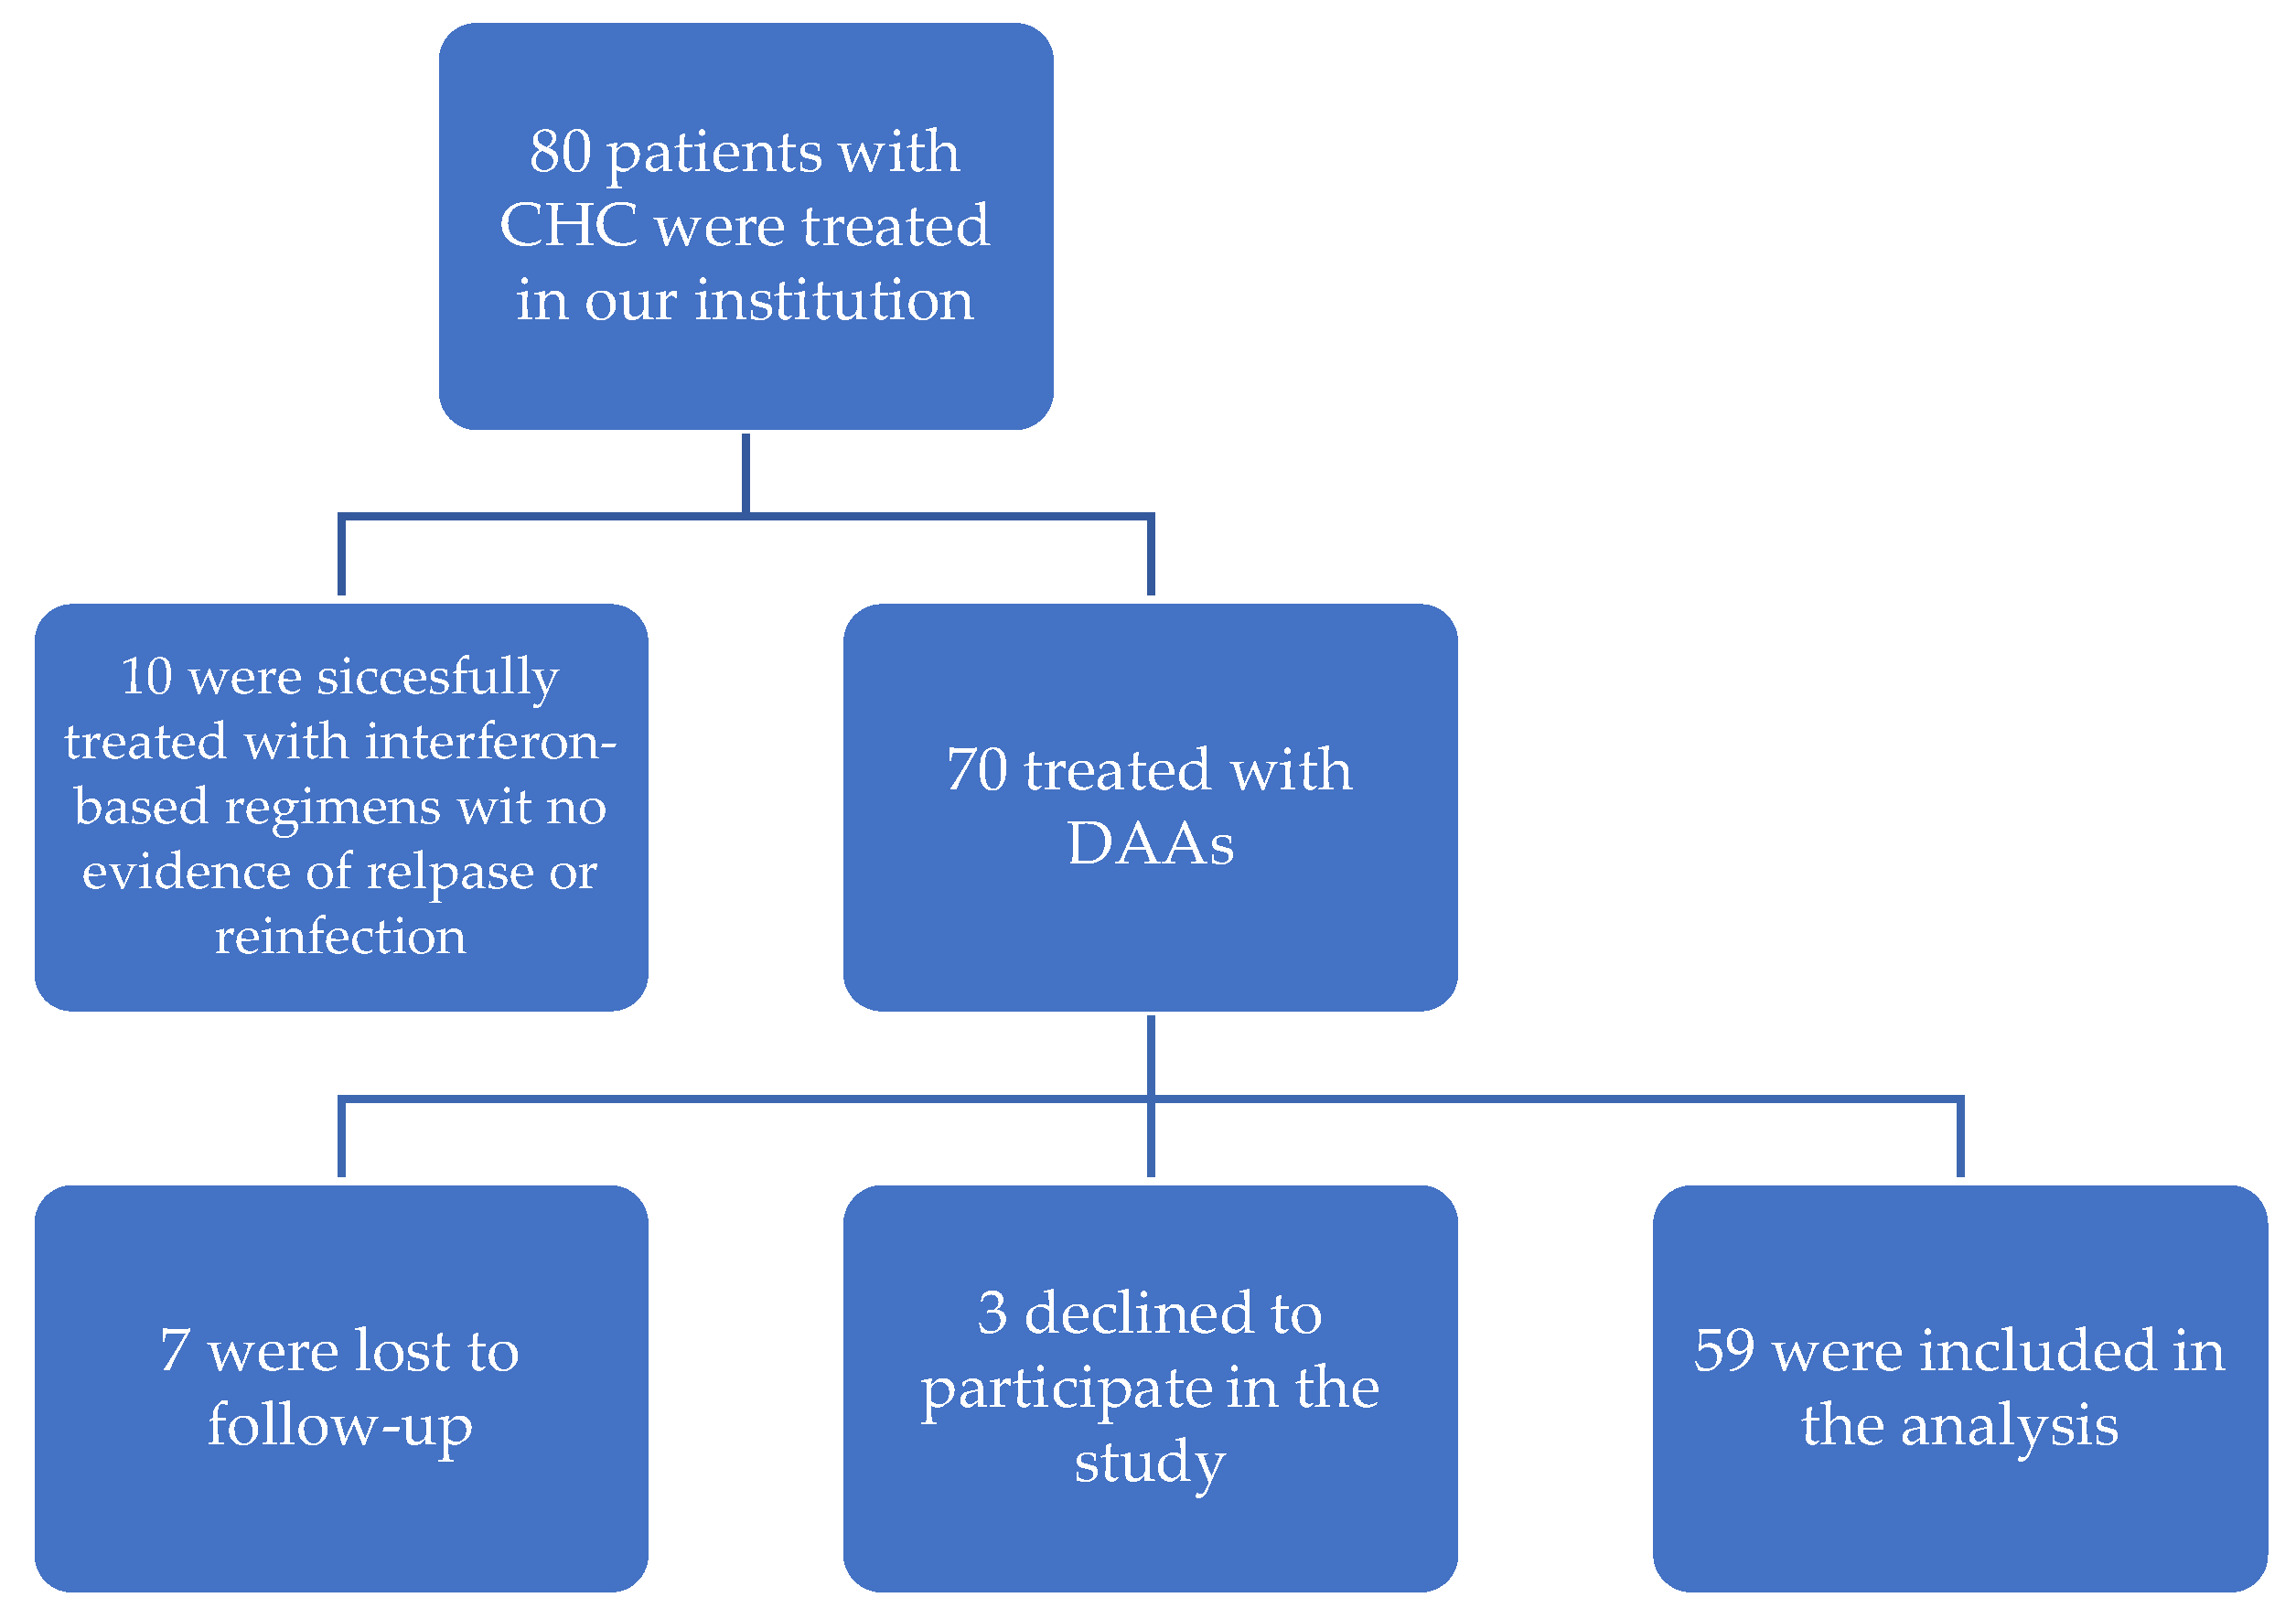
2.1. Study Population and Design
2.2. PBMC Isolation from Whole Blood
2.3. Detection of HCV RNA in PBMCs
2.4. Liver Fibrosis Assessment
2.5. Statistical Analysis
2.6. Aim and Study Endpoints
3. Results
3.1. SVR
3.2. Kidney Function
3.3. Liver Function
3.4. CNI Dose Adjustments
3.5. Safety
3.6. OCI
3.7. Long-Term Outcomes of DAAs in Kidney Transplant Recipients
4. Discussion
5. Conclusions
Supplementary Materials
Author Contributions
Funding
Institutional Review Board Statement
Informed Consent Statement
Data Availability Statement
Conflicts of Interest
References
- Blach, S.; Zeuzem, S.; Manns, M.; Altraif, I.; Duberg, A.-S.; Muljono, D.H.; Waked, I.; Alavian, S.M.; Lee, M.-H.; Negro, F.; et al. Global prevalence and genotype distribution of hepatitis C virus infection in 2015: A modelling study. Lancet Gastroenterol. Hepatol. 2017, 2, 161–176. [Google Scholar] [CrossRef] [PubMed]
- Fissell, R.B.; Bragg-Gresham, J.L.; Woods, J.D.; Jadoul, M.; Gillespie, B.; Hedderwick, S.A.; Rayner, H.C.; Greenwood, R.N.; Akiba, T.; Young, E.W. Patterns of hepatitis C prevalence and seroconversion in hemodialysis units from three continents: The DOPPS. Kidney Int. 2004, 65, 2335–2342. [Google Scholar] [CrossRef] [PubMed]
- Pol, S.; Parlati, L.; Jadoul, M. Hepatitis C virus and the kidney. Nat. Rev. Nephrol. 2019, 15, 73–86. [Google Scholar] [CrossRef]
- Fabrizi, F.; Dixit, V.; Messa, P. Impact of hepatitis C. on survival in dialysis patients: A link with cardiovascular mortality? J. Viral Hepat. 2012, 19, 601–607. [Google Scholar] [CrossRef] [PubMed]
- Fabrizi, F.; Messa, P.; Martin, P. Health-Related Quality of Life in Dialysis Patients with HCV Infection. Int. J. Artif. Organs 2009, 32, 473–481. [Google Scholar] [CrossRef] [PubMed]
- Fabrizi, F.; Donato, F.M.; Messa, P. Association Between Hepatitis C Virus and Chronic Kidney Disease: A Systematic Review and Meta-Analysis. Ann. Hepatol. 2018, 17, 364–391. [Google Scholar] [CrossRef] [PubMed]
- Fabrizi, F.; Verdesca, S.; Messa, P.; Martin, P. Hepatitis C Virus Infection Increases the Risk of Developing Chronic Kidney Disease: A Systematic Review and Meta-Analysis. Dig. Dis. Sci. 2015, 60, 3801–3813. [Google Scholar] [CrossRef]
- Jadoul, M.; Awan, A.A.; Berenguer, M.C.; Bruchfeld, A.; Fabrizi, F.; Goldberg, D.S.; Jia, J.; Kamar, N.; Mohamed, R.; Pol, S.; et al. KDIGO 2022 Clinical Practice Guideline for the Prevention, Diagnosis, Evaluation, and Treatment of Hepatitis C in Chronic Kidney Disease. Kidney Int. 2022, 102, S129–S205. [Google Scholar] [CrossRef]
- Pawlotsky, J.M.; Negro, F.; Aghemo, A.; Berenguer, M.; Dalgard, O.; Dusheiko, G.; Marra, F.; Puoti, M.; Wedemeyer, H. EASL recommendations on treatment of hepatitis C: Final update of the series. J. Hepatol. 2020, 73, 1170–1218. [Google Scholar] [CrossRef]
- Ghany, M.G.; Morgan, T.R. Hepatitis C. Guidance 2019 Update: American Association for the Study of Liver Diseases–Infectious Diseases Society of America Recommendations for Testing, Managing, and Treating Hepatitis C Virus Infection. Hepatology 2020, 71, 686–721. [Google Scholar] [CrossRef]
- Fabrizi, F.; Martin, P.; Dixit, V.; Messa, P. Hepatitis C Virus Infection and Kidney Disease: A Meta-Analysis. Clin. J. Am. Soc. Nephrol. 2012, 7, 549–557. [Google Scholar] [CrossRef] [PubMed]
- Ahmed, H.; Abushouk, A.I.; Menshawy, A.; Mohamed, A.; Negida, A.; Loutfy, S.A.; Abdel-Daim, M.M. Safety and Efficacy of Ombitasvir/Paritaprevir/Ritonavir and Dasabuvir with or without Ribavirin for Treatment of Hepatitis C Virus Genotype 1: A Systematic Review and Meta-analysis. Clin. Drug. Investig. 2017, 37, 1009–1023. [Google Scholar] [CrossRef] [PubMed]
- Roth, D.; Nelson, D.R.; Bruchfeld, A.; Liapakis, A.; Silva, M.; Monsour, H.; Martin, P.; Pol, S.; Londoño, M.C.; Hassanein, T.; et al. Grazoprevir plus elbasvir in treatment-naive and treatment-experienced patients with hepatitis C virus genotype 1 infection and stage 4–5 chronic kidney disease (the C-SURFER study): A combination phase 3 study. Lancet 2015, 386, 1537–1545. [Google Scholar] [CrossRef]
- Gane, E.; Lawitz, E.; Pugatch, D.; Papatheodoridis, G.; Bräu, N.; Brown, A.; Pol, S.; Leroy, V.; Persico, M.; Moreno, C.; et al. Glecaprevir and Pibrentasvir in Patients with HCV and Severe Renal Impairment. N. Engl. J. Med. 2017, 377, 1448–1455. [Google Scholar] [CrossRef]
- Castillo, I.; Pardo, M.; Bartolomé, J.; Ortiz-Movilla, N.; Rodríguez-Iñigo, E.; de Lucas, S.; Salas, C.; Jiménez-Heffernan, J.A.; Pérez-Mota, A.; Graus, J.; et al. Occult Hepatitis C Virus Infection in Patients in Whom the Etiology of Persistently Abnormal Results of Liver-Function Tests Is Unknown. J. Infect. Dis. 2004, 189, 7–14. [Google Scholar] [CrossRef] [PubMed]
- Welker, M.W.; Zeuzem, S. Occult hepatitis C: How convincing are the current data? Hepatology 2009, 49, 665–675. [Google Scholar] [CrossRef] [PubMed]
- Attar, B.M.; Van Thiel, D. A New Twist to a Chronic HCV Infection: Occult Hepatitis C. Gastroenterol. Res. Pract. 2015, 2015, 579147. [Google Scholar] [CrossRef]
- Austria, A.; Wu, G.Y. Occult Hepatitis C Virus Infection: A Review. J. Clin. Transl. Hepatol. 2018, 6, 155–160. [Google Scholar] [CrossRef]
- Castillo, I.; Bartolomé, J.; Quiroga, J.A.; Barril, G.; Carreño, V. Hepatitis C virus infection in the family setting of patients with occult hepatitis C. J. Med. Virol. 2009, 81, 1198–1203. [Google Scholar] [CrossRef]
- Wang, Y.; Rao, H.; Chi, X.; Li, B.; Liu, H.; Wu, L.; Zhang, H.; Liu, S.; Zhou, G.; Li, N.; et al. Detection of residual HCV-RNA in patients who have achieved sustained virological response is associated with persistent histological abnormality. EBioMedicine 2019, 46, 227–235. [Google Scholar] [CrossRef]
- Pardo, M.; López-Alcorocho, J.M.; Rodríguez-Iñigo, E.; Castillo, I.; Carreño, V. Comparative study between occult hepatitis C virus infection and chronic hepatitis C. J. Viral Hepat. 2007, 14, 36–40. [Google Scholar] [CrossRef] [PubMed]
- Singh, S.; Facciorusso, A.; Loomba, R.; Falck-Ytter, Y.T. Magnitude and Kinetics of Decrease in Liver Stiffness After Antiviral Therapy in Patients With Chronic Hepatitis C: A Systematic Review and Meta-analysis. Clin. Gastroenterol. Hepatol. 2018, 16, 27–38.e4. [Google Scholar] [CrossRef] [PubMed]
- Poynard, T.; Afdhal, N.H. Perspectives on Fibrosis Progression in Hepatitis C: An à la Carte Approach to Risk Factors and Staging of Fibrosis. Antivir. Ther. 2010, 15, 281–291. [Google Scholar] [CrossRef]
- Piedade, J.; Pereira, G.; Guimarães, L.; Duarte, J.; Victor, L.; Baldin, C.; Inacio, C.; Santos, R.; Chaves, Ú.; Nunes, E.P.; et al. Liver stiffness regression after sustained virological response by direct-acting antivirals reduces the risk of outcomes. Sci. Rep. 2021, 11, 11681. [Google Scholar] [CrossRef] [PubMed]
- Hsu, W.-F.; Lai, H.-C.; Su, W.-P.; Lin, C.-H.; Chuang, P.-H.; Chen, S.-H.; Chen, H.Y.; Wang, H.W.; Huang, G.T.; Peng, C.Y. Rapid decline of noninvasive fibrosis index values in patients with hepatitis C receiving treatment with direct-acting antiviral agents. BMC Gastroenterol. 2019, 19, 63. [Google Scholar] [CrossRef] [PubMed]
- Holmberg, S.D.; Lu, M.; Rupp, L.B.; Lamerato, L.E.; Moorman, A.C.; Vijayadeva, V.; Boscarino, J.A.; Henkle, E.M.; Gordon, S.C.; Chronic Hepatitis Cohort Study (CHeCS) Investigators. Noninvasive Serum Fibrosis Markers for Screening and Staging Chronic Hepatitis C Virus Patients in a Large US Cohort. Clin. Infect. Dis. 2013, 57, 240–246. [Google Scholar] [CrossRef]
- Li, J.; Gordon, S.C.; Rupp, L.B.; Zhang, T.; Boscarino, J.A.; Vijayadeva, V.; Schmidt, M.A.; Lu, M.; Chronic Hepatitis Cohort Study (CHeCS) Investigators. The validity of serum markers for fibrosis staging in chronic hepatitis B and C. J. Viral Hepat. 2014, 21, 930–937. [Google Scholar] [CrossRef]
- Axley, P.; Ahmed, Z.; Ravi, S.; Singal, A.K. Hepatitis C Virus and Hepatocellular Carcinoma: A Narrative Review. J. Clin. Transl. Hepatol. 2018, 6, 79–84. [Google Scholar] [CrossRef]
- Kozbial, K.; Moser, S.; Schwarzer, R.; Laferl, H.; Al-Zoairy, R.; Stauber, R.; Stättermayer, A.F.; Beinhardt, S.; Graziadei, I.; Freissmuth, C.; et al. Unexpected high incidence of hepatocellular carcinoma in cirrhotic patients with sustained virologic response following interferon-free direct-acting antiviral treatment. J. Hepatol. 2016, 65, 856–858. [Google Scholar] [CrossRef]
- Waziry, R.; Hajarizadeh, B.; Grebely, J.; Amin, J.; Law, M.; Danta, M.; George, J.; Dore, G.J. Hepatocellular carcinoma risk following direct-acting antiviral HCV therapy: A systematic review, meta-analyses, and meta-regression. J Hepatol. 2017, 67, 1204–1212. [Google Scholar] [CrossRef]
- Mittal, S.; El-Serag, H.B.; Sada, Y.H.; Kanwal, F.; Duan, Z.; Temple, S.; May, S.B.; Kramer, J.R.; Richardson, P.A.; Davila, J.A. Hepatocellular Carcinoma in the Absence of Cirrhosis in United States Veterans Is Associated With Nonalcoholic Fatty Liver Disease. Clin. Gastroenterol. Hepatol. 2016, 14, 124–131.e1. [Google Scholar] [CrossRef] [PubMed]
- Ioannou, G.N.; Beste, L.A.; Green, P.K.; Singal, A.G.; Tapper, E.B.; Waljee, A.K.; Sterling, R.K.; Feld, J.J.; Kaplan, D.E.; Taddei, T.H.; et al. Increased Risk for Hepatocellular Carcinoma Persists Up to 10 Years After HCV Eradication in Patients with Baseline Cirrhosis or High FIB-4 Scores. Gastroenterology 2019, 157, 1264–1278.e4. [Google Scholar] [CrossRef] [PubMed]
- Flisiak, R.; Zarębska-Michaluk, D.; Janczewska, E.; Łapiński, T.; Rogalska, M.; Karpińska, E.; Mikuła, T.; Bolewska, B.; Białkowska, J.; Flejscher-Stępniewska, K.; et al. Five-Year Follow-Up of Cured HCV Patients under Real-World Interferon-Free Therapy. Cancers 2021, 13, 3694. [Google Scholar] [CrossRef] [PubMed]
- Sise, M.E.; Chute, D.F.; Oppong, Y.; Davis, M.I.; Long, J.D.; Silva, S.T.; Rusibamayila, N.; Jean-Francois, D.; Raji, S.; Zhao, S.; et al. Direct-acting antiviral therapy slows kidney function decline in patients with Hepatitis C virus infection and chronic kidney disease. Kidney Int. 2020, 97, 193–201. [Google Scholar] [CrossRef]
- Huang, C.-F.; Tseng, K.-C.; Cheng, P.-N.; Hung, C.-H.; Lo, C.-C.; Peng, C.-Y.; Bair, M.J.; Yeh, M.L.; Chen, C.H.; Lee, P.L.; et al. Impact of Sofosbuvir-Based Direct-Acting Antivirals on Renal Function in Chronic Hepatitis C Patients With Impaired Renal Function: A Large Cohort Study From the Nationwide HCV Registry Program (TACR). Clin. Gastroenterol. Hepatol. 2022, 20, 1151–1162.e6. [Google Scholar] [CrossRef]
- Potthoff, A.; Berg, T.; Wedemeyer, H. Late hepatitis B virus relapse in patients co-infected with hepatitis B virus and hepatitis C virus after antiviral treatment with pegylated interferon-a2b and ribavirin. Scand. J. Gastroenterol. 2009, 44, 1487–1490. [Google Scholar] [CrossRef]
- Wang, C.; Ji, D.; Chen, J.; Shao, Q.; Li, B.; Liu, J.; Wu, V.; Wong, A.; Wang, Y.; Zhang, X.; et al. Hepatitis due to Reactivation of Hepatitis B Virus in Endemic Areas Among Patients With Hepatitis C Treated With Direct-acting Antiviral Agents. Clin. Gastroenterol. Hepatol. 2017, 15, 132–136. [Google Scholar] [CrossRef]
- Haas, M.; Sis, B.; Racusen, L.C.; Solez, K.; Glotz, D.; Colvin, R.B.; Castro, M.C.; David, D.S.; David-Neto, E.; Bagnasco, S.M.; et al. Banff 2013 Meeting Report: Inclusion of C4d-Negative Antibody-Mediated Rejection and Antibody-Associated Arterial Lesions. Am. J. Transplant. 2014, 14, 272–283. [Google Scholar] [CrossRef]
- Pawlotsky, J.M.; Negro, F.; Aghemo, A.; Berenguer, M.; Dalgard, O.; Dusheiko, G.; Marra, F.; Puoti, M.; Wedemeyer, H. EASL Recommendations on Treatment of Hepatitis C 2018. J. Hepatol. 2018, 69, 461–511. [Google Scholar] [CrossRef]
- Halota, W.; Flisiak, R.; Juszczyk, J.; Małkowski, P.; Pawłowska, M.; Simon, K.; Tomasiewicz, K. Recommendations by Polish Group of Experts for HCV for the treatment of viral hepatitis C in 2018. Hepatologia 2018, 18, 1–9. [Google Scholar] [CrossRef]
- Castéra, L.; Vergniol, J.; Foucher, J.; Le Bail, B.; Chanteloup, E.; Haaser, M.; Darriet, M.; Couzigou, P.; De Lédinghen, V. Prospective comparison of transient elastography, Fibrotest, APRI, and liver biopsy for the assessment of fibrosis in chronic hepatitis C. Gastroenterology 2005, 128, 343–350. [Google Scholar] [CrossRef] [PubMed]
- Wai, C. A simple noninvasive index can predict both significant fibrosis and cirrhosis in patients with chronic hepatitis C. Hepatology 2003, 38, 518–526. [Google Scholar] [CrossRef] [PubMed]
- Vallet-Pichard, A.; Mallet, V.; Nalpas, B.; Verkarre, V.; Nalpas, A.; Dhalluin-Venier, V.; Fontaine, H.; Pol, S. FIB-4: An inexpensive and accurate marker of fibrosis in HCV infection. comparison with liver biopsy and fibrotest. Hepatology 2007, 46, 32–36. [Google Scholar] [CrossRef] [PubMed]
- Lybeck, C.; Brenndörfer, E.D.; Sällberg, M.; Montgomery, S.M.; Aleman, S.; Duberg, A.-S. Long-term follow-up after cure from chronic hepatitis C virus infection shows occult hepatitis and a risk of hepatocellular carcinoma in noncirrhotic patients. Eur. J. Gastroenterol. Hepatol. 2019, 31, 506–513. [Google Scholar] [CrossRef] [PubMed]
- Facciorusso, A.; Del Prete, V.; Turco, A.; Buccino, R.V.; Nacchiero, M.C.; Muscatiello, N. Long-term liver stiffness assessment in hepatitis C virus patients undergoing antiviral therapy: Results from a 5-year cohort study. J. Gastroenterol. Hepatol. 2018, 33, 942–949. [Google Scholar] [CrossRef]
- Castillo, I.; Bartolomé, J.; Quiroga, J.A.; Barril, G.; Carreño, V. Diagnosis of occult hepatitis C without the need for a liver biopsy. J. Med. Virol. 2010, 82, 1554–1559. [Google Scholar] [CrossRef]
- Lim, E.J.; Chin, R.; Nachbur, U.; Silke, J.; Jia, Z.; Angus, P.W.; Torresi, J. Effect of Immunosuppressive Agents on Hepatocyte Apoptosis Post-Liver Transplantation. PLoS ONE. 2015, 10, e0138522. [Google Scholar] [CrossRef]
- Frizell, E.; Abraham, A.; Doolittle, M.; Bashey, R.; Kresina, T.; Van Thiel, D.; Zern, M.A. FK506 Enhances fibrogenesis in in vitro and in vivo models of liver fibrosis in rats. Gastroenterology 1994, 107, 492–498. [Google Scholar] [CrossRef]
- Berenguer, M.; Schuppan, D. Progression of liver fibrosis in post-transplant hepatitis C: Mechanisms, assessment and treatment. J. Hepatol. 2013, 58, 1028–1041. [Google Scholar] [CrossRef]
- Elsharkawy, A.; Samir, R.; El-Kassas, M. Fibrosis regression following hepatitis C antiviral therapy. World J. Hepatol. 2022, 14, 1120–1130. [Google Scholar] [CrossRef]
- Cheng, C.-H.; Chu, C.-Y.; Chen, H.-L.; Lin, I.T.; Wu, C.H.; Lee, Y.K.; Hu, P.J.; Bair, M.J. Direct-acting antiviral therapy of chronic hepatitis C improves liver fibrosis, assessed by histological examination and laboratory markers. J. Formos. Med. Assoc. 2021, 120, 1259–1268. [Google Scholar] [CrossRef] [PubMed]
- Przekop, D.; Klapaczynski, J.; Grytczuk, A.; Gruszewska, E.; Gietka, A.; Panasiuk, A.; Golaszewski, S.; Cylwik, B.; Chrostek, L. Non-Invasive Indirect Markers of Liver Fibrosis after Interferon-Free Treatment for Hepatitis C. J. Clin. Med. 2021, 10, 3951. [Google Scholar] [CrossRef] [PubMed]
- Kim, W.R.; Berg, T.; Asselah, T.; Flisiak, R.; Fung, S.; Gordon, S.C.; Janssen, H.L.; Lampertico, P.; Lau, D.; Bornstein, J.D.; et al. Evaluation of APRI and FIB-4 scoring systems for non-invasive assessment of hepatic fibrosis in chronic hepatitis B patients. J. Hepatol. 2016, 64, 773–780. [Google Scholar] [CrossRef]
- Sulkowski, M.; Telep, L.E.; Colombo, M.; Durand, F.; Reddy, K.R.; Lawitz, E.; Bourlière, M.; Cheinquer, N.; Scherbakovsky, S.; Ni, L.; et al. Sofosbuvir and risk of estimated glomerular filtration rate decline or end-stage renal disease in patients with renal impairment. Aliment. Pharmacol. Ther. 2022, 55, 1169–1178. [Google Scholar] [CrossRef] [PubMed]
- Saxena, V.; Koraishy, F.M.; Sise, M.E.; Lim, J.K.; Schmidt, M.; Chung, R.T.; Liapakis, A.; Nelson, D.R.; Fried, M.W.; Terrault, N.A.; et al. Safety and efficacy of sofosbuvir-containing regimens in hepatitis C-infected patients with impaired renal function. Liver Int. 2016, 36, 807–816. [Google Scholar] [CrossRef] [PubMed]
- Medeiros, T.; Rosário, N.F.; Saraiva, G.N.; Andrade, T.G.; Silva, A.A.; Almeida, J.R. Renal safety after one year of sofosbuvir-based therapy for chronic hepatitis C: A Brazilian “real-life” study. J. Clin. Pharm. Ther. 2018, 43, 707–713. [Google Scholar] [CrossRef]
- Liu, C.-H.; Lee, M.-H.; Lin, J.-W.; Liu, C.-J.; Su, T.-H.; Tseng, T.-C.; Chen, P.J.; Chen, D.S.; Kao, J.H. Evolution of eGFR in chronic HCV patients receiving sofosbuvir-based or sofosbuvir-free direct-acting antivirals. J. Hepatol. 2020, 72, 839–846. [Google Scholar] [CrossRef]
- Tronina, O. Real-world direct-acting antiviral treatment in kidney transplant and hemodialysis patients: The EpiTer-2 multicenter observational study. Ann. Gastroenterol. 2021, 34, 438–446. [Google Scholar] [CrossRef]
- Driedger, M.; Galanakis, C.; Cooper, C. Direct acting antiviral HCV treatment does not influence renal function. Medicine 2020, 99, e20436. [Google Scholar] [CrossRef]
- Poggio, E.D.; Augustine, J.J.; Arrigain, S.; Brennan, D.C.; Schold, J.D. Long-term kidney transplant graft survival—Making progress when most needed. Am. J. Transplant. 2021, 21, 2824–2832. [Google Scholar] [CrossRef]
- Sawinski, D.; Kaur, N.; Ajeti, A.; Trofe-Clark, J.; Lim, M.; Bleicher, M.; Goral, S.; Forde, K.A.; Bloom, R.D. Successful Treatment of Hepatitis C in Renal Transplant Recipients with Direct-Acting Antiviral Agents. Am. J. Transplant. 2016, 16, 1588–1595. [Google Scholar] [CrossRef] [PubMed]


| Variable | N = 59 | |
|---|---|---|
| Sex | ||
| Male | N (%) | 37 (62.7) |
| Female | N (%) | 22 (37.3) |
| Age, years | Mean (SD) | 48.8 (13.1) |
| Concomitant disease | ||
| Hypertension | N (%) | 51 (86.4) |
| Diabetes | N (%) | 21 (35.6) |
| Dyslipidemia | N (%) | 32 (54.2) |
| Number of Ktx | ||
| 1 | N (%) | 26 (44.1) |
| 2 | N (%) | 18 (30.5) |
| 3 | N (%) | 7 (11.9) |
| Genotype | ||
| 1a | N (%) | 2 (3.4) |
| 1b | N (%) | 38 (64.4) |
| 3 | N (%) | 5 (8.5) |
| 4 | N (%) | 14 (23.7) |
| HCV viral load | Median (IQR) | 1.97 × 10⁶ (3.22 × 10⁶) |
| Treatment status | ||
| Experienced | N (%) | 12 (20.3) |
| Naive | N (%) | 47 (79.7) |
| DAA therapy used | ||
| Ombitasvir/parytaprevir/rytonavir | N (%) | 14 (23.7) |
| Ledipasvir/sofosbuvir | N (%) | 31 (52.5) |
| Glecaprevir/pibrentasvir | N (%) | 3 (5.1) |
| Elbasvir/grazoprevir | N (%) | 11 (18.6) |
| RBV | N (%) | 45 (76.2) |
| Treatment duration | ||
| 8 weeks | N (%) | 2 (3.4) |
| 12 weeks | N (%) | 49 (83.0) |
| 16 weeks | N (%) | 2 (3.4) |
| 24 weeks | N (%) | 6 (10.2) |
| Immunosuppression | ||
| CNI | N (%) | 48 (81.4) |
| MMF | N (%) | 45 (76.3) |
| GKS | N (%) | 53 (89.9) |
| Time since Ktx and DAAs, years | Mean (SD) | 11.18 (7.49) |
| BMI, kg/m2 | Mean (SD) | 24.2 (4.3) |
| Past HBV infection | ||
| Yes | N (%) | 23 (39.0) |
| No | N (%) | 36 (61.0) |
| ESRD | ||
| Glomerulonephritis | N (%) | 24 (40.7) |
| Unknown etiology | N (%) | 7 (11.9) |
| Hypertension | N (%) | 3 (5.1) |
| Diabetes | N (%) | 8 (13.6) |
| Vasculitis | N (%) | 1 (1.7) |
| Congenital urinary tract defect | N (%) | 6 (10.2) |
| Obstructive nephropathy | N (%) | 4 (6.8) |
| Chronic interstitial nephritis | N (%) | 4 (6.8) |
| HUS | N (%) | 2 (3.4) |
| Fibrosis | ||
| LS, kPa | Median (IQR) | 6.1 (3.75) |
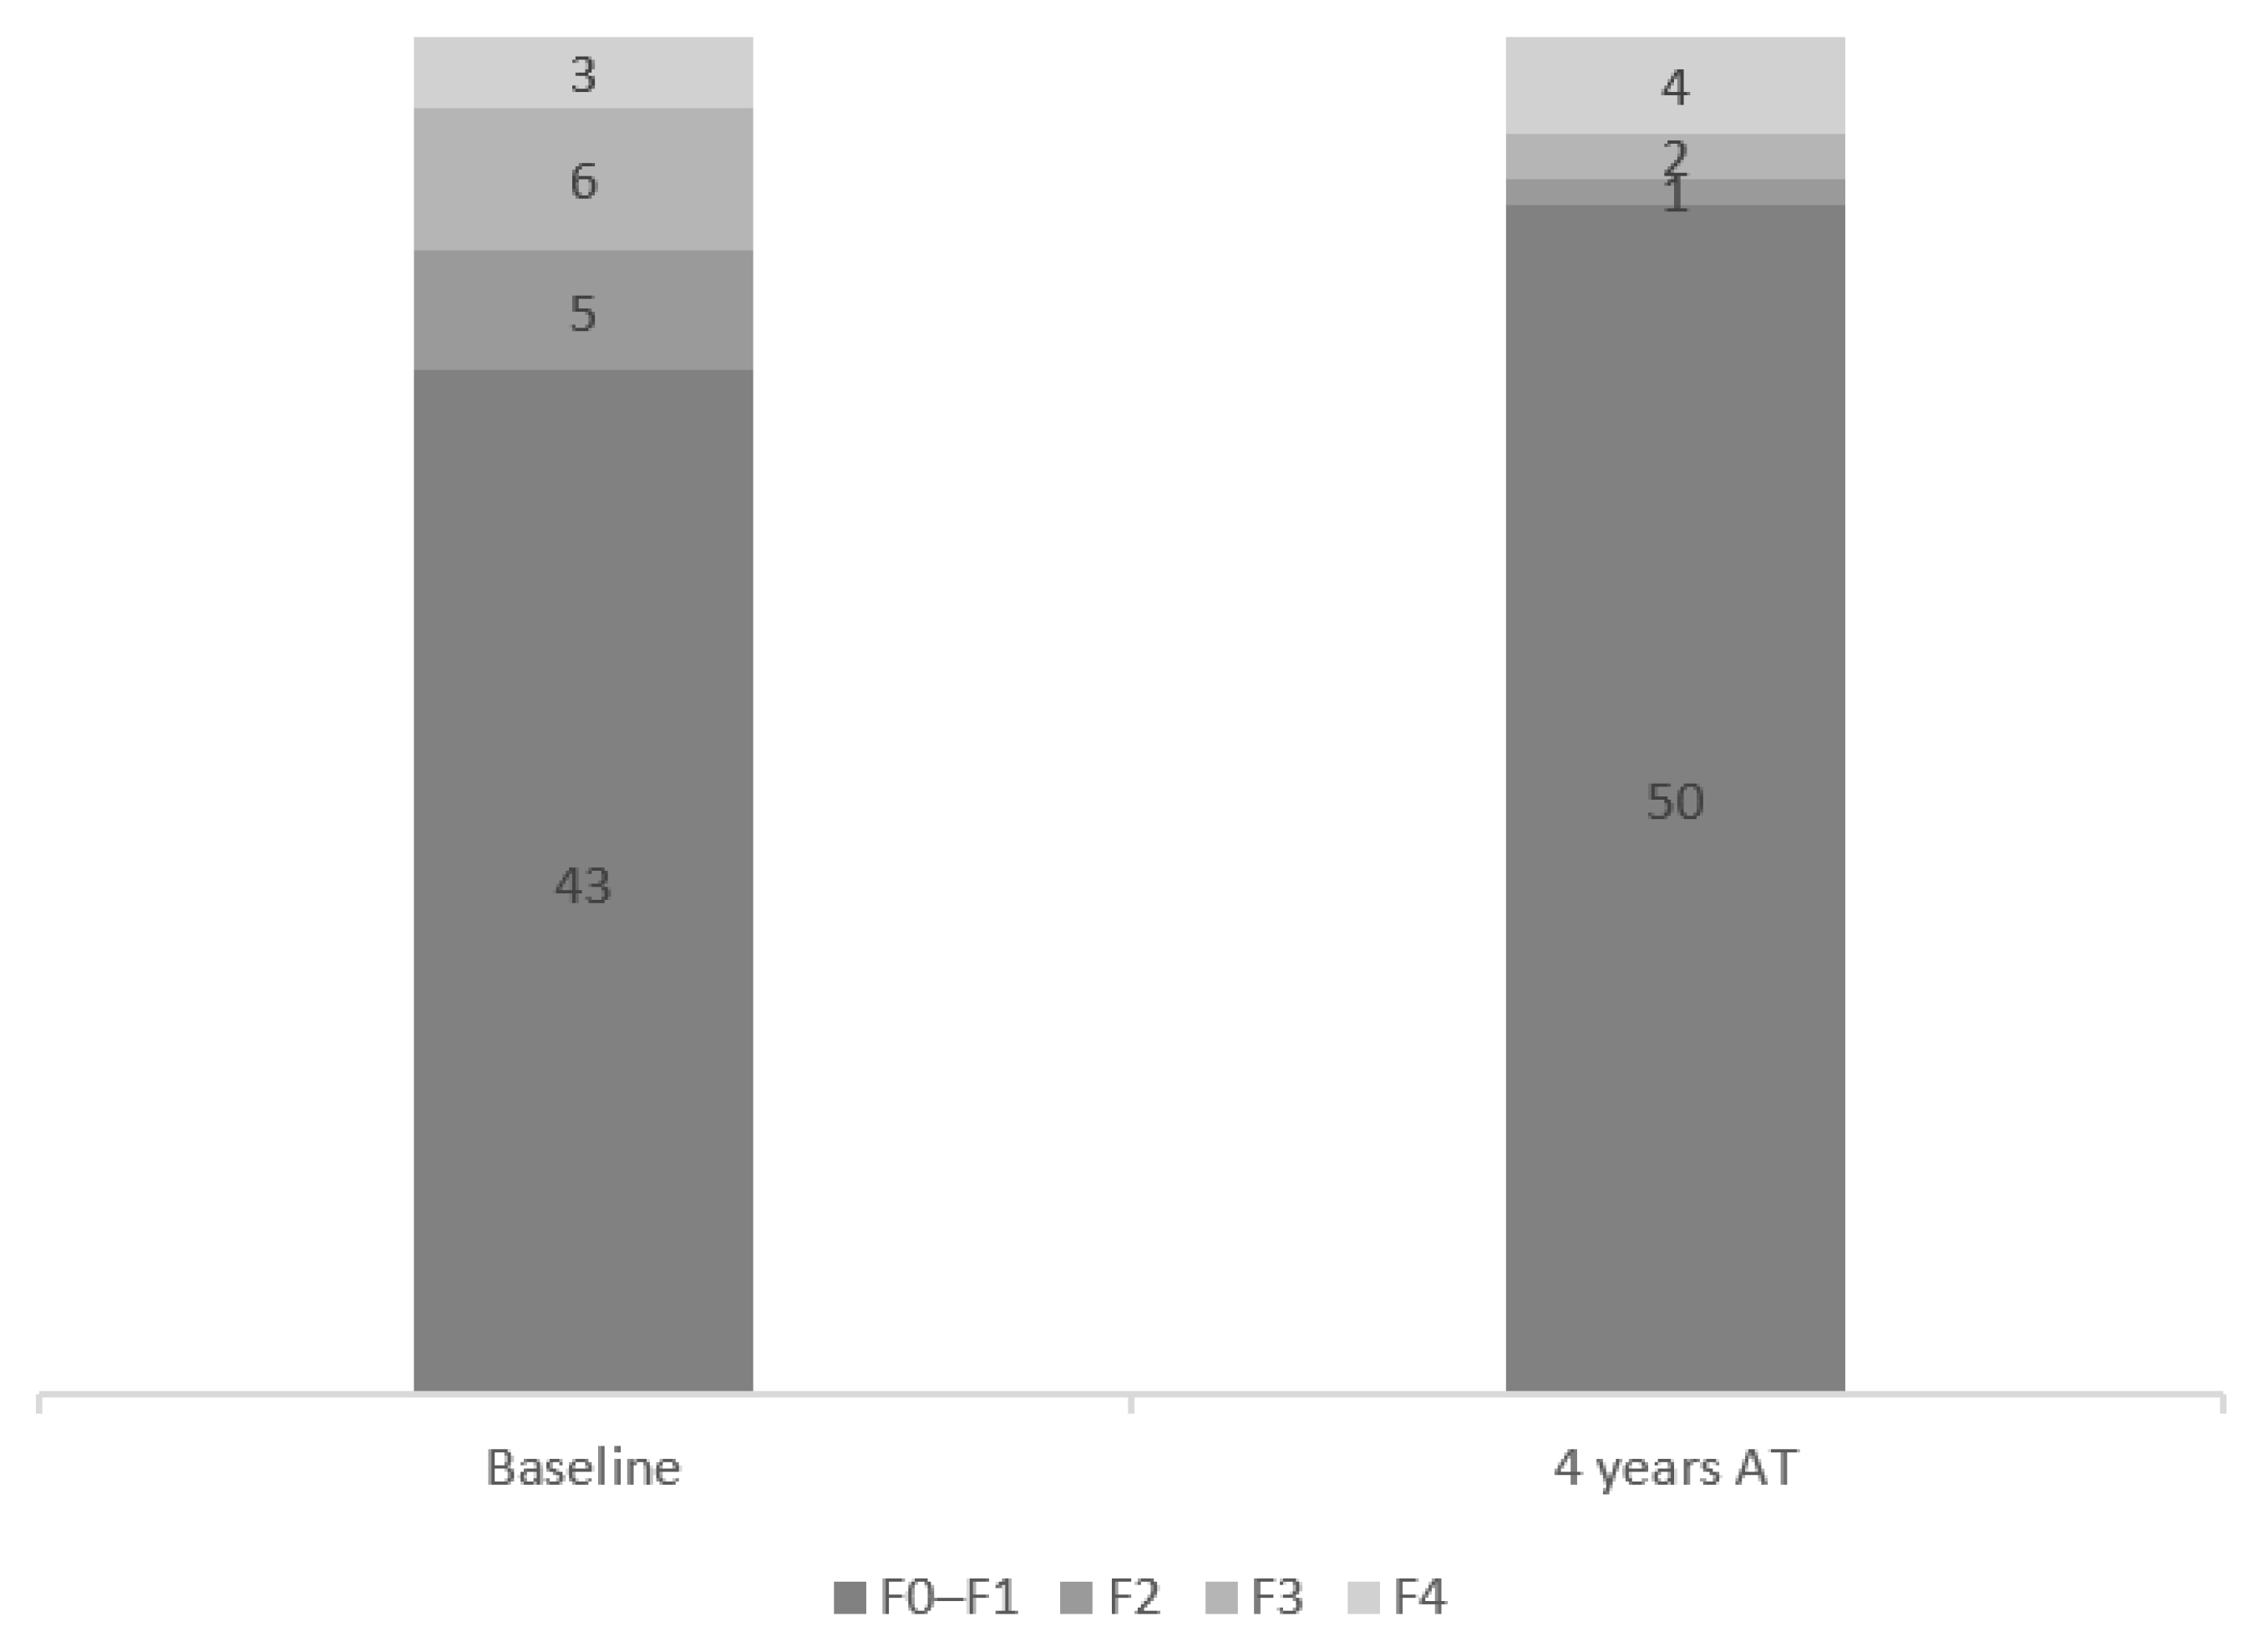
| F0–F1 | N (%) | 38 (64.4) |
| F2 | N (%) | 10 (16.9) |
| F3 | N (%) | 6 (10.2) |
| F4 | N (%) | 5 (8.5) |
| FIB-4 | Median (IQR) | 1.33 (1.3) |
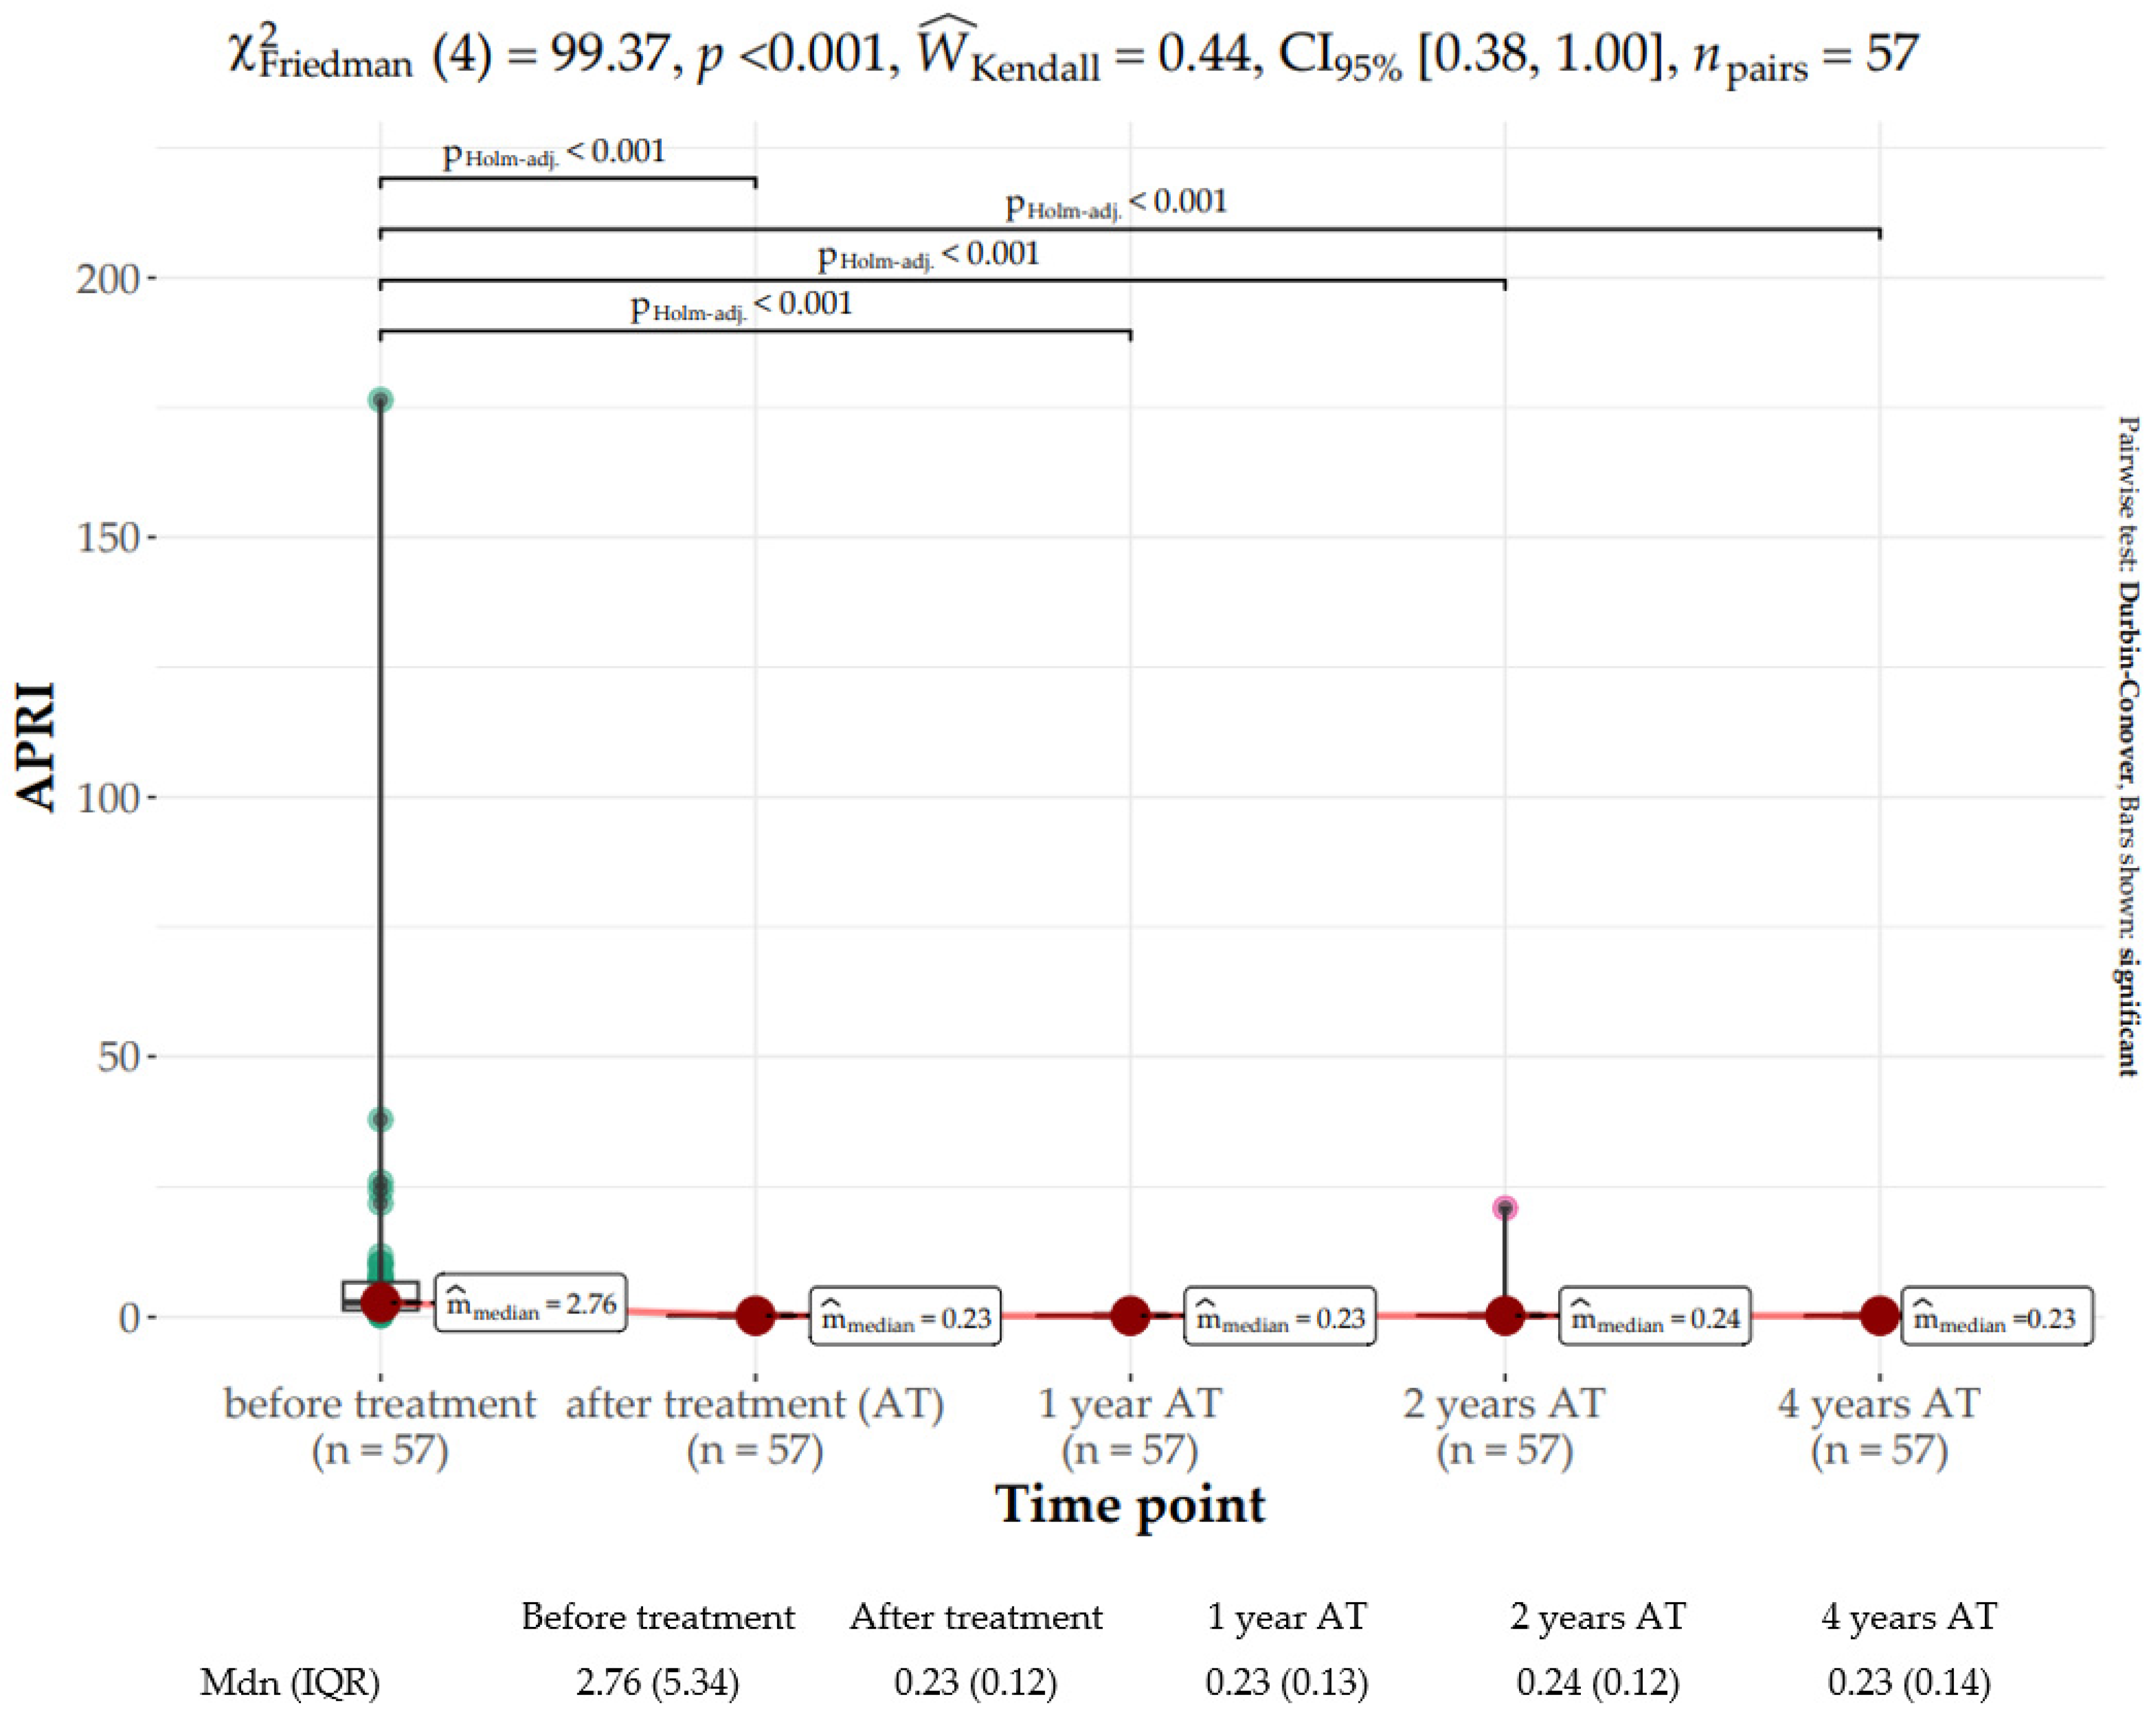
| APRI | Median (IQR) | 2.76 (5.36) |
| CAP, dB/m | Mean (SD) | 231.19 (44.0) |
| Variable | Before Treatment | After Treatment | 1 Year AT | 2 Years AT | 4 Years AT |
|---|---|---|---|---|---|
| ALT Mdn (IQR), U/I | 40.0 (40.0) | 20.0 (8.0) | 14.0 (9.0) | 15.0 (7.0) | 15 (9.0) |
| AST Mdn (IQR), U/I | 33.0 (24.0) | 19.0 (11.0) | 20.0 (7.0) | 19.0 (6.0) | 18.0 (8.0) |
| GGT Mdn (IQR), U/I | 61.0 (72.0) | 27.0 (27.0) | 24.0 (22.0) | 28.0 (23.0) | 26.0 (18.0) |
| Adverse Event | N = 59 | |
|---|---|---|
| Anemia | N (%) | 15 (25.4%) |
| Weakness | N (%) | 13 (22%) |
| Urinary tract infection | N (%) | 13 (22%) |
| Sterile leukocyturia | N (%) | 8 (13.6%) |
| Upper respiratory tract infection | N (%) | 7 (11.9%) |
| Headache | N (%) | 4 (6.8%) |
| Diarrhea | N (%) | 3 (5.1%) |
| Hypertransaminasemia | N (%) | 3 (5.1%) |
| Pneumonia | N (%) | 3 (5.1%) |
| Abdominal pain | N (%) | 2 (3.4%) |
| Ankle edema | N (%) | 2 (3.4%) |
| Worsening of blood pressure control | N (%) | 2 (3.4%) |
| Herpes | N (%) | 2 (3.4%) |
| Fatigue | N (%) | 2 (3.4%) |
| Worsening of exercise tolerance | N (%) | 1 (1.7%) |
| Bone pains | N (%) | 1 (1.7%) |
| Distal deep vein thrombosis | N (%) | 1 (1.7%) |
| Nausea | N (%) | 1 (1.7%) |
| Sleep disturbance | N (%) | 1 (1.7%) |
| Hematuria | N (%) | 1 (1.7%) |
| Weight loss | N (%) | 1 (1.7%) |
| Syncope | N (%) | 1 (1.7%) |
| Hyperkalemia | N (%) | 1 (1.7%) |
| Gout | N (%) | 1 (1.7%) |
| Sinusitis | N (%) | 1 (1.7%) |
| Hypotension | N (%) | 1 (1.7%) |
| Fistulae | N (%) | 1 (1.7%) |
| Atrial fibrillation | N (%) | 1 (1.7%) |
| Inflammatory fistula tumor | N (%) | 1 (1.7%) |
| Otitis | N (%) | 1 (1.7%) |
| Pruritus | N (%) | 1 (1.7%) |
Disclaimer/Publisher’s Note: The statements, opinions and data contained in all publications are solely those of the individual author(s) and contributor(s) and not of MDPI and/or the editor(s). MDPI and/or the editor(s) disclaim responsibility for any injury to people or property resulting from any ideas, methods, instructions or products referred to in the content. |
© 2023 by the authors. Licensee MDPI, Basel, Switzerland. This article is an open access article distributed under the terms and conditions of the Creative Commons Attribution (CC BY) license (https://creativecommons.org/licenses/by/4.0/).
Share and Cite
Czarnecka, P.; Czarnecka, K.; Tronina, O.; Bączkowska, T.; Wyczałkowska-Tomasik, A.; Durlik, M.; Czerwinska, K. Evaluation of Long-Term Outcomes of Direct Acting Antiviral Agents in Chronic Kidney Disease Subjects: A Single Center Cohort Study. J. Clin. Med. 2023, 12, 3513. https://doi.org/10.3390/jcm12103513
Czarnecka P, Czarnecka K, Tronina O, Bączkowska T, Wyczałkowska-Tomasik A, Durlik M, Czerwinska K. Evaluation of Long-Term Outcomes of Direct Acting Antiviral Agents in Chronic Kidney Disease Subjects: A Single Center Cohort Study. Journal of Clinical Medicine. 2023; 12(10):3513. https://doi.org/10.3390/jcm12103513
Chicago/Turabian StyleCzarnecka, Paulina, Kinga Czarnecka, Olga Tronina, Teresa Bączkowska, Aleksandra Wyczałkowska-Tomasik, Magdalena Durlik, and Katarzyna Czerwinska. 2023. "Evaluation of Long-Term Outcomes of Direct Acting Antiviral Agents in Chronic Kidney Disease Subjects: A Single Center Cohort Study" Journal of Clinical Medicine 12, no. 10: 3513. https://doi.org/10.3390/jcm12103513
APA StyleCzarnecka, P., Czarnecka, K., Tronina, O., Bączkowska, T., Wyczałkowska-Tomasik, A., Durlik, M., & Czerwinska, K. (2023). Evaluation of Long-Term Outcomes of Direct Acting Antiviral Agents in Chronic Kidney Disease Subjects: A Single Center Cohort Study. Journal of Clinical Medicine, 12(10), 3513. https://doi.org/10.3390/jcm12103513