
A Natural History of Erectile Dysfunction in Elderly Men: A Population-Based, Twelve-Year Prospective Study


Abstract
1. Purpose
2. Introduction
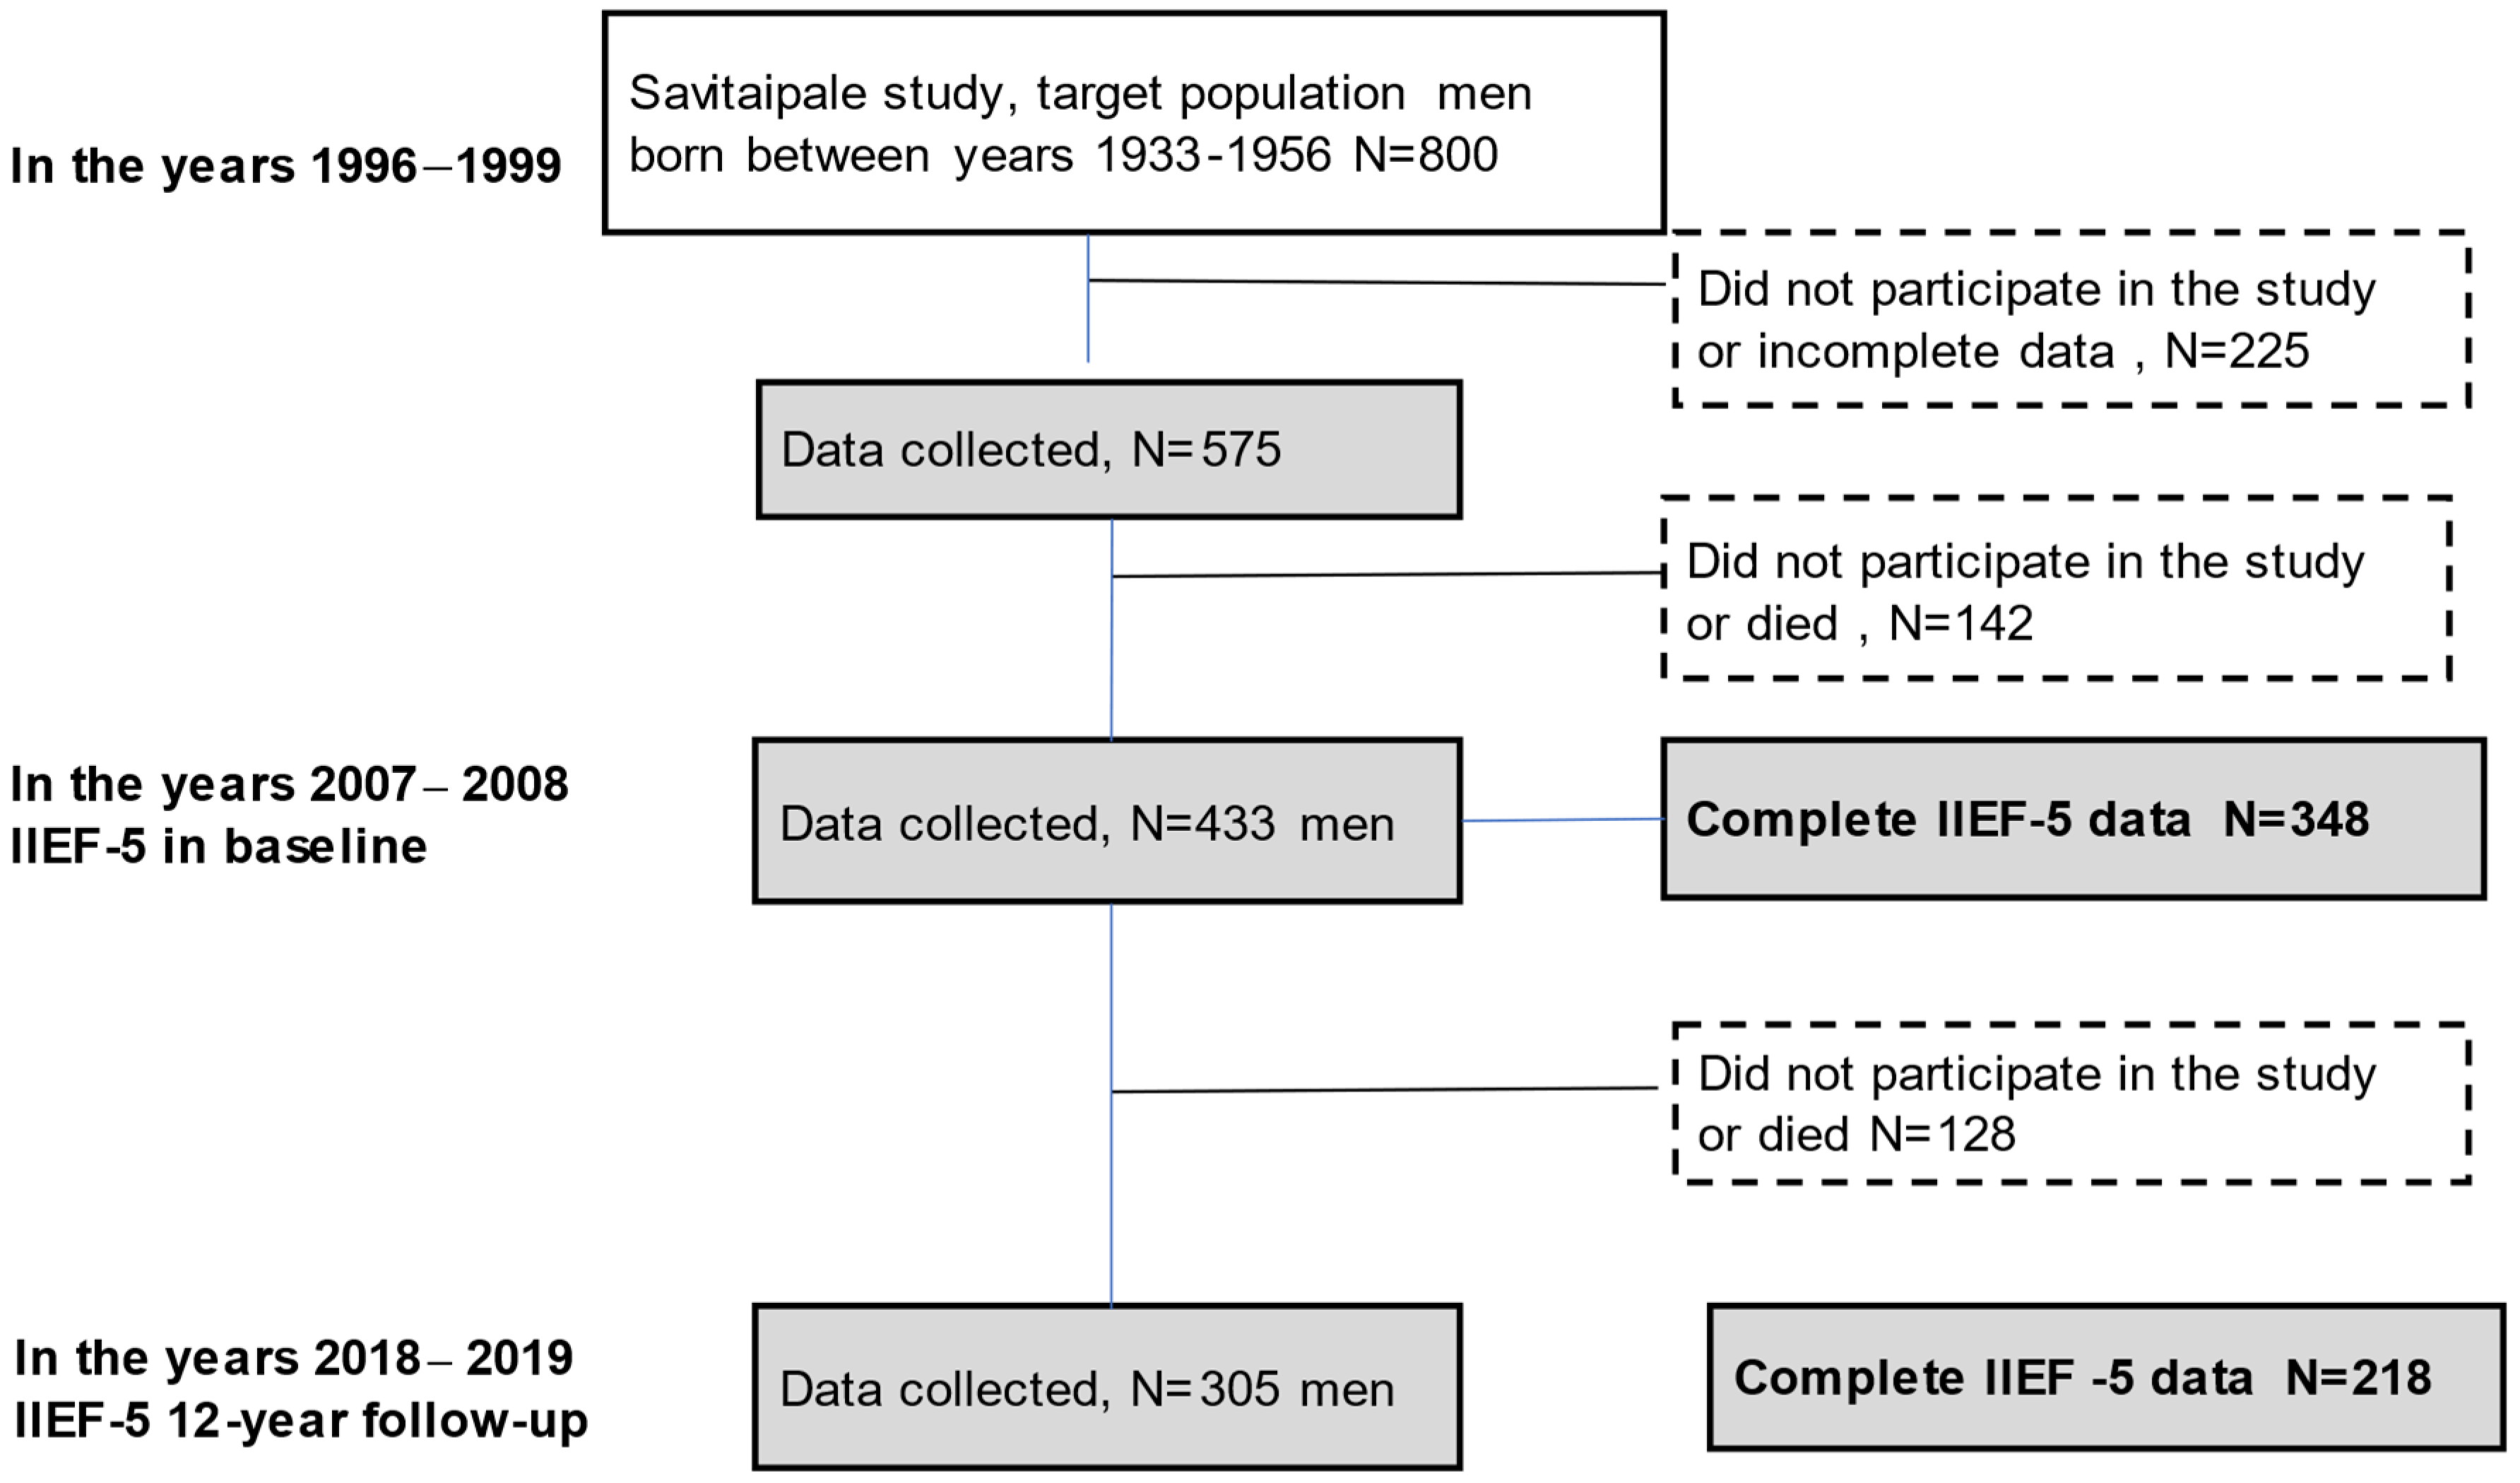
3. Materials and Methods
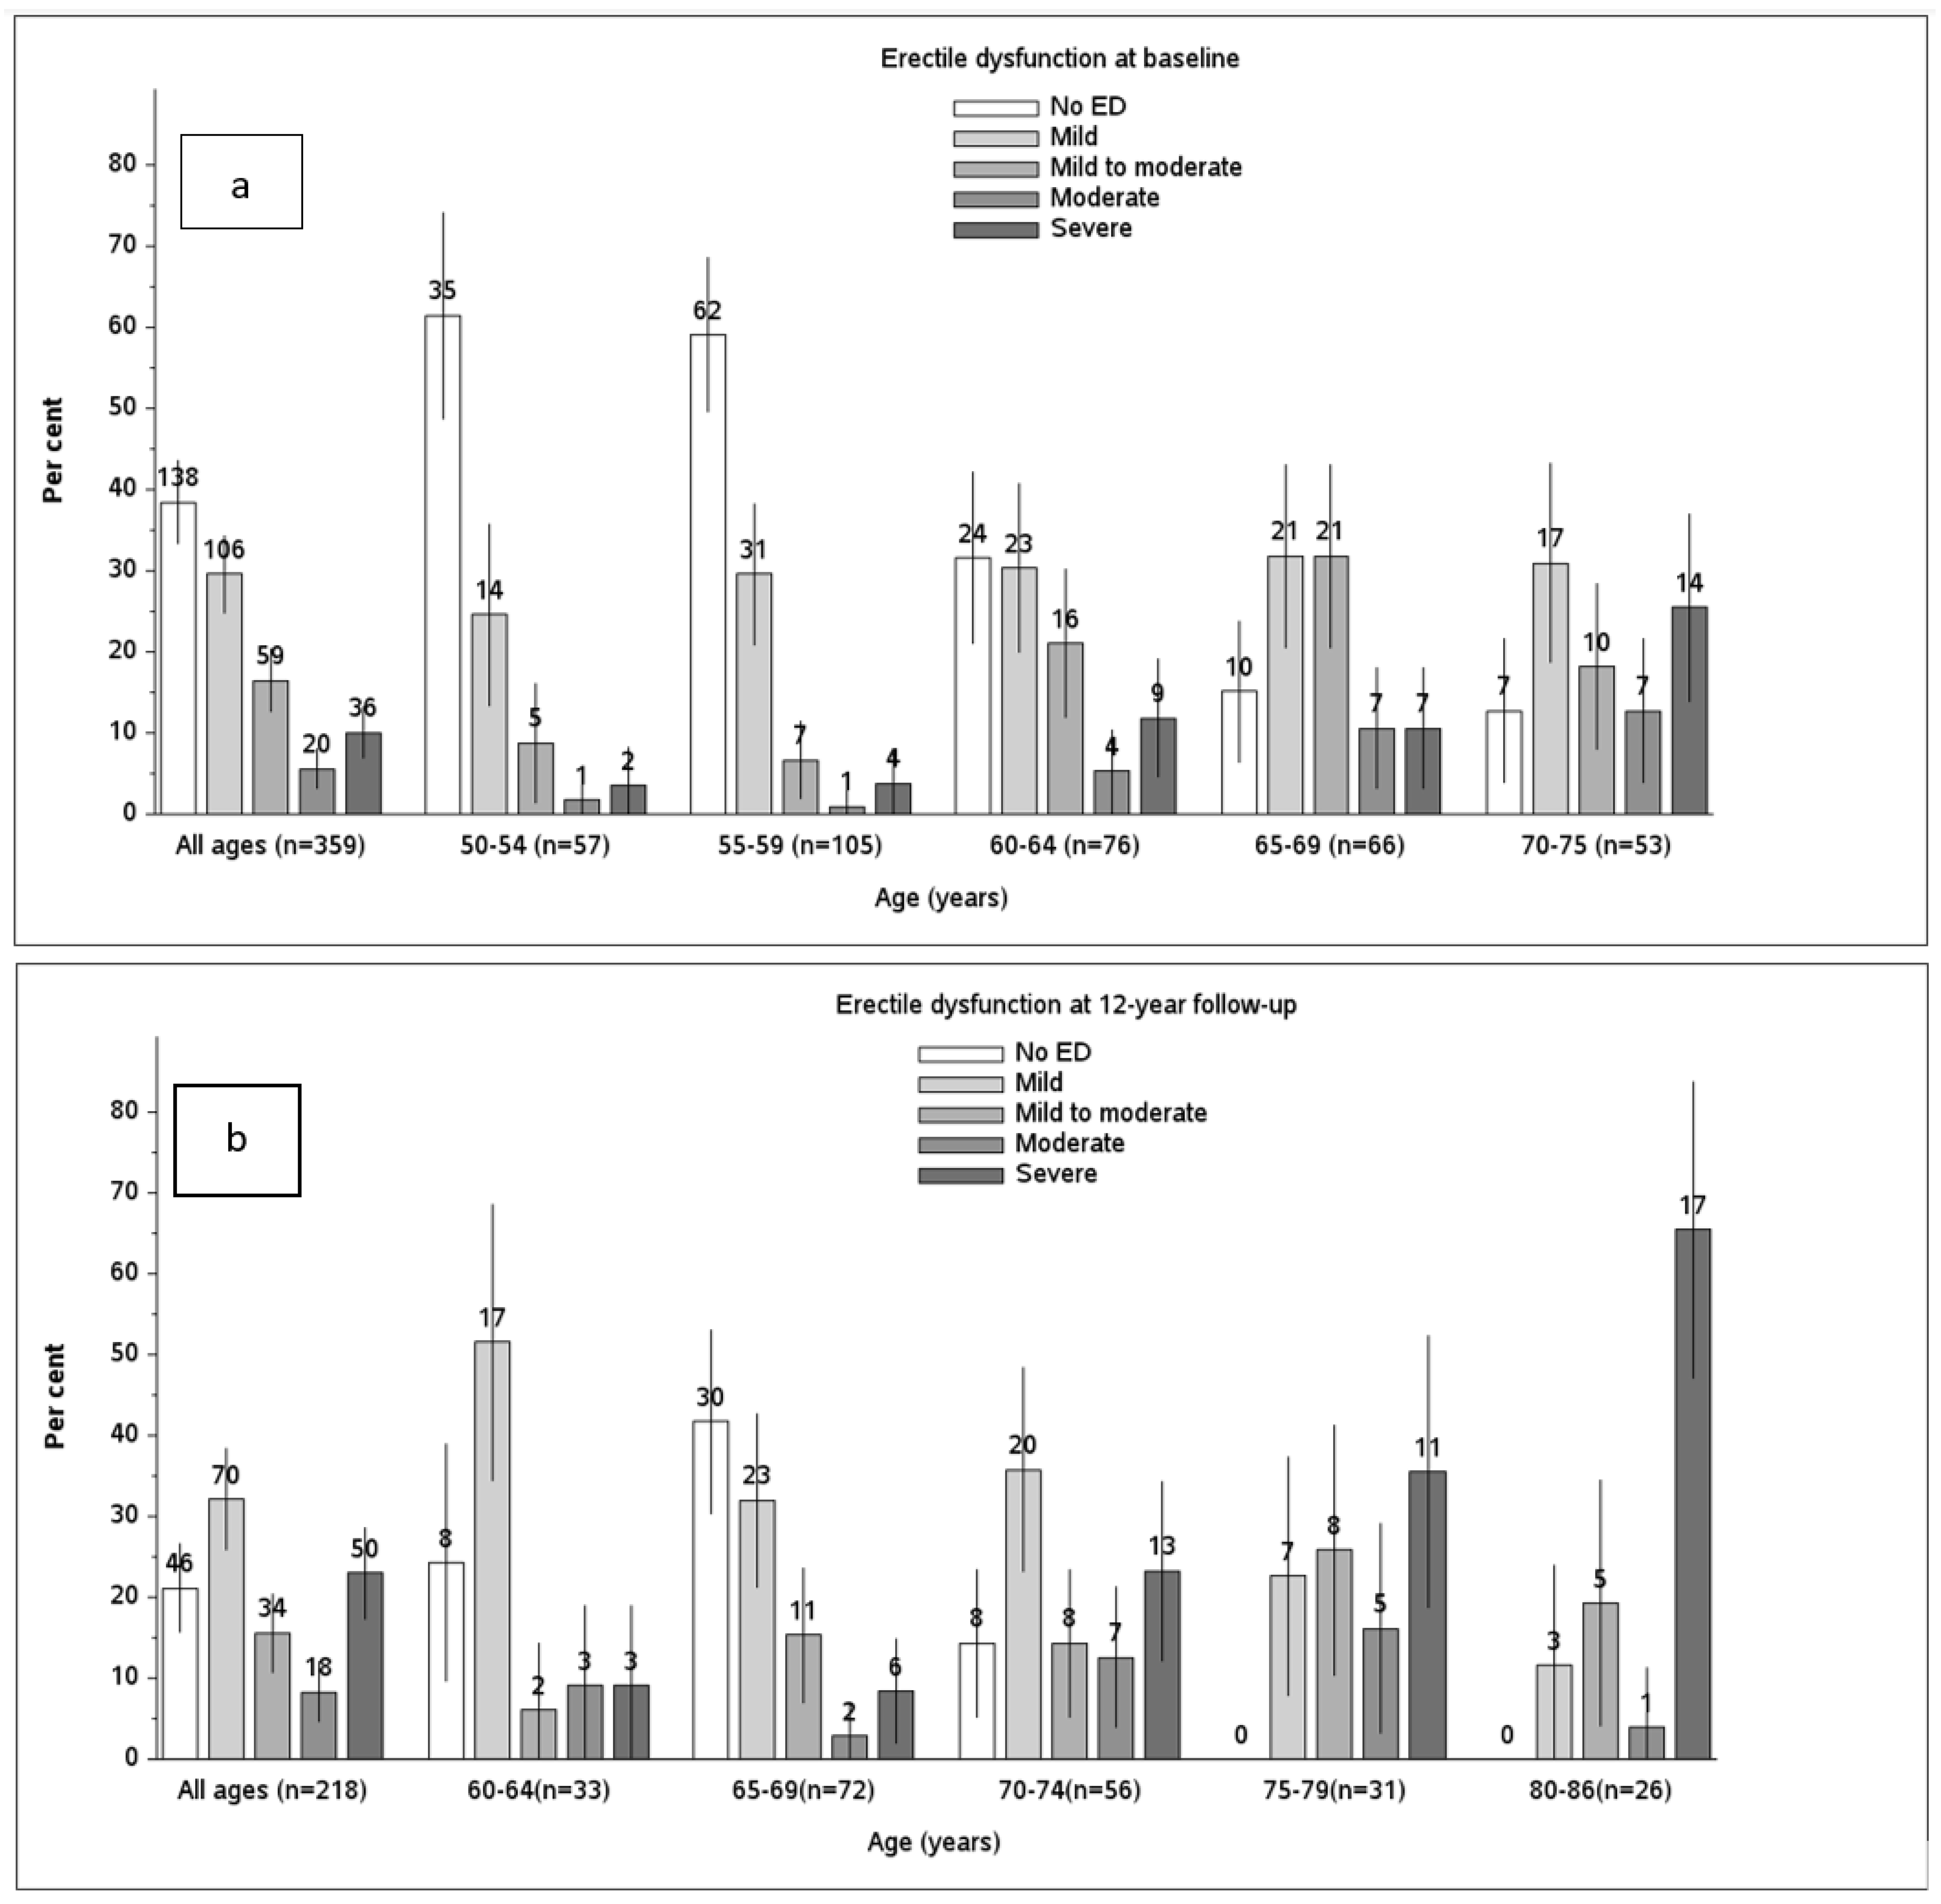
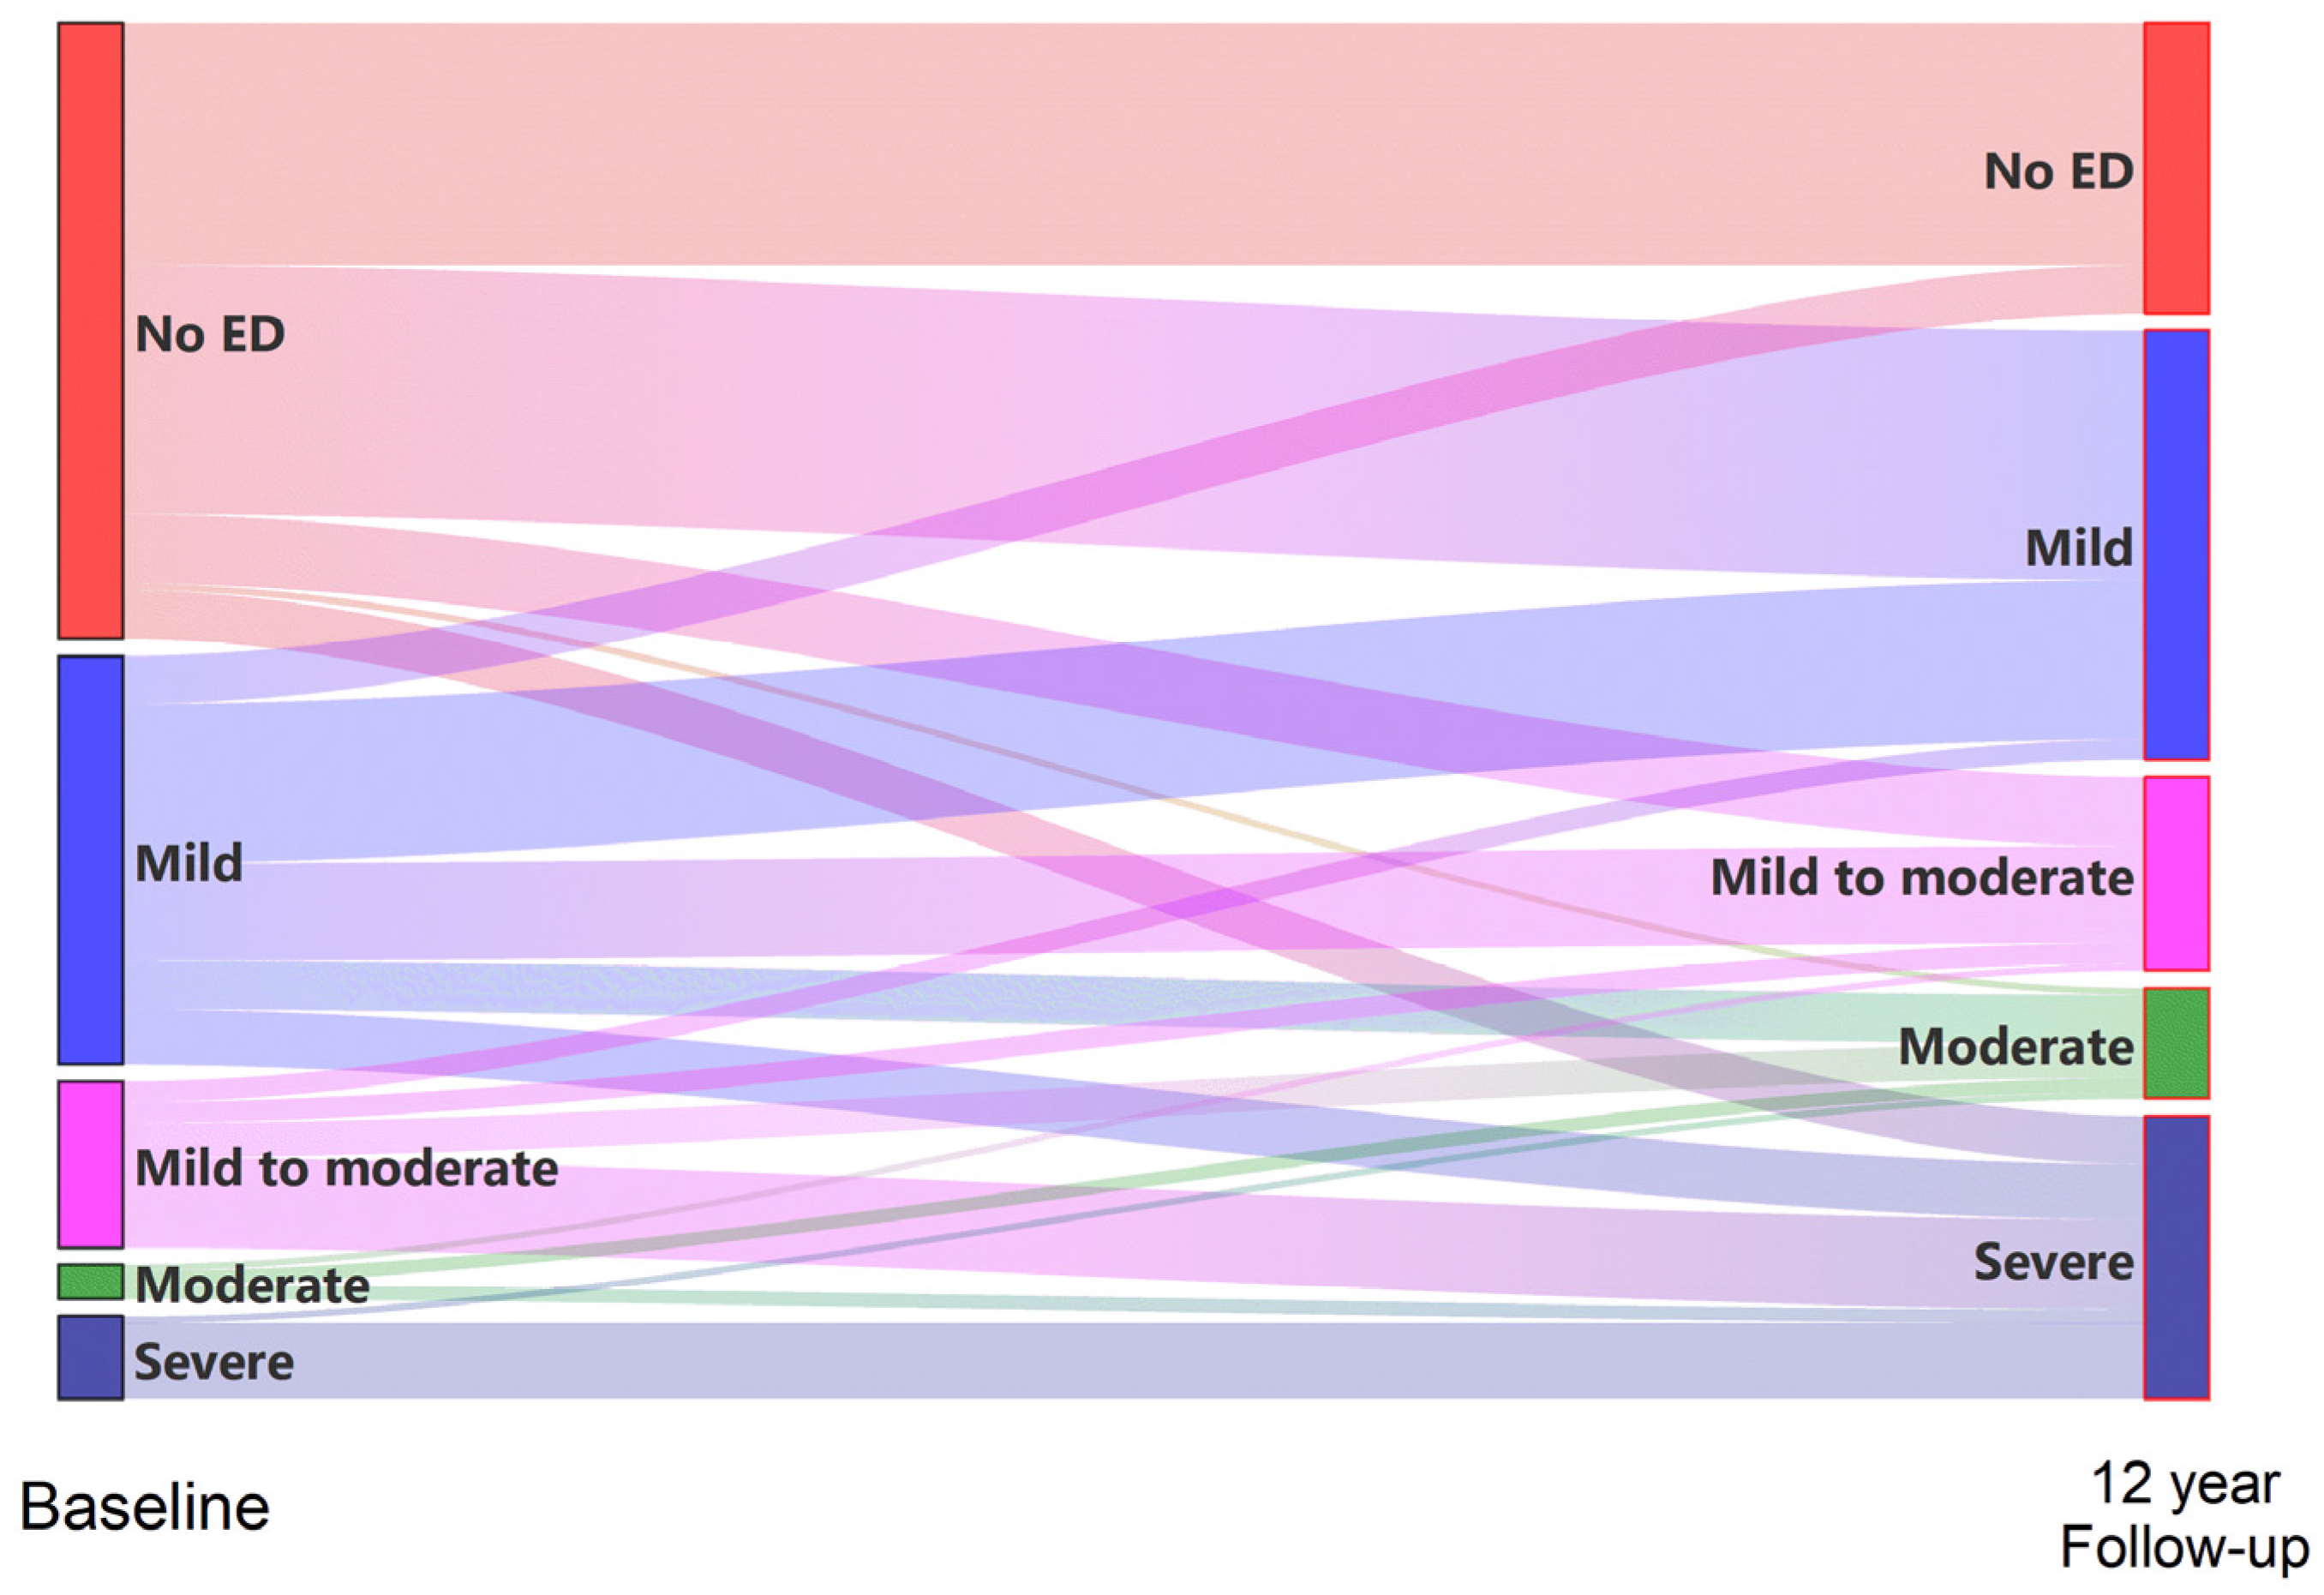
4. Results
5. Discussion
6. Conclusions
Author Contributions
Funding
Institutional Review Board Statement
Informed Consent Statement
Conflicts of Interest
References
- Shabsigh, R.; Perelman, M.A.; Lockhart, D.C.; Lue, T.F.; Broderick, G.A. Health issues of men: Prevalence and correlates of erectile dysfunction. J. Urol. 2005, 174, 662–667. [Google Scholar] [CrossRef] [Scilit]
- Dong, J.Y.; Zhang, Y.H.; Qin, L.Q. Erectile dysfunction and risk of cardiovascular disease: Meta-analysis of prospective cohort studies. J. Am. Coll. Cardiol. 2011, 58, 1378–1385. [Google Scholar] [CrossRef] [Scilit]
- Wang, X.Y.; Huang, W.; Zhang, Y. Relation between hypertension and erectile dysfunction: A meta-analysis of cross-section studies. Int. J. Impot. Res. 2018, 30, 141–146. [Google Scholar] [CrossRef] [Scilit]
- Kouidrat, Y.; Pizzol, D.; Cosco, T.; Thompson, T.; Carnaghi, M.; Bertoldo, A.; Solmi, M.; Stubbs, B.; Veronese, N. High prevalence of erectile dysfunction in diabetes: A systematic review and meta-analysis of 145 studies. Diabet. Med. 2017, 34, 1185–1192. [Google Scholar] [CrossRef] [Scilit]
- Araujo, A.B.; Durante, R.; Feldman, H.A.; Goldstein, I.; McKinlay, J.B. The relationship between depressive symptoms and male erectile dysfunction: Cross-sectional results from the Massachusetts Male Aging Study. Psychosom. Med. 1998, 60, 458–465. [Google Scholar] [CrossRef] [Scilit]
- Corona, G.; Rastrelli, G.; Filippi, S.; Vignozzi, L.; Mannucci, E.; Maggi, M. Erectile dysfunction and central obesity: An Italian perspective. Asian J. Androl. 2014, 16, 581–591. [Google Scholar]
- Wei, M.; Macera, C.A.; Davis, D.R.; Hornung, C.A.; Nankin, H.R.; Blair, S.N. Total cholesterol and high density lipoprotein cholesterol as important predictors of erectile dysfunction. Am. J. Epidemiol. 1994, 140, 930–937. [Google Scholar] [CrossRef] [Scilit]
- Ludwig, W.; Phillips, M. Organic causes of erectile dysfunction in men under. Urol. Int. 2014, 92, 1–6. [Google Scholar] [CrossRef] [Scilit]
- Janiszewski, P.M.; Janssen, I.; Ross, R. Abdominal obesity and physical inactivity are associated with erectile dysfunction independent of body mass index. J. Sex. Med. 2009, 6, 1990–1998. [Google Scholar] [CrossRef] [Scilit]
- Chen, L.; Shi, G.-R.; Huang, D.-D.; Li, Y.; Ma, C.-C.; Shi, M.; Su, B.-X. Male sexual dysfunction: A review of literature on its pathological mechanisms, potential risk factors, and herbal drug intervention. Biomed. Pharmacother. 2019, 112, 108585. [Google Scholar] [CrossRef] [Scilit]
- Schouten, B.W.V.; Bosch, J.L.H.R.; Bernsen, R.M.D. Incidence rates of erectile dysfunction in the Dutch general population. Effects of definition, clinical relevance and duration of follow-up in the Krimpen Study. Int. J. Impot. Res. 2005, 17, 58–62. [Google Scholar] [CrossRef] [Scilit]
- Travison, T.G.; Sand, M.S.; Rosen, R.C.; Shabsigh, R.; Eardley, I.; McKinlay, J.B. The natural progression and regression of erectile dysfunction: Follow-up results from the MMAS and MALES studies. J. Sex. Med. 2011, 8, 1917–1924. [Google Scholar] [CrossRef] [Scilit]
- Travison, T.G.; Shabsigh, R.; Araujo, A.B.; Kupelian, V.; O’Donnell, A.B.; McKinlay, J.B. The natural progression and remission of erectile dysfunction: Results from the Massachusetts male aging study. J. Urol. 2007, 177, 241–246. [Google Scholar] [CrossRef] [Scilit]
- McCulloch, D.K.; Young, R.J.; Prescott, R.J.; Campbell, I.W.; Clarke, B.F. The natural history of impotence in diabetic men. Diabetologia 1984, 26, 437–440. [Google Scholar] [CrossRef] [Scilit]
- Rosen, R.C.; Cappelleri, J.C.; Smith, M.D.; Lipsky, J.; Pen, B.M. Development and evaluation of an abridged, 5-item version of the International Index of Erectile Function (IIEF-5) as a diagnostic tool for erectile dysfunction. Int. J. Impot. Res. 1999, 11, 319–326. [Google Scholar] [CrossRef] [Scilit]
- Rhoden, E.L.; Telöken, C.; Sogari, P.R.; Vargas Souto, C.A. The use of the simplified International Index of Erectile Function (IIEF-5) as a diagnostic tool to study the prevalence of erectile dysfunction. Int. J. Impot. Res. 2002, 14, 245–250. [Google Scholar] [CrossRef] [Scilit]
- National Institutes of Health (NIH) Consensus Conference. Impotence. NIH Consensus Development Panel on Impotence. JAMA 1993, 270, 83–90. [Google Scholar] [CrossRef] [Scilit]
- Beck, A.T.; Ward, C.H.; Mendelson, M.; Mock, J.; Erbaugh, J. An inventory for measuring depression. Arch. Gen. Psychiatry 1961, 4, 561–571. [Google Scholar] [CrossRef] [Scilit]
- Saramies, J.; Koiranen, M.; Auvinen, J.; Uusitalo, H.; Hussi, E.; Cederberg, H.; Tuomilehto, J. 22-year trends in dysglycemia and body mass index: A population-based cohort study in Savitaipale, Finland. Prim. Care Diabetes 2021, 15, 977–984. [Google Scholar] [CrossRef] [Scilit]
- Chew, K.K.; Stuckey, B.; Bremner, A.; Earle, C.; Jamrozik, K. Male erectile dysfunction: Its prevalence in Western Australia and associated sociodemographic factors. J. Sex. Med. 2008, 5, 60–69. [Google Scholar] [CrossRef] [Scilit]
- Ahn, T.Y.; Park, J.K.; Lee, S.W.; Hong, J.H.; Park, N.C.; Kim, J.J.; Park, K.; Park, H.; Hyun, J.S. Prevalence and risk factors for erectile dysfunction in Korean men: Results of an epidemiological study. J. Sex. Med. 2007, 4, 1269–1276. [Google Scholar] [CrossRef] [Scilit]
- Eardley, I. The incidence, prevalence, and natural history of erectile dysfunction. Sex. Med. Rev. 2013, 1, 3–16. [Google Scholar] [CrossRef] [Scilit]
- Suija, K.; Kerkelä, M.; Rajala, U.; Jokelainen, J.; Laakso, M.; Härkönen, P.; Keinänen-Kiukaanniemi, S.; Timonen, M. The association between erectile dysfunction, depressive symptoms and testosterone levels among middle-aged men. Scand. J. Public Health 2014, 42, 677–682. [Google Scholar] [CrossRef] [Scilit]
- Sánchez-Cruz, J.J.; Cabrera-León, A.; Martín-Morales, A.; Fernández, A.; Burgos, R.; Rejas, J. Male Erectile Dysfunction and Health-Related Quality of Life. Eur. Urol. 2003, 44, 245–253. [Google Scholar] [CrossRef] [Scilit]
- Erens, B.; Mitchell, K.R.; Gibson, L.; Datta, J.; Lewis, R.; Field, N.; Wellings, K. Health status, sexual activity and satisfaction among older people in Britain: A mixed methods study. PLoS ONE 2019, 27, 14. [Google Scholar] [CrossRef] [Scilit]
- Corona, G.; Lee, D.M.; Forti, G.; O’Connor, D.B.; Maggi, M.; O’Neill, T.W. Age-related changes in general and sexual health in middle-aged and older men: Results from the European Male Ageing Study (EMAS). J. Sex. Med. 2010, 7, 1362–1380. [Google Scholar] [CrossRef] [Scilit]
- Koskimäki, J.; Shiri, R.; Tammela, T.; Häkkinen, J.; Hakama, M.; Auvinen, A. Regular Intercourse Protects Against Erectile Dysfunction: Tampere Aging Male Urologic Study. Am. J. Med. 2008, 121, 592–596. [Google Scholar] [CrossRef] [Scilit]
- Sharma, A.; Sharma, R.P. Erectile Dysfunction: The Male Stigma. Int. J. Surg. 2019, 5, 172–178. [Google Scholar] [CrossRef] [Scilit]
- Yafi, F.A.; Huynh, L.M.; Ahlering, T.; Rosen, R. What Is a "Validated Questionnaire"? A Critical Review of Erectile Function Assessment. J. Sex. Med. 2020, 17, 849–860. [Google Scholar] [CrossRef] [Scilit]



| Men Who Participated in the Baseline Study, N = 359 | Men Who Participated in the Follow-Up Study, N = 218 | Men Who Participated Both in the Baseline and Follow-Up Studies, N = 189 | Incidence ** N (%) *** p | |||||
|---|---|---|---|---|---|---|---|---|
| All | ED Prevalence | All | ED Prevalence | All | ED Prevalence at Baseline | ED Prevalence at Follow-up | ||
| N | % | N | % | N | N (%) | N (%) | ||
| Age group | * p ≤ 0.001 | * p < 0.001 | * p < 0.001 | * p ≤ 0.001 | ||||
| 50–54 | 57 | 38.6 | 46 | 16 (34.8) | 33 (71.7) | 17 (56.7) 0.581 | ||
| 55–59 | 105 | 41.0 | 60 | 24 (40.0) | 36 (60.0) | 19 (52.8) 0.209 | ||
| 60–64 | 76 | 68.4 | 33 | 75.8 | 42 | 25 (59.5) | 37 (88.1) | 12 (70.6) 0.352 |
| 65–69 | 66 | 84.8 | 72 | 58.3 | 25 | 21 (84.0) | 25 (100) | 4 (100.0) 0.099 |
| 70–74 | 55 | 87.3 | 56 | 85.7 | 16 | 14 (87.5) | 16 (100) | 2 (100.0) 0.250 |
| 75–79 | 31 | 100 | ||||||
| 80–86 | 26 | 100 | ||||||
| Total | 359 | 61.6 | 218 | 78.9 | 189 | 100(52.9) | 147(77.8) | 54 (60.7) |
| Education | * p = 0.01 | * p = 0.03 | * p = 0.005 | * p = 0.028 | ||||
| Higher | 19 | 42.1 | 23 | 56.5 | 19 | 8 (42.1) | 10 (52.6) | 3 (27.3) 0.024 |
| Vocational | 74 | 41.9 | 77 | 77.9 | 69 | 27 (39.1) | 52 (75.4) | 27 (64.3) 0.279 |
| Basic | 92 | 64.1 | 94 | 81.9 | 82 | 53 (64.6) | 67 (81.7) | 18 (62.1) 0.631 |
| Total | 185 | 53.0 | 194 | 77.3 | 170 | 88 (51.8) | 129 (75.9) | 48 (58.5) |
| Social class | * p = 0.81 | * p = 0.38 | * p = 0.78 | * p = 0.42 | ||||
| Upper | 55 | 60.0 | 60 | 75.0 | 49 | 28 (57.1) | 36 (73.5) | 11 (52.4) 0.491 |
| Upper middle | 18 | 50.0 | 20 | 65.0 | 18 | 9 (50.0) | 12(66.7) | 3 (33.3) 0.100 |
| Middle | 18 | 44.4 | 20 | 75.0 | 17 | 7 (41.2) | 12 (70.6) | 6 (60.0) 0.921 |
| Working | 56 | 53.6 | 56 | 80.4 | 52 | 27 (51.9) | 42 (80.8) | 17 (68.0) 0.233 |
| Other | 14 | 57 | 14 | 92.9 | 13 | 8 (61.5) | 12 (92.3) | 4 (80.0) 0.313 |
| Total | 161 | 54.) | 170 | 77.1 | 149 (100) | 79 (53.0) | 114 (76.5) | |
| Marital status | * p = 0.03 | * p = 0.16 | * p = 0.053 | * p = 0.044 | ||||
| Married or cohabiting | 271 | 58.3 | 160 | 75.6 | 150 | 74 (49.3) | 112 (74.7) | 45 (59.2) 0.494 |
| Single, divorced, or widowed | 83 | 71.1 | 42 | 85.7 | 39 | 26 (66.7) | 35 (89.7) | 9 (69.2) 0.494 |
| Total | 354 | 61.3 | 202 | 77.7 | 189 | 100 (52.9) | 147 (77.8) | 54 (60.7) |
| Smoking | * p = 0.069 | * p = 0.90 | * p = 0.040 | * p = 0.33 | ||||
| Never smoked | 142 | 64.1 | 84 | 81 | 84 | 50 (59.5) | 68 (81.0) | 19 (55.9) 0.467 |
| Stopped smoking | 129 | 65.1 | 92 | 78.3 | 64 | 35 (54.7) | 50 (78.1) | 19 (65.5) 0.516 |
| Current smoker | 76 | 50.0 | 19 | 78.9 | 35 | 12 (34.3) | 24 (68.6) | 13 (56.5) 0.636 |
| Total | 347 | 61.4 | 195 | 79.5 | 183 | 97 (53.0) | 142 (77.6) | 54 (60.7) |
| Weekly alcohol consumption (g) | * p = 0.18 | * p = 0.44 | * p = 0.10 | * p = 0.52 | ||||
| No alcohol consumption | 43 | 72.1 | 33 | 84.8 | 23 (14.6) | 16 (69.6) | 19 (82.6) | 3 (42.9) 0.339 |
| <168 g | 210 | 57.1 | 116 | 75.0 | 120 (75.9) | 56 (46.7) | 92 (76.7) | 39 (60.9) 0.635 |
| ≥168 g | 32 | 62.5 | 14 | 71.4 | 15 (9.5) | 9 (60.0) | 10 (66.7) | 4 (66.7) 0.719 |
| Total | 285 | 60.0 | 163 | 76.7 | 158 (100) | 81 (51.3) | 121 (76.6) | 46 (59.7) |
| Body Mass Index | * p = 0.47 | * p = 0.07 | * p = 0.96 | * p = 0.03 | ||||
| <30 kg/m2 | 289 | 60.6 | 185 | 76.8 | 159 | 84 (52.8) | 119 (74.8) | 42 (56.0) 0.037 |
| ≥30 kg/m2 | 69 | 65.2 | 33 | 90.9 | 30 | 16 (53.3) | 28 (93.3) | 12 (85.7) 0.037 |
| Total | 358 | 61.5 | 218 | 78.9 | 189 | 100 (52.9) | 147 (77.8) | 54 (60.7) |
| Interest in sexual life | * p < 0.001 | * p < 0.001 | * p < 0.001 | * p = 0.095 | ||||
| As before | 180 | 43.9 | 92 | 66.3 | 104 | 38 (36.5) | 75 (72.1) | 38 (57.6) 0.311 |
| Reduced | 171 | 78.4 | 108 | 87.0 | 82 | 59 (72.0) | 69 (84.1) | 16 (69.6) 0.311 |
| Not at all | 7 | 100 | 11 | 100 | 3 | 3 (100) | 3 (100) | 0 (0.0) |
| Total | 358 | 61.5 | 211 | 78.7 | 189 | 100 (52.9) | 147 (77.8) | 54 (60.7) |
| BDI-I score | * p = 0.002 | * p = 0.015 | * p = 0.016 | * p = 0.339 | ||||
| <10 | 332 | 59.3 | 198 | 76.8 | 179 | 91 (50.8) | 138 (77.1) | 51 (60.7) 0.975 |
| ≥10 | 27 | 88.9 | 20 | 100 | 10 | 9 (90.0) | 9 (90.0) | 3 (60.0) 0.975 |
| Total | 359 | 61.6 | 218 | 78.9 | 189 | 100 (52.9) | 147 (77.8) | 54 (60.7) |
| Variable | All Men | Men Participated to Both Baseline and Follow-Up | ||||||
|---|---|---|---|---|---|---|---|---|
| Baseline (N = 359) | Follow-Up (N = 172) | Baseline (N = 189) | Follow-Up (N = 189) | |||||
| Category | Unadjusted OR (95% CI) | Adjusted OR (95% CI) | Unadjusted OR (95% CI) | Adjusted OR (95% CI) | Unadjusted OR (95% CI) | Adjusted OR (95% CI) | Unadjusted OR (95% CI) | Adjusted OR (95% CI) |
| Age (years) | ||||||||
| 50–54 | ref | ref | ref | ref | ||||
| 55–59 | 1.1 (0.6,2.1) | 0.9 (0.4,1.9) | 1.3 (0.6,2.8) | 1.0 (0.4,2.5) | ||||
| 60–64 | 3.4 (1.7,7.1) | 2.5 (1.1,5.6) | ref | ref | 2.8 (1.2,6.5) | 2.6 (1.0,7.1) | ref | ref |
| 65–69 | 8.9 (3.8,21.0) | 6.1 (2.4,15.8) | 0.4 (0.2,1.1) | 0.4 (0.1,1.2) | 9.8 (2.9,33.7) | 10 (2.6,40.1) | 0.4 (0.2,1.2) | 0.4 (0.1,1.2) |
| 70 and over | 11.0 (4.2,28.4) | 6.3 (2.2,18.1) | 4.2 (1.4,12.3) | 3.8 (1.2,12.1) | 13.0 (2.6,65.1) | 7.9 (1.4,43.6) | 3.7 (1.2,10.8) | 3.5 (1.1,11.3) |
| Education | ||||||||
| Higher or vocational | ref | ref | ref | ref | ref | ref | ref | ref |
| Basic | 2.5 (1.4,4.5) | 2.7 (1.4,5.4) | 1.7 (0.8,3.3) | 1.5 (0.7,3.6) | 2.8 (1.5,5.2) | 3.0 (1.4,6.3) | 1.9 (0.9,3.9) | 1.7 (0.7,4.0) |
| Marital status | ||||||||
| Married or cohabiting | ref | ref | ref | ref | ref | ref | ref | ref |
| Single, divorced, or widowed | 1.8 (1.0,3.0) | 2.1 (1.1,3.9) | 1.9 (0.8,4.9) | 3.0 (0.9,9.7) | 2.1 (1.0,4.3) | 3.0 (1.2,7.5) | 3.0 (1.0,8.9) | 4.1 (1.1,14.4) |
| Body mass index | ||||||||
| <30 kg/m2 | ref | ref | ref | ref | ref | ref | ref | ref |
| ≥30 kg/m2 | 1.5 (0.8,2.8) | 1.1 (0.5,2.4) | 3.0 (0.9,10.4) | 3.6 (0.7,18.6) | 0.7 (0.3,1.8) | 0.7 (0.2,2.4) | 4.1 (0.9,18.1) | 3.7 (0.7,19.5) |
| Interest in sexual life | ||||||||
| As before | ref | ref | ref | ref | ref | ref | ref | ref |
| Reduced or not at all | 4.9 (3.1,7.8) | 3.3 (1.9,5.7) | 3.8 (1.9,7.7) | 2.8 (1.2,6.8) | 4.7 (2.5,8.7) | 4.0 (1.9,8.4) | 4.1 (1.9,8.6) | 3.3 (1.3,8.1) |
| Beck’s BDI-I score | ||||||||
| <10 | ref | ref | ref | ref | ref | ref | ref | ref |
| ≥10 | 3.7 (1.8,7.7) | 2.4 (1.1,5.6) | 5.4 (1.3,23.5) | 2.5 (0.5,12.8) | 3.9 (1.4,11.1) | 3.4 (1.0,11.3) | 5.1 (1.2,22.4) | 2.3 (0.4,12.3) |
| ED at the Baseline | ||||||
|---|---|---|---|---|---|---|
| No ED | Mild | Mild to Moderate | Moderate | Severe | Total | |
| ED at 12-Year Follow-Up | N (%) | N (%) | N (%) | N (%) | N (%) | N (%) |
| No ED | 35 (39.3) | 7 (11.9) | 42 (22.2) | |||
| Mild | 36 (40.4) | 23 (39.0) | 3 (12.5) | 62 (32.8) | ||
| Mild to moderate | 10 (11.2) | 14 (23.7) | 3 (12.5) | 1 (20.0) | 28 (14.8) | |
| Moderate | 1 (1.1) | 7 (11.9) | 5 (20.8) | 2 (40.0) | 1 (8.3) | 16 (8.5) |
| Severe | 7 (7.9) | 8 (13.6) | 13 (54.2) | 2 (40.0) | 11 (91.7) | 41 (21.7) |
| Total | 89 (100) | 59 (100) | 24 (100) | 5 (100) | 12 (100) | 189 (100) |
| Erectile Function Remained Same or Improved | Erectile Function Decreased | Erectile Dysfunction Persistence | |||||||
|---|---|---|---|---|---|---|---|---|---|
| N | % | OR (95% CI) | N | % | OR (95% CI) | N | % | OR (95% CI) | |
| Baseline age | p ≤ 0.001 | p = 0.009 | p ≤ 0.001 | ||||||
| 50–54 | 46 | 28.3 | ref | 45 | 53.3 | ref | 46 | 34.8 | ref |
| 55–59 | 60 | 41.7 | 1.8 (0.8,4.1) | 59 | 44.1 | 0.7 (0.3,1.5) | 60 | 28.3 | 0.7 (0.3,1.7) |
| 60–64 | 42 | 19 | 0.6 (0.2,1.6) | 37 | 64.9 | 1.6 (0.7,3.9) | 42 | 59.5 | 2.8 (1.2,6.5) |
| 65–69 | 25 | 4 | 0.1 (0.0,0.9) | 22 | 77.3 | 3.0 (0.9,9.5) | 25 | 84 | 9.8 (2.9,33.7) |
| 70–75 | 16 | 0 | n.a. | 14 | 85.7 | 5.2 (1.1,26.2) | 16 | 87.5 | 13.1 (2.6,65.1) |
| Education | p = 0.073 | p = 0.568 | p = 0.002 | ||||||
| Higher or vocational | 88 | 33 | ref | 81 | 55.6 | ref | 88 | 36.4 | ref |
| Basic | 82 | 20.7 | 0.5 (0.3,1.1) | 80 | 60 | 1.2 (0.6,2.2) | 82 | 59.8 | 2.6 (1.4,4.8) |
| Social class | p = 0.280 | p = 0.285 | p = 0.699 | ||||||
| Upper | 49 | 30.6 | ref | 46 | 54.3 | ref | 49 | 51 | ref |
| Upper middle | 18 | 38.9 | 1.4 (0.5,4.4) | 17 | 52.9 | 0.9 (0.3,2.9) | 18 | 50 | 1.0 (0.3,2.8) |
| Middle | 17 | 29.4 | 0.9 (0.3,3.2) | 16 | 50 | 0.8 (0.3,2.6) | 17 | 35.3 | 0.5 (0.2,1.6) |
| Working | 52 | 21.2 | 0.6 (0.2,1.5) | 50 | 56 | 1.1 (0.5,2.4) | 52 | 48.1 | 0.9 (0.4,1.9) |
| Other | 13 | 7.7 | 0.2 (0.0,1.6) | 10 | 90 | 7.6 (0.9,64.6) | 13 | 61.5 | 1.5 (0.4,5.4) |
| Marital status | p = 0.051 | p = 0.365 | p = 0.014 | ||||||
| Married or cohabiting | 150 | 28 | ref | 142 | 59.9 | ref | 150 | 44.7 | ref |
| Single, divorced, or widowed | 39 | 12.8 | 0.4 (0.1,1.0) | 35 | 51.4 | 0.7 (0.3,1.5) | 39 | 66.7 | 2.5 (1.2,5.2) |
| Change in Smoking | p = 0.476 | p = 0.668 | p = 0.136 | ||||||
| Nonsmoker at baseline–nonsmoker at follow-up | 133 | 23.3 | ref | 125 | 59.2 | ref | 133 | 51.9 | ref |
| Smoker at baseline–nonsmoker at follow-up | 13 | 38.5 | 2.1 (0.6,6.7) | 11 | 45.5 | 0.6 (0.2,2.0) | 13 | 38.5 | 0.6 (0.2,1.9) |
| Smoker at baseline–smoker at follow-up | 15 | 26.7 | 1.2 (0.4,4.0) | 15 | 60 | 1.0 (0.3,3.1) | 15 | 26.7 | 0.3 (0.1,1.1) |
| Change in alcohol use | p = 0.627 | p = 0.774 | p = 0.038 | ||||||
| No alcohol at all | 16 | 37.5 | ref | 13 | 53.8 | ref | 16 | 75 | ref |
| Same or decreased | 75 | 26.7 | 0.6 (0.2,1.9) | 72 | 61.1 | 1.3 (0.4,4.4) | 75 | 40 | 0.2 (0.1,0.8) |
| Increased | 51 | 25.5 | 0.6 (0.2,1.9) | 47 | 55.3 | 1.1 (0.3,3.6) | 51 | 45.1 | 0.3 (0.1,1.0) |
| Change in BMI | p = 0.328 | p = 0.791 | p = 0.329 | ||||||
| BMI same or decreased | 105 | 27.6 | ref | 96 | 57.3 | ref | 105 | 52.4 | ref |
| MI increased | 84 | 21.4 | 0.7 (0.4,1.4) | 81 | 59.3 | 1.1 (0.6,2.0) | 84 | 45.2 | 0.8 (0.4,1.3) |
| Change in sexual interest | p ≤ 0.001 | p ≤ 0.001 | p = 0.025 | ||||||
| Increased | 21 | 28.6 | ref | 20 | 65 | ref | 21 | 61.9 | ref |
| No change | 105 | 35.2 | 1.4 (0.5,3.8) | 97 | 46.4 | 0.5 (0.2,1.3) | 105 | 40 | 0.4 (0.2,1.1) |
| Decreased | 57 | 5.3 | 0.1 (0.0,0.6) | 55 | 76.4 | 1.7 (0.6,5.3) | 57 | 59.6 | 0.9 (0.3,2.5) |
| Change in Beck BDI-I | p ≤ 0.001 | p = 0.118 | p = 0.024 | ||||||
| Same or decreased | 97 | 35.1 | ref | 93 | 52.7 | ref | 97 | 41.2 | ref |
| Increased | 92 | 14.1 | 0.3 (0.1,0.6) | 84 | 64.3 | 1.6 (0.9,3.0) | 92 | 57.6 | 1.9 (1.1,3.5) |
Publisher’s Note: MDPI stays neutral with regard to jurisdictional claims in published maps and institutional affiliations. |
© 2022 by the authors. Licensee MDPI, Basel, Switzerland. This article is an open access article distributed under the terms and conditions of the Creative Commons Attribution (CC BY) license (https://creativecommons.org/licenses/by/4.0/).
Share and Cite
Saramies, J.; Koiranen, M.; Auvinen, J.; Uusitalo, H.; Hussi, E.; Becker, S.; Keinänen-Kiukaanniemi, S.; Tuomilehto, J.; Suija, K. A Natural History of Erectile Dysfunction in Elderly Men: A Population-Based, Twelve-Year Prospective Study. J. Clin. Med. 2022, 11, 2146. https://doi.org/10.3390/jcm11082146
Saramies J, Koiranen M, Auvinen J, Uusitalo H, Hussi E, Becker S, Keinänen-Kiukaanniemi S, Tuomilehto J, Suija K. A Natural History of Erectile Dysfunction in Elderly Men: A Population-Based, Twelve-Year Prospective Study. Journal of Clinical Medicine. 2022; 11(8):2146. https://doi.org/10.3390/jcm11082146
Chicago/Turabian StyleSaramies, Jouko, Markku Koiranen, Juha Auvinen, Hannu Uusitalo, Esko Hussi, Sebastian Becker, Sirkka Keinänen-Kiukaanniemi, Jaakko Tuomilehto, and Kadri Suija. 2022. "A Natural History of Erectile Dysfunction in Elderly Men: A Population-Based, Twelve-Year Prospective Study" Journal of Clinical Medicine 11, no. 8: 2146. https://doi.org/10.3390/jcm11082146
APA StyleSaramies, J., Koiranen, M., Auvinen, J., Uusitalo, H., Hussi, E., Becker, S., Keinänen-Kiukaanniemi, S., Tuomilehto, J., & Suija, K. (2022). A Natural History of Erectile Dysfunction in Elderly Men: A Population-Based, Twelve-Year Prospective Study. Journal of Clinical Medicine, 11(8), 2146. https://doi.org/10.3390/jcm11082146