
T1ρ for Radiotherapy Treatment Response Monitoring in Rectal Cancer Patients: A Pilot Study

 ,
,
Abstract
1. Introduction
2. Materials and Methods
2.1. MRI Sequence
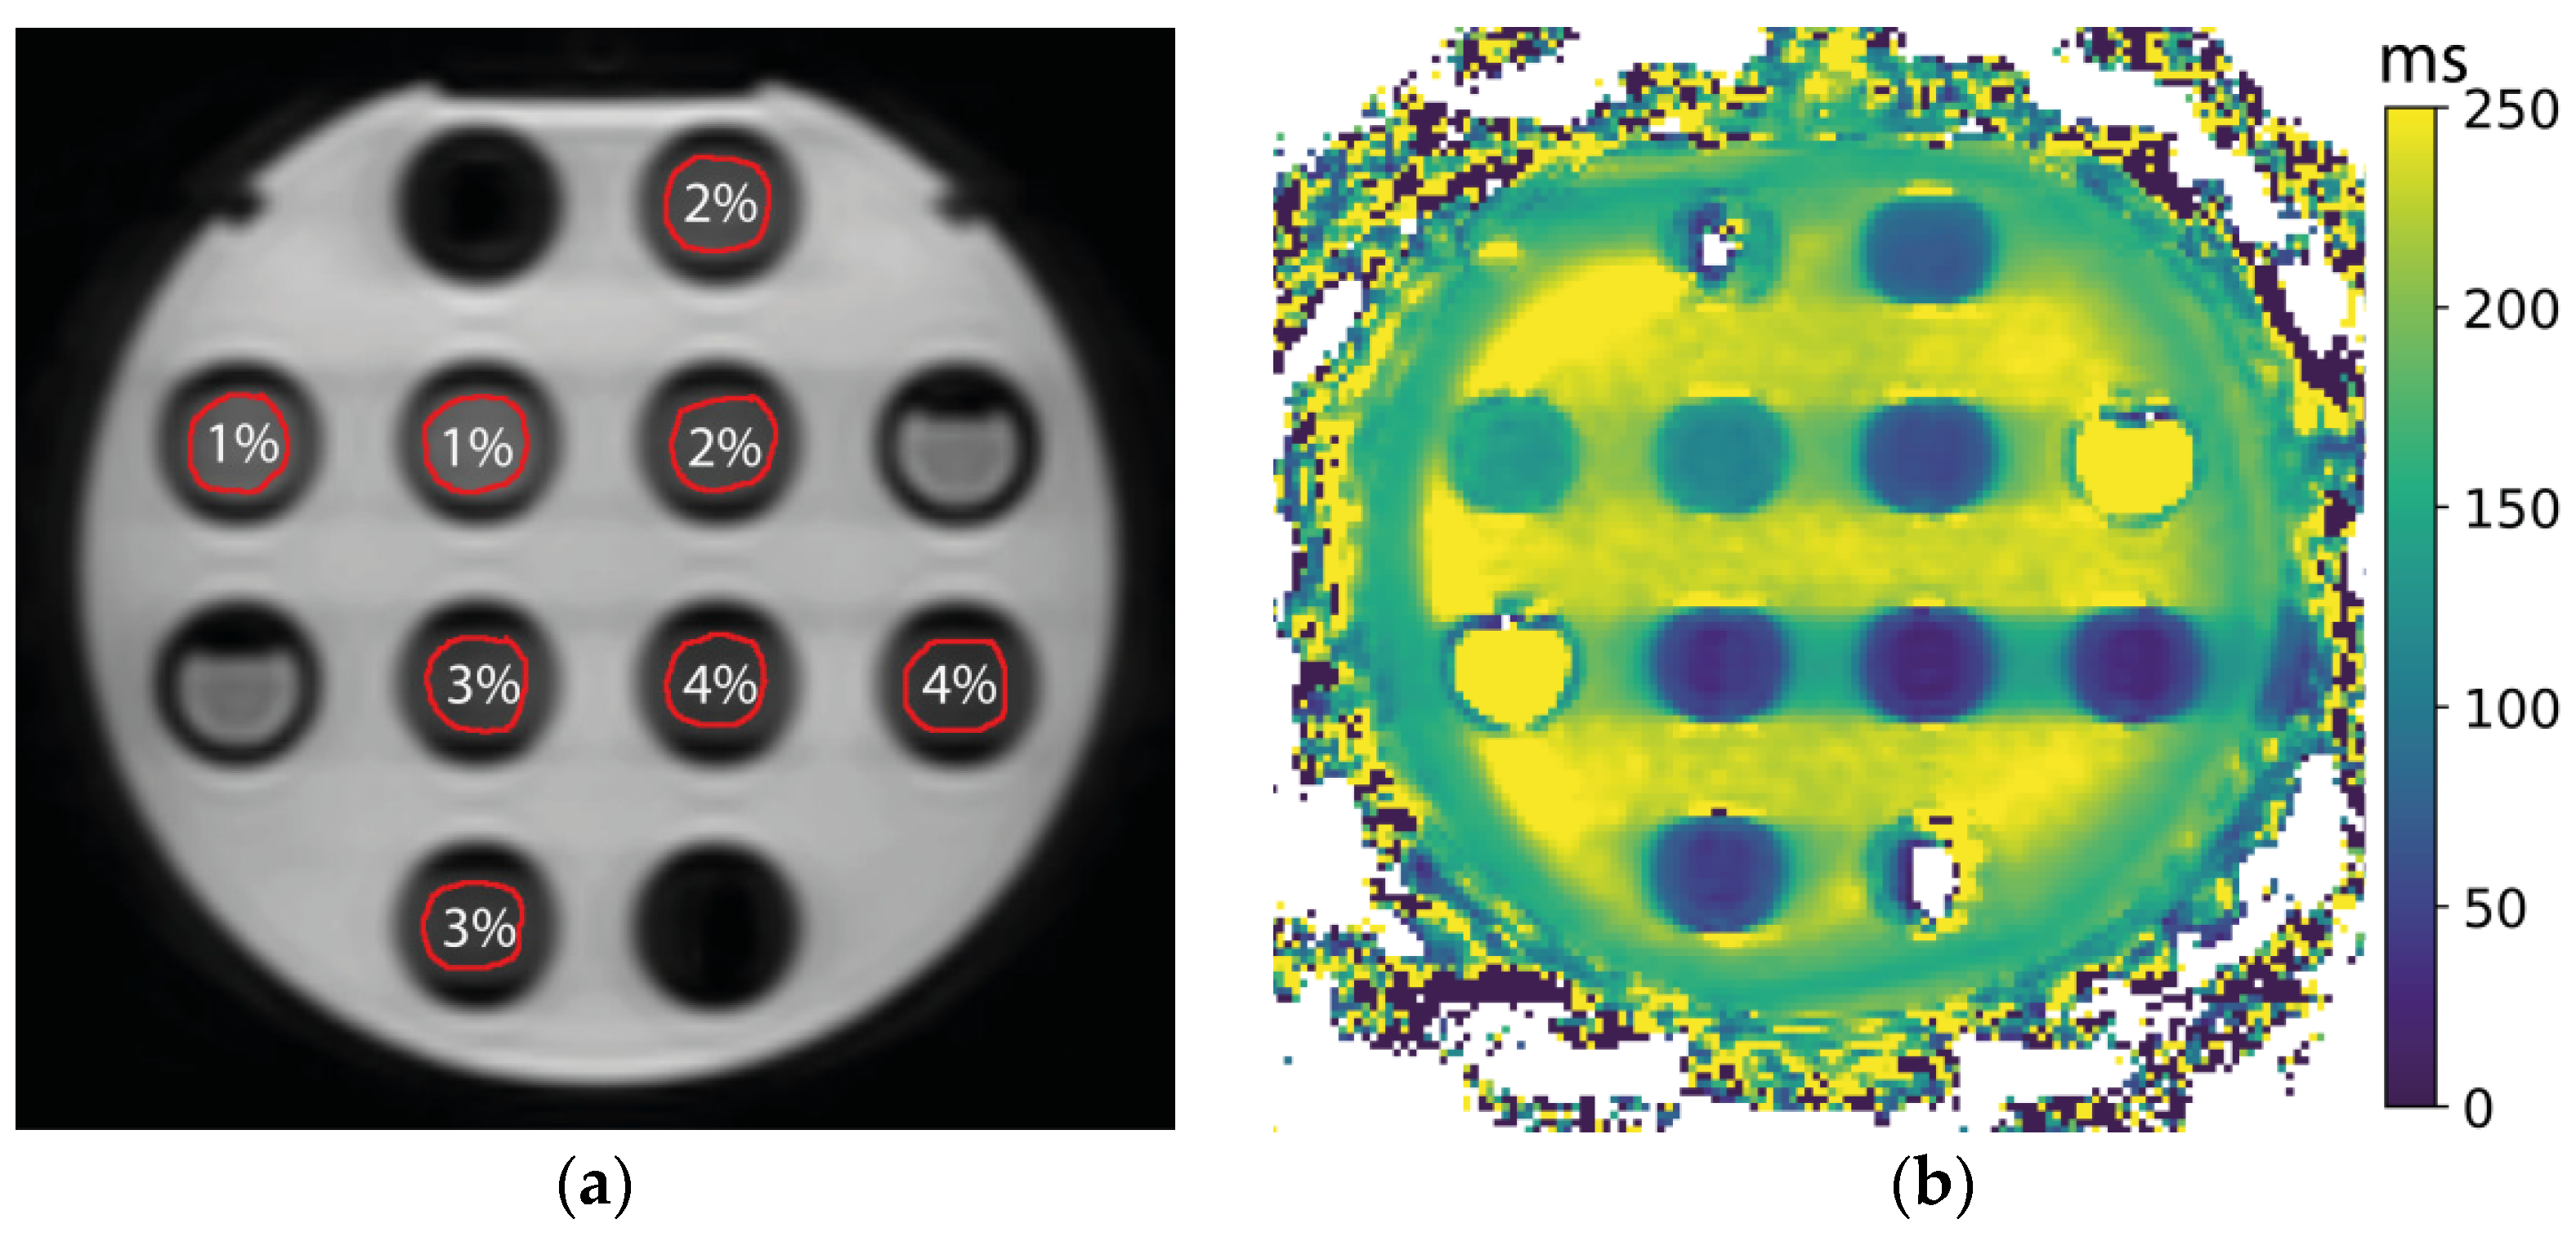
2.2. Phantom
2.3. Patients
3. Results
3.1. Phantom Measurements
3.2. Patients
4. Discussion
Supplementary Materials
Author Contributions
Funding
Institutional Review Board Statement
Informed Consent Statement
Data Availability Statement
Conflicts of Interest
References
- Joiner, M.; van der Kogel, A. Basic Clinical Radiobiology, 4th ed.; Hodder Education: London, UK, 2009; ISBN 9780340929667. [Google Scholar]
- van Houdt, P.J.; Yang, Y.; van der Heide, U.A. Quantitative Magnetic Resonance Imaging for Biological Image-Guided Adaptive Radiotherapy. Front. Oncol. 2021, 10, 615643. [Google Scholar] [CrossRef] [PubMed]
- Gilani, I.A.; Sepponen, R. Quantitative rotating frame relaxometry methods in MRI. NMR Biomed. 2016, 29, 841–861. [Google Scholar] [CrossRef] [PubMed]
- Cobb, J.G.; Xie, J.; Gore, J.C. Contributions of Chemical and Diffusive Exchange to T1r Dispersion. Magn. Reson. Med. 2013, 1366, 1357–1366. [Google Scholar] [CrossRef] [PubMed]
- Wang, L.; Regatte, R.R. T1ρ MRI of Human Musculoskeletal System. J. Magn. Reson. Imaging 2015, 41, 586–600. [Google Scholar] [CrossRef] [PubMed]
- Hectors, S.J.C.G.; Moonen, R.P.M.; Strijkers, G.J.; Nicolay, K. T1ρ mapping for the evaluation of high intensity focused ultrasound tumor treatment. Magn. Reson. Med. 2015, 73, 1593–1601. [Google Scholar] [CrossRef] [PubMed][Green Version]
- Jambor, I.; Pesola, M.; Taimen, P.; Merisaari, H.; Boström, P.J.; Minn, H.; Liimatainen, T.; Aronen, H.J. Rotating frame relaxation imaging of prostate cancer: Repeatability, cancer detection, and Gleason score prediction. Magn. Reson. Med. 2016, 75, 337–344. [Google Scholar] [CrossRef] [PubMed]
- Santyr, G.E.; Henkelman, R.M.; Bronskill, M.J. Spin locking for magnetic resonance imaging with application to human breast. Magn. Reson. Med. 1989, 12, 25–37. [Google Scholar] [CrossRef] [PubMed]
- Zhou, N.; Chu, C.; Dou, X.; Li, M.; Liu, S.; Guo, T.; Zhu, L.; Liu, B.; Chen, W.; He, J.; et al. Early Changes of Irradiated Parotid Glands Evaluated by T1rho-Weighted Imaging. J. Comput. Assist. Tomogr. 2017, 41, 472–476. [Google Scholar] [CrossRef] [PubMed]
- Raaymakers, B.W.; Lagendijk, J.J.W.; Overweg, J.; Kok, J.G.M.; Raaijmakers, A.J.E.; Kerkhof, E.M.; van der Put, R.W.; Meijsing, I.; Crijns, S.P.M.; Benedosso, F.; et al. Integrating a 1.5 T MRI scanner with a 6 MV accelerator: Proof of concept. Phys. Med. Biol. 2009, 54, N229–N237. [Google Scholar] [CrossRef] [PubMed]
- Hoogcarspel, S.J.; Zijlema, S.E.; Tijssen, R.H.N.; Kerkmeijer, L.G.W.; Jürgenliemk-Schulz, I.M.; Lagendijk, J.J.W.; Raaymakers, B.W. Characterization of the first RF coil dedicated to 1.5 T MR guided radiotherapy. Phys. Med. Biol. 2018, 63, 025014. [Google Scholar] [CrossRef] [PubMed]
- Witschey, W.R.T.; Borthakur, A.; Elliott, M.A.; Mellon, E.; Niyogi, S.; Wallman, D.J.; Wang, C.; Reddy, R. Artifacts in T1ρ-weighted imaging: Compensation for B1 and B0 field imperfections. J. Magn. Reson. 2007, 186, 75–85. [Google Scholar] [CrossRef] [PubMed]
- Buck, F.M.; Bae, W.C.; Diaz, E.; Du, J.; Statum, S.; Han, E.T.; Chung, C.B. Comparison of T1rho measurements in agarose phantoms and human patellar cartilage using 2D multislice spiral and 3D magnetization prepared partitioned k-space spoiled gradient-echo snapshot techniques at 3 T. Am. J. Roentgenol. 2011, 196, 174–179. [Google Scholar] [CrossRef] [PubMed]
- Perfusion, Diffusion and Flow-MRI Biomarker Committee. QIBA Profile: Diffusion-Weighted Magnetic Resonance Imaging (DWI), Quantitative Imaging Biomarkers Alliance. QIBA 2019. Available online: https://qibawiki.rsna.org/images/6/63/QIBA_DWIProfile_Consensus_Dec2019_Final.pdf (accessed on 9 February 2022).
- Fokas, E.; Appelt, A.; Glynne-Jones, R.; Beets, G.; Perez, R.; Garcia-Aguilar, J.; Rullier, E.; Smith, J.J.; Marijnen, C.; Peters, F.P.; et al. International consensus recommendations on key outcome measures for organ preservation after (chemo)radiotherapy in patients with rectal cancer. Nat. Rev. Clin. Oncol. 2021, 18, 805–816. [Google Scholar] [CrossRef] [PubMed]
- Bates, D.; Mächler, M.; Bolker, B.; Walker, S. Fitting Linear Mixed-Effects Models Using lme4. J. Stat. Softw. 2015, 67, 1–48. [Google Scholar] [CrossRef]
- Xie, S.; Li, Q.; Cheng, Y.; Zhang, Y.; Zhuo, Z.; Zhao, G.; Shen, W. Impact of liver fibrosis and fatty liver on T1rho measurements: A prospective study. Korean J. Radiol. 2017, 18, 898–905. [Google Scholar] [CrossRef] [PubMed]
- Lambregts, D.M.J.; Boellaard, T.N.; Beets-tan, R.G.H. Response evaluation after neoadjuvant treatment for rectal cancer using modern MR imaging: A pictorial review. Insights Imaging 2019, 10, 15. [Google Scholar] [CrossRef] [PubMed]
- Ai, Q.Y.H.; Zhang, H.; Jiang, B.; So, T.Y.; Mo, F.K.F.; Qamar, S.; Chen, W.; King, A.D. Test-retest repeatability of T1rho (T1ρ) MR imaging in the head and neck. Eur. J. Radiol. 2021, 135, 109489. [Google Scholar] [CrossRef] [PubMed]
- Kooreman, E.S.; van Houdt, P.J.; Keesman, R.; Pos, F.J.; van Pelt, V.W.J.; Nowee, M.E.; Wetscherek, A.; Tijssen, R.H.N.; Philippens, M.E.P.; Thorwarth, D.; et al. ADC measurements on the Unity MR-linac–A recommendation on behalf of the Elekta Unity MR-linac consortium. Radiother. Oncol. 2020, 153, 106–113. [Google Scholar] [CrossRef]


| Complete Response (n = 5) | |
|---|---|
| Age | 61 (52–72) |
| T-stage | |
| T2N0 | 2 |
| T3aN0 | 1 |
| T3aN2 | 1 |
| T3bN1 | 1 |
| Incomplete Response (n = 5) | |
| Age | 53 (34–64) |
| T-stage | |
| T2N0 | 2 |
| T3bN0 | 1 |
| T3cN1 | 1 |
| T4bN1 | 1 |
| Response Unknown (n = 2) | |
| Age | 61, 73 |
| T-stage | |
| T3bN0 | 1 |
| T3bN1 | 1 |
| Tube | Mean ± SD (ms) | RC (ms) | wCV (%) | SNR ± 95% CI |
|---|---|---|---|---|
| 1% inside | 113 ± 2 | 0.5 | 0.1 | 96 ± 11 |
| 1% outside | 136 ± 5 | 1.5 | 0.4 | 73 ± 9 |
| 2% inside | 59 ± 3 | 0.6 | 0.4 | 83 ± 10 |
| 2% outside | 76 ± 6 | 1.3 | 0.6 | 101 ± 11 |
| 3% inside | 39 ± 5 | 0.8 | 0.7 | 37 ± 4 |
| 3% outside | 48 ± 6 | 1.4 | 1.1 | 45 ± 6 |
| 4% inside | 28 ± 4 | 0.7 | 0.9 | 36 ± 7 |
| 4% outside | 32 ± 5 | 0.8 | 0.9 | 36 ± 5 |
| ROI | Fraction 1 | Fraction 2 | Fraction 3 | Fraction 4 | Fraction 5 | Fraction 5−Fraction 1 |
|---|---|---|---|---|---|---|
| GTV | ||||||
| All (n = 12) | 77 ± 2 | 79 ± 2 | 80 ± 2 | 80 ± 2 | 81 ± 2 | 4 ± 1 (p = 0.13) |
| Complete responders (n = 5) | 77 ± 4 | 77 ± 3 | 81 ± 3 | 80 ± 2 | 80 ± 2 | 3 ± 3 (p = 0.44) |
| Incomplete responders (n = 5) | 76 ± 4 | 79 ± 4 | 78 ± 3 | 80 ± 4 | 81 ± 5 | 5 ± 1 (p = 0.02) |
| Mesorectum | 73 ± 3 | 72 ± 3 | 75 ± 3 | 76 ± 3 | 75 ± 3 | 2 ± 1 (p = 0.24) |
| Femoral head left | 64 ± 1 | 65 ± 2 | 65 ± 1 | 66 ± 2 | 65 ± 1 | 1 ± 1 (p = 0.46) |
| Femoral head right | 59 ± 1 | 59 ± 1 | 59 ± 1 | 60 ± 2 | 59 ± 2 | 1 ± 1 (p = 0.10) |
Publisher’s Note: MDPI stays neutral with regard to jurisdictional claims in published maps and institutional affiliations. |
© 2022 by the authors. Licensee MDPI, Basel, Switzerland. This article is an open access article distributed under the terms and conditions of the Creative Commons Attribution (CC BY) license (https://creativecommons.org/licenses/by/4.0/).
Share and Cite
Kooreman, E.S.; Tanaka, M.; ter Beek, L.C.; Peters, F.P.; Marijnen, C.A.M.; van der Heide, U.A.; van Houdt, P.J. T1ρ for Radiotherapy Treatment Response Monitoring in Rectal Cancer Patients: A Pilot Study. J. Clin. Med. 2022, 11, 1998. https://doi.org/10.3390/jcm11071998
Kooreman ES, Tanaka M, ter Beek LC, Peters FP, Marijnen CAM, van der Heide UA, van Houdt PJ. T1ρ for Radiotherapy Treatment Response Monitoring in Rectal Cancer Patients: A Pilot Study. Journal of Clinical Medicine. 2022; 11(7):1998. https://doi.org/10.3390/jcm11071998
Chicago/Turabian StyleKooreman, Ernst S., Max Tanaka, Leon C. ter Beek, Femke P. Peters, Corrie A. M. Marijnen, Uulke A. van der Heide, and Petra J. van Houdt. 2022. "T1ρ for Radiotherapy Treatment Response Monitoring in Rectal Cancer Patients: A Pilot Study" Journal of Clinical Medicine 11, no. 7: 1998. https://doi.org/10.3390/jcm11071998
APA StyleKooreman, E. S., Tanaka, M., ter Beek, L. C., Peters, F. P., Marijnen, C. A. M., van der Heide, U. A., & van Houdt, P. J. (2022). T1ρ for Radiotherapy Treatment Response Monitoring in Rectal Cancer Patients: A Pilot Study. Journal of Clinical Medicine, 11(7), 1998. https://doi.org/10.3390/jcm11071998