
Actual versus Forecast Burden of Primary Hip and Knee Replacement Surgery in Australia: Analysis of Data from the Australian Orthopaedic Association National Joint Replacement Registry


Abstract
:1. Introduction
2. Materials and Methods
2.1. Study Design
2.2. Data Sources
- Age-specific and sex-specific primary THR and primary TKR rates in 2013 were projected to continue at a constant rate until the year 2030 (‘Scenario 1’). Scenario 1 was therefore driven purely by expected population growth and ageing.
- Age-specific and sex-specific primary THR and primary TKR rates were projected to continue to increase as they had from 2003 to 2013, using Poisson regression analysis with age group, sex and procedure year included as model covariates (‘Scenario 2’). Scenario 2 was therefore driven by an expected increase in surgery rates as well as expected population growth and ageing.
2.3. Data Analysis
3. Results
3.1. Characteristics of the Cohort
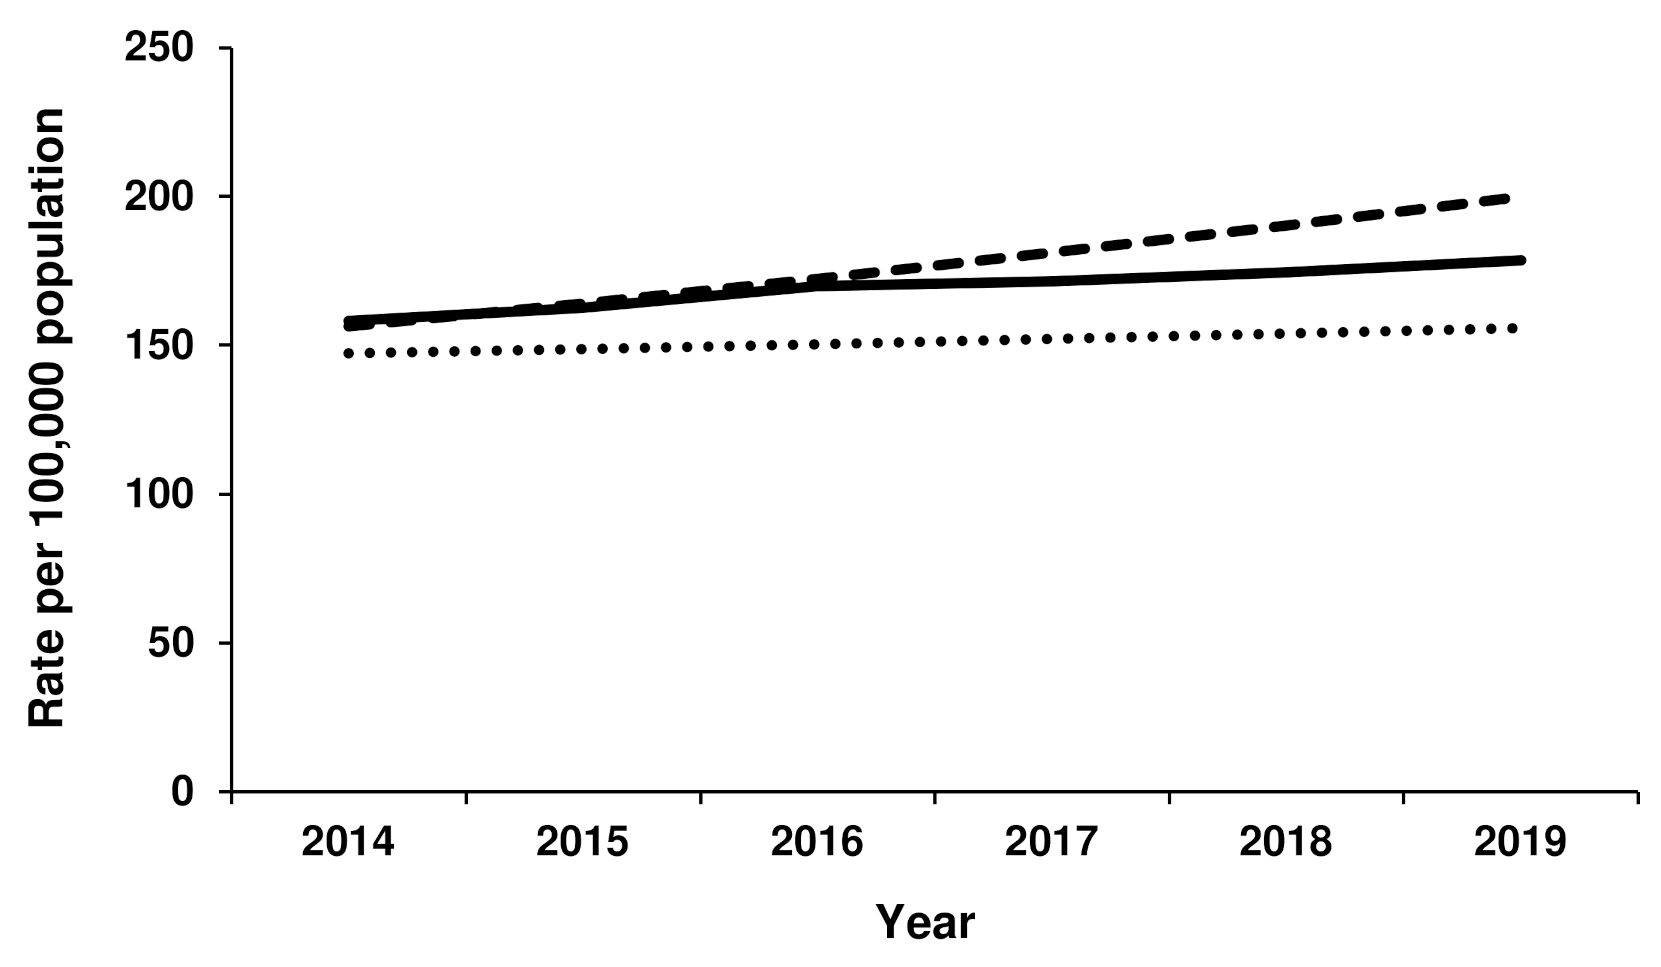
3.2. Actual versus Forecast Rates of Total Hip Replacement
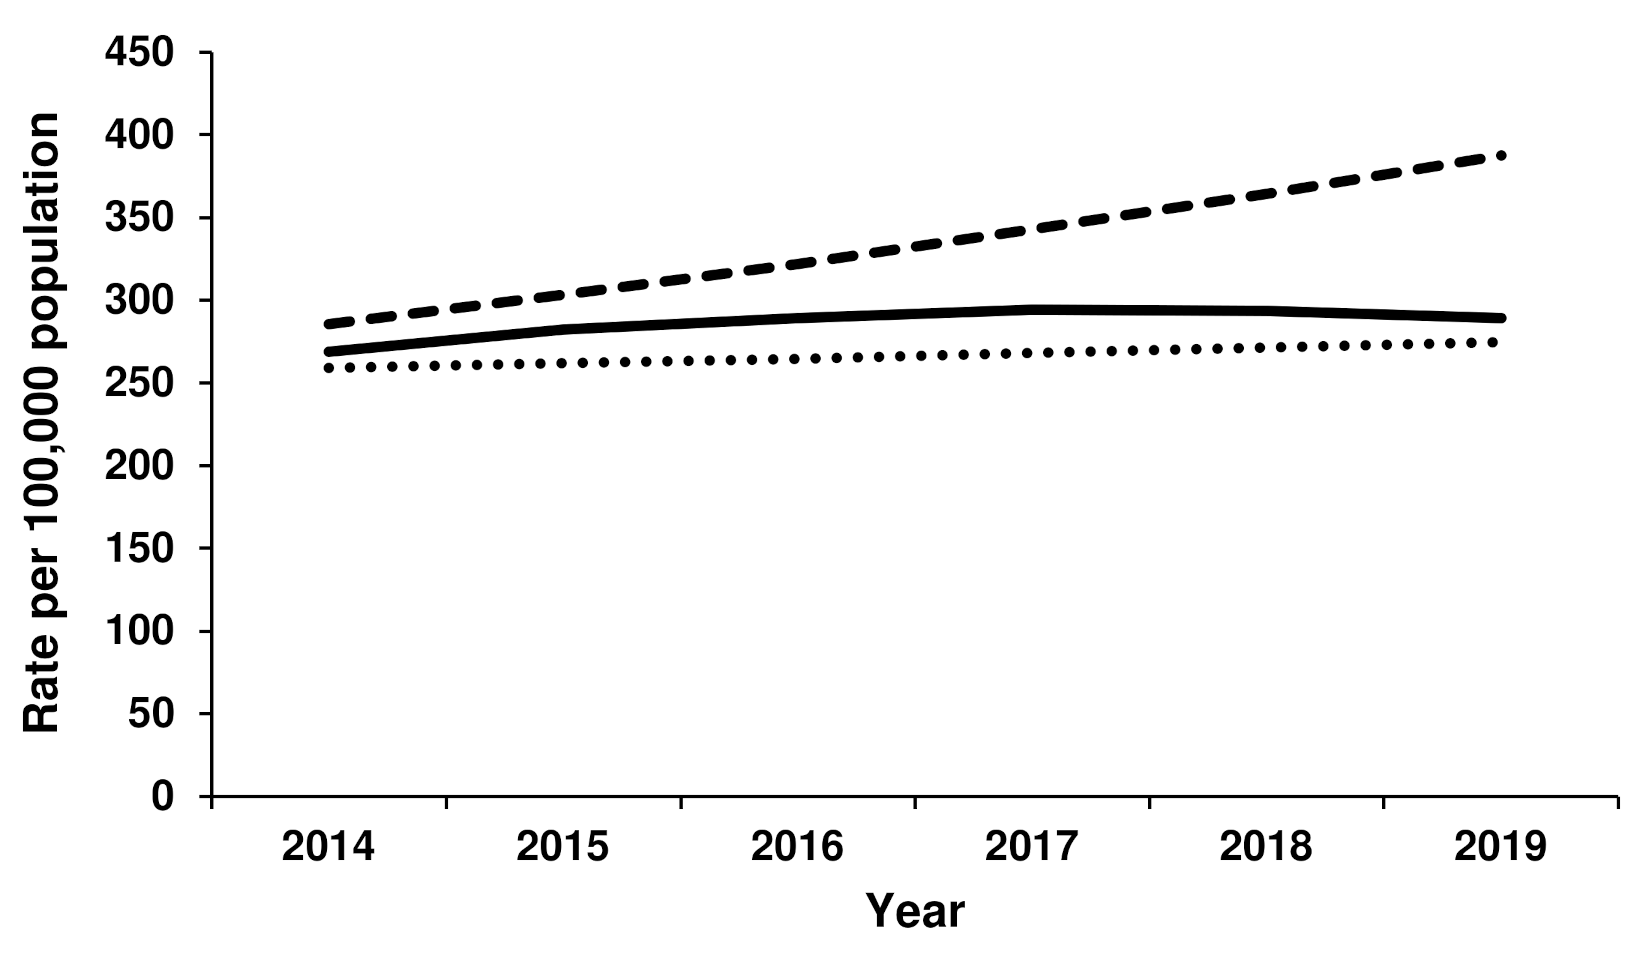
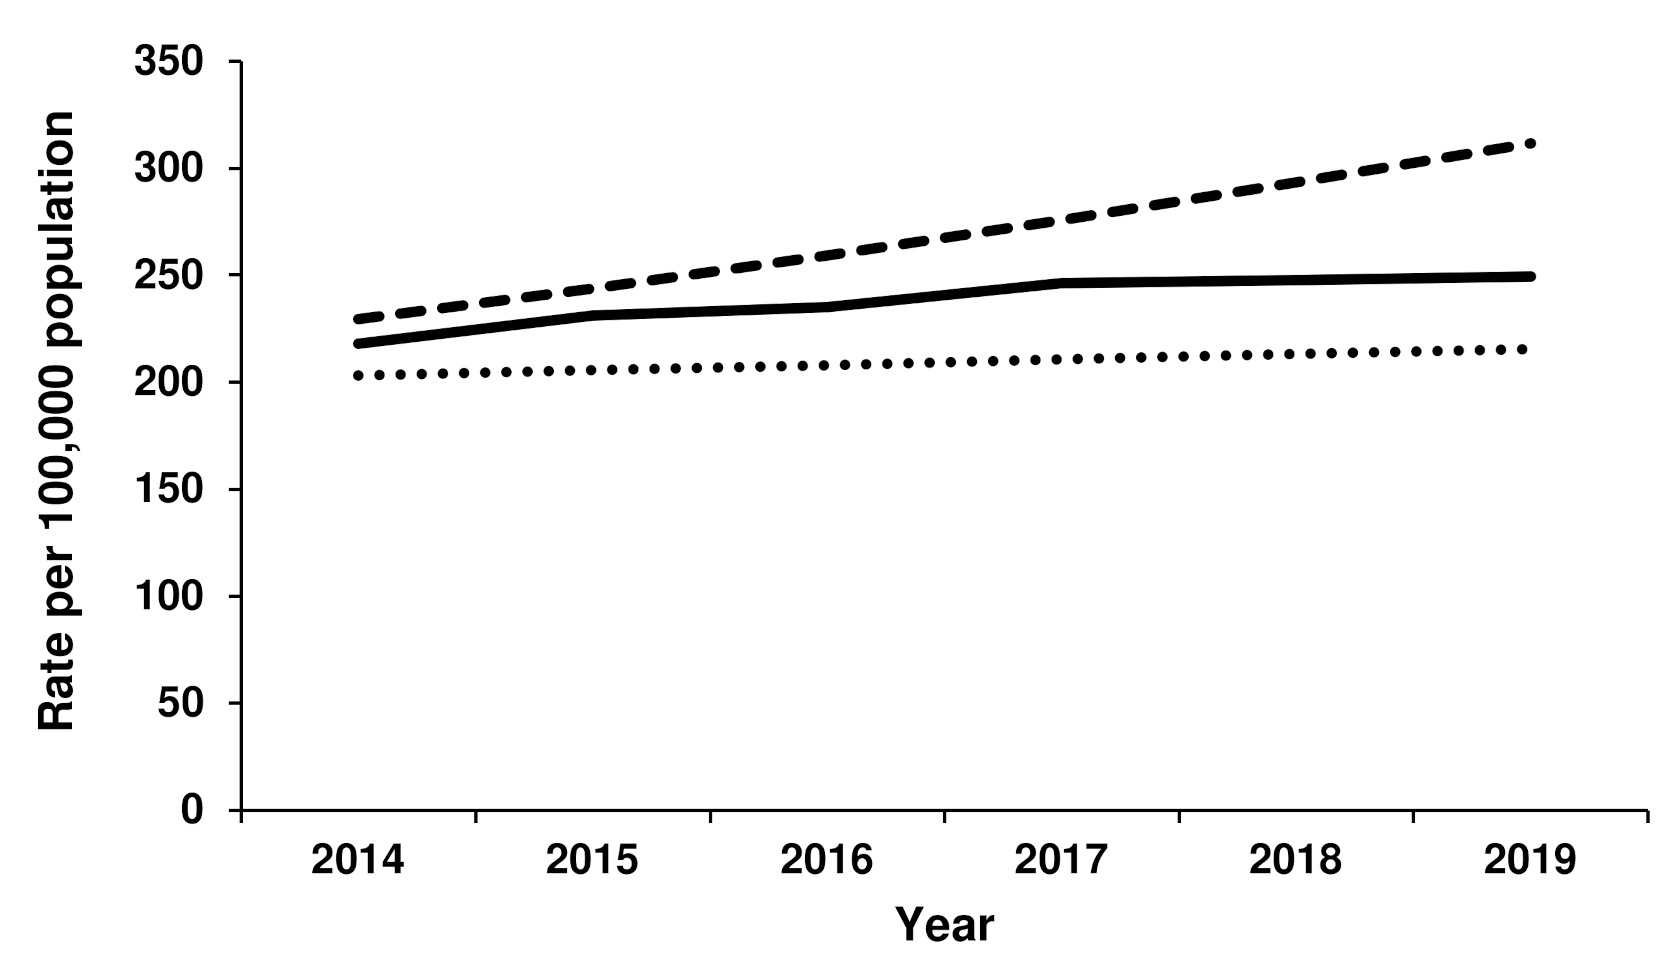
3.3. Actual versus Forecast Rates of Total Knee Replacement
3.4. Age-Specific Analyses
4. Discussion
5. Conclusions
Supplementary Materials
Author Contributions
Funding
Institutional Review Board Statement
Informed Consent Statement
Data Availability Statement
Acknowledgments
Conflicts of Interest
References
- Ackerman, I.N.; Bohensky, M.A.; de Steiger, R.; Brand, C.A.; Eskelinen, A.; Fenstad, A.M.; Furnes, O.; Graves, S.E.; Haapakoski, J.; Mäkelä, K.; et al. Lifetime risk of primary total hip replacement surgery for osteoarthritis from 2003–2013: A multi-national analysis using national registry data. Arthritis Care Res. 2017, 69, 1659–1667. [Google Scholar] [CrossRef] [PubMed]
- Australian Orthopaedic Association National Joint Replacement Registry. Annual Report-Hip, Knee and Shoulder Arthroplasty; Australian Orthopaedic Association: Adelaide, Australia, 2021. [Google Scholar]
- Ackerman, I.N.; Bohensky, M.A.; de Steiger, R.; Brand, C.A.; Eskelinen, A.; Fenstad, A.M.; Furnes, O.; Garellick, G.; Graves, S.E.; Haapakoski, J.; et al. Substantial rise in the lifetime risk of primary total knee replacement surgery for osteoarthritis from 2003–2013: An international, population-level analysis. Osteoarthr. Cartil. 2017, 25, 455–461. [Google Scholar] [CrossRef] [PubMed] [Green Version]
- Kurtz, S.M.; Ong, K.L.; Lau, E.; Bozic, K.J. Impact of the economic downturn on total joint replacement demand in the United States: Updated projections to 2021. J. Bone Jt. Surg. Am. 2014, 96, 624–630. [Google Scholar] [CrossRef] [PubMed]
- Sloan, M.; Premkumar, A.; Sheth, N.P. Projected volume of primary total joint arthroplasty in the U.S., 2014 to 2030. J. Bone Jt. Surg. Am. 2018, 100, 1455–1460. [Google Scholar] [CrossRef] [PubMed]
- Singh, J.A.; Yu, S.; Chen, L.; Cleveland, J.D. Rates of total joint replacement in the United States: Future projections to 2020–2040 using the National Inpatient Sample. J. Rheumatol. 2019, 46, 1134–1140. [Google Scholar] [CrossRef] [PubMed]
- Culliford, D.; Maskell, J.; Judge, A.; Cooper, C.; Prieto-Alhambra, D.; Arden, N.K. Future projections of total hip and knee arthroplasty in the UK: Results from the UK Clinical Practice Research Datalink. Osteoarthr. Cartil. 2015, 23, 594–600. [Google Scholar] [CrossRef] [PubMed] [Green Version]
- Rupp, M.; Lau, E.; Kurtz, S.M.; Alt, V. Projections of primary TKA and THA in Germany from 2016 through 2040. Clin Orthop. Relat. Res. 2020, 478, 1622–1633. [Google Scholar] [CrossRef] [PubMed]
- Ackerman, I.N.; Bohensky, M.A.; Zomer, E.; Tacey, M.; Gorelik, A.; Brand, C.A.; de Steiger, R. The projected burden of primary total knee and hip replacement for osteoarthritis in Australia to the year 2030. BMC Musculoskelet Disord. 2019, 20, 90. [Google Scholar] [CrossRef] [Green Version]
- Australian Bureau of Statistics. Estimated Resident Population, Country of Birth, Age and Sex—As at 30 June 1996 to 2020. Available online: https://stat.data.abs.gov.au/Index.aspx?DataSetCode=ERP_COB (accessed on 4 November 2021).
- Independent Hospital Pricing Authority. NHCDC Public Sector. Available online: https://www.ihpa.gov.au/what-we-do/nhcdc/public-sector (accessed on 4 November 2021).
- Medibank Private Limited. How Much Will My Procedure Cost? Available online: https://www.medibank.com.au/health-support/hospital-assist/costs/ (accessed on 4 November 2021).
- Hospitals Contribution Fund of Australia Limited. Preparing for Hospital. Available online: https://www.hcf.com.au/preparing-for-hospital (accessed on 4 November 2021).
- Kurtz, S.; Ong, K.; Lau, E.; Mowat, F.; Halpern, M. Projections of primary and revision hip and knee arthroplasty in the United States from 2005 to 2030. J. Bone Jt. Surg. Am. 2007, 89, 780–785. [Google Scholar] [CrossRef]
- Australian Institute of Health and Welfare. Overweight and Obesity: An Interactive Insight: Australian Institute of Health and Welfare. Available online: https://www.aihw.gov.au/reports/overweight-obesity/overweight-and-obesity-an-interactive-insight/data (accessed on 9 December 2021).


| Characteristic | Total Hip Replacement (n = 191,996) | Total Knee Replacement (n = 312,203) |
|---|---|---|
| Females, n (%) | 102,241 (53) | 172,846 (55) |
| Age group, n (%) | ||
| <40 years | 1851 (1) | 299 (<1) |
| 40–69 years | 100,898 (53) | 171,319 (55) |
| ≥70 years | 89,247 (46) | 140,585 (45) |
| Hospital sector, n (%) | ||
| Private | 134,302 (70) | 218,485 (70) |
| Public | 57,694 (30) | 93,718 (30) |
| Estimated total cost | ||
| Private | AUD3.56 billion | AUD5.52 billion |
| Public | AUD1.35 billion | AUD2.07 billion |
| Age Group | Year | Forecast Scenario 1 | Forecast Scenario 2 | Actual | Rate Ratio * | ||||
|---|---|---|---|---|---|---|---|---|---|
| Number | Rate | Number | Rate | Number | Rate | Scenario 1 | Scenario 2 | ||
| <40 years | 2014 | 97 | 2.4 per 100,000 | 114 | 2.8 per 100,000 | 131 | 3.2 per 100,000 | 1.34 | 1.15 |
| 2015 | 99 | 2.4 per 100,000 | 121 | 3.0 per 100,000 | 120 | 2.9 per 100,000 | 1.21 | 0.99 | |
| 2016 | 102 | 2.4 per 100,000 | 129 | 3.1 per 100,000 | 110 | 2.6 per 100,000 | 1.08 | 0.85 | |
| 2017 | 104 | 2.5 per 100,000 | 137 | 3.2 per 100,000 | 134 | 3.2 per 100,000 | 1.28 | 0.97 | |
| 2018 | 107 | 2.5 per 100,000 | 146 | 3.4 per 100,000 | 158 | 3.7 per 100,000 | 1.47 | 1.07 | |
| 2019 | 109 | 2.5 per 100,000 | 155 | 3.6 per 100,000 | 126 | 2.9 per 100,000 | 1.15 | 0.80 | |
| 40–69 years | 2014 | 7129 | 164.3 per 100,000 | 7648 | 176.2 per 100,000 | 7656 | 176.6 per 100,000 | 1.07 | 1.00 |
| 2015 | 7296 | 165.7 per 100,000 | 8130 | 184.6 per 100,000 | 7984 | 181.8 per 100,000 | 1.10 | 0.98 | |
| 2016 | 7464 | 167.2 per 100,000 | 8639 | 193.5 per 100,000 | 8495 | 191.0 per 100,000 | 1.14 | 0.99 | |
| 2017 | 7554 | 167.5 per 100,000 | 9080 | 201.3 per 100,000 | 8245 | 183.8 per 100,000 | 1.10 | 0.91 | |
| 2018 | 7680 | 168.4 per 100,000 | 9588 | 210.2 per 100,000 | 8566 | 189.2 per 100,000 | 1.12 | 0.90 | |
| 2019 | 7820 | 169.3 per 100,000 | 10,139 | 219.5 per 100,000 | 8725 | 190.6 per 100,000 | 1.13 | 0.87 | |
| 70+ years | 2014 | 6984 | 544.4 per 100,000 | 7334 | 571.7 per 100,000 | 7474 | 584.5 per 100,000 | 1.07 | 1.02 |
| 2015 | 7207 | 544.7 per 100,000 | 7862 | 594.2 per 100,000 | 7824 | 595.5 per 100,000 | 1.09 | 1.00 | |
| 2016 | 7444 | 545.3 per 100,000 | 8434 | 617.9 per 100,000 | 8335 | 616.3 per 100,000 | 1.13 | 1.00 | |
| 2017 | 7796 | 547.4 per 100,000 | 9173 | 644.1 per 100,000 | 9018 | 639.4 per 100,000 | 1.17 | 0.99 | |
| 2018 | 8111 | 549.1 per 100,000 | 9911 | 670.9 per 100,000 | 9269 | 633.2 per 100,000 | 1.15 | 0.94 | |
| 2019 | 8418 | 550.7 per 100,000 | 10,680 | 698.7 per 100,000 | 9871 | 650.4 per 100,000 | 1.18 | 0.93 | |
| Age Group | Year | Forecast Scenario 1 | Forecast Scenario 2 | Actual | Rate Ratio * | ||||
|---|---|---|---|---|---|---|---|---|---|
| Number | Rate | Number | Rate | Number | Rate | Scenario 1 | Scenario 2 | ||
| <40 years | 2014 | 128 | 3.1 per 100,000 | 116 | 2.8 per 100,000 | 149 | 3.6 per 100,000 | 1.17 | 1.28 |
| 2015 | 131 | 3.1 per 100,000 | 124 | 2.9 per 100,000 | 159 | 3.8 per 100,000 | 1.22 | 1.29 | |
| 2016 | 134 | 3.2 per 100,000 | 132 | 3.1 per 100,000 | 199 | 4.7 per 100,000 | 1.49 | 1.53 | |
| 2017 | 138 | 3.2 per 100,000 | 140 | 3.2 per 100,000 | 176 | 4.1 per 100,000 | 1.28 | 1.26 | |
| 2018 | 142 | 3.2 per 100,000 | 150 | 3.4 per 100,000 | 199 | 4.5 per 100,000 | 1.41 | 1.33 | |
| 2019 | 145 | 3.3 per 100,000 | 159 | 3.6 per 100,000 | 190 | 4.3 per 100,000 | 1.31 | 1.19 | |
| 40–69 years | 2014 | 7258 | 170.7 per 100,000 | 7581 | 178.3 per 100,000 | 7849 | 185.7 per 100,000 | 1.09 | 1.04 |
| 2015 | 7398 | 171.6 per 100,000 | 8035 | 186.4 per 100,000 | 8293 | 194.3 per 100,000 | 1.13 | 1.04 | |
| 2016 | 7535 | 172.6 per 100,000 | 8510 | 194.9 per 100,000 | 8709 | 202.2 per 100,000 | 1.17 | 1.02 | |
| 2017 | 7604 | 172.7 per 100,000 | 8918 | 202.5 per 100,000 | 8649 | 199.6 per 100,000 | 1.16 | 0.99 | |
| 2018 | 7704 | 173.1 per 100,000 | 9387 | 210.9 per 100,000 | 8923 | 204.5 per 100,000 | 1.18 | 0.97 | |
| 2019 | 7822 | 173.6 per 100,000 | 9904 | 219.9 per 100,000 | 8804 | 200.0 per 100,000 | 1.15 | 0.91 | |
| 70+ years | 2014 | 5061 | 482.4 per 100,000 | 6336 | 604.0 per 100,000 | 5382 | 514.9 per 100,000 | 1.07 | 0.85 |
| 2015 | 5259 | 482.1 per 100,000 | 6839 | 627.0 per 100,000 | 5762 | 531.5 per 100,000 | 1.10 | 0.85 | |
| 2016 | 5471 | 482.1 per 100,000 | 7389 | 651.2 per 100,000 | 6071 | 538.8 per 100,000 | 1.12 | 0.83 | |
| 2017 | 5771 | 483.1 per 100,000 | 8093 | 677.5 per 100,000 | 6395 | 538.7 per 100,000 | 1.12 | 0.80 | |
| 2018 | 6037 | 483.7 per 100,000 | 8792 | 704.4 per 100,000 | 6845 | 551.0 per 100,000 | 1.14 | 0.78 | |
| 2019 | 6285 | 484.1 per 100,000 | 9506 | 732.3 per 100,000 | 7001 | 540.6 per 100,000 | 1.12 | 0.74 | |
| Age Group | Year | Predicted Scenario 1 | Predicted Scenario 2 | Actual | Rate Ratio * | ||||
|---|---|---|---|---|---|---|---|---|---|
| Number | Rate | Number | Rate | Number | Rate | Scenario 1 | Scenario 2 | ||
| <40 years | 2014 | 25 | 0.6 per 100,000 | 36 | 0.9 per 100,000 | 21 | 0.5 per 100,000 | 0.83 | 0.58 |
| 2015 | 26 | 0.6 per 100,000 | 39 | 0.9 per 100,000 | 26 | 0.6 per 100,000 | 1.00 | 0.67 | |
| 2016 | 27 | 0.6 per 100,000 | 42 | 1.0 per 100,000 | 29 | 0.7 per 100,000 | 1.09 | 0.70 | |
| 2017 | 27 | 0.6 per 100,000 | 45 | 1.1 per 100,000 | 29 | 0.7 per 100,000 | 1.05 | 0.65 | |
| 2018 | 28 | 0.7 per 100,000 | 48 | 1.1 per 100,000 | 21 | 0.5 per 100,000 | 0.74 | 0.43 | |
| 2019 | 29 | 0.7 per 100,000 | 52 | 1.2 per 100,000 | 25 | 0.6 per 100,000 | 0.85 | 0.48 | |
| 40–69 years | 2014 | 13,472 | 310.4 per 100,000 | 14,061 | 324.0 per 100,000 | 14,056 | 324.2 per 100,000 | 1.04 | 1.00 |
| 2015 | 13,797 | 313.3 per 100,000 | 15,131 | 343.6 per 100,000 | 15,012 | 341.8 per 100,000 | 1.09 | 0.99 | |
| 2016 | 14,125 | 313.2 per 100,000 | 16,276 | 360.9 per 100,000 | 15,763 | 354.4 per 100,000 | 1.13 | 0.98 | |
| 2017 | 14,304 | 317.2 per 100,000 | 17,303 | 383.7 per 100,000 | 16,106 | 359.0 per 100,000 | 1.13 | 0.94 | |
| 2018 | 14,553 | 319.0 per 100,000 | 18,489 | 405.3 per 100,000 | 15,825 | 349.6 per 100,000 | 1.10 | 0.86 | |
| 2019 | 14,828 | 321.1 per 100,000 | 19,786 | 428.4 per 100,000 | 15,634 | 341.5 per 100,000 | 1.06 | 0.80 | |
| 70+ years | 2014 | 11,502 | 896.5 per 100,000 | 13,457 | 1,048.9 per 100,000 | 11,867 | 928.0 per 100,000 | 1.04 | 0.88 |
| 2015 | 11,887 | 898.5 per 100,000 | 14,596 | 1,103.2 per 100,000 | 12,640 | 962.0 per 100,000 | 1.07 | 0.87 | |
| 2016 | 12,295 | 900.7 per 100,000 | 15,844 | 1,160.7 per 100,000 | 13,016 | 962.4 per 100,000 | 1.07 | 0.83 | |
| 2017 | 12,911 | 906.6 per 100,000 | 17,452 | 1,225.5 per 100,000 | 13,722 | 973.0 per 100,000 | 1.07 | 0.79 | |
| 2018 | 13,457 | 911.0 per 100,000 | 19,089 | 1,292.2 per 100,000 | 14,414 | 984.8 per 100,000 | 1.08 | 0.76 | |
| 2019 | 13,980 | 914.5 per 100,000 | 20,818 | 1,361.8 per 100,000 | 14,640 | 964.7 per 100,000 | 1.05 | 0.71 | |
| Age Group | Year | Predicted Scenario 1 | Predicted Scenario 2 | Actual | Rate Ratio * | ||||
|---|---|---|---|---|---|---|---|---|---|
| Number | Rate | Number | Rate | Number | Rate | Scenario 1 | Scenario 2 | ||
| <40 years | 2014 | 25 | 0.6 per 100,000 | 31 | 0.7 per 100,000 | 20 | 0.5 per 100,000 | 0.79 | 0.65 |
| 2015 | 26 | 0.6 per 100,000 | 33 | 0.8 per 100,000 | 20 | 0.5 per 100,000 | 0.78 | 0.61 | |
| 2016 | 27 | 0.6 per 100,000 | 36 | 0.8 per 100,000 | 27 | 0.6 per 100,000 | 1.02 | 0.77 | |
| 2017 | 27 | 0.6 per 100,000 | 38 | 0.9 per 100,000 | 27 | 0.6 per 100,000 | 0.99 | 0.71 | |
| 2018 | 28 | 0.6 per 100,000 | 41 | 0.9 per 100,000 | 27 | 0.6 per 100,000 | 0.95 | 0.65 | |
| 2019 | 29 | 0.7 per 100,000 | 45 | 1.0 per 100,000 | 27 | 0.6 per 100,000 | 0.92 | 0.60 | |
| 40-69 years | 2014 | 10,859 | 255.3 per 100,000 | 11,690 | 274.9 per 100,000 | 11,641 | 275.4 per 100,000 | 1.08 | 1.00 |
| 2015 | 11,091 | 257.3 per 100,000 | 12,539 | 290.9 per 100,000 | 12,670 | 296.8 per 100,000 | 1.15 | 1.02 | |
| 2016 | 11,320 | 259.3 per 100,000 | 13,439 | 307.9 per 100,000 | 13,088 | 303.9 per 100,000 | 1.17 | 0.99 | |
| 2017 | 11,427 | 259.4 per 100,000 | 14,241 | 323.3 per 100,000 | 13,689 | 315.8 per 100,000 | 1.22 | 0.98 | |
| 2018 | 11,590 | 260.4 per 100,000 | 15,165 | 340.7 per 100,000 | 13,924 | 319.1 per 100,000 | 1.23 | 0.94 | |
| 2019 | 11,782 | 261.5 per 100,000 | 16,188 | 359.3 per 100,000 | 13,911 | 316.0 per 100,000 | 1.21 | 0.88 | |
| 70+ years | 2014 | 8274 | 788.7 per 100,000 | 9902 | 943.8 per 100,000 | 8798 | 841.7 per 100,000 | 1.07 | 0.89 |
| 2015 | 8602 | 788.7 per 100,000 | 10,809 | 991.1 per 100,000 | 9310 | 858.8 per 100,000 | 1.09 | 0.87 | |
| 2016 | 8952 | 788.9 per 100,000 | 11,811 | 1,040.9 per 100,000 | 9581 | 850.3 per 100,000 | 1.08 | 0.82 | |
| 2017 | 9449 | 791.0 per 100,000 | 13,091 | 1,095.8 per 100,000 | 10,460 | 881.1 per 100,000 | 1.11 | 0.80 | |
| 2018 | 9889 | 792.3 per 100,000 | 14,385 | 1,152.6 per 100,000 | 10,768 | 866.8 per 100,000 | 1.09 | 0.75 | |
| 2019 | 10,295 | 793.1 per 100,000 | 15,730 | 1,211.7 per 100,000 | 11,369 | 877.9 per 100,000 | 1.11 | 0.72 | |
Publisher’s Note: MDPI stays neutral with regard to jurisdictional claims in published maps and institutional affiliations. |
© 2022 by the authors. Licensee MDPI, Basel, Switzerland. This article is an open access article distributed under the terms and conditions of the Creative Commons Attribution (CC BY) license (https://creativecommons.org/licenses/by/4.0/).
Share and Cite
Ackerman, I.N.; Soh, S.-E.; de Steiger, R. Actual versus Forecast Burden of Primary Hip and Knee Replacement Surgery in Australia: Analysis of Data from the Australian Orthopaedic Association National Joint Replacement Registry. J. Clin. Med. 2022, 11, 1883. https://doi.org/10.3390/jcm11071883
Ackerman IN, Soh S-E, de Steiger R. Actual versus Forecast Burden of Primary Hip and Knee Replacement Surgery in Australia: Analysis of Data from the Australian Orthopaedic Association National Joint Replacement Registry. Journal of Clinical Medicine. 2022; 11(7):1883. https://doi.org/10.3390/jcm11071883
Chicago/Turabian StyleAckerman, Ilana N., Sze-Ee Soh, and Richard de Steiger. 2022. "Actual versus Forecast Burden of Primary Hip and Knee Replacement Surgery in Australia: Analysis of Data from the Australian Orthopaedic Association National Joint Replacement Registry" Journal of Clinical Medicine 11, no. 7: 1883. https://doi.org/10.3390/jcm11071883
APA StyleAckerman, I. N., Soh, S.-E., & de Steiger, R. (2022). Actual versus Forecast Burden of Primary Hip and Knee Replacement Surgery in Australia: Analysis of Data from the Australian Orthopaedic Association National Joint Replacement Registry. Journal of Clinical Medicine, 11(7), 1883. https://doi.org/10.3390/jcm11071883