Mathematical Modeling to Predict COVID-19 Infection and Vaccination Trends
Abstract
:1. Introduction
2. Materials and Methods
2.1. Data Collection and Parameters Analyzed
2.2. ARIMA
2.3. Statistical Analyses
3. Results
4. Discussion
5. Conclusions
Author Contributions
Funding
Institutional Review Board Statement
Informed Consent Statement
Data Availability Statement
Conflicts of Interest
References
- Van der Hoek, L. Human coronaviruses: What do they cause? Antivir. Ther. 2007, 12, 651–658. [Google Scholar] [PubMed]
- Harapan, H.; Itoh, N.; Yufika, A.; Winardi, W.; Keam, S.; Te, H.; Megawati, D.; Hayati, Z.; Wagner, A.L.; Mudatsir, M. Coronavirus disease 2019 (COVID-19): A literature review. J. Infect. Public Health 2020, 13, 667–673. [Google Scholar] [CrossRef] [PubMed]
- Zhou, N.; He, S.; Zhang, T.; Zou, W.; Shu, L.; Sharp, G.B.; Webster, R.G. Influenza infection in humans and pigs in southeastern China. Arch. Virol. 1996, 141, 649–661. [Google Scholar] [CrossRef] [PubMed]
- Yang, Y.; Peng, F.; Wang, R.; Yange, M.; Guan, K.; Jiang, T.; Xu, G.; Sun, J.; Chang, C. The deadly coronaviruses: The 2003 SARS pandemic and the 2020 novel coronavirus epidemic in China. J. Autoimmun. 2020, 109, 102434. [Google Scholar] [CrossRef]
- Ji, J.S. Origins of MERS-CoV, and lessons for 2019-nCoV. Lancet Planet. Health 2020, 4, e93. [Google Scholar] [CrossRef] [Green Version]
- Su, S.; Wong, G.; Liu, Y.; Gao, G.F.; Li, S.; Bi, Y. MERS in South Korea and China: A potential outbreak threat? Lancet 2015, 385, 2349–2350. [Google Scholar] [CrossRef]
- Yuki, K.; Fujiogi, M.; Koutsogiannaki, S. COVID-19 pathophysiology: A review. Clin. Immunol. 2020, 215, 108427. [Google Scholar] [CrossRef]
- Zhu, N.; Zhang, D.; Wang, W.; Li, X.; Yang, B.; Song, J.; Zhao, X.; Huang, B.; Shi, W.; Lu, R.; et al. A Novel Coronavirus from Patients with Pneumonia in China, 2019. N. Engl. J. Med. 2020, 382, 727–733. [Google Scholar] [CrossRef]
- Wu, F.; Zhao, S.; Yu, B.; Chen, Y.-M.; Wang, W.; Song, Z.-G.; Hu, Y.; Tao, Z.-W.; Tian, J.-H.; Pei, Y.-Y.; et al. A new coronavirus associated with human respiratory disease in China. Nature 2020, 579, 265–269. [Google Scholar] [CrossRef] [Green Version]
- Chen, Z.-L.; Zhang, Q.; Lu, Y.; Guo, Z.-M.; Zhang, X.; Zhang, W.-J.; Guo, C.; Liao, C.-H.; Li, Q.-L.; Han, X.-H.; et al. Distribution of the COVID-19 epidemic and correlation with population emigration from Wuhan, China. Chin. Med. J. 2020, 133, 1044–1050. [Google Scholar] [CrossRef]
- Kim, H.-J.; Hwang, H.; Hong, H.; Yim, J.-J.; Lee, J. A systematic review and meta-analysis of regional risk factors for critical outcomes of COVID-19 during early phase of the pandemic. Sci. Rep. 2021, 11, 9784. [Google Scholar] [CrossRef] [PubMed]
- Dascalu, S. The Successes and Failures of the Initial COVID-19 Pandemic Response in Romania. Front. Public Health 2020, 8, 344. [Google Scholar] [CrossRef] [PubMed]
- Al-Salem, W.; Moraga, P.; Ghazi, H.; Madad, S.; Hotez, P.J. The emergence and transmission of COVID-19 in European countries, 2019–2020: A comprehensive review of timelines, cases and containment. Int. Health 2021, 13, 383–398. [Google Scholar] [CrossRef] [PubMed]
- Vlădescu, C.; Scîntee, S.G.; Olsavszky, V.; Hernández-Quevedo, C.; Sagan, A. Romania: Health system review. Health Syst. Transit. 2016, 10, 1–172. [Google Scholar]
- Pullano, G.; Pinotti, F.; Valdano, E.; Boëlle, P.-Y.; Poletto, C.; Colizza, V. Novel coronavirus (2019-nCoV) early-stage importation risk to Europe, January 2020. Euro Surveill. 2020, 25, 2000057. [Google Scholar] [CrossRef] [PubMed] [Green Version]
- Wang, L.; Li, J.; Guo, S.; Xie, N.; Yao, L.; Cao, Y.; Day, S.W.; Howard, S.C.; Graff, J.C.; Gu, T.; et al. Real-time estimation and prediction of mortality caused by COVID-19 with patient information based algorithm. Sci. Total Environ. 2020, 727, 138394. [Google Scholar] [CrossRef]
- Smith, G.D. Epidemiology, epigenetics and the ‘Gloomy Prospect’: Embracing randomness in population health research and practice. Int. J. Epidemiol. 2011, 40, 537–562. [Google Scholar] [CrossRef] [Green Version]
- Forni, G.; Mantovani, A.; Forni, G.; Mantovani, A.; Moretta, L.; Rappuoli, R.; Rezza, G.; Bagnasco, A.; Barsacchi, G.; Bussolati, G.; et al. COVID-19 vaccines: Where we stand and challenges ahead. Cell Death Differ. 2021, 28, 626–639. [Google Scholar] [CrossRef]
- Yan, Z.-P.; Yang, M.; Lai, C.-L. COVID-19 Vaccines: A Review of the Safety and Efficacy of Current Clinical Trials. Pharmaceuticals 2021, 14, 406. [Google Scholar] [CrossRef]
- Wu, Q.; Dudley, M.Z.; Chen, X.; Bai, X.; Dong, K.; Zhuang, T.; Salmon, D.; Yu, H. Evaluation of the safety profile of COVID-19 vaccines: A rapid review. BMC Med. 2021, 19, 173. [Google Scholar] [CrossRef]
- Francis, A.I.; Ghany, S.; Gilkes, T.; Umakanthan, S. Review of COVID-19 vaccine subtypes, efficacy and geographical distributions. Postgrad. Med. J. 2021. ahead-of-print. [Google Scholar] [CrossRef] [PubMed]
- Smit, M.; Marinosci, A.; Agoritsas, T.; Calmy, A. Prophylaxis for COVID-19: A systematic review. Clin. Microbiol. Infect. 2021, 27, 532–537. [Google Scholar] [CrossRef] [PubMed]
- Ilie, O.-D.; Ciobica, A.; Doroftei, B. Testing the Accuracy of the ARIMA Models in Forecasting the Spreading of COVID-19 and the Associated Mortality Rate. Medicina 2020, 56, 566. [Google Scholar] [CrossRef] [PubMed]
- Ilie, O.-D.; Cojocariu, R.-O.; Ciobica, A.; Timofte, S.-I.; Mavroudis, I.; Doroftei, B. Forecasting the spreading of COVID-19 across nine countries from Europe, Asia, and the American continents using the arima models. Microorganisms 2020, 8, 1158. [Google Scholar] [CrossRef] [PubMed]
- Elevli, S.; Uzgören, N.; Bingöl, D.; Elevli, B. Drinking water quality control: Control charts for turbidity and pH. J. Water Sanit. Hyg. Dev. 2016, 6, 511–518. [Google Scholar] [CrossRef]
- He, Z.; Tao, H. Epidemiology and ARIMA model of positive-rate of influenza viruses among children in Wuhan, China: A nine-year retrospective study. Int. J. Infect. Dis. 2018, 74, 61–70. [Google Scholar] [CrossRef] [PubMed] [Green Version]
- Chen, P.; Niu, A.; Liu, D.; Jiang, W.; Ma, B. Time Series Forecasting of Temperatures using SARIMA: An Example from Nanjing. IOP Conf. Ser. Mater. Sci. Eng. 2018, 394, 52024. [Google Scholar] [CrossRef]
- Cihan, P. Forecasting fully vaccinated people against COVID-19 and examining future vaccination rate for herd immunity in the US, Asia, Europe, Africa, South America, and the World. Appl. Soft Comput. 2021, 111, 107708. [Google Scholar] [CrossRef]
- Sycinska-Dziarnowska, M.; Paradowska-Stankiewicz, I.; Woźniak, K. The Global Interest in Vaccines and Its Prediction and Perspectives in the Era of COVID-19. Real-Time Surveillance Using Google Trends. Int. J. Environ. Res. Public Health 2021, 18, 7841. [Google Scholar] [CrossRef]
- Chelo, D.; Nguefack, F.; Enyama, D.; Nansseu, R.; Feudjo Tefoueyet, G.; Mbassi Awa, H.D.; Mekone Nkwelle, I.; Nguefack-Tsague, G.; Ndenbe, P.; Koki Ndombo, P.O. Impact and projections of the COVID-19 epidemic on attendance and routine vaccinations at a pediatric referral hospital in Cameroon. Arch. Pédiatr. 2021, 28, 441–450. [Google Scholar] [CrossRef]
- Lumbreras-Marquez, M.I.; Fields, K.G.; Campos-Zamora, M.; Rodriguez-Bosch, M.R.; Rodriguez-Sibaja, M.J.; Copado-Mendoza, D.Y.; Acevedo-Gallegos, S.; Farber, M.K. A forecast of maternal deaths with and without vaccination of pregnant women against COVID-19 in Mexico. Int. J. Gynecol. Obstet. 2021, 154, 566–567. [Google Scholar] [CrossRef] [PubMed]
- Hwang, E. Prediction intervals of the COVID-19 cases by HAR models with growth rates and vaccination rates in top eight affected countries: Bootstrap improvement. Chaos Solitons Fractals 2022, 155, 111789. [Google Scholar] [CrossRef] [PubMed]
- Chaturvedi, D.; Chakravarty, U. Predictive analysis of COVID-19 eradication with vaccination in India, Brazil, and U.S.A. Infect. Genet. Evol. 2021, 92, 104834. [Google Scholar] [CrossRef]
- Kermack, W.O.; McKendrick, A.G.; Walker, G.T. A contribution to the mathematical theory of epidemics. Proc. R. Soc. London. Ser. A Contain. Pap. Math. Phys. Character 1927, 115, 700–721. [Google Scholar] [CrossRef] [Green Version]
- Zhang, J.; Wang, D.; Yang, K.; Xu, Y. A multinomial autoregressive model for finite-range time series of counts. J. Stat. Plan. Inference 2020, 207, 320–343. [Google Scholar] [CrossRef]
- Bartolucci, F.; Pennoni, F.; Mira, A. A multivariate statistical approach to predict COVID-19 count data with epidemiological interpretation and uncertainty quantification. Stat. Med. 2021, 40, 5351–5372. [Google Scholar] [CrossRef]
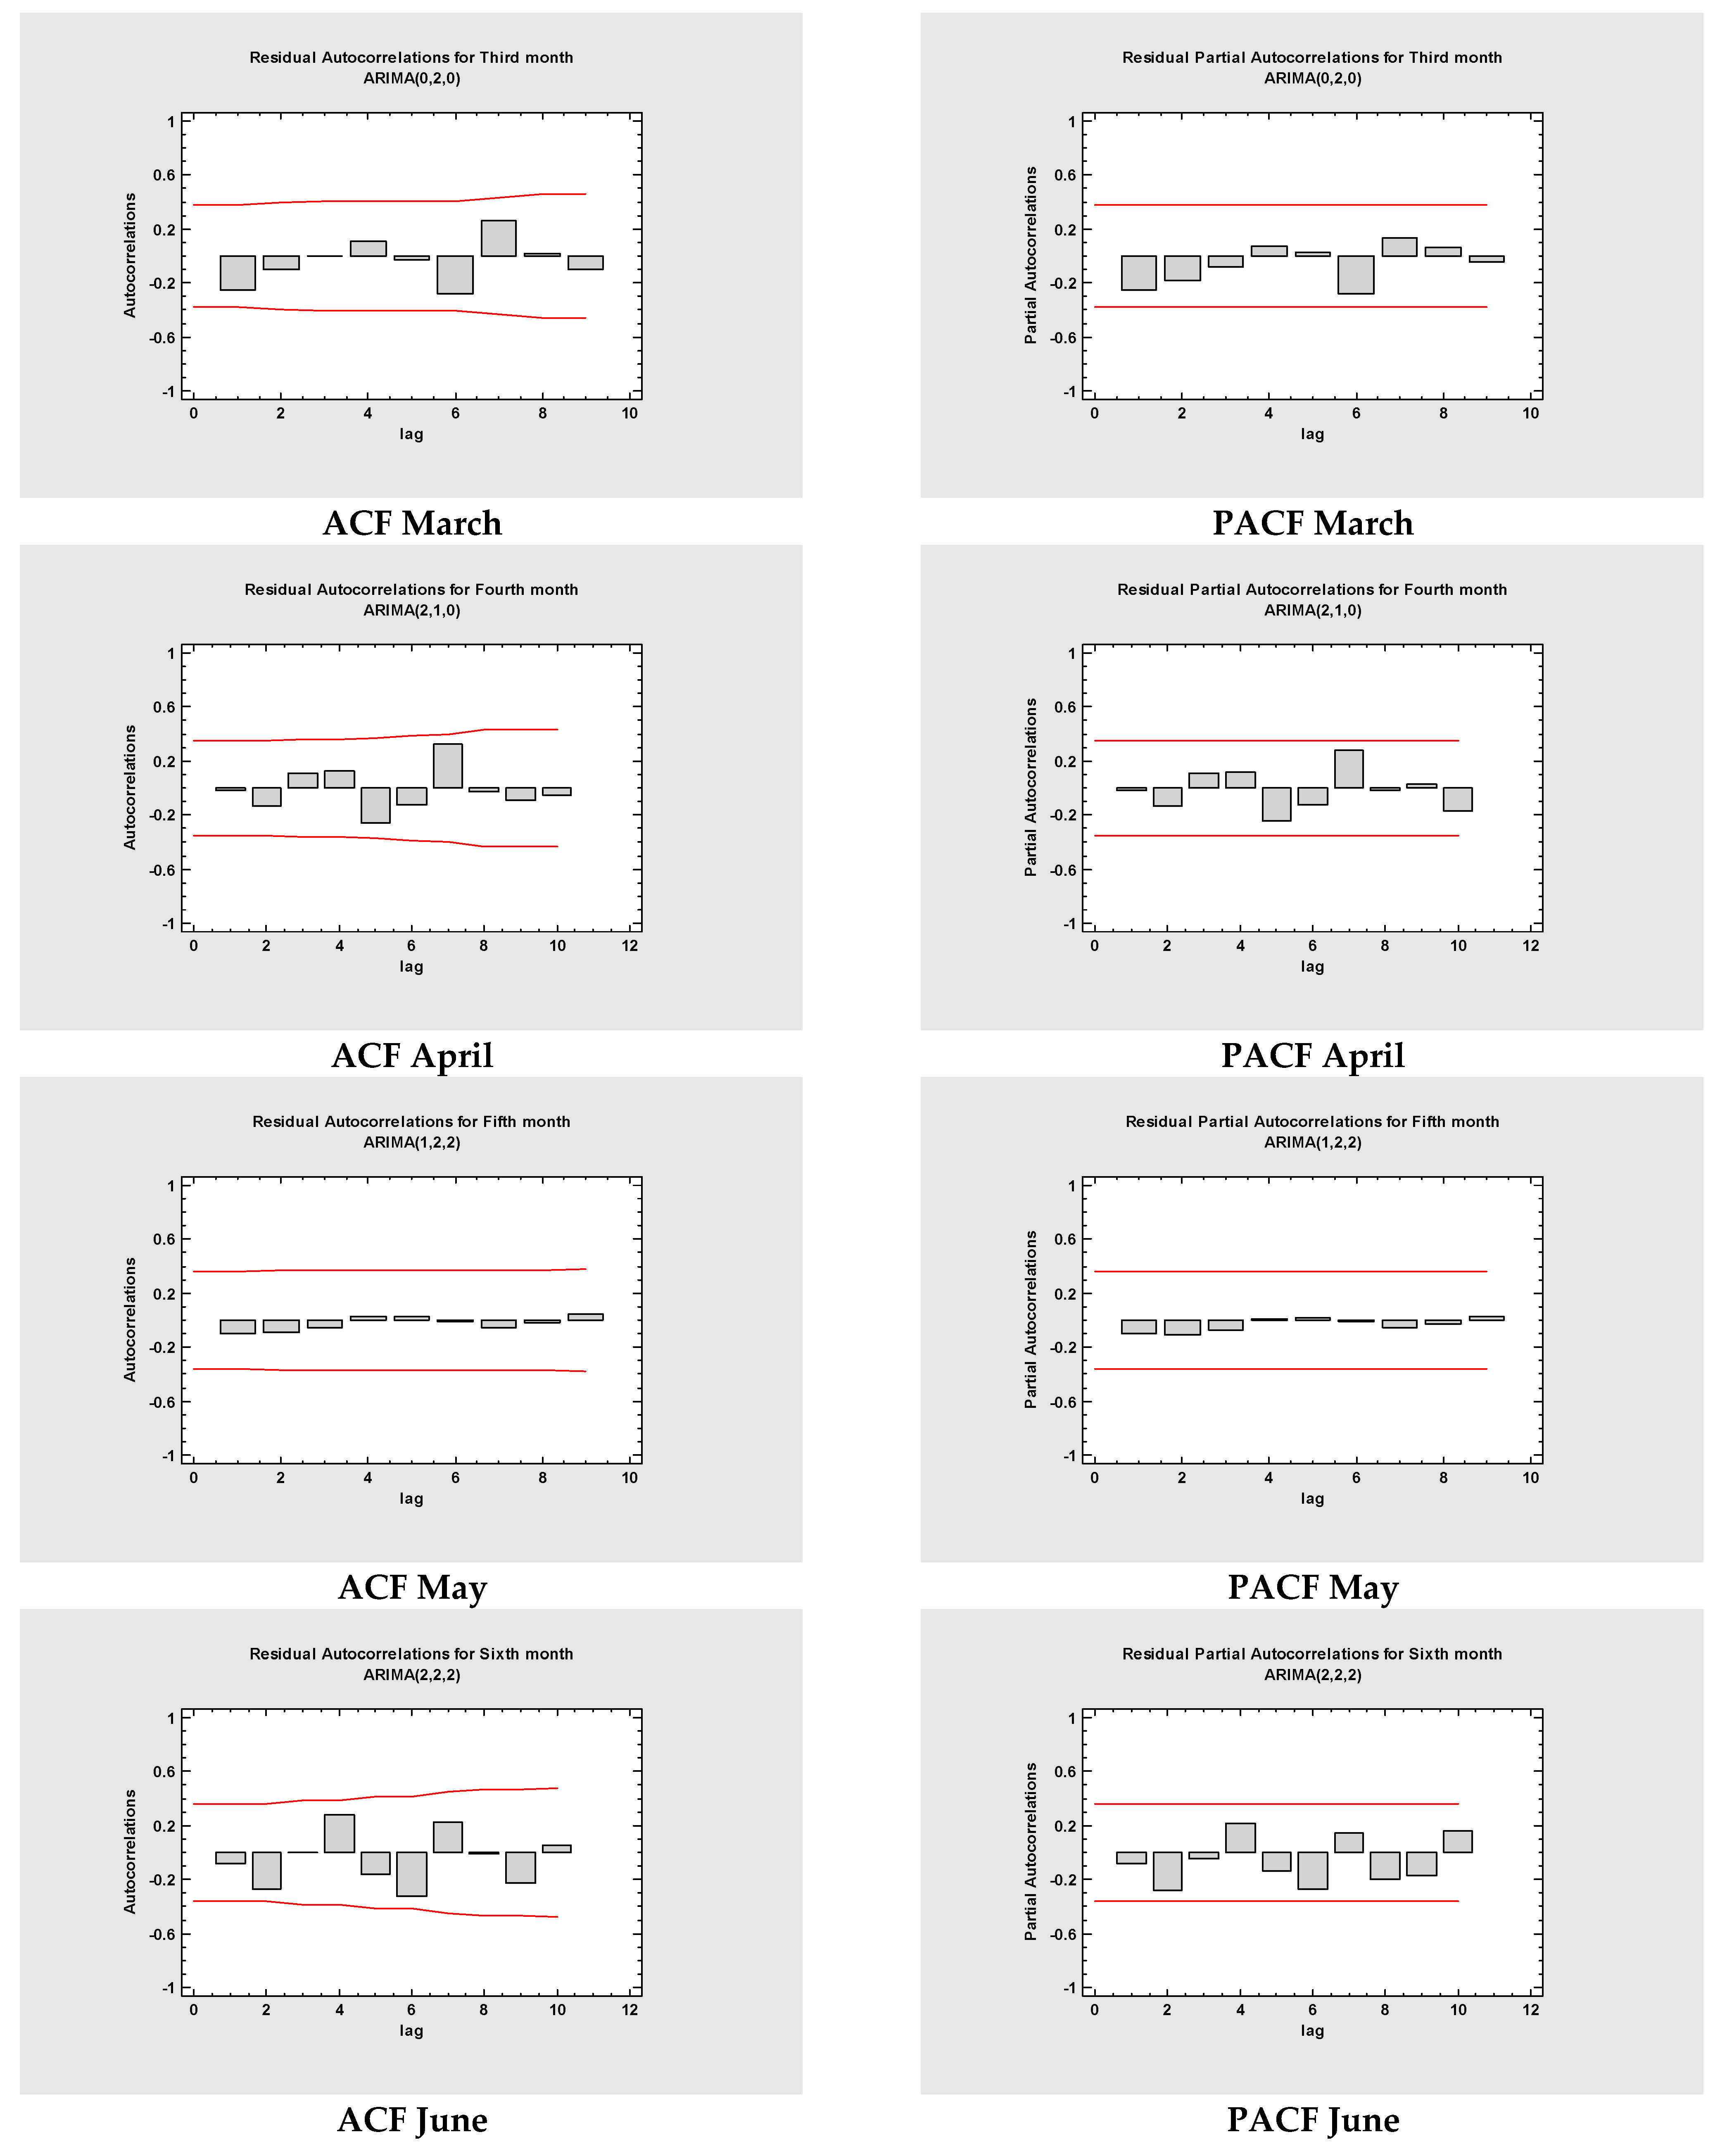
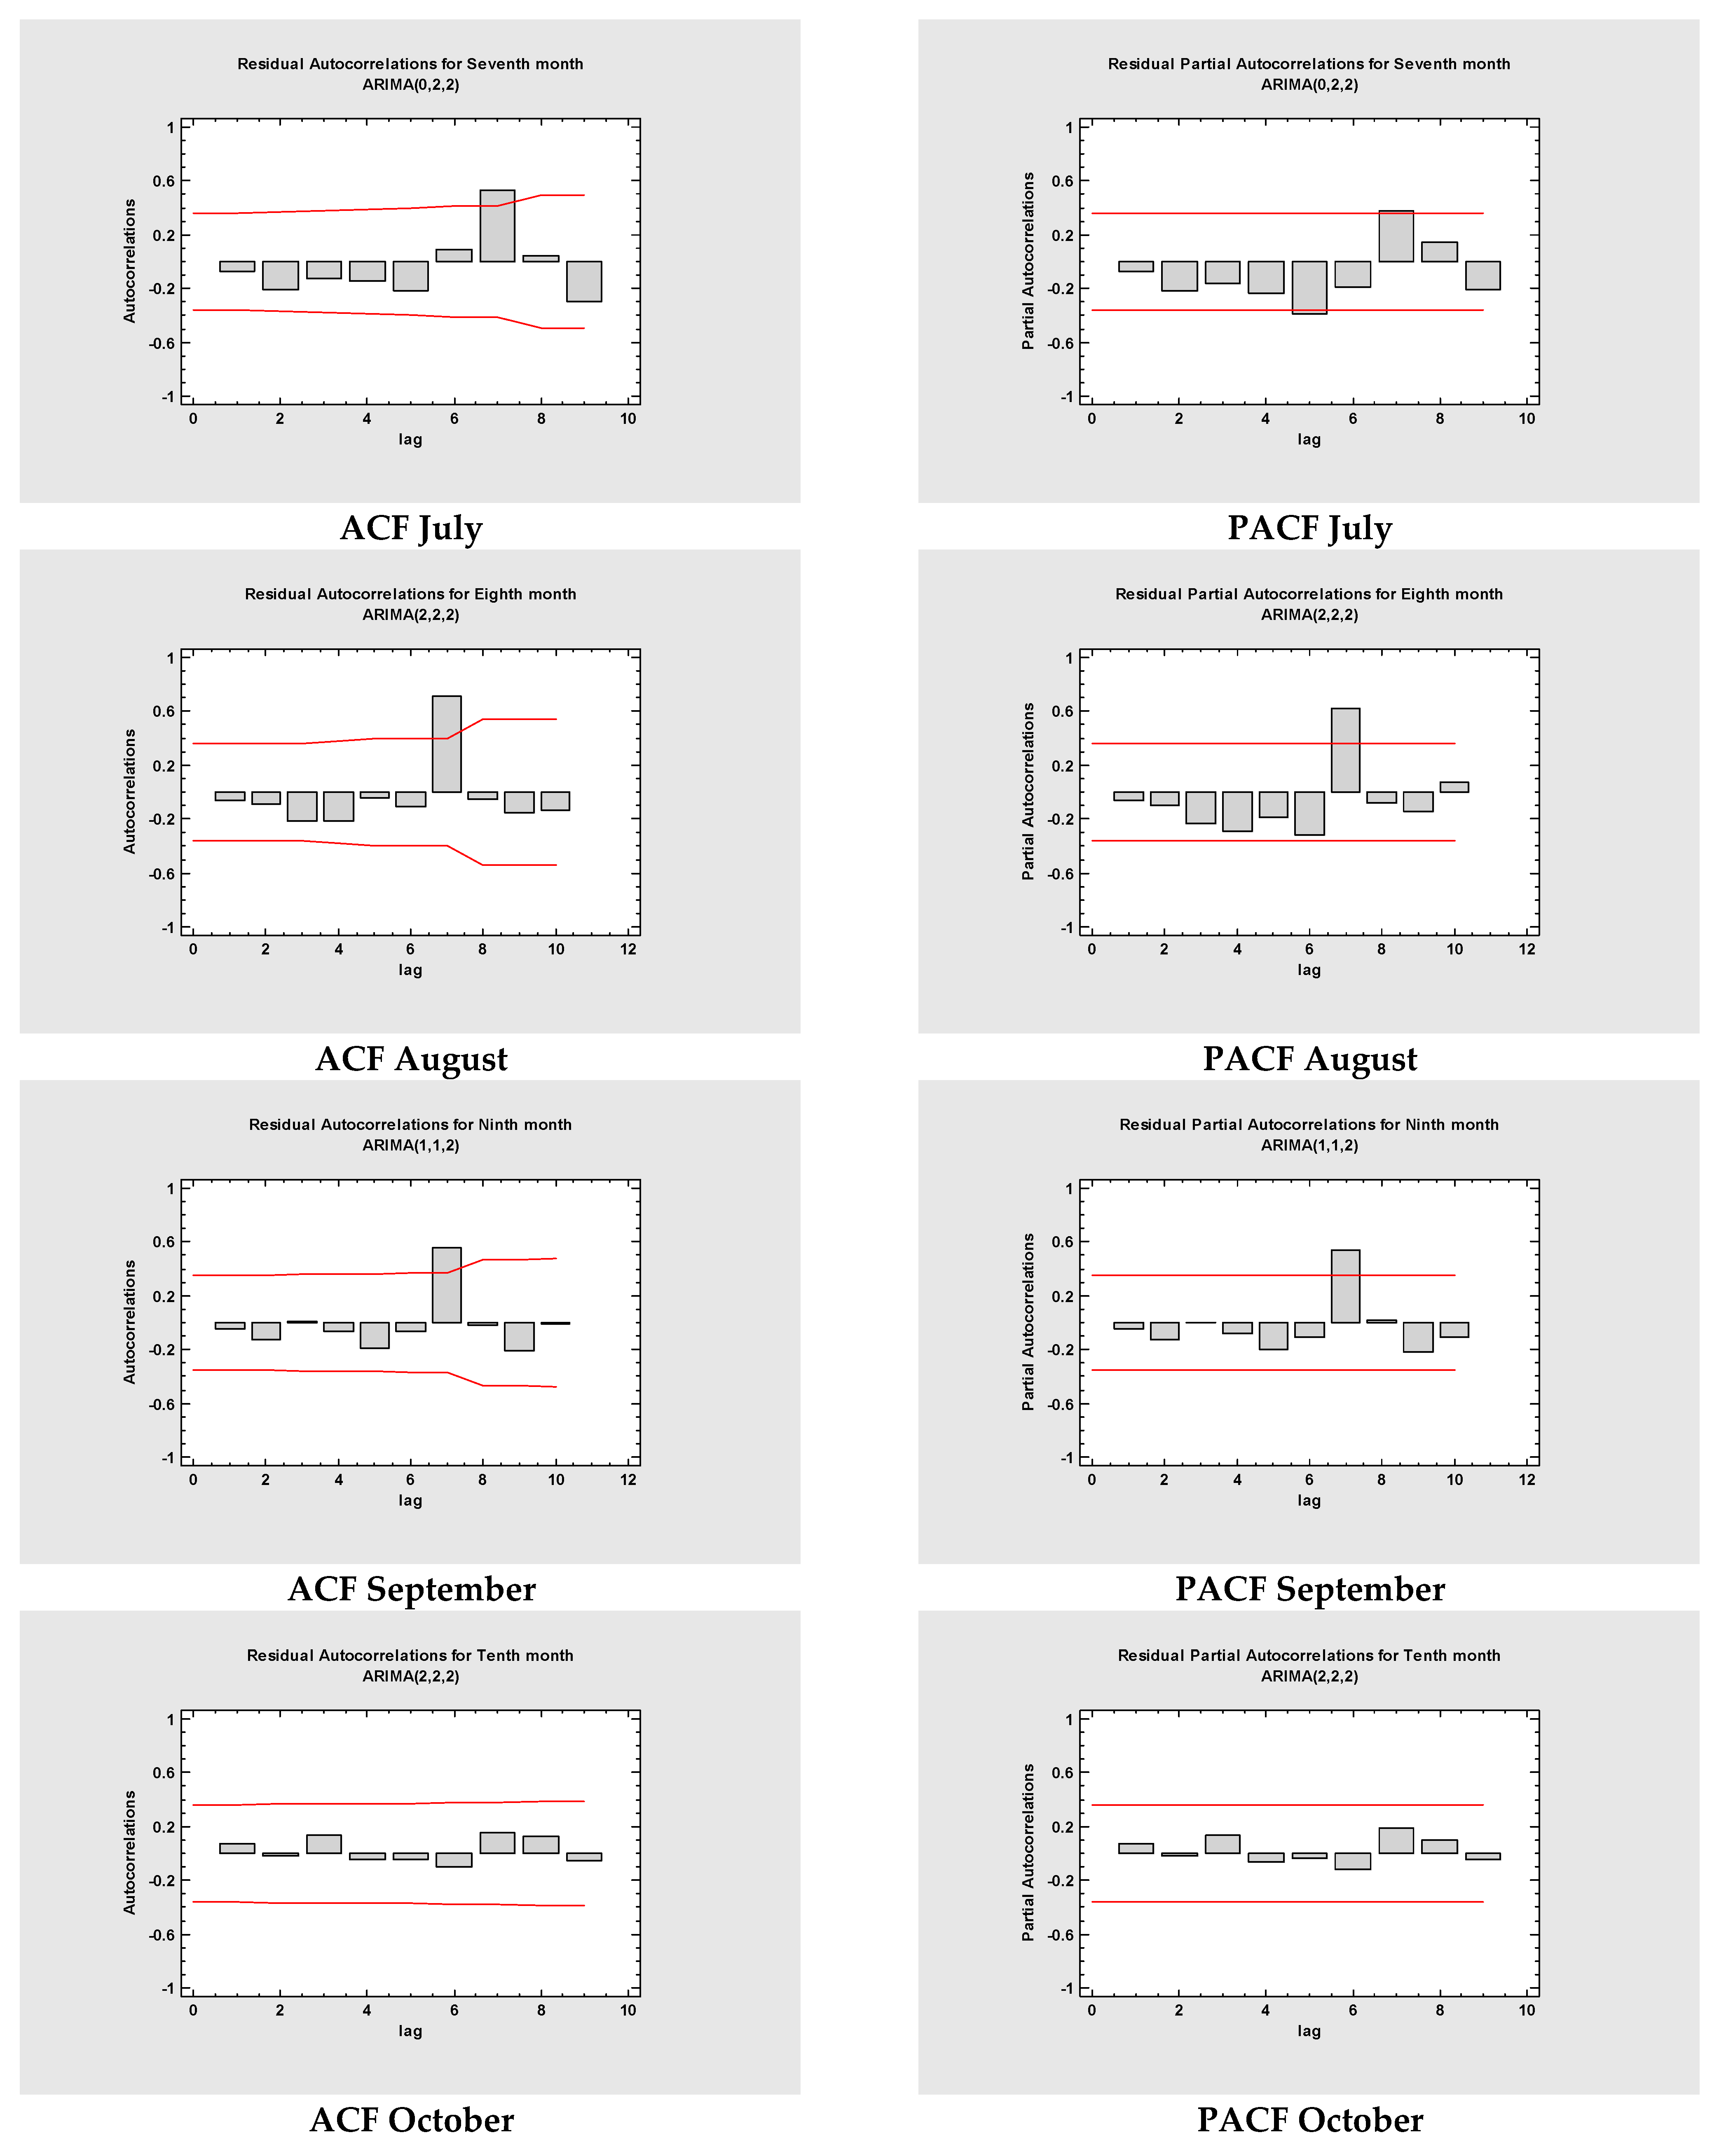
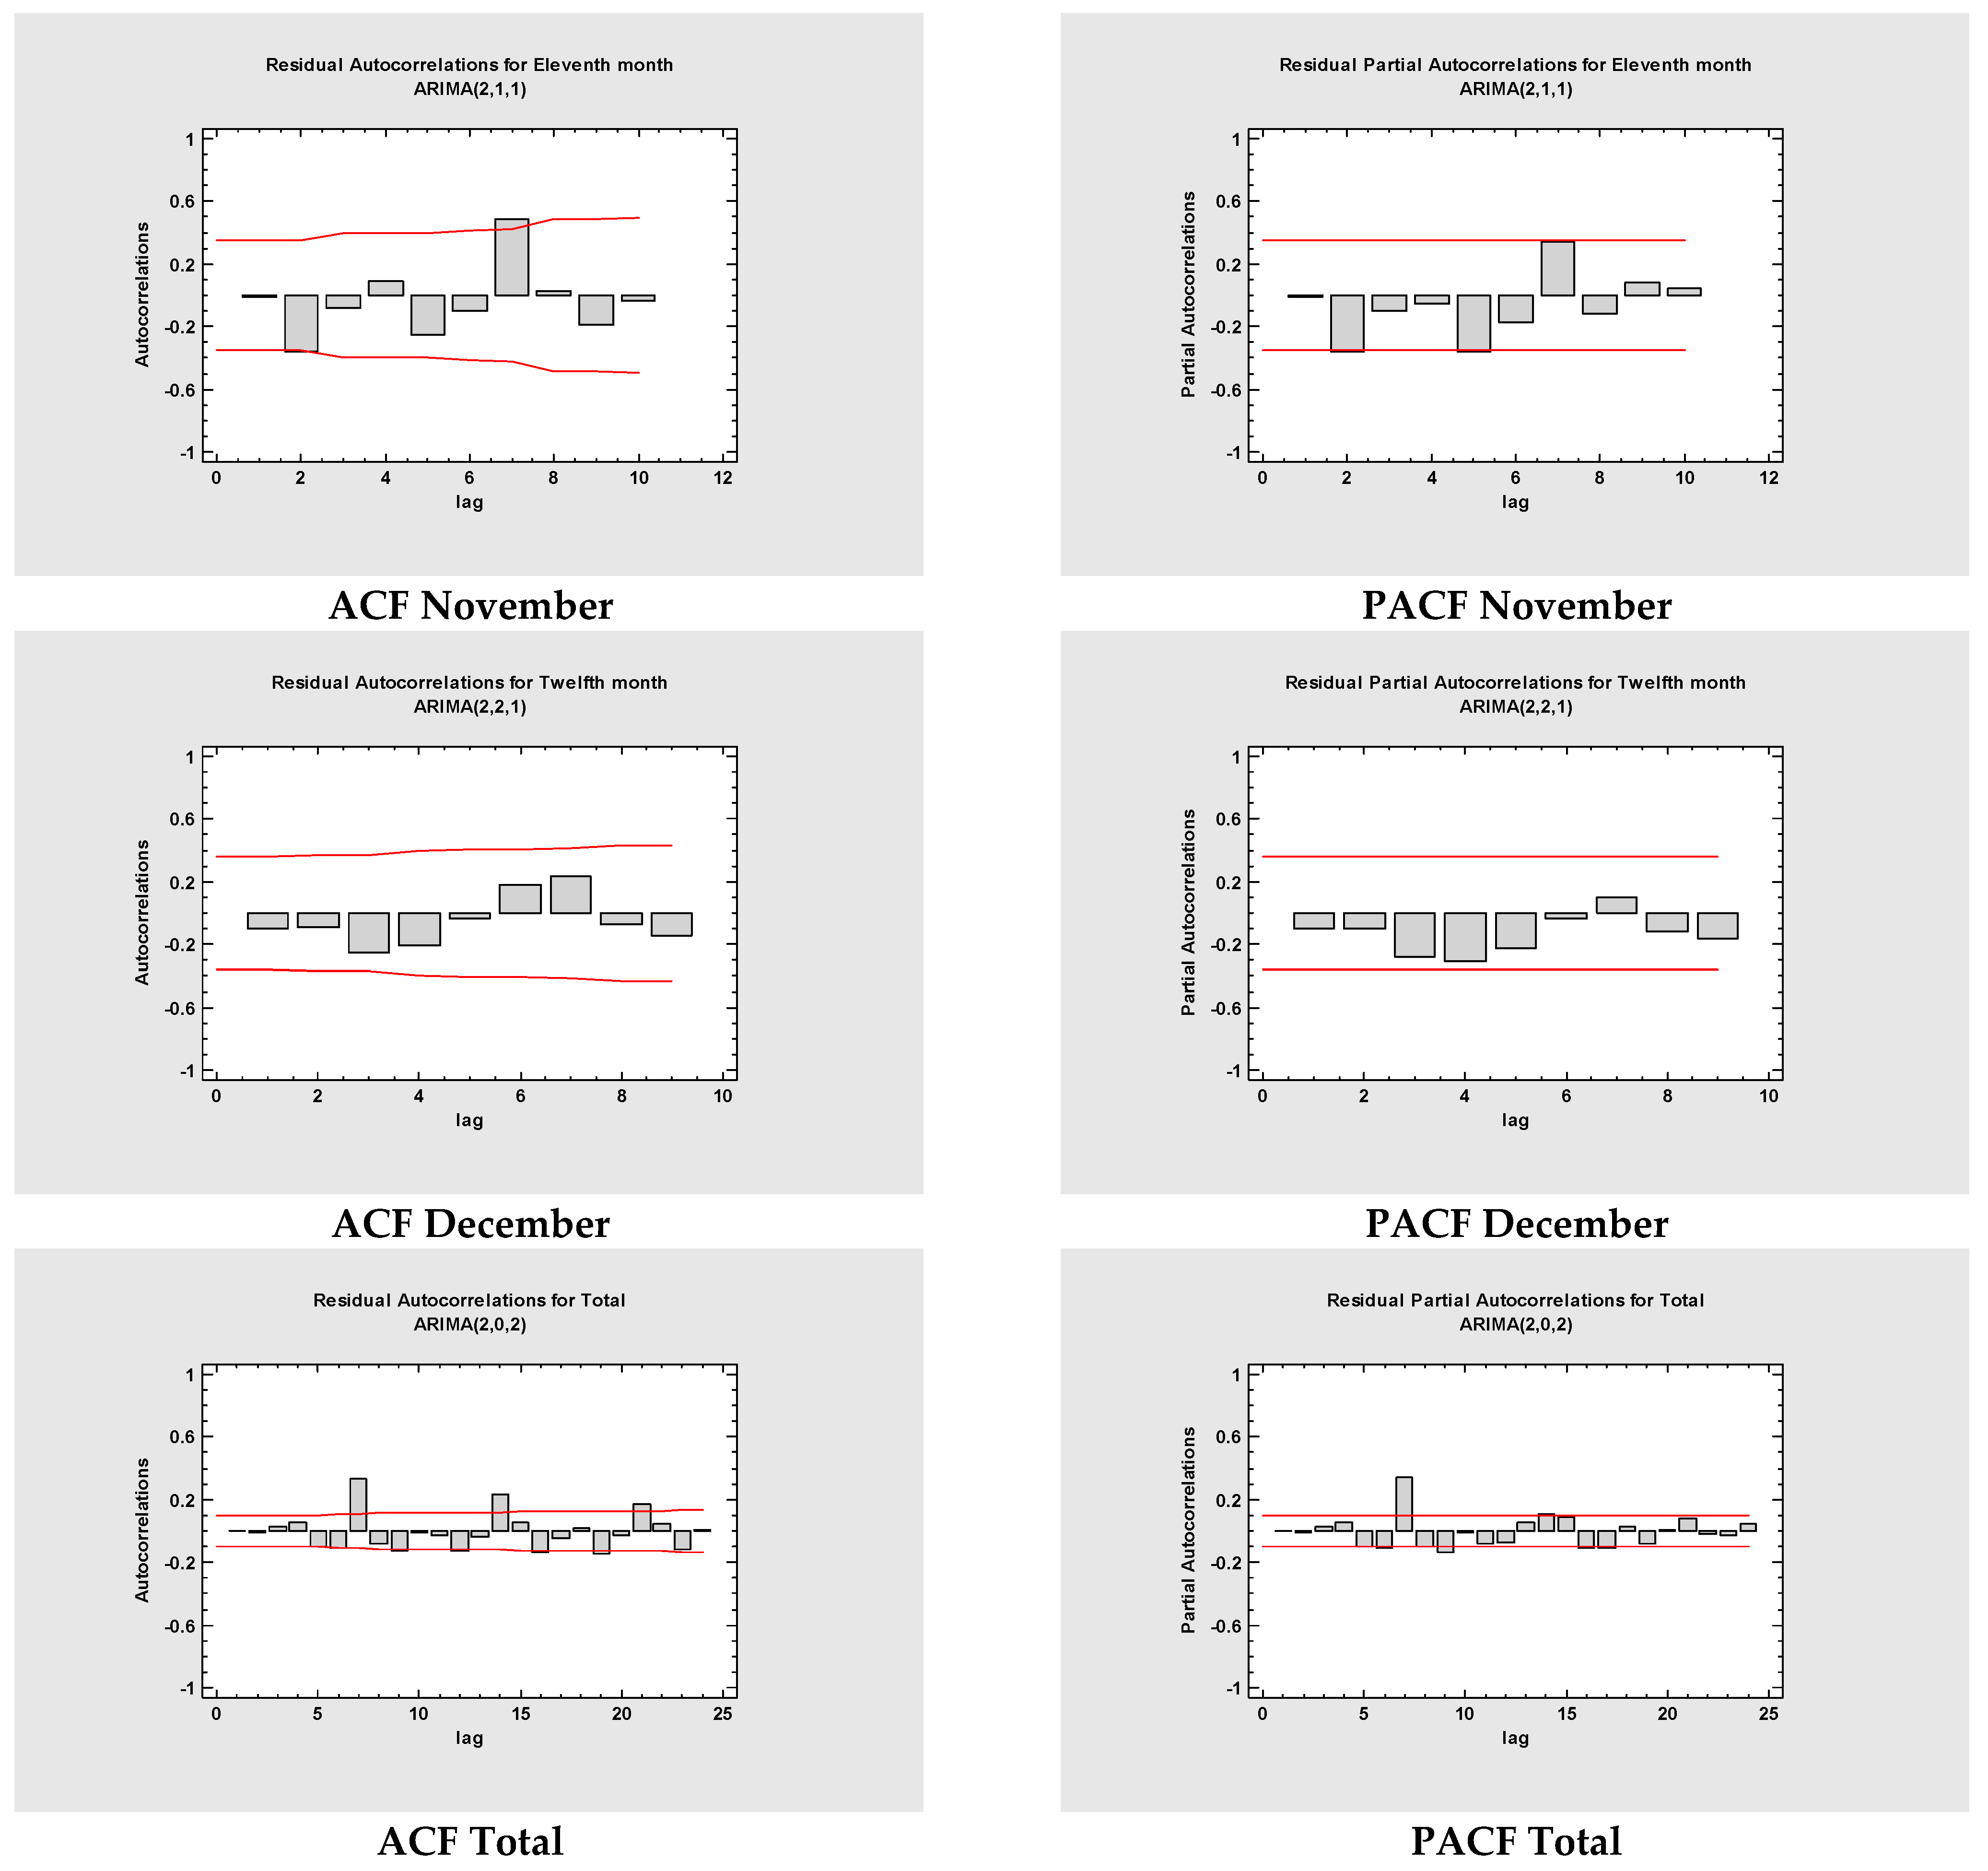

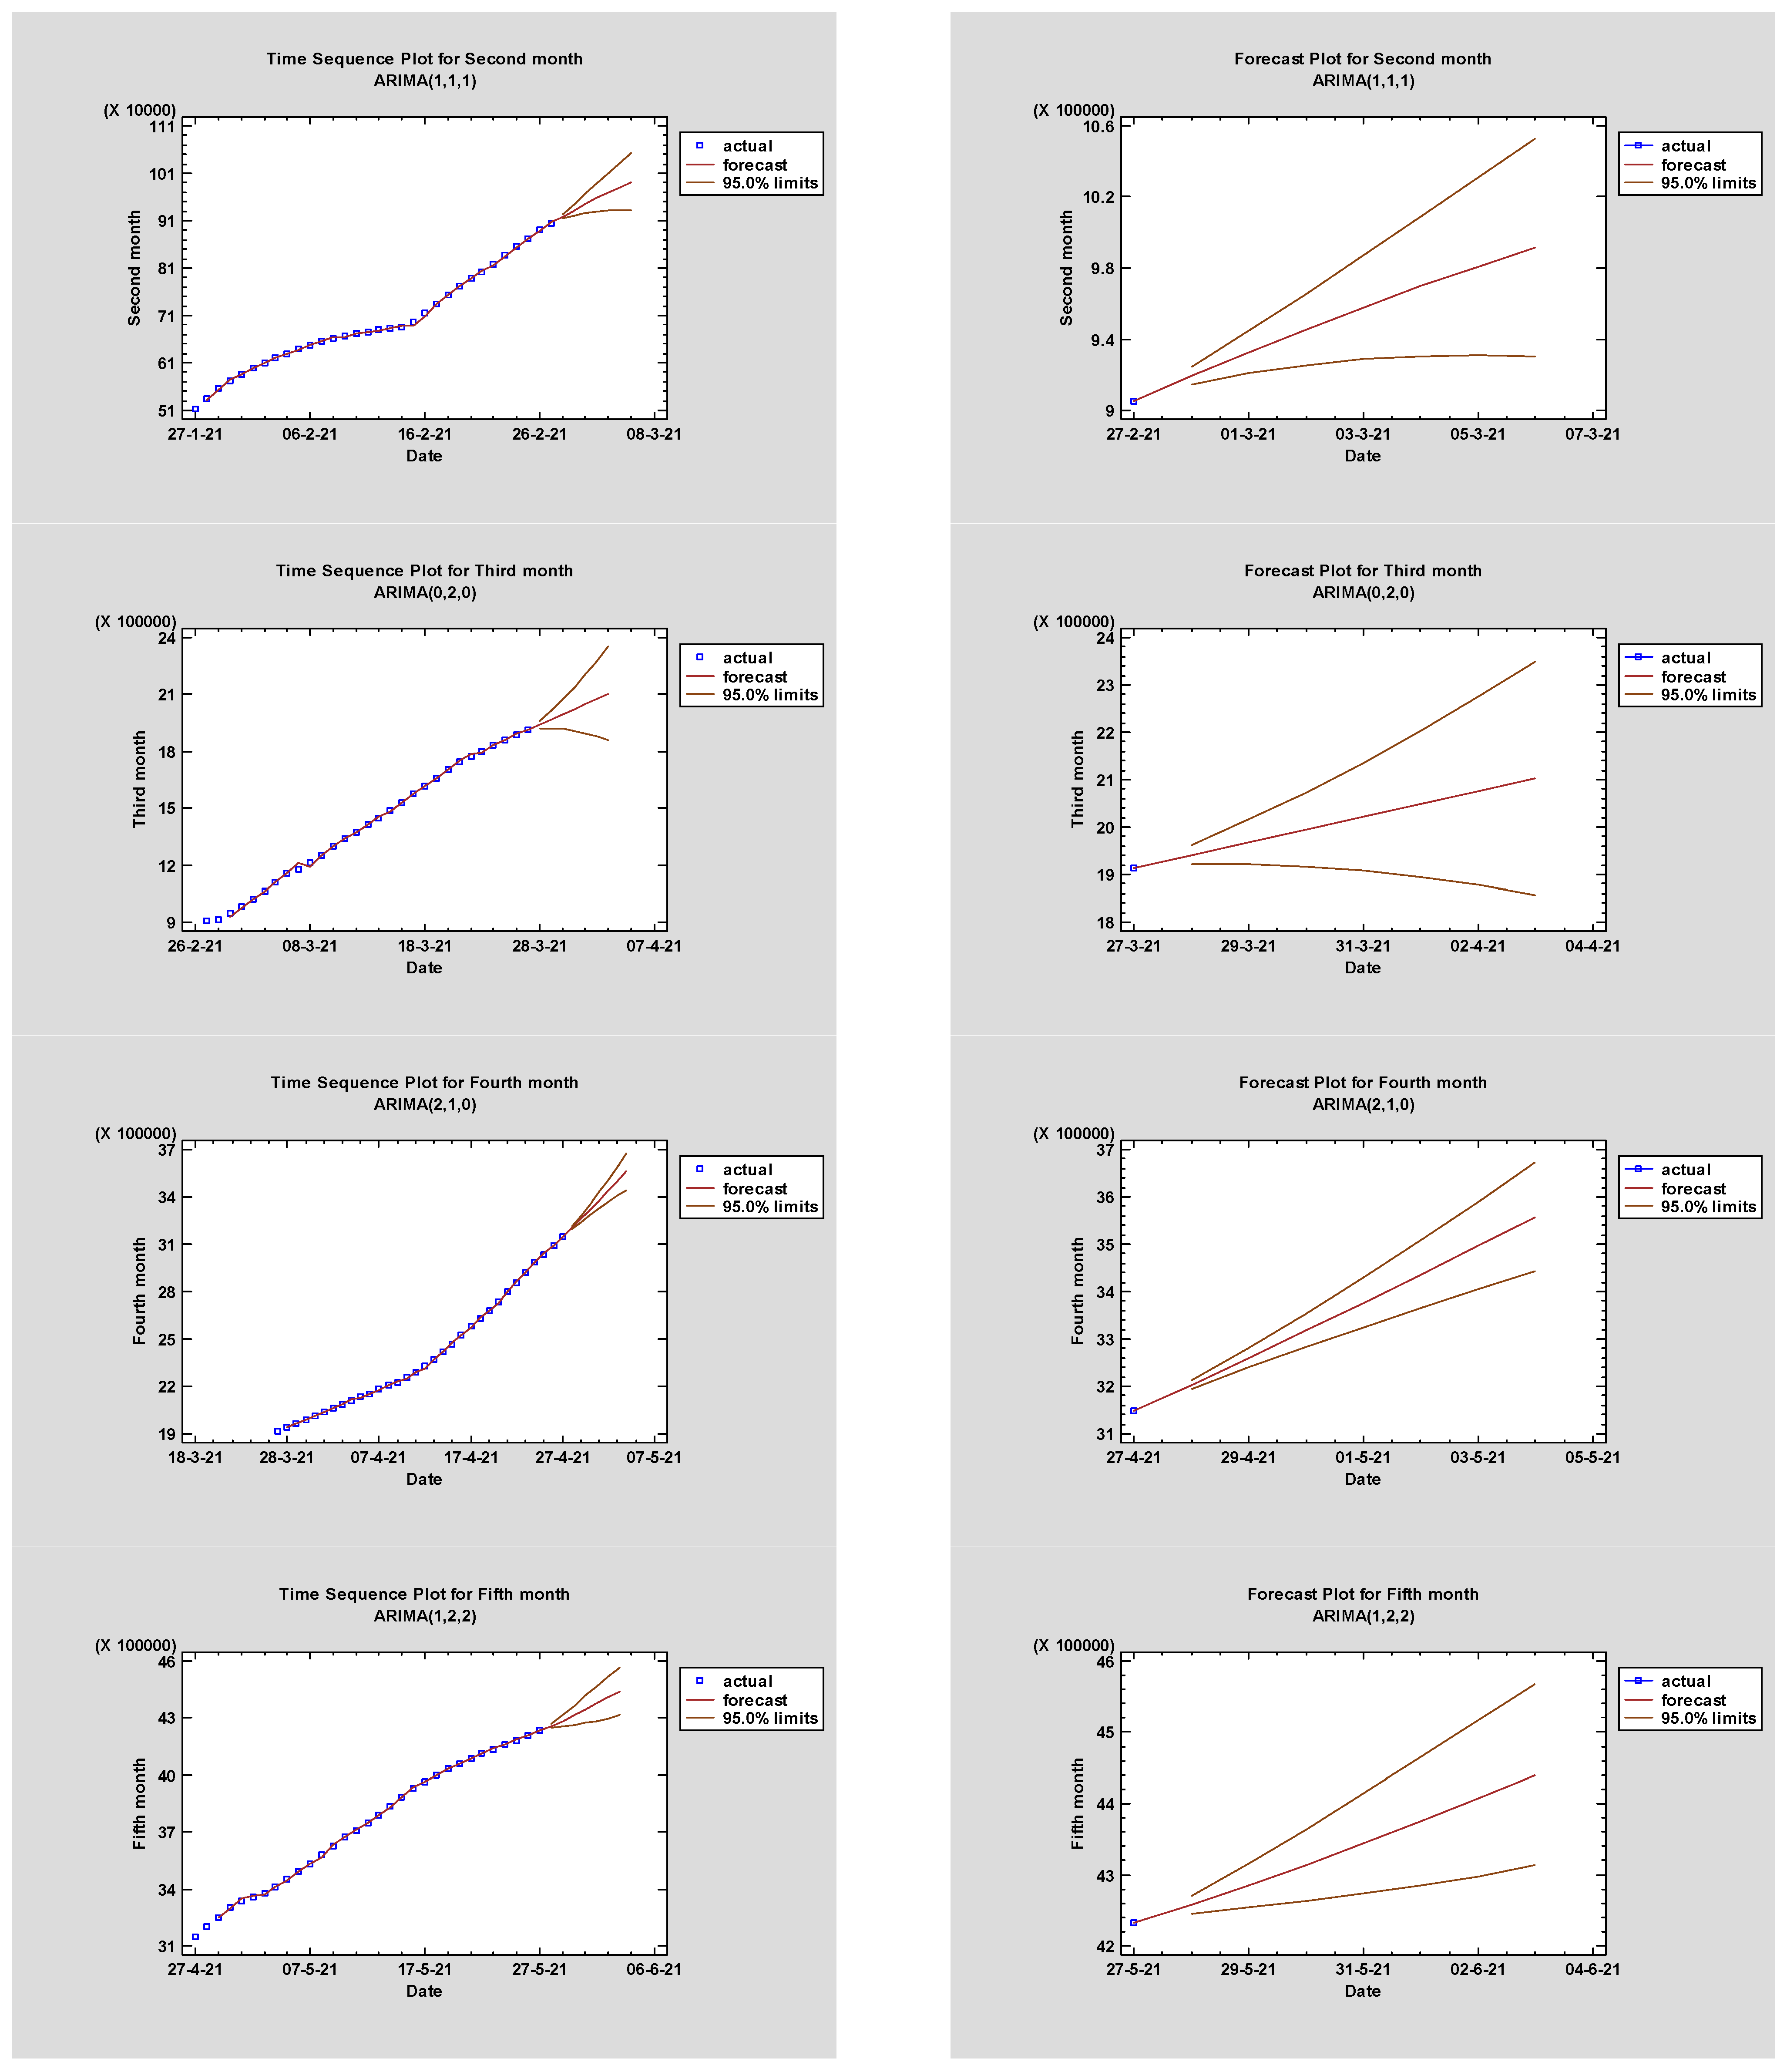

| Month | Model | RMSE | MAE | MAPE |
|---|---|---|---|---|
| January | ARIMA(1,1,0) | 5983.61 | 3469.22 | 6.81315 |
| ARIMA(2,1,1) | 6193.02 | 3478.39 | 6.81429 | |
| ARIMA(2,1,0) | 6074.41 | 3529.04 | 6.8465 | |
| ARIMA(0,2,0) | 5993.82 | 3589.63 | 6.98607 | |
| February | ARIMA(1,1,1) | 2443.14 | 1496.05 | 0.214755 |
| ARIMA(1,1,2) | 2404.11 | 1496.8 | 0.212518 | |
| ARIMA(2,1,2) | 2449.65 | 1497.25 | 0.212571 | |
| ARIMA(2,1,0) | 2366.97 | 1498.86 | 0.212441 | |
| ARIMA(2,1,1) | 2409.78 | 1500.66 | 0.212628 | |
| March | ARIMA(0,2,0) | 10,125.3 | 6020.7 | 0.474466 |
| ARIMA(1,1,0) | 10,069.7 | 6038.5 | 0.479113 | |
| ARIMA(1,1,1) | 9725.72 | 6091.12 | 0.500062 | |
| ARIMA(1,2,0) | 9870.77 | 6138.27 | 0.490985 | |
| ARIMA(2,1,0) | 9901.43 | 6183.01 | 0.50242 | |
| April | ARIMA(2,1,0) | 4506.49 | 2856.4 | 0.117225 |
| ARIMA(1,1,0) | 4429.84 | 2860.85 | 0.117355 | |
| ARIMA(1,1,1) | 4506.19 | 2864.04 | 0.117446 | |
| ARIMA(2,1,1) | 4582.38 | 2872.9 | 0.117986 | |
| ARIMA(2,1,2) | 4645.91 | 2896.7 | 0.119043 | |
| May | ARIMA(1,2,2) | 5701.78 | 3844.24 | 0.105518 |
| ARIMA(2,2,2) | 5817.73 | 3852.44 | 0.105606 | |
| ARIMA(2,2,0) | 6058.59 | 4005.54 | 0.110237 | |
| June | ARIMA(2,2,2) | 2058.41 | 1593.3 | 0.0354902 |
| ARIMA(2,2,1) | 2268.92 | 1694.63 | 0.0377449 | |
| ARIMA(1,2,2) | 2406.98 | 1741.78 | 0.0388305 | |
| ARIMA(0,2,2) | 2401.52 | 1784.57 | 0.0397096 | |
| July | ARIMA(0,2,2) | 1610.49 | 1222.21 | 0.0251916 |
| ARIMA(2,2,2) | 1633 | 1233.64 | 0.0254273 | |
| ARIMA(1,2,2) | 1634.18 | 1236.74 | 0.0254953 | |
| ARIMA(2,1,2) | 1986.95 | 1476.09 | 0.0304824 | |
| ARIMA(1,1,2) | 1949.75 | 1497.82 | 0.0309203 | |
| August | ARIMA(2,2,2) | 1760.73 | 1196.04 | 0.0234608 |
| ARIMA(1,2,2) | 1750.49 | 1217.35 | 0.023894 | |
| ARIMA(0,2,2) | 1719.34 | 1220.36 | 0.0239556 | |
| ARIMA(1,2,1) | 2142.33 | 1372.74 | 0.0269142 | |
| ARIMA(2,1,2) | 2216.94 | 1594.14 | 0.0313006 | |
| September | ARIMA(1,1,2) | 2641.24 | 1891.2 | 0.0352714 |
| ARIMA(2,1,2) | 2695.21 | 1929.22 | 0.0359849 | |
| ARIMA(2,2,2) | 2674.02 | 1981.65 | 0.0369697 | |
| ARIMA(0,2,2) | 2746.87 | 2089.46 | 0.0389583 | |
| ARIMA(1,2,2) | 2747.8 | 2096.01 | 0.0390938 | |
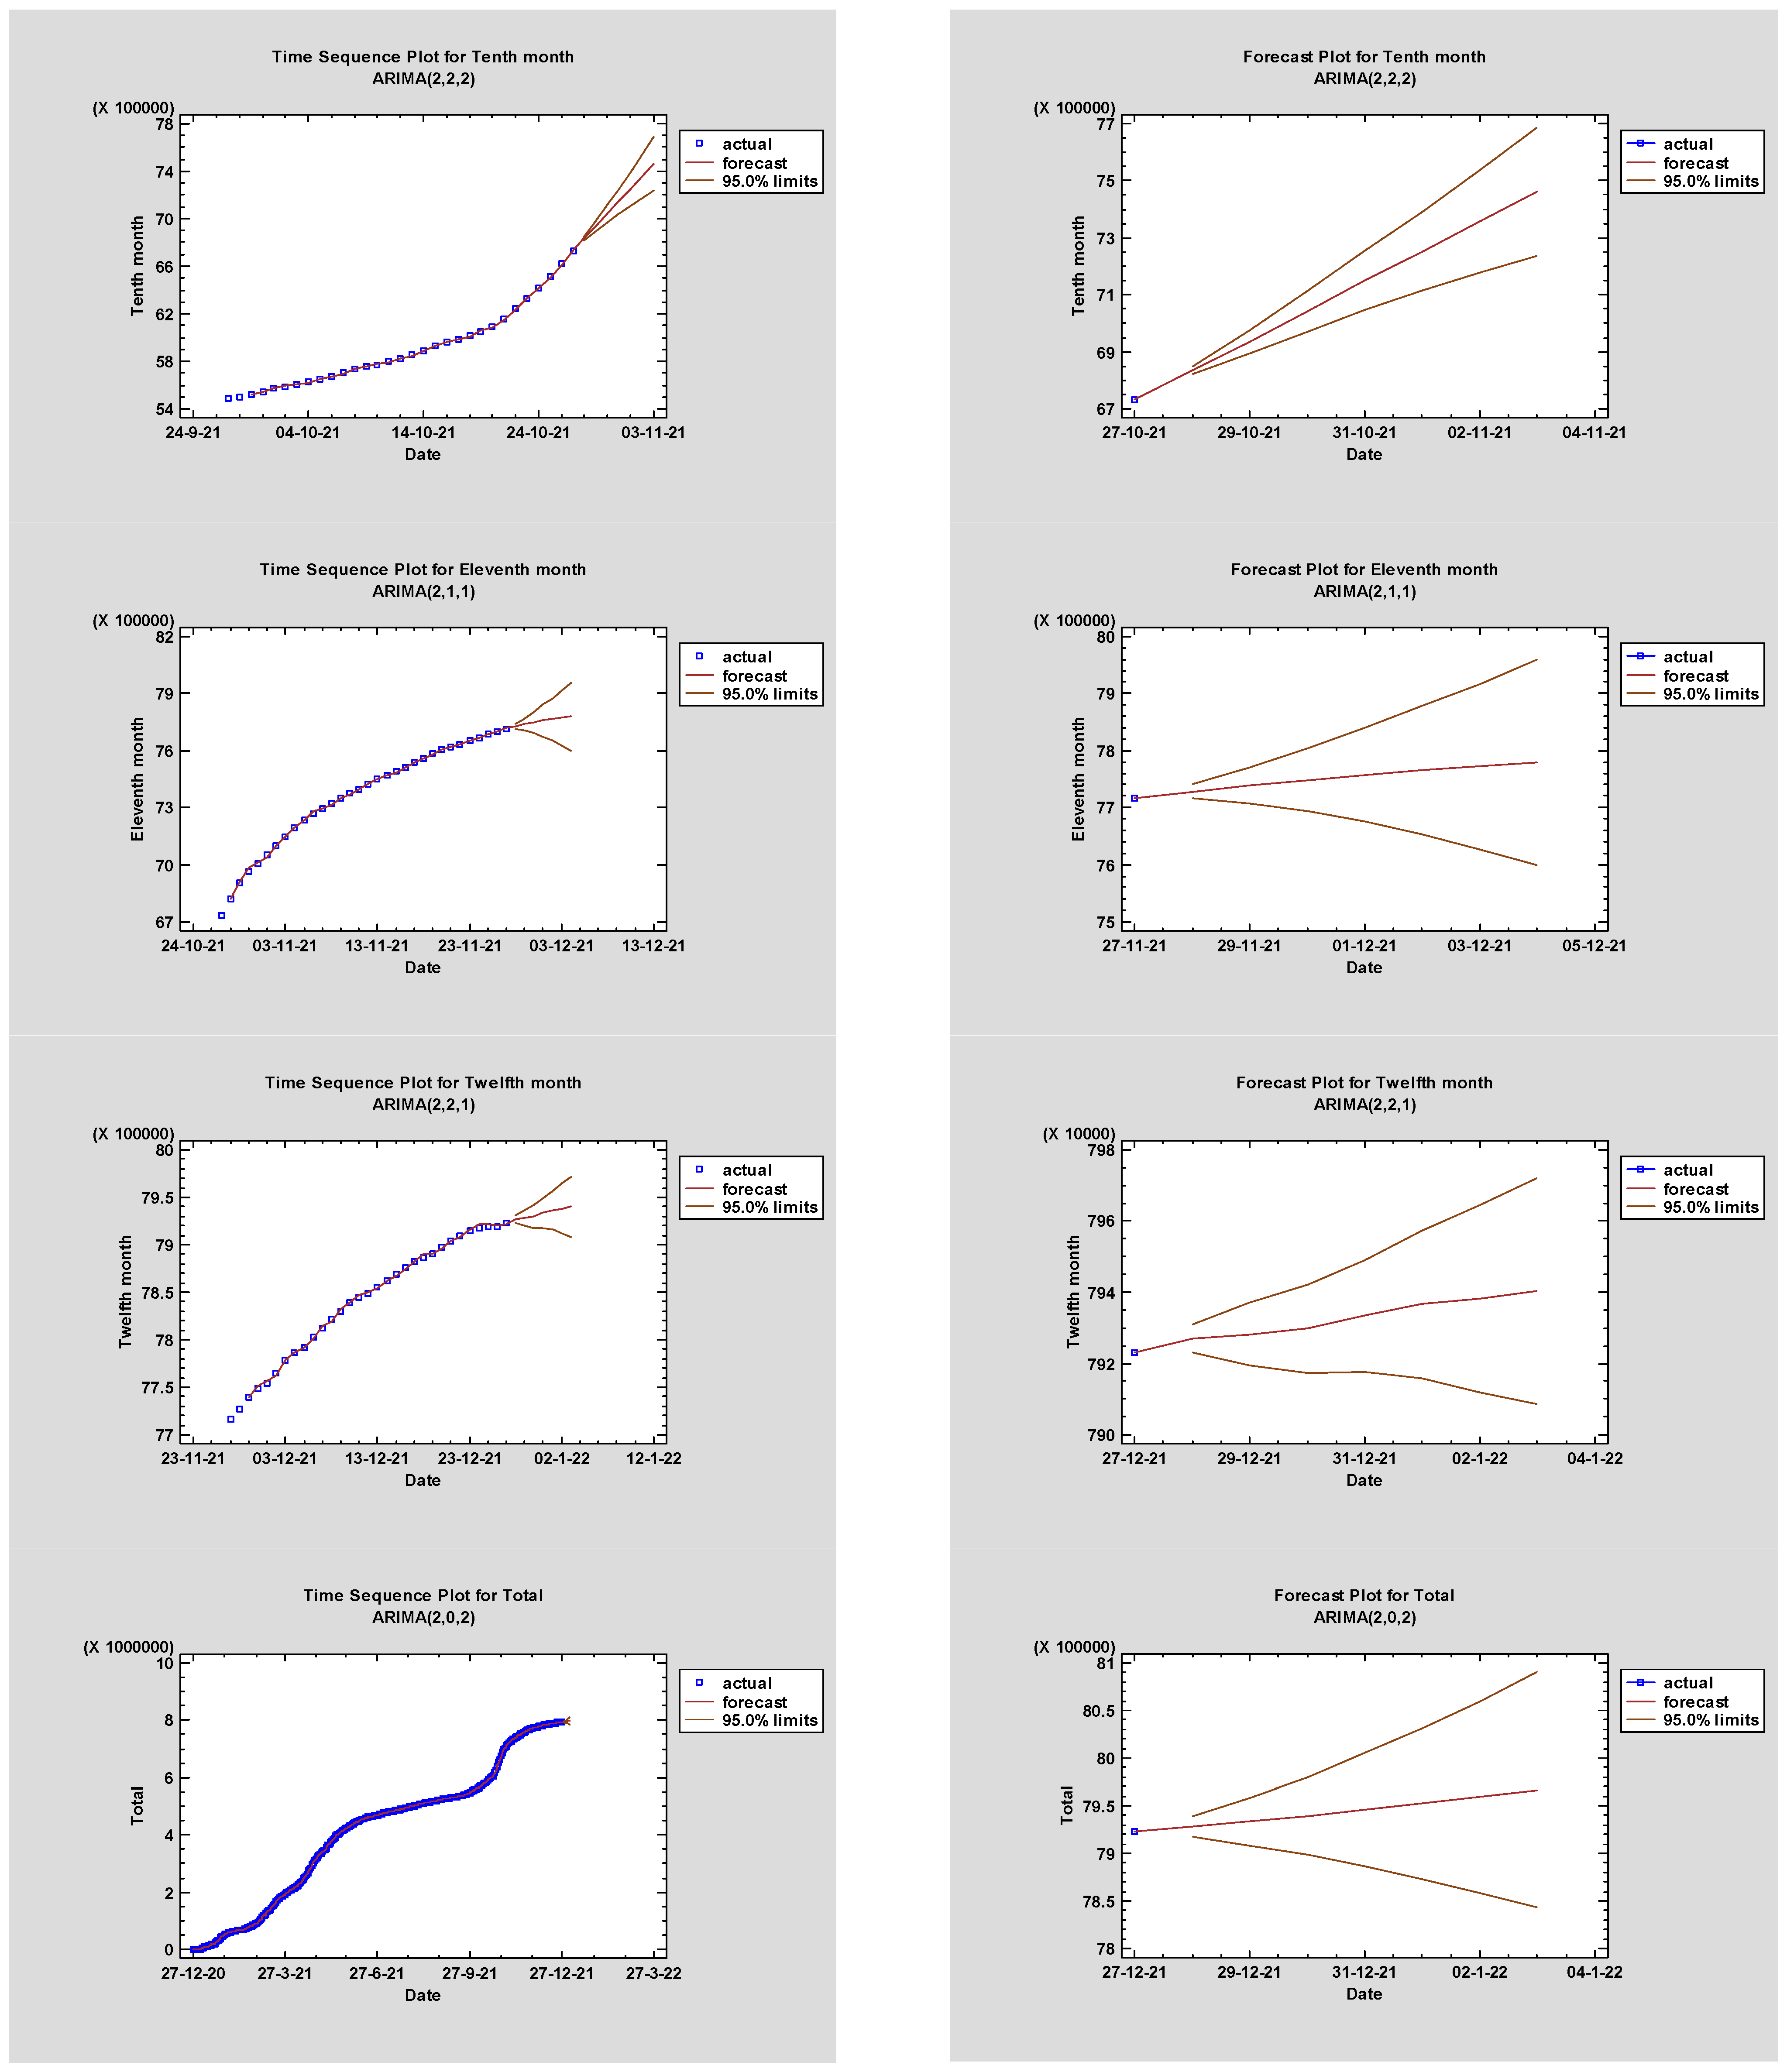
| October | ARIMA(2,2,2) | 6287.29 | 4643.42 | 0.0774352 |
| ARIMA(2,2,1) | 6897.6 | 5108.31 | 0.0847775 | |
| ARIMA(1,2,2) | 7032.4 | 5193.96 | 0.085918 | |
| ARIMA(1,2,1) | 6908.67 | 5262.54 | 0.0870042 | |
| November | ARIMA(2,1,1) | 6121.27 | 4144.73 | 0.0570842 |
| ARIMA(2,1,0) | 5986.3 | 4187.46 | 0.0577338 | |
| ARIMA(2,1,2) | 6207.1 | 4200.65 | 0.0579711 | |
| December | ARIMA(2,2,1) | 1891.64 | 1470.03 | 0.0187244 |
| ARIMA(2,2,0) | 1856.3 | 1473.05 | 0.0187625 | |
| ARIMA(2,2,2) | 1916.62 | 1499.57 | 0.0191095 | |
| ARIMA(0,2,2) | 2016.04 | 1643.22 | 0.0209753 | |
| Total | ARIMA(2,0,2) | 5360.97 | 3259.29 | 0.733775 |
| ARIMA(2,2,0) | 5394.91 | 3268.17 | 0.695145 | |
| ARIMA(2,2,1) | 5399.27 | 3268.9 | 0.695924 | |
| ARIMA(2,2,2) | 5406.99 | 3271.66 | 0.696387 | |
| ARIMA(1,1,1) | 5393.81 | 3274.41 | 0.688878 |
| Month | Parameter | Estimate | Standard Error | t-Statistic | p-Value | Ljung–Box Test |
|---|---|---|---|---|---|---|
| January | AR(1) | 0.982382 | 0.0548607 | 17.9069 | 0 | 0.102632 |
| February | AR(1) | 0.9564 | 0.0333551 | 28.6733 | 0 | 0.864548 |
| MA(1) | −0.168594 | 0.118083 | −1.42776 | 0.164042 | ||
| March | no parameter(s) | 0.477973 | ||||
| April | AR(1) | 1.03694 | 0.18565 | 5.58548 | 0.000005 | 0.248501 |
| AR(2) | −0.0224815 | 0.189402 | −0.118698 | 0.906333 | ||
| May | AR(1) | 0.759005 | 0.158601 | 4.78564 | 0.000059 | 0.986002 |
| MA(1) | 0.431691 | 0.165075 | 2.61512 | 0.01465 | ||
| MA(2) | 0.575053 | 0.156229 | 3.68084 | 0.001069 | ||
| June | AR(1) | 1.18927 | 0.0786618 | 15.1188 | 0 | 0.0169788 |
| AR(2) | −0.975677 | 0.0728746 | −13.3884 | 0 | ||
| MA(1) | 1.26288 | 0.159909 | 7.89746 | 0 | ||
| MA(2) | −0.808264 | 0.123585 | −6.54012 | 0.000001 | ||
| July | MA(1) | 0.0470354 | 0.0932973 | 0.504145 | 0.618249 | 0.0043751 |
| MA(2) | 0.868584 | 0.0876427 | 9.91051 | 0 | ||
| August | AR(1) | 0.0639607 | 0.207405 | 0.308385 | 0.760246 | 0.000105 |
| AR(2) | −0.186658 | 0.196426 | −0.950269 | 0.350726 | ||
| MA(1) | 0.0050157 | 0.0645373 | 0.0777177 | 0.938648 | ||
| MA(2) | 0.95 | 0.053573 | 17.7328 | 0 | ||
| September | AR(1) | 1.03825 | 0.0200273 | 51.8419 | 0 | 0.0136246 |
| MA(1) | 0.29945 | 0.190727 | 1.57004 | 0.127639 | ||
| MA(2) | 0.371627 | 0.175248 | 2.12057 | 0.042949 | ||
| October | AR(1) | −0.211891 | 0.182648 | −1.16011 | 0.256963 | 0.690025 |
| AR(2) | −0.702692 | 0.168935 | −4.15955 | 0.000329 | ||
| MA(1) | −1.00778 | 0.157958 | −6.38005 | 0.000001 | ||
| MA(2) | −0.780661 | 0.166924 | −4.67675 | 0.000086 | ||
| November | AR(1) | 1.49501 | 0.212479 | 7.03601 | 0 | 0.0059234 |
| AR(2) | −0.530011 | 0.211406 | −2.50708 | 0.018252 | ||
| MA(1) | 0.267886 | 0.318328 | 0.841539 | 0.407176 | ||
| December | AR(1) | −0.0584976 | 0.202084 | −0.289471 | 0.774516 | 0.175271 |
| AR(2) | −0.745858 | 0.135203 | −5.51656 | 0.000009 | ||
| MA(1) | −0.0445405 | 0.265186 | −0.167959 | 0.867915 | ||
| Total | AR(1) | 1.97226 | 0.0144948 | 136.067 | 0 | 1.11 × 10⁻¹⁶ |
| AR(2) | −0.972185 | 0.0145503 | −66.8156 | 0 | ||
| MA(1) | −0.147522 | 0.0546424 | −2.69977 | 0.007264 | ||
| MA(2) | 0.103778 | 0.0542596 | 1.91261 | 0.056587 | ||
| Lower 95% | Upper 95% | ||
|---|---|---|---|
| Period | Forecast | Limit | Limit |
| January | |||
| 28 January 2021 | 538,694 | 526,474 | 550,914 |
| 29 January 2021 | 563,514 | 536,381 | 590,647 |
| 30 January 2021 | 587,896 | 542,802 | 632,991 |
| 31 January 2021 | 611,849 | 546,277 | 677,421 |
| 1 February 2021 | 635,380 | 547,182 | 723,579 |
| 2 February 2021 | 658,497 | 545,792 | 771,201 |
| 3 February 2021 | 681,206 | 542,325 | 820,086 |
| February | |||
| 28 February 2021 | 919,209 | 914,179 | 924,239 |
| 1 March 2021 | 932,663 | 920,849 | 944,477 |
| 2 March 2021 | 945,530 | 925,560 | 965,501 |
| 3 March 2021 | 957,836 | 928,655 | 987,018 |
| 4 March 2021 | 969,606 | 930,370 | 1.00884 × 10⁶ |
| 5 March 2021 | 980,862 | 930,880 | 1.03084 × 10⁶ |
| 6 March 2021 | 991,628 | 930,327 | 1.05293 × 10⁶ |
| March | |||
| 28 March 2021 | 1.94174 × 10⁶ | 1.92096 × 10⁶ | 1.96251 × 10⁶ |
| 29 March 2021 | 1.96859 × 10⁶ | 1.92213 × 10⁶ | 2.01504 × 10⁶ |
| 30 March 2021 | 1.99544 × 10⁶ | 1.91771 × 10⁶ | 2.07317 × 10⁶ |
| 31 March 2021 | 2.02229 × 10⁶ | 1.9085 × 10⁶ | 2.13608 × 10⁶ |
| 1 April 2021 | 2.04914 × 10⁶ | 1.89507 × 10⁶ | 2.20322 × 10⁶ |
| 2 April 2021 | 2.076 × 10⁶ | 1.87781 × 10⁶ | 2.27418 × 10⁶ |
| 3 April 2021 | 2.10285 × 10⁶ | 1.85703 × 10⁶ | 2.34867 × 10⁶ |
| April | |||
| 28 April 2021 | 3.20358 × 10⁶ | 3.19435 × 10⁶ | 3.2128 × 10⁶ |
| 29 April 2021 | 3.26041 × 10⁶ | 3.23948 × 10⁶ | 3.28134 × 10⁶ |
| 30 April 2021 | 3.31808 × 10⁶ | 3.28272 × 10⁶ | 3.35345 × 10⁶ |
| 1 May 2021 | 3.37661 × 10⁶ | 3.32444 × 10⁶ | 3.42878 × 10⁶ |
| 2 May 2021 | 3.436 × 10⁶ | 3.36486 × 10⁶ | 3.50714 × 10⁶ |
| 3 May 2021 | 3.49627 × 10⁶ | 3.40416 × 10⁶ | 3.58838 × 10⁶ |
| 4 May 2021 | 3.55743 × 10⁶ | 3.44246 × 10⁶ | 3.6724 × 10⁶ |
| May | |||
| 28 May 2021 | 4.25759 × 10⁶ | 4.24549 × 10⁶ | 4.26969 × 10⁶ |
| 29 May 2021 | 4.28472 × 10⁶ | 4.25408 × 10⁶ | 4.31536 × 10⁶ |
| 30 May 2021 | 4.31365 × 10⁶ | 4.26305 × 10⁶ | 4.36424 × 10⁶ |
| 31 May 2021 | 4.34394 × 10⁶ | 4.27326 × 10⁶ | 4.41462 × 10⁶ |
| 1 June 2021 | 4.37527 × 10⁶ | 4.28497 × 10⁶ | 4.46557 × 10⁶ |
| 2 June 2021 | 4.40739 × 10⁶ | 4.29825 × 10⁶ | 4.51653 × 10⁶ |
| 3 June 2021 | 4.44011 × 10⁶ | 4.31303 × 10⁶ | 4.56718 × 10⁶ |
| June | |||
| 28 June 2021 | 4.70459 × 10⁶ | 4.70025 × 10⁶ | 4.70894 × 10⁶ |
| 29 June 2021 | 4.71453 × 10⁶ | 4.70509 × 10⁶ | 4.72396 × 10⁶ |
| 30 June 2021 | 4.72637 × 10⁶ | 4.71166 × 10⁶ | 4.74108 × 10⁶ |
| 1 July 2021 | 4.73785 × 10⁶ | 4.71808 × 10⁶ | 4.75761 × 10⁶ |
| 2 July 2021 | 4.74701 × 10⁶ | 4.7222 × 10⁶ | 4.77182 × 10⁶ |
| 3 July 2021 | 4.75379 × 10⁶ | 4.72335 × 10⁶ | 4.78424 × 10⁶ |
| 4 July 2021 | 4.75999 × 10⁶ | 4.72278 × 10⁶ | 4.79721 × 10⁶ |
| July | |||
| 28 July 2021 | 4.97002 × 10⁶ | 4.9667 × 10⁶ | 4.97334 × 10⁶ |
| 29 July 2021 | 4.97892 × 10⁶ | 4.97164 × 10⁶ | 4.98621 × 10⁶ |
| 30 July 2021 | 4.98783 × 10⁶ | 4.97788 × 10⁶ | 4.99777 × 10⁶ |
| 31 July 2021 | 4.99673 × 10⁶ | 4.98455 × 10⁶ | 5.00892 × 10⁶ |
| 1 August 2021 | 5.00564 × 10⁶ | 4.99142 × 10⁶ | 5.01986 × 10⁶ |
| 2 August 2021 | 5.01454 × 10⁶ | 4.99842 × 10⁶ | 5.03067 × 10⁶ |
| 3 August 2021 | 5.02345 × 10⁶ | 5.0055 × 10⁶ | 5.0414 × 10⁶ |
| August | |||
| 28 August 2021 | 5.23552 × 10⁶ | 5.2318 × 10⁶ | 5.23923 × 10⁶ |
| 29 August 2021 | 5.24423 × 10⁶ | 5.23572 × 10⁶ | 5.25274 × 10⁶ |
| 30 August 2021 | 5.25285 × 10⁶ | 5.24159 × 10⁶ | 5.26412 × 10⁶ |
| 31 August 2021 | 5.26164 × 10⁶ | 5.24849 × 10⁶ | 5.2748 × 10⁶ |
| 1 September 2021 | 5.27046 × 10⁶ | 5.25557 × 10⁶ | 5.28535 × 10⁶ |
| 2 September 2021 | 5.27925 × 10⁶ | 5.26269 × 10⁶ | 5.29582 × 10⁶ |
| 3 September 2021 | 5.28803 × 10⁶ | 5.26988 × 10⁶ | 5.30618 × 10⁶ |
| September | |||
| 28 September 2021 | 5.49969 × 10⁶ | 5.49415 × 10⁶ | 5.50524 × 10⁶ |
| 29 September 2021 | 5.51582 × 10⁶ | 5.5047 × 10⁶ | 5.52695 × 10⁶ |
| 30 September 2021 | 5.53257 × 10⁶ | 5.51633 × 10⁶ | 5.54881 × 10⁶ |
| 1 October 2021 | 5.54996 × 10⁶ | 5.52844 × 10⁶ | 5.57148 × 10⁶ |
| 2 October 2021 | 5.56801 × 10⁶ | 5.54092 × 10⁶ | 5.59511 × 10⁶ |
| 3 October 2021 | 5.58676 × 10⁶ | 5.5537 × 10⁶ | 5.61982 × 10⁶ |
| 4 October 2021 | 5.60622 × 10⁶ | 5.5668 × 10⁶ | 5.64564 × 10⁶ |
| October | |||
| 28 October 2021 | 6.8339 × 10⁶ | 6.82067 × 10⁶ | 6.84713 × 10⁶ |
| 29 October 2021 | 6.93473 × 10⁶ | 6.89546 × 10⁶ | 6.97401 × 10⁶ |
| 30 October 2021 | 7.04299 × 10⁶ | 6.97166 × 10⁶ | 7.11432 × 10⁶ |
| 31 October 2021 | 7.14982 × 10⁶ | 7.04635 × 10⁶ | 7.25329 × 10⁶ |
| 1 November 2021 | 7.25173 × 10⁶ | 7.1128 × 10⁶ | 7.39067 × 10⁶ |
| 2 November 2021 | 7.35569 × 10⁶ | 7.17533 × 10⁶ | 7.53606 × 10⁶ |
| 3 November 2021 | 7.46267 × 10⁶ | 7.23757 × 10⁶ | 7.68778 × 10⁶ |
| November | |||
| 28 November 2021 | 7.72849 × 10⁶ | 7.71583 × 10⁶ | 7.74114 × 10⁶ |
| 29 November 2021 | 7.73911 × 10⁶ | 7.70822 × 10⁶ | 7.77 × 10⁶ |
| 30 November 2021 | 7.74866 × 10⁶ | 7.69434 × 10⁶ | 7.80297 × 10⁶ |
| 1 December 2021 | 7.7573 × 10⁶ | 7.67552 × 10⁶ | 7.83907 × 10⁶ |
| 2 December 2021 | 7.76515 × 10⁶ | 7.65286 × 10⁶ | 7.87745 × 10⁶ |
| 3 December 2021 | 7.77232 × 10⁶ | 7.6272 × 10⁶ | 7.91745 × 10⁶ |
| 4 December 2021 | 7.77887 × 10⁶ | 7.59921 × 10⁶ | 7.95853 × 10⁶ |
| December | |||
| 28 December 2021 | 7.92705 × 10⁶ | 7.92313 × 10⁶ | 7.93097 × 10⁶ |
| 29 December 2021 | 7.92826 × 10⁶ | 7.91954 × 10⁶ | 7.93697 × 10⁶ |
| 30 December 2021 | 7.92976 × 10⁶ | 7.91742 × 10⁶ | 7.9421 × 10⁶ |
| 31 December 2021 | 7.93335 × 10⁶ | 7.91754 × 10⁶ | 7.94916 × 10⁶ |
| 1 January 2022 | 7.9366 × 10⁶ | 7.91599 × 10⁶ | 7.9572 × 10⁶ |
| 2 January 2022 | 7.93831 × 10⁶ | 7.91207 × 10⁶ | 7.96455 × 10⁶ |
| 3 January 2022 | 7.94037 × 10⁶ | 7.90872 × 10⁶ | 7.97201 × 10⁶ |
| Total | |||
| 28 December 2021 | 7.92819 × 10⁶ | 7.91765 × 10⁶ | 7.93873 × 10⁶ |
| 29 December 2021 | 7.9335 × 10⁶ | 7.90879 × 10⁶ | 7.95822 × 10⁶ |
| 30 December 2021 | 7.93926 × 10⁶ | 7.89825 × 10⁶ | 7.98028 × 10⁶ |
| 31 December 2021 | 7.94546 × 10⁶ | 7.88616 × 10⁶ | 8.00477 × 10⁶ |
| 1 January 2022 | 7.95208 × 10⁶ | 7.87278 × 10⁶ | 8.03139 × 10⁶ |
| 2 January 2022 | 7.95912 × 10⁶ | 7.85832 × 10⁶ | 8.05991 × 10⁶ |
| 3 January 2022 | 7.96656 × 10⁶ | 7.84298 × 10⁶ | 8.09014 × 10⁶ |
Publisher’s Note: MDPI stays neutral with regard to jurisdictional claims in published maps and institutional affiliations. |
© 2022 by the authors. Licensee MDPI, Basel, Switzerland. This article is an open access article distributed under the terms and conditions of the Creative Commons Attribution (CC BY) license (https://creativecommons.org/licenses/by/4.0/).
Share and Cite
Doroftei, B.; Ilie, O.-D.; Anton, N.; Timofte, S.-I.; Ilea, C. Mathematical Modeling to Predict COVID-19 Infection and Vaccination Trends. J. Clin. Med. 2022, 11, 1737. https://doi.org/10.3390/jcm11061737
Doroftei B, Ilie O-D, Anton N, Timofte S-I, Ilea C. Mathematical Modeling to Predict COVID-19 Infection and Vaccination Trends. Journal of Clinical Medicine. 2022; 11(6):1737. https://doi.org/10.3390/jcm11061737
Chicago/Turabian StyleDoroftei, Bogdan, Ovidiu-Dumitru Ilie, Nicoleta Anton, Sergiu-Ioan Timofte, and Ciprian Ilea. 2022. "Mathematical Modeling to Predict COVID-19 Infection and Vaccination Trends" Journal of Clinical Medicine 11, no. 6: 1737. https://doi.org/10.3390/jcm11061737
APA StyleDoroftei, B., Ilie, O.-D., Anton, N., Timofte, S.-I., & Ilea, C. (2022). Mathematical Modeling to Predict COVID-19 Infection and Vaccination Trends. Journal of Clinical Medicine, 11(6), 1737. https://doi.org/10.3390/jcm11061737


