
Reliability of the Spanish Version of the Movement Imagery Questionnaire-3 (MIQ-3) and Characteristics of Motor Imagery in Institutionalized Elderly People
 ,
,  ,
,  , and
, and
Abstract
1. Introduction
2. Materials and Methods
2.1. Participants
2.2. Data Collection Instrument
2.3. Variables
2.4. Procedure
2.5. Statistical Analysis
3. Results
3.1. Descriptive Analysis
3.2. Analysis of Internal Consistency
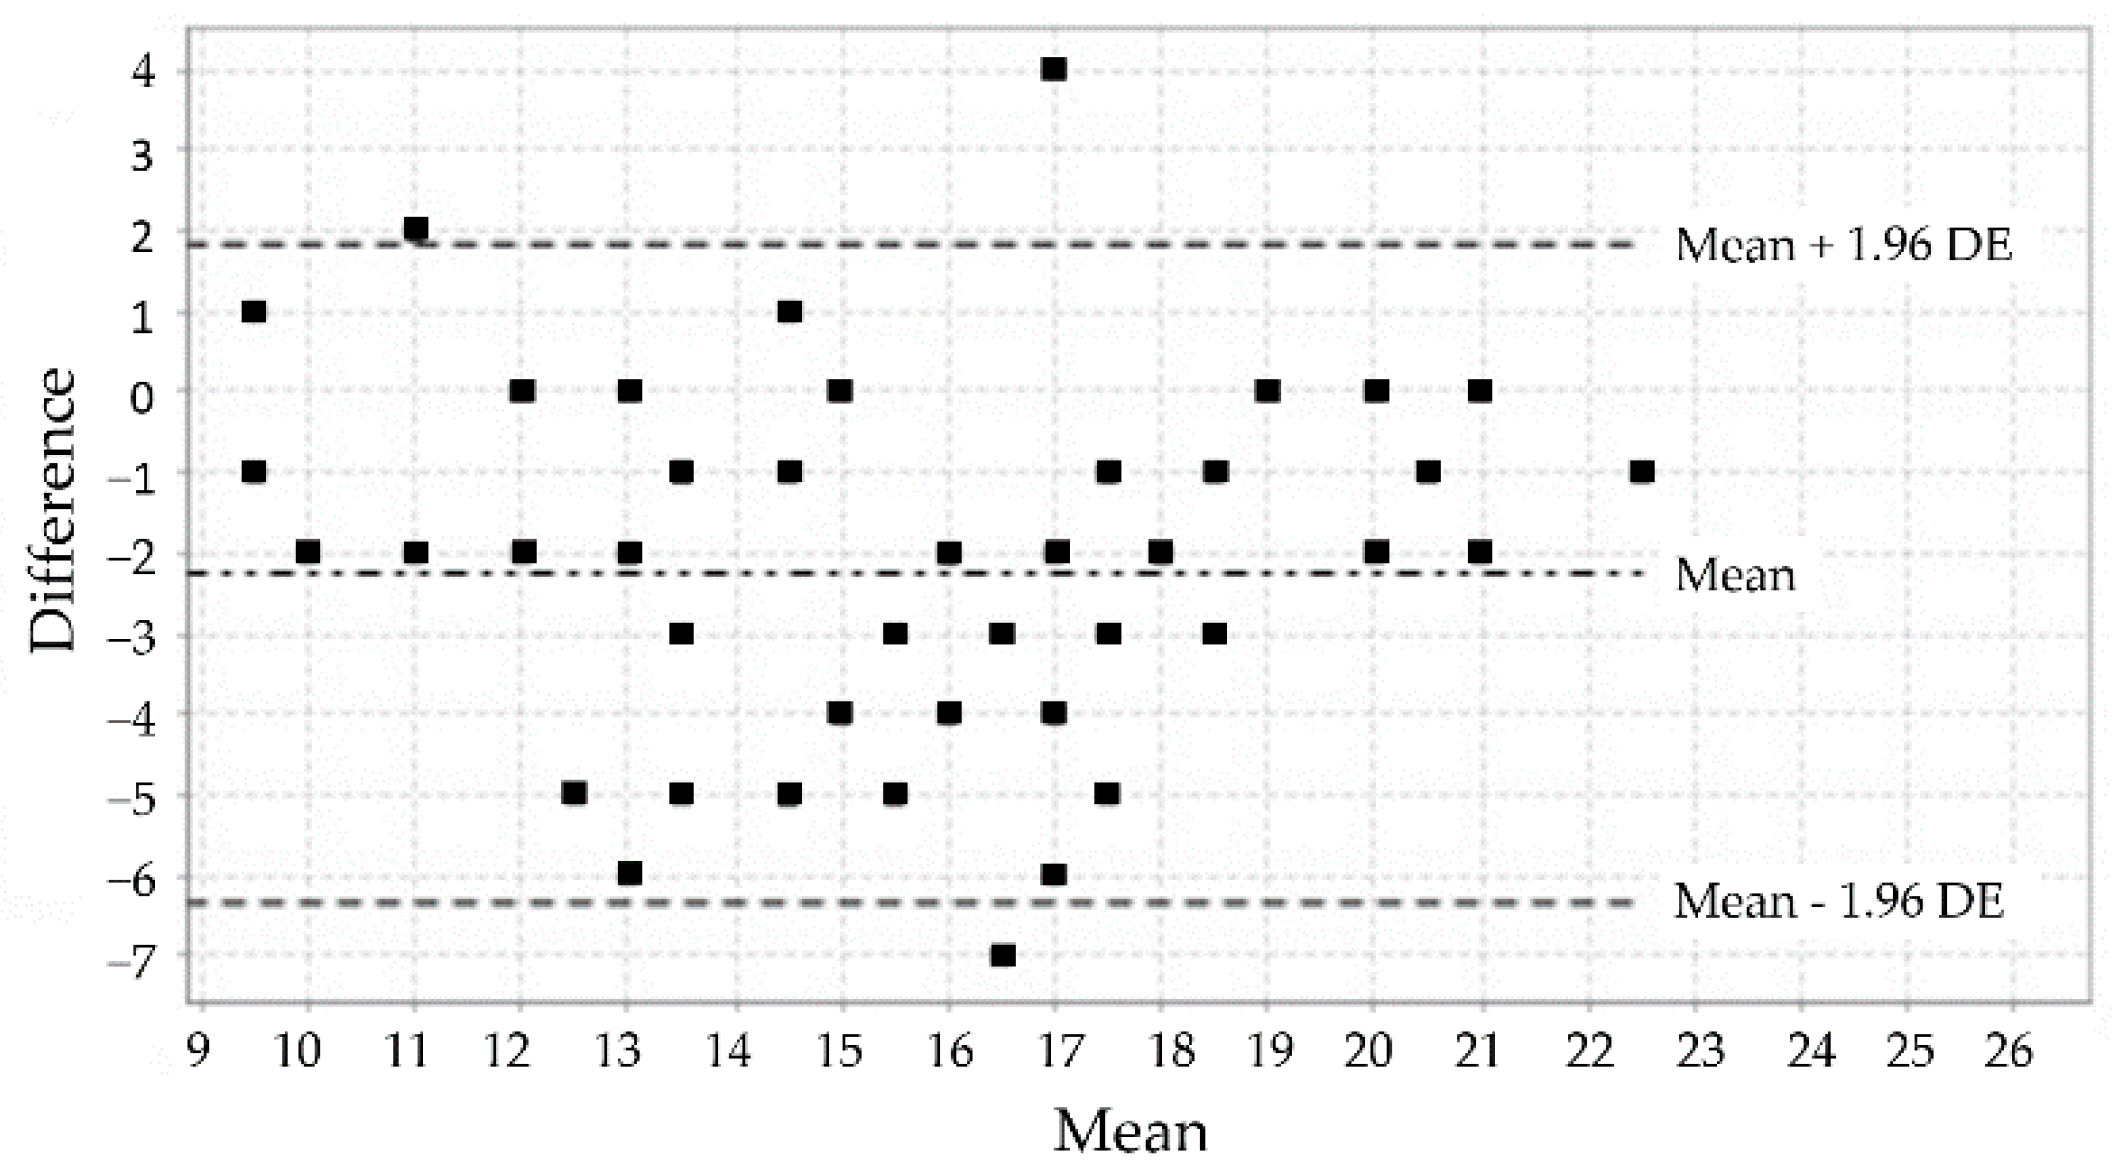
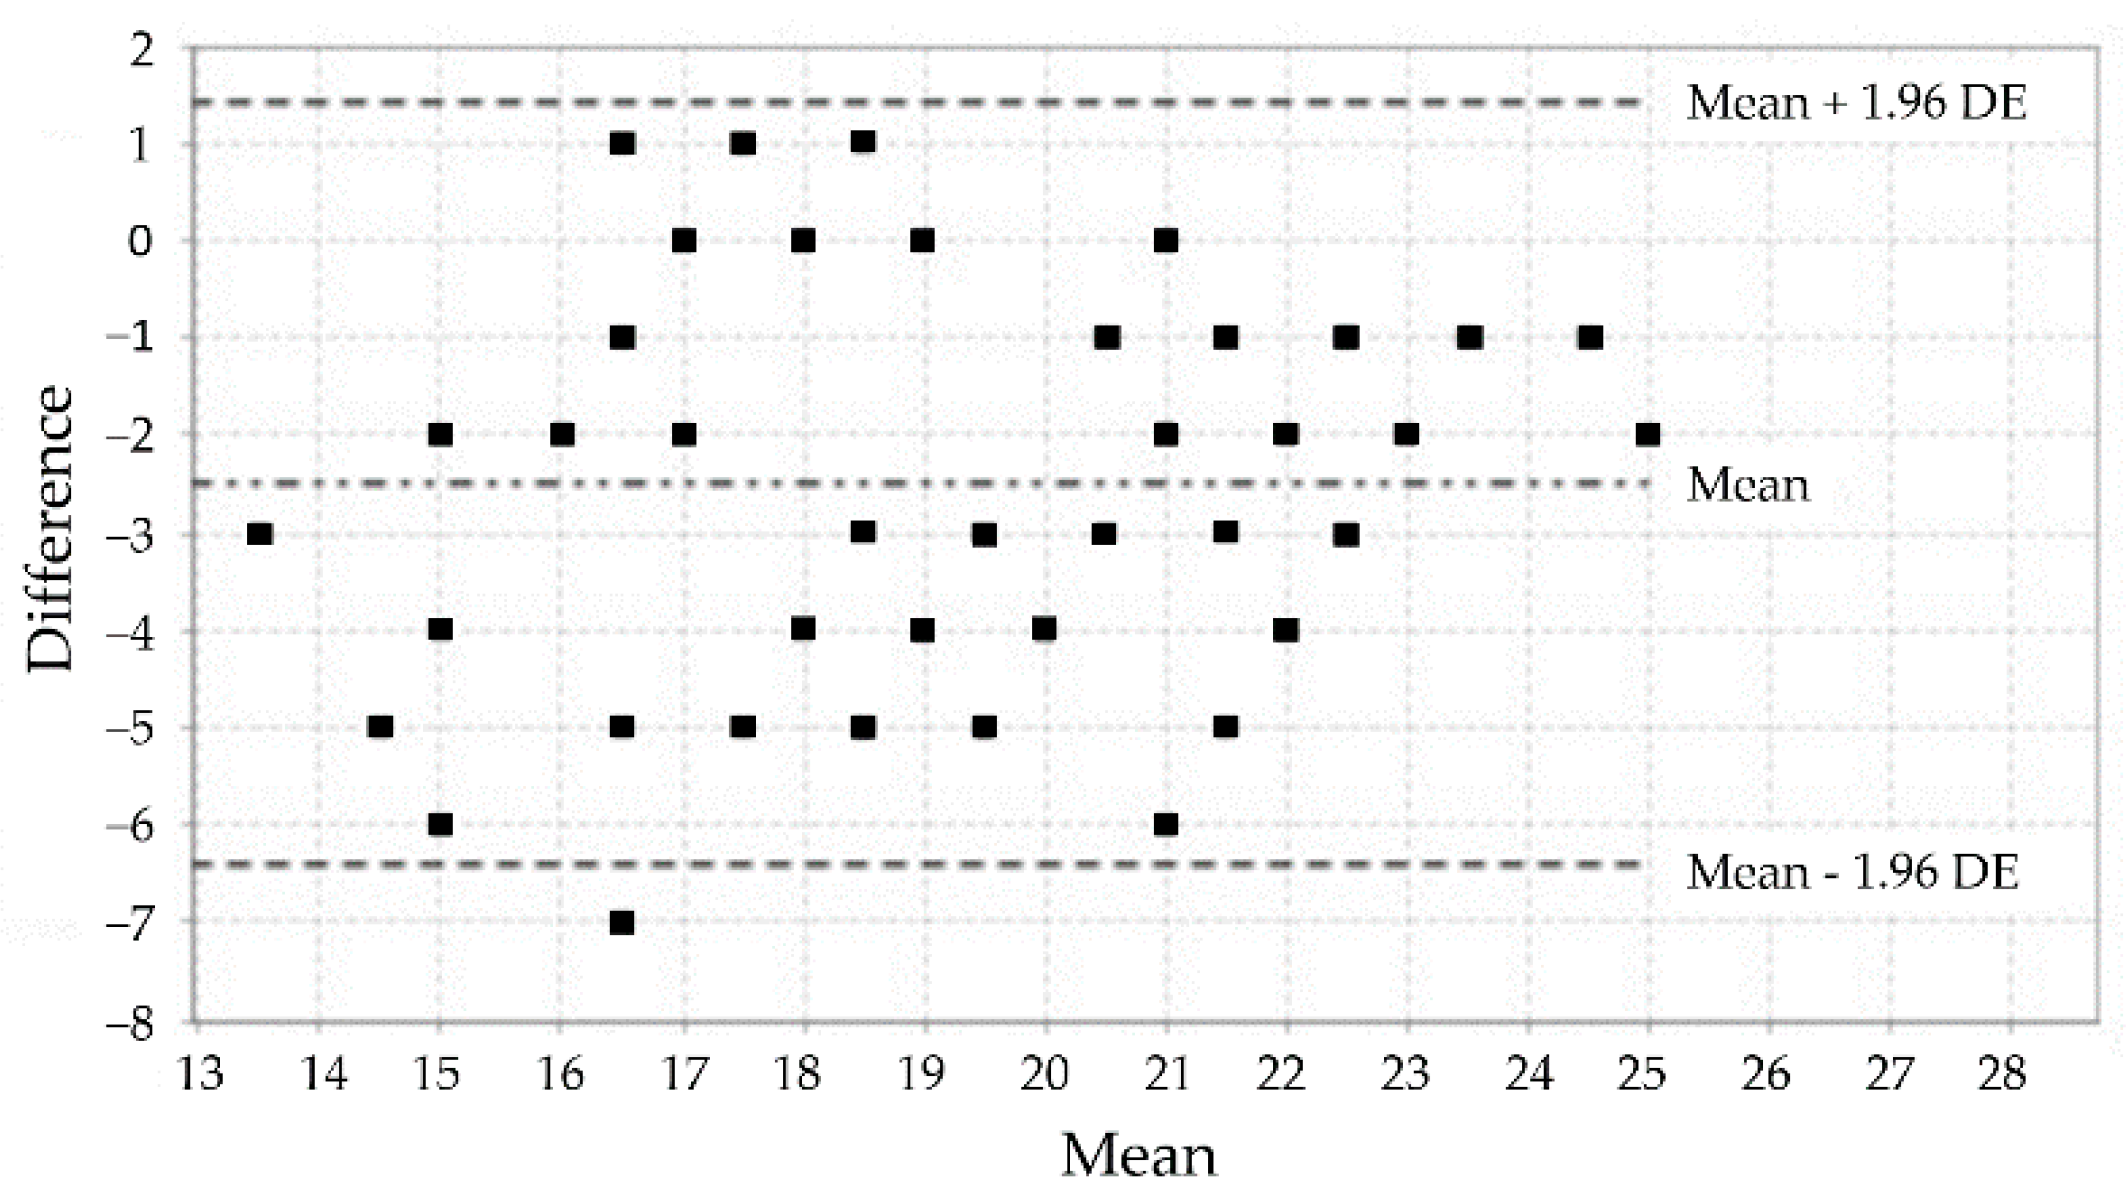
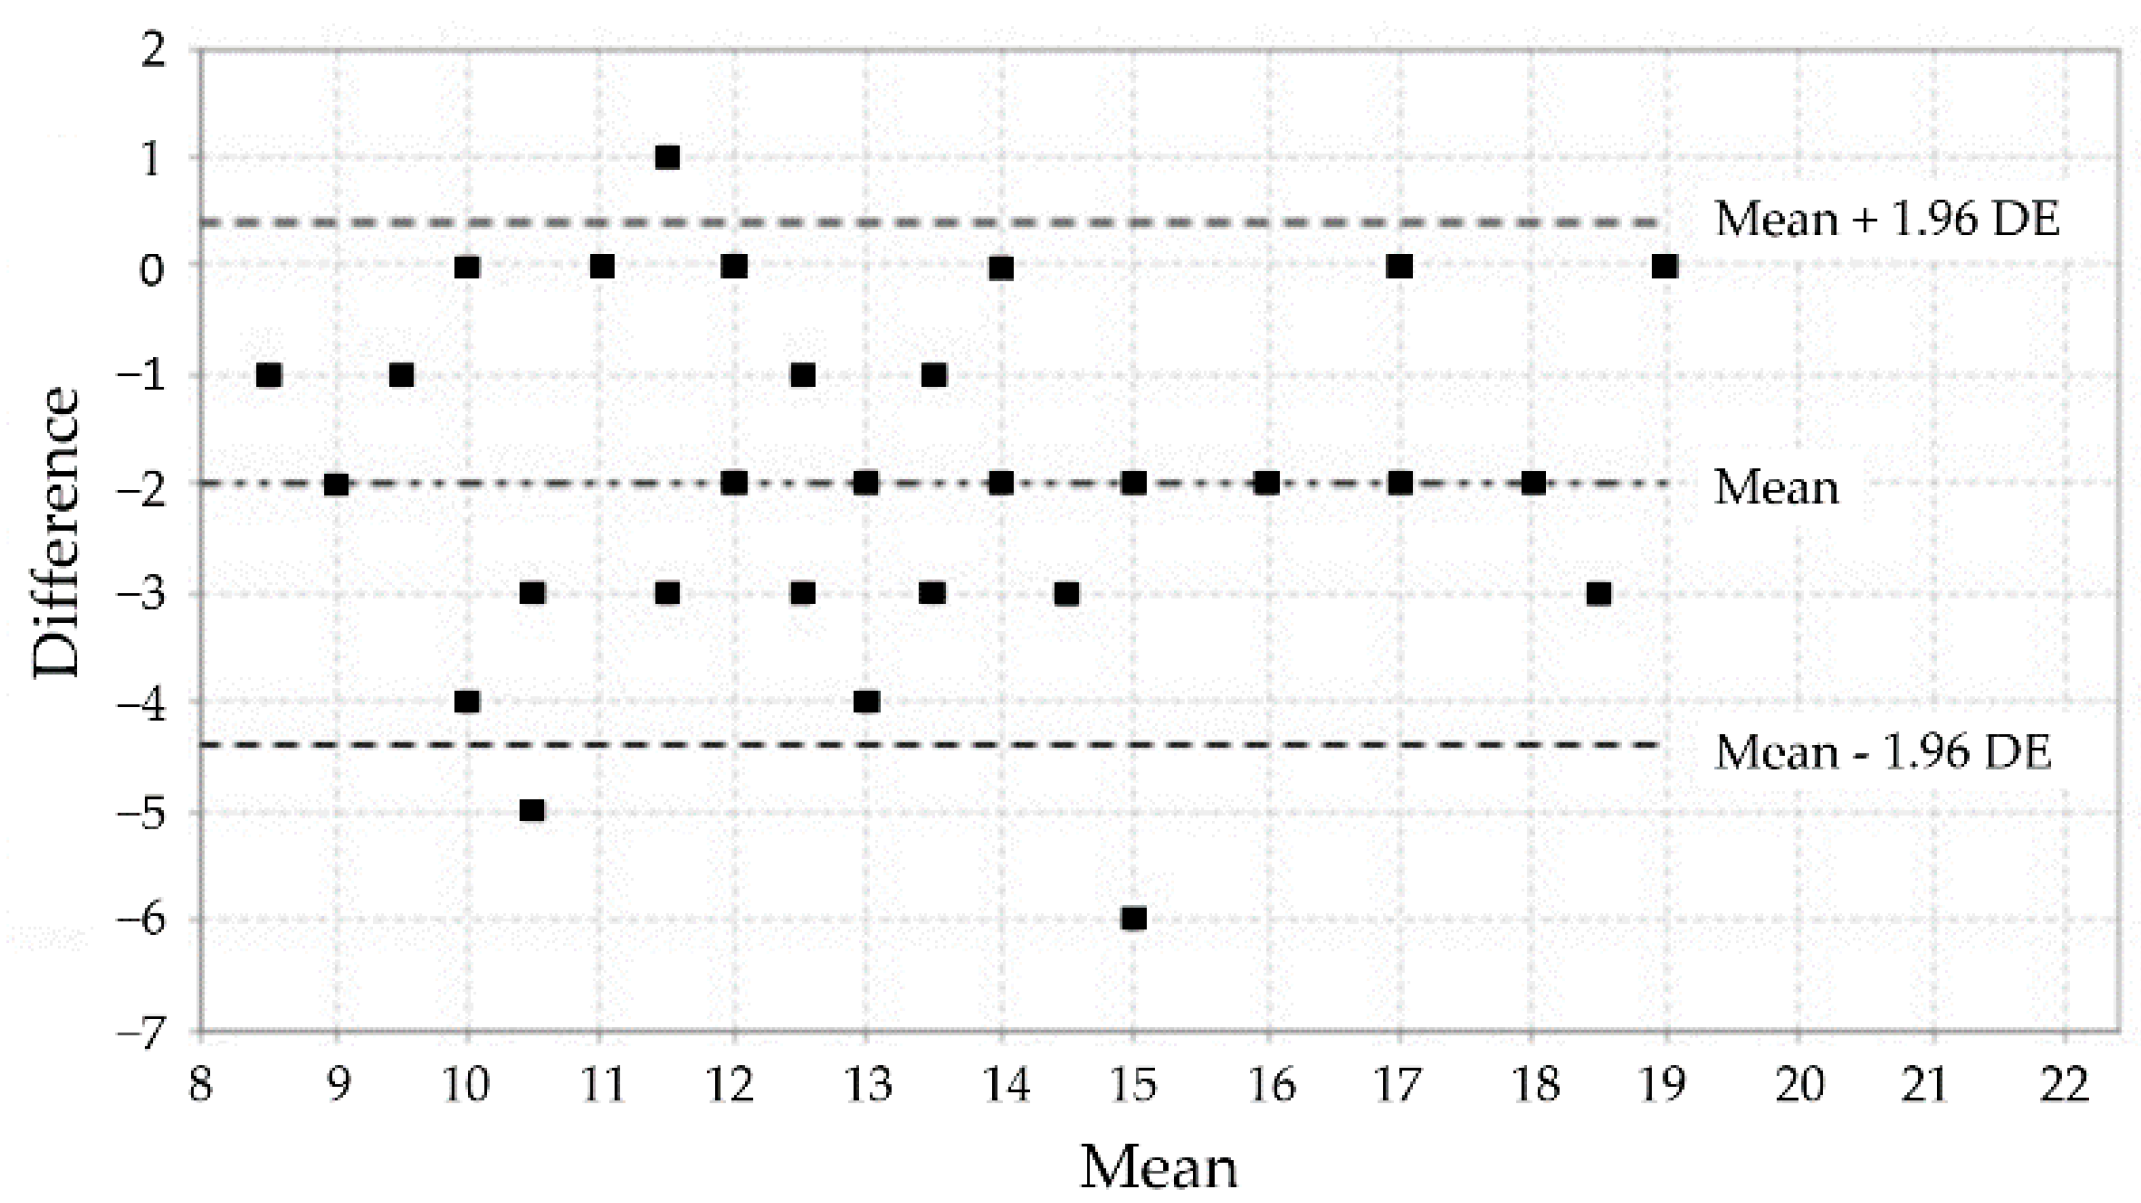
3.3. Analysis of the Test-Retest Reliability
3.4. Analysis of Differences in MI Ability as Measured by the MIQ-3 Concerning Sex and Age
3.5. Analysis of Temporal Congruence Concerning Sex and Age
4. Discussion
Limitations
5. Conclusions
Author Contributions
Funding
Institutional Review Board Statement
Informed Consent Statement
Data Availability Statement
Acknowledgments
Conflicts of Interest
References
- Schack, T.; Essig, K.; Frank, C.; Koester, D. Mental representation and motor imagery training. Front. Hum. Neurosci. 2014, 8, 328. [Google Scholar] [CrossRef]
- Fernández Gómez, E.; Sánchez Cabeza, A. Imaginería motora: Revisión sistemática de su efectividad en la rehabilitación de la extremidad superior tras un ictus. Rev. Neurol. 2018, 66, 137–146. [Google Scholar] [CrossRef] [PubMed]
- Jeannerod, M. Mental imagery in the motor context. Neuropsychologia 1995, 33, 1419–1432. [Google Scholar] [CrossRef]
- Campos, A.; López-Araujo, Y.; Perez-Fabello, M.J. Imágenes mentales utilizadas en diferentes actividades físicas y deportivas. Cuad. Psicol. Deporte 2016, 16, 45–50. [Google Scholar]
- Feltz, D.L.; Landers, D.M. The effects of mental practice on motor skill learning and performance: A meta-analysis. J. Sport Psychol. 1983, 5, 25–57. [Google Scholar] [CrossRef]
- Richardson, A. Verbalizer-visualizer: A cognitive style dimension. J. Ment. Imag. 1977, 1, 109–125. [Google Scholar]
- de Sousa Fortes, L.; Ferreira do Carmo, Y.A.; dos Santos Felix Cruz, R.B.; Pereira de Lima, E.T.; Novais Mansur, H. Efeito do treino mental no desempenho do arremesso de lance livre em jovens basquetebolistas. Motricidade 2017, 13, 4–12. [Google Scholar] [CrossRef][Green Version]
- Mendes, P.A.; Marinho, D.A.; Petrica, J.D.; Silveira, P.; Monteiro, D.; Cid, L. Translation and validation of the Movement Imagery Questionnaire-3 (MIQ-3) with Portuguese athletes/Traducao e validacao do Movement Imagery Questionnaire-3 (MIQ-3) com atletas portugueses. Motricidade 2016, 12, 149–159. [Google Scholar] [CrossRef]
- García Delgado, W.L. La imagen mental del movimiento para el mejoramiento de la precisión y rapidez de los grados principiantes en taekwondo. Lect. Educ. Física Deportes 2014, 195, 8. [Google Scholar]
- Amorim, A.; Duarte-Mendes, P.; Travassos, B. Efficacy of an Imagery program training in competitive and non-competitive Boccia participants. Cuad. Psicol. Deporte 2018, 18, 205–213. [Google Scholar]
- Marshall, B.; Wright, D.J. Layered Stimulus Response Training versus Combined Action Observation and Imagery: Effects on Golf Putting Performance and Imagery Ability Characteristics. J. Imag. Res. Sport Phys. Act. 2016, 11, 35–46. [Google Scholar] [CrossRef]
- McNeill, E.; Ramsbottom, N.; Toth, A.J.; Campbell, M.J. Kinaesthetic imagery ability moderates the effect of an AO + MI intervention on golf putt performance: A pilot study. Psychol. Sport Exerc. 2020, 46, 101610. [Google Scholar] [CrossRef]
- Urquiola Echeguia, A.; Sánchez Hernández, I. Rehabilitación de la Marcha Mediante el Uso de la Imagen Motora en Pacientes Hemipléjicos [Trabajo Final de Grado]. 2014. Available online: http://hdl.handle.net/20.500.13002/176 (accessed on 5 February 2022).
- Kolbaşı, E.N.; Ersoz Huseyinsinoglu, B.; Erdoğan, H.A.; Çabalar, M.; Bulut, N.; Yayla, V. What are the determinants of explicit and implicit motor imagery ability in stroke patients? A controlled study. Somat. Mot. Res. 2020, 37, 84–91. [Google Scholar] [CrossRef]
- Cores, E.V.; Merino, A.; Eizaguirre, M.B.; Vanotti, S.; Rodríguez Quiroga, S.A.; Arakaki, T.; Garreto, N.S. Imaginería motriz en pacientes con Parkinson: El paradigma de la cronometría mental. Rev. Argent. Neuropsicol. 2015, 27, 25–34. [Google Scholar]
- Grande Alonso, M. Análisis Neurofisiológico y Abordaje Fisioterápico Multimodal en Pacientes con Dolor Lumbar Crónico Inespecífico. Ph.D. Thesis, Universidad Autónoma de Madrid, Madrid, España, 2020. Available online: http://hdl.handle.net/10486/693363 (accessed on 5 February 2022).
- Daly, A.E.; Bialocerkowski, A.E. Does evidence support physiotherapy management of adult Complex Regional Pain Syndrome Type One? A systematic Review. Eur. J. Pain 2009, 13, 339–353. [Google Scholar] [CrossRef]
- Mirela Cristina, L.; Matei, D.; Ignat, B.; Popescu, C.D. Mirror therapy enhances upper extremity motor recovery in stroke patients. Acta Neurol. Belg. 2015, 115, 597–603. [Google Scholar] [CrossRef]
- Cuenca-Martínez, F.; Suso-Martí, L. Capacidad de Generar Imágenes Mentales Motoras y su Relación con los Niveles de Actividad Física. NeuroRehabNews 2019, 3, e0057. [Google Scholar] [CrossRef]
- Tabernig, C.B.; Lopez, C.A.; Carrere, L.C.; Spaich, E.G.; Ballario, C.H. Neurorehabilitation therapy of patients with severe stroke based on functional electrical stimulation commanded by a brain-computer interface. J. Rehabil. Assist. Technol. Eng. 2018, 5, 1–12. [Google Scholar] [CrossRef]
- Lovat, A.M. Las personas como sujetos de investigación. ¿Aplicación de la ingeniería genética para mejorar personas humanas y curar la vejez? Rev. Derecho Priv. 2021, 9, 559–608. [Google Scholar]
- Nicholson, V.; Watts, N.; Chani, Y.; Keogh, J.W.L. Motor imagery training improves balance and mobility outcomes in older adults: A systematic review. J. Physiother. 2019, 65, 200–207. [Google Scholar] [CrossRef]
- Schuster, C.; Hilfiker, R.; Amft, O.; Scheidhauer, A.; Andrews, B.; Butler, J.; Kischka, U.; Ettlin, T. Best practice for motor imagery: A systematic literature review on motor imagery training elements in five different disciplines. BMC Med. 2011, 17, 75. [Google Scholar] [CrossRef] [PubMed]
- Muñoz Cruz, R. Diferencias en la autopercepción entre ancianos institucionalizados y no institucionalizados. Gerokomos 2015, 26, 45–47. [Google Scholar] [CrossRef][Green Version]
- Saimpont, A.; Malouin, F.; Tousignant, B.; Jackson, P.L. Motor imagery and aging. J. Mot. Behav. 2013, 45, 21–28. [Google Scholar] [CrossRef] [PubMed]
- Williams, S.E.; Cumming, J.; Ntoumanis, N.; Nordin Bates, S.M.; Ramsey, R.; Hall, C. Further validation and development of the movement imagery questionnaire. J. Sport Exerc. Psychol. 2012, 34, 621–646. [Google Scholar] [CrossRef]
- Trapero-Asenjo, S.; Gallego-Izquierdo, T.; Pecos-Martín, D.; Nunez-Nagy, S. Translation, cultural adaptation, and validation of the Spanish version of the Movement Imagery Questionnaire-3 (MIQ-3). Musculoskelet. Sci. Pract. 2020, 51, 102313. [Google Scholar] [CrossRef]
- Dror, I.E.; Kosslyn, S.M. Mental imagery and aging. Psychol. Aging 1994, 9, 90. [Google Scholar] [CrossRef]
- Suica, Z.; Behrendt, F.; Gäumann, S.; Gerth, U.; Schmidt-Trucksäss, A.; Ettlin, T.; Schuster-Amft, C. Imagery ability assessments: A cross-disciplinary systematic review and quality evaluation of psychometric properties. BCM Med. 2022, 20, 166. [Google Scholar] [CrossRef]
- Liu, K.P.; Lai, M.; Fong, S.S.; Bissett, M. Imagery Ability and Imagery Perspective Preference: A Study of Their Relationship and Age-and Gender-Related Changes. Behav. Neurol. 2019, 2019, 7536957. [Google Scholar] [CrossRef]
- Campos, A.; Pérez-Fabello, M.J.; Gómez-Juncal, R. Gender and age differences in measured and self-perceived imaging capacity. Personal. Individ. Differ. 2004, 37, 1383–1389. [Google Scholar] [CrossRef]
- Subirats, L.; Allali, G.; Briansoulet, M.; Salle, J.Y.; Perrochon, A. Age and gender differences in motor imagery. J. Neurol. Sci. 2018, 391, 114–117. [Google Scholar] [CrossRef]
- Kottner, J.; Audigé, L.; Brorson, S.; Donner, A.; Gajewski, B.J.; Hróbjartsson, A.; Roberts, C.; Shoukri, M.; Streiner, D.L. Guidelines for Reporting Reliability and Agreement Studies (GRRAS) were proposed. J. Clin. Epidemiol. 2011, 64, 96–106. [Google Scholar] [CrossRef]
- Pfeiffer, E. A short portable mental status questionnaire for the assessment of organic brain deficit in elderly patients. J. Am. Geriatr. Soc. 1975, 23, 433–441. [Google Scholar] [CrossRef]
- Martínez de la Iglesia, J.; Dueñas Herrero, R.; Onís Vilches, M.C.; Aguado Taberné, C.; Albert Colomer, C.; Luque, R. Adaptación y validación al castellano del cuestionario de Pfeiffer (SPMSQ) para detectar la existencia de deterioro cognitivo en personas mayores de 65 años. Med. Clin. 2001, 117, 129–134. Available online: https://www.elsevier.es/es-revista-medicina-clinica-2-articulo-adaptacion-validacion-al-castellano-del-S0025775301720404 (accessed on 15 March 2022). [CrossRef]
- Yesavage, J.A.; Brink, T.L.; Rose, T.L.; Lung, O.; Huang, V.; Adey, M.; Leirer, V.O. Development and validation of a geriatric depression screening scale: A preliminary report. J. Psychiatr. Res. 1982, 17, 37. [Google Scholar] [CrossRef]
- Tavakol, M.; Dennick, R. Making sense of Cronbach’s alpha. Int. J. Med. Educ. 2011, 2, 53–55. [Google Scholar] [CrossRef]
- Landis, J.R.; Koch, G.G. The measurement of observer agreement for categorical data. Biometrics 1977, 33, 159–174. [Google Scholar] [CrossRef]
- López de Ullibarri Galparsoro, I.; Pita Fernández, S. Medidas de concordancia: El índice de Kappa. Cad Aten Primaria 1999, 6, 169–171. [Google Scholar]
- Sim, J.; Wright, C.C. The kappa statistic in reliability studies: Use, interpretation, and sample size requirements. Phys. Ther. 2005, 85, 257–268. [Google Scholar] [CrossRef]
- Weir, J.P. Quantifying test-retest reliability using the intraclass correlation coefficient and the SEM. J. Strength Cond. Res. 2005, 19, 231–240. [Google Scholar] [CrossRef]
- Field, A. Discovering Statistics Using SPSS: (And Sex, Drugs, and Rock’n’roll), 3rd ed.; SAGE: Thousand Oaks, CA, USA, 2009. [Google Scholar]
- Rosenthal, R.; DiMatteo, M.R. Meta-analysis: Recent developments in quantitative methods for literature reviews. Annu. Rev. Psychol. 2001, 52, 59–82. [Google Scholar] [CrossRef]
- Ruffino, C.; Gaveau, J.; Papaxanthis, C.; Lebon, F. An acute session of motor imagery training induces use-dependent plasticity. Sci. Rep. 2019, 9, 20002. [Google Scholar] [CrossRef]
- Hall, C.R.; Pongrac, J.; Buckolz, E. The measurement of imagery ability. Hum. Mov. Sci. 1985, 4, 107–118. [Google Scholar] [CrossRef]
- Hall, C.R.; Martin, K.A. Measuring movement imagery abilities: A revision of the Movement Imagery Questionnaire. J. Ment. Imag. 1997, 21, 143–154. [Google Scholar]
- Roberts, R.; Callow, N.; Hardy, L.; Markland, D.; Bringer, J. Movement imagery ability: Development and assessment of a revised version of the vividness of movement imagery questionnaire. J. Sport Exerc. Psychol. 2008, 30, 200–221. [Google Scholar] [CrossRef]
- Dickstein, R.; Deutsch, J.E. Motor imagery in physical therapist practice. Phys. Ther. 2007, 87, 942–953. [Google Scholar] [CrossRef]
- Mulder, T.; Hochstenbach, J.B.; van Heuvelen, M.J.; den Otter, A.R. Motor imagery: The relation between age and imagery capacity. Hum. Mov. Sci. 2007, 26, 203–211. [Google Scholar] [CrossRef]
- Schott, N. Age-related differences in motor imagery: Working memory as a mediator. Exp. Aging Res. 2012, 38, 559–583. [Google Scholar] [CrossRef]
- Worthington, R.L.; Whittaker, T.A. Scale Development Research A Content Analysis and Recommendations for Best Practices. Couns. Pyschol. 2006, 34, 806–838. [Google Scholar] [CrossRef]


| Variables | Frequency (%) |
|---|---|
| Gender | |
| Male | 27 (45%) |
| Female | 33 (55%) |
| n (%) | 60 (100%) |
| Age (M ± SD) | 83.5 ± 7.80 |
| 70–79 years | 16 (26.67%) |
| 80–89 years | 26 (43.33%) |
| 90–100 years | 18 (30%) |
| Subscale | Mean | CI 95% | SD | |
|---|---|---|---|---|
| IVS | 1st S | 14.42 | 13.63–15.21 | 3.055 |
| 2nd S | 16.67 | 15.86–17.47 | 3.112 | |
| EVS | 1st S | 18.08 | 17.32–18.84 | 2.936 |
| 2nd S | 20.58 | 19.90–21.27 | 2.651 | |
| KS | 1st S | 12.25 | 11.59–12.91 | 2.55 |
| 2nd S | 14.25 | 13.56–14.94 | 2.678 | |
| No | Kw | CI (95%) | p | |
|---|---|---|---|---|
| Item 1 | 0.29 | 0.14–0.45 | <0.0001 | |
| Item 2 | 0.47 | 0.31–0.64 | <0.0001 | |
| Item 3 | 0.36 | 0.20–0.52 | <0.0001 | |
| Item 4 | 0.70 | 0.58–0.82 | <0.0001 | |
| Item 5 | 0.26 | 0.11–0.41 | <0.0001 | |
| Item 6 | 0.34 | 0.18–0.49 | <0.0001 | |
| Item 7 | 0.30 | 0.15–0.45 | <0.0001 | |
| Item 8 | 0.71 | 0.59–0.82 | <0.0001 | |
| Item 9 | 0.39 | 0.24–0.54 | <0.0001 | |
| Item 10 | 0.40 | 0.24–0.55 | <0.0001 | |
| Item 11 | 0.25 | 0.12–0.39 | =0.001 | |
| Item 12 | 0.70 | 0.55–0.81 | <0.0001 | |
| Cronbach’s Alpha | ICC | CI (95%) | p | |
| IVS | 0.615 | 0.611 | 0.02–0.83 | <0.001 |
| EVS | 0.651 | 0.534 | 0.07–0.80 | <0.001 |
| KS | 0.556 | 0.691 | 0.07–0.90 | <0.001 |
| Inter-Subject Factor | MIQ-3 | |||
|---|---|---|---|---|
| Sex | Internal Visual Subscale | Mean (SD) | ||
| First session | Second session | |||
| Male (n = 27) | 14.41 (2.76) | 16.56 (2.91) | ||
| Female (n = 33) | 14.42 (3.32) | 16.76 (3.31) | ||
| Time × sex interaction | F(1, 58) = 0.12; p = 0.736; ηp2 = 0.002 | |||
| Inter-subject factor (Sex) | F(1, 58) = 0.02; p = 0.886; ηp2 < 0.001 | |||
| Inter-group mean difference and CI (95%) | First session | −0.02 (−1.62; 1.58) p = 0.983 d < 0.01 | ||
| Second session | −0.20 (−1.84; 1.43) p = 0.805 d = 0.06 | |||
| Intra-subject factor | F(1, 58) = 67.68; p < 0.001; ηp2 = 0.537 | |||
| Intra-group mean difference and CI (95%) | Male | −2.15 (−2.96; −1.34) p < 0.001 | ||
| Female | −2.33 (−3.07; −1.60) p < 0.001 | |||
| External Visual Subscale | Mean (SD) | |||
| First session | Second session | |||
| Male (n = 27) | 18.41 (2.42) | 20.67 (2.24) | ||
| Female (n = 33) | 17.82 (3.31) | 20.52 (2.98) | ||
| Time × sex interaction | F(1, 58) = 0.71; p = 0.403; ηp2 = 0.012 | |||
| Inter-subject factor (sex) | F(1, 58) = 0.30; p = 0.589; ηp2 = 0.005 | |||
| Inter-group mean difference and CI (95%) | First session | 0.59 (−0.94; 2.12) p = 0.444 d = 0.20 | ||
| Second session | 0.15 (−1.24; 1.54) p = 0.828 d = 0.06 | |||
| Intra-subject factor | F(1, 58) = 91.13; p < 0.001; ηp2 = 0.611 | |||
| Intra-group mean difference and CI (95%) | Male | −2.26 (−3.03; −1.49) p < 0.001 | ||
| Female | −2.70 (−3.39; −2.00) p < 0.001 | |||
| Kinesthetic Subscale | Mean (SD) | |||
| First session | Second session | |||
| Male (n = 27) | 12.48 (2.55) | 14.26 (2.68) | ||
| Female (n = 33) | 12.06 (2.59) | 14.24 (2.72) | ||
| Time × sex interaction | F(1, 58) = 1.64; p = 0.205; ηp2 = 0.028 | |||
| Inter-subject factor (Sex) | F(1, 58) = 0.11; p = 0.743; ηp2 = 0.002 | |||
| Inter-group mean difference and CI (95%) | First session | 0.42 (−0.91; 1.75) p = 0.530 d = 0.16 | ||
| Second session | 0.02 (−1.39; 1.42) p = 0.981 d < 0.01 | |||
| Intra-subject factor | F(1, 58) = 157.80. p < 0.001; ηp2 = 0.731 | |||
| Intra-group mean difference and CI (95%) | Male | −1.78 (−2.25; −1.31) p < 0.001 | ||
| Female | −2.18 (−2.61; −1.76) p < 0.001 | |||
| Inter-Subject Factor | MIQ-3 | ||||
|---|---|---|---|---|---|
| Age range | Internal Visual Subscale | Mean (SD) | |||
| First session | Second session | ||||
| 70–79 years (n = 16) | 18.12 (2.22) | 19.25 (2.02) | |||
| 80–89 years (n = 26) | 13.77 (1.93) | 17.73 (1.43) | |||
| 90–100 years (n = 18) | 12.06 (1.77) | 12.83 (1.86) | |||
| Time × age range interaction | F(2, 57) = 31.68; p < 0.001; ηp2 = 0.526 | ||||
| Inter-subject factor (age range) | F(2, 57) = 57.54; p < 0.001; ηp2 = 0.669 | ||||
| Inter-group mean difference and CI (95%) | First session | 70–79 vs. 80–89 | 4.36 (2.82; 5.89) p < 0.001 d = 2.13 | ||
| 70–79 vs. 90–100 | 6.07 (4.41; 7.73) p < 0.001 d = 3.04 | ||||
| 80–89 vs. 90–100 | 1.71 (0.23; 3.19) p = 0.018 d = 0.92 | ||||
| Second session | 70–79 vs. 80–89 | 1.52 (0.16; 2.88) p = 0.023 d = 0.91 | |||
| 70–79 vs. 90–100 | 6.42 (4.95; 7.88) p < 0.001 d = 3.32 | ||||
| 80–89 vs. 90–100 | 4.88 (3.59; 6.21) p < 0.001 d = 3.03 | ||||
| Intra-subject factor | F(1, 57) = 109.86; p < 0.001; ηp2 = 0.643 | ||||
| Intra-group mean difference and CI (95%) | 70–79 years | −1.13 (−1.86; −0.39) p = 0.003 | |||
| 80–89 years | −3.96 (−4.54; −3.39) p < 0.001 | ||||
| 90–100 years | −0.78 (−1.47; −0.09) p = 0.028 | ||||
| External Visual Subscale | Mean (SD) | ||||
| First session | Second session | ||||
| 70–79 years (n = 16) | 21.13 (2.03) | 23.00 (1.55) | |||
| 80–89 years (n = 26) | 17.62 (2.32) | 21.38 (1.42) | |||
| 90–100 years (n = 18) | 16.06 (2.24) | 17.28 (1.13) | |||
| Time × age range interaction | F(2, 57) = 14.03; p < 0.001; ηp2 = 0.330 | ||||
| Inter-subject factor (age range) | F(2, 57) = 45.60; p < 0.001; ηp2 = 0.615 | ||||
| Inter-group mean difference and CI (95%) | First session | 70–79 vs. 80–89 | 3.51 (1.77; 5.25) p < 0.001 d = 1.58 | ||
| 70–79 vs. 90–100 | 5.07 (3.19; 6.95) p < 0.001 d = 2.36 | ||||
| 80–89 vs. 90–100 | 1.56 (−0.12; 3.24) p = 0.077 d = 0.68 | ||||
| Second session | 70–79 vs. 80–89 | 1.62 (0.54; 2.69) p = 0.001 d = 1.10 | |||
| 70–79 vs. 90–100 | 5.72 (4.56; 6.89) p < 0.001 d = 4.26 | ||||
| 80–89 vs. 90–100 | 4.11 (3.07; 5.15) p < 0.001 d = 3.13 | ||||
| Intra-subject factor | F(1, 57) = 109.03; p < 0.001; ηp2 = 0.657 | ||||
| Intra-group mean difference and CI (95%) | 70–79 years | −1.88 (−2.71; −1.04) p < 0.001 | |||
| 80–89 years | −3.77 (−4.42; −3.12) p < 0.001 | ||||
| 90–100 years | −1.22 (−2.01; −0.44) p = 0.003 | ||||
| Kinesthetic Subscale | Mean (SD) | ||||
| First session | Second session | ||||
| 70–79 years (n = 16) | 15.44 (1.86) | 17.44 (1.63) | |||
| 80–89 years (n = 26) | 11.62 (1.42) | 14.12 (1.28) | |||
| 90–100 years (n = 18) | 10.33 (1.61) | 11.61 (1.79) | |||
| Time × age range interaction | F(2, 57) = 6.28; p = 0.003; ηp2 = 0.181 | ||||
| Inter-subject Factor (age range) | F(2, 57) = 60.47; p < 0.001; ηp2 = 0.680 | ||||
| Inter-group mean difference and CI (95%) | First session | 70–79 vs. 80–89 | 3.82 (2.57; 5.08) p < 0.001 d = 2.39 | ||
| 70–79 vs. 90–100 | 5.10 (3.75; 5.46) p < 0.001 d = 2.95 | ||||
| 80–89 vs. 90–100 | 1.28 (0.07; 2.05) p = 0.034 d = 0.86 | ||||
| Second session | 70–79 vs. 80–89 | 3.32 (2.12; 4.53) p < 0.001 d = 2.34 | |||
| 70–79 vs. 90–100 | 5.83 (4.52; 7.13) p < 0.001 d = 3.40 | ||||
| 80–89 vs. 90–100 | 2.50 (1.34; 3.67) p < 0.001 d = 1.67 | ||||
| Intra-subject factor | F(1, 57) = 168.59. p < 0.001; ηp2 = 0.747 | ||||
| Intra-group mean difference and CI (95%) | 70–79 years | −2.00 (−2.56; −1.44) p < 0.001 | |||
| 80–89 years | −2.50 (−2.94; −2.06) p < 0.001 | ||||
| 90–100 years | −1.28 (−1.81; −0.75) p < 0.001 | ||||
| Inter-Subject Factor | Temporal Congruence | |||
|---|---|---|---|---|
| Sex | Male (n = 27) Median (Q1–Q3) | Female (n = 33) Median (Q1–Q3) | Effect Size | |
| Elbow Flexo-Extension Difference | 0.20 (−0.30; 0.35) | 0.00 (−0.20; 0.30) | p = 0.720 r = 0.05 | |
| Knee Flexo-Extension Difference | 0.10 (−0.05; 0.40) | 0.10 (−0.30; 0.30) | p = 0.162 r = 0.02 | |
| Get up and Sit down Difference | −0.60 (−0.80; −0.25) | −0.60 (−0.80; −0.30) | p = 0.905 r = 0.12 | |
| Inter-Subject Factor | Temporal Congruence | |||||
|---|---|---|---|---|---|---|
| Age range | 70–79 Years Median (Q1–Q3) | 80–89 Years Median (Q1–Q3) | 90–100 Years Median (Q1–Q3) | Effect Size | ||
| Elbow Flexo-Extension Difference | −0.25 (−0.30; −0.15) | 0.20 (−0.10; 0.30) | 0.20 (−0.10; 0.50) | Global | p = 0.001 | |
| 70–79 vs. 80–89 | p = 0.007 | |||||
| 70–79 vs. 90–100 | p = 0.001 | |||||
| 80–89 vs. 90–100 | p = 0.999 | |||||
| Knee Flexo-Extension Difference | −0.05 (−0.40; 0.10) | 0.10 (−0.20; 0.40) | 0.35 (0.10; 0.50) | Global | p = 0.008 | |
| 70–79 vs. 80–89 | p = 0.086 | |||||
| 70–79 vs. 90–100 | p = 0.007 | |||||
| 80–89 vs. 90–100 | p = 0.752 | |||||
| Get up and Sit down Difference | −0.65 (−1.10; −0.20) | −0.45 (−0.80; −0.20) | −0.70 (−0.90; −0.30) | Global | p = 0.134 | |
| 70–79 vs. 80–89 | p = 0.312 | |||||
| 70–79 vs. 90–100 | p = 0.999 | |||||
| 80–89 vs. 90–100 | p = 0.258 | |||||
Publisher’s Note: MDPI stays neutral with regard to jurisdictional claims in published maps and institutional affiliations. |
© 2022 by the authors. Licensee MDPI, Basel, Switzerland. This article is an open access article distributed under the terms and conditions of the Creative Commons Attribution (CC BY) license (https://creativecommons.org/licenses/by/4.0/).
Share and Cite
Suárez Rozo, M.E.; Trapero-Asenjo, S.; Pecos-Martín, D.; Fernández-Carnero, S.; Gallego-Izquierdo, T.; Jiménez Rejano, J.J.; Nunez-Nagy, S. Reliability of the Spanish Version of the Movement Imagery Questionnaire-3 (MIQ-3) and Characteristics of Motor Imagery in Institutionalized Elderly People. J. Clin. Med. 2022, 11, 6076. https://doi.org/10.3390/jcm11206076
Suárez Rozo ME, Trapero-Asenjo S, Pecos-Martín D, Fernández-Carnero S, Gallego-Izquierdo T, Jiménez Rejano JJ, Nunez-Nagy S. Reliability of the Spanish Version of the Movement Imagery Questionnaire-3 (MIQ-3) and Characteristics of Motor Imagery in Institutionalized Elderly People. Journal of Clinical Medicine. 2022; 11(20):6076. https://doi.org/10.3390/jcm11206076
Chicago/Turabian StyleSuárez Rozo, Manuel Enrique, Sara Trapero-Asenjo, Daniel Pecos-Martín, Samuel Fernández-Carnero, Tomás Gallego-Izquierdo, José Jesús Jiménez Rejano, and Susana Nunez-Nagy. 2022. "Reliability of the Spanish Version of the Movement Imagery Questionnaire-3 (MIQ-3) and Characteristics of Motor Imagery in Institutionalized Elderly People" Journal of Clinical Medicine 11, no. 20: 6076. https://doi.org/10.3390/jcm11206076
APA StyleSuárez Rozo, M. E., Trapero-Asenjo, S., Pecos-Martín, D., Fernández-Carnero, S., Gallego-Izquierdo, T., Jiménez Rejano, J. J., & Nunez-Nagy, S. (2022). Reliability of the Spanish Version of the Movement Imagery Questionnaire-3 (MIQ-3) and Characteristics of Motor Imagery in Institutionalized Elderly People. Journal of Clinical Medicine, 11(20), 6076. https://doi.org/10.3390/jcm11206076