

A Head-to-Head Comparison of 18F-Fluorocholine PET/CT and Conventional MRI as Predictors of Outcome in IDH Wild-Type High-Grade Gliomas
 ,
,  ,
,  ,
, 
Abstract
1. Introduction
2. Materials and Methods
2.1. Patients
2.2. MRI and PET/CT Acquisition and Evaluations
2.3. Molecular Analysis
2.4. Statistical Analysis
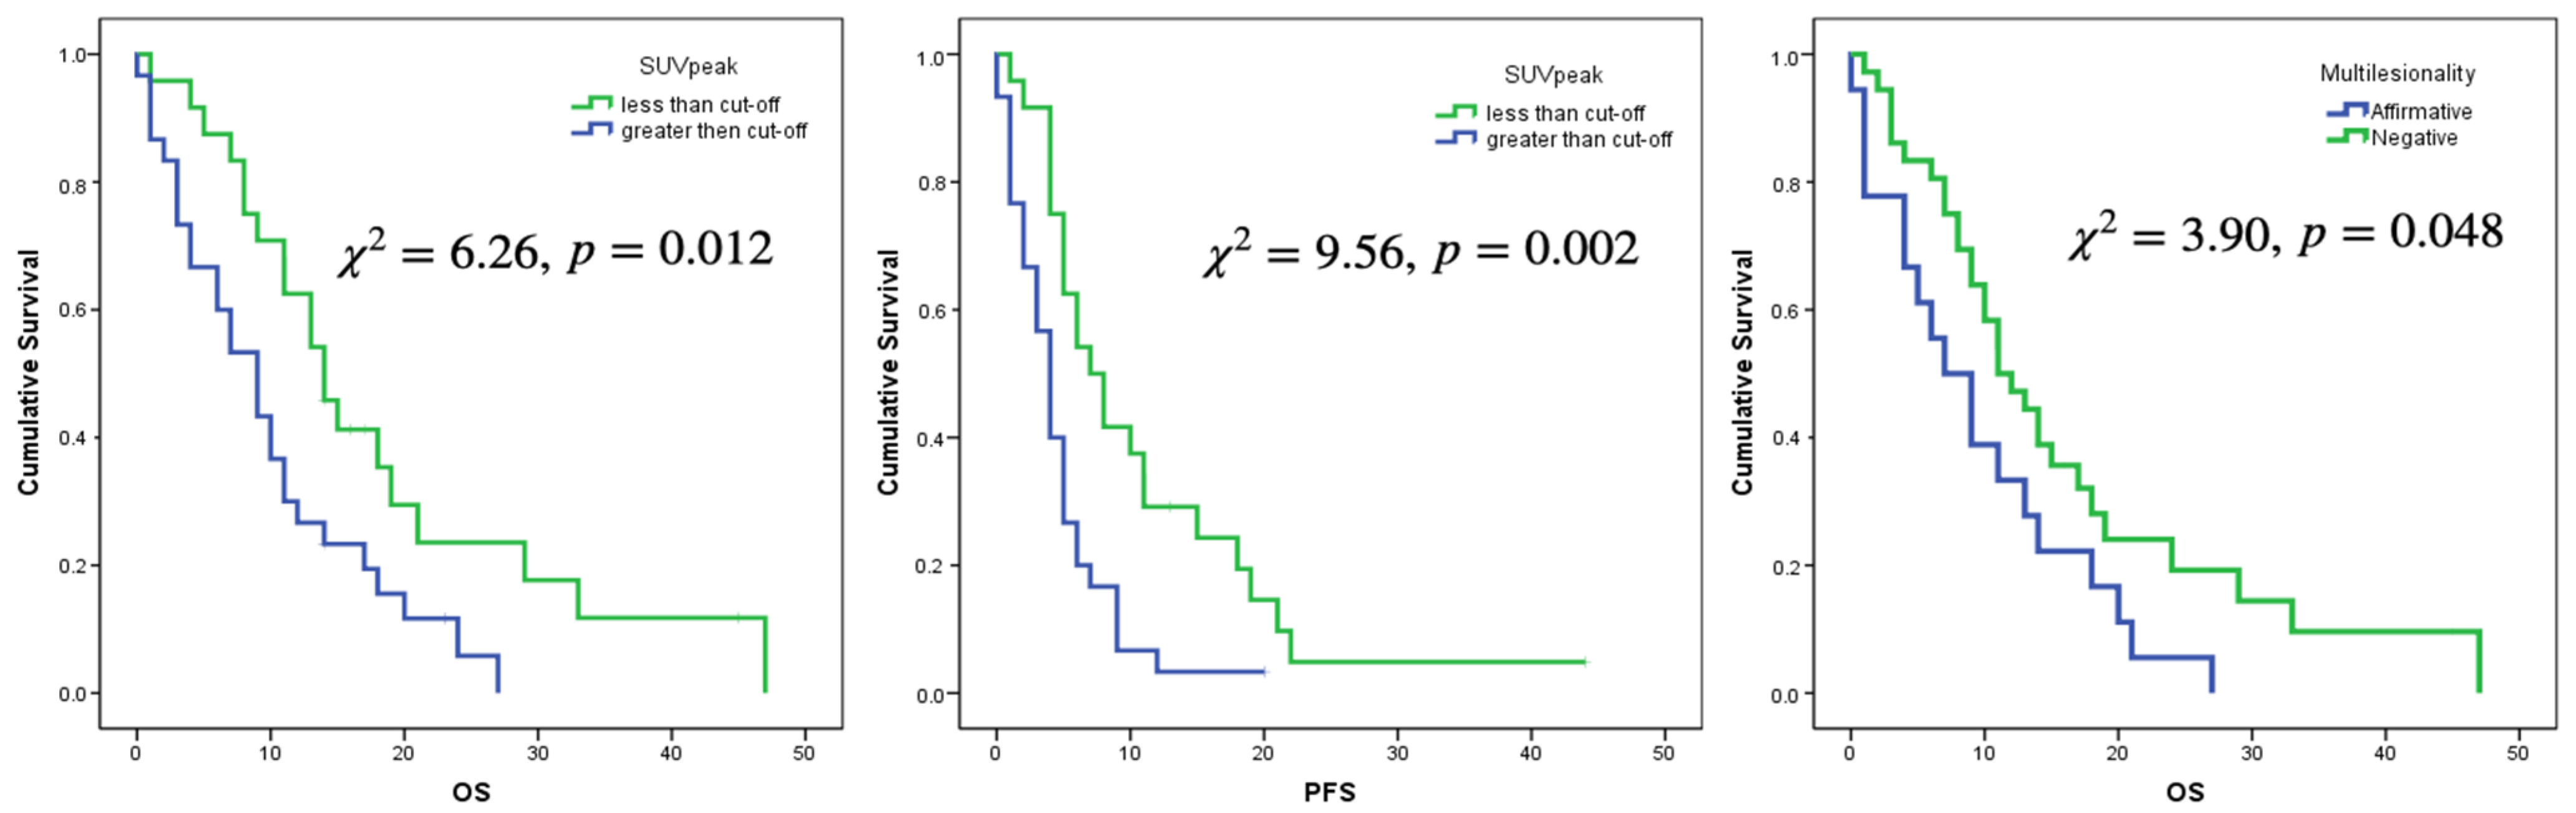
3. Results
4. Discussion
5. Conclusions
Author Contributions
Funding
Institutional Review Board Statement
Informed Consent Statement
Data Availability Statement
Conflicts of Interest
References
- Qazi, M.A.; Vora, P.; Venugopal, C.; Sidhu, S.S.; Moffat, J.; Swanton, C.; Singh, S.K. Intratumoral heterogeneity: Pathways to treatment resistance and relapse in human glioblastoma. Ann. Oncol. 2017, 28, 1448–1456. [Google Scholar] [CrossRef] [PubMed]
- Han, S.; Liu, Y.; Cai, S.J.; Qian, M.; Ding, J.; Larion, M.; Gilbert, M.R.; Yang, C. IDH mutation in glioma: Molecular mechanisms and potential therapeutic targets. Br. J. Cancer 2020, 122, 1580–1589. [Google Scholar] [CrossRef] [PubMed]
- Louis, D.N.; Perry, A.; Reifenberger, G.; Von Deimling, A.; Figarella-Branger, D.; Cavenee, W.K.; Ohgaki, H.; Wiestler, O.D.; Kleihues, P.; Ellison, D.W. The 2016 World Health Organization Classification of Tumors of the Central Nervous System: A summary. Acta Neuropathol. 2016, 131, 803–820. [Google Scholar] [CrossRef] [PubMed]
- Hartmann, C.; Hentschel, B.; Wick, W.; Capper, D.; Felsberg, J.; Simon, M.; Westphal, M.; Schackert, G.; Meyermann, R.; Pietsch, T.; et al. Patients with IDH1-wild type anaplastic astrocytomas exhibit worse prognosis than IDH1-mutatedglioblastomas, and IDH1 mutation status accounts for the unfavorable prognostic effect of higher age: Implications for classification of gliomas. Acta Neuropathol. 2010, 120, 707–718. [Google Scholar] [CrossRef]
- Suh, C.H.; Kim, H.S.; Jung, S.C.; Choi, C.G.; Kim, S.J. Imaging prediction of isocitrate dehydrogenase (IDH) mutation in patients with glioma: A systemic review and meta-analysis. Eur. Radiol. 2019, 29, 745–758. [Google Scholar] [CrossRef]
- Roux, A.; Roca, P.; Edjlali, M.; Sato, K.; Zanello, M.; Dezamis, E.; Gori, P.; Lion, S.; Fleury, A.; Dhermain, F.; et al. MRI atlas of IDH wild-type Supratentorial Glioblastoma: Probabilistic maps of phenotype, management, and outcomes. Radiology 2019, 293, 633–643. [Google Scholar] [CrossRef]
- Pérez-Beteta, J.; Molina-García, D.; Martínez-González, A.; Henares-Molina, A.; Amo-Salas, M.; Luque, B.; Arregui, E.; Calvo, M.; Borrás, J.M.; Martino, J.; et al. Morphological MRI-based features provide pretreatment survival prediction in glioblastoma. Eur. Radiol. 2019, 29, 1968–1977. [Google Scholar] [CrossRef]
- Burgenske, D.M.; Yang, J.; Decker, P.A.; Kollmeyer, T.M.; Kosel, M.L.; Mladek, A.C.; Caron, A.A.; Vaubel, R.A.; Gupta, S.K.; Kitange, G.J.; et al. Molecular profiling of long-term IDH-wildtype glioblastoma survivors. Neuro Oncol. 2019, 21, 1458–1469. [Google Scholar] [CrossRef]
- Law, I.; Albert, N.L.; Arbizu, J.; Boellaard, R.; Drzezga, A.; Galldiks, N.; la Fougère, C.; Langen, K.-J.; Lopci, E.; Lowe, V.; et al. Joint EANM/EANO/RANO practice guidelines/SNMMI procedure standards for imaging of gliomas using PET with radiolabelled amino acids and [18F]FDG: Version 1.0. Eur. J. Nucl. Med. Mol. Imaging 2018, 46, 540–557. [Google Scholar] [CrossRef]
- Tatekawa, H.; Yao, J.; Oughourlian, T.C.; Hagiwara, A.; Wang, C.; Raymond, C.; Lai, A.; Cloughesy, T.F.; Nghiemphu, P.L.; Liau, L.M.; et al. Maximum uptake and hypermetabolic volume of 18F-FDOPA PET estimate molecular status and overall survivalin low-grade gliomas. A PET and MRI Study. Clin. Nucl. Med. 2020, 45, e505–e511. [Google Scholar] [CrossRef]
- Mittlmeier, L.M.; Suchorska, B.; Ruf, V.; Holzgreve, A.; Brendel, M.; Herms, J.; Bartenstein, P.; Tonn, J.C.; Unterrainer, M.; Albert, N.L. 18F-FET PET uptake characteristics of long-term IDH-wild type diffuse glioma survivors. Cancers 2021, 13, 3163. [Google Scholar] [CrossRef] [PubMed]
- Kong, Z.; Jiang, C.; Liu, D.; Chen, W.; Ma, W.; Cheng, X.; Wang, Y. Quantitative Features From CHO PET Distinguish the WHO Grades of Primary Diffuse Glioma. Clin. Nucl. Med. 2021, 46, 103–110. [Google Scholar] [CrossRef] [PubMed]
- Pérez-García, V.M.; Calvo, G.F.; Bosque, J.J.; León-Triana, O.; Jiménez, J.; Pérez-Beteta, J.; Belmonte-Beitia, J.; Valiente, M.; Zhu, L.; García-Gómez, P.; et al. Universal scaling laws rule explosive growth in human cancers. Nat. Phys. 2020, 16, 1232–1237. [Google Scholar] [CrossRef] [PubMed]
- García-Vicente, A.M.; Pérez-Beteta, J.; Amo-Salas, M.; Pena-Pardo, F.J.; Villena-Martín, M.; Sandoval-Valencia, H.; Mollejo-Villanueva, M.; Barbella, R.; Klein-Zampaña, C.J.; Borrás-Moreno, J.M.; et al. 18F-Fluorocholine PET/CT in the Prediction of Molecular Subtypes and Prognosis for Gliomas. Clin. Nucl. Med. 2019, 44, e548–e558. [Google Scholar] [CrossRef] [PubMed]
- Chukwueke, U.N.; Wen, P.Y. Use of the Response Assessment in Neuro-Oncology (RANO) criteria in clinical trials and clinical practice. CNS Oncol. 2019, 8, CNS28. [Google Scholar] [CrossRef] [PubMed]
- Schaefer, A.; Kim, Y.J.; Kremp, S.; Mai, S.; Fleckenstein, J.; Bohnenberger, H.; Schäfers, H.-J.; Kuhnigk, J.-M.; Bohle, R.M.; Rübe, C.; et al. PET-based delineation of tumour volumes in lung cancer: Comparison with pathological findings. Eur. J. Nucl. Med. Mol. Imaging 2013, 40, 1233–1244. [Google Scholar] [CrossRef] [PubMed]
- Pérez-Beteta, J.; Molina-García, D.; Ortiz-Alhambra, J.A.; Fernández-Romero, A.; Luque, B.; Arregui, E.; Calvo, M.; Borrás, J.M.; Meléndez, B.; de Lope, Á.R.; et al. Tumor surface regularity at MR imaging predicts survival and response to surgery in patients with glioblastoma. Radiology 2018, 288, 218–225. [Google Scholar] [CrossRef] [PubMed]
- Jiménez-Sánchez, J.; Bosque, J.J.; Jimenez-Londoño, G.A.; Molina-García, D.; Martínez, Á.; Pérez-Beteta, J.; Ortega-Sabater, C.; Martínez, A.F.H.; García-Vicente, A.M.; Calvo, G.F.; et al. Evolutionary dynamics at the tumor edge reveal metabolic imaging biomarkers. Proc. Natl. Acad. Sci. USA 2021, 118, e2018110118. [Google Scholar] [CrossRef]
- Armocida, D.; Frati, A.; Salvati, M.; Santoro, A.; Pesce, A. Is Ki-67 index overexpression in IDH wild type glioblastoma a predictor of shorter Progression Free survival? A clinical and Molecular analytic investigation. Clin. Neurol. Neurosurg. 2020, 198, 106126. [Google Scholar] [CrossRef]
- Henker, C.; Kriesen, T.; Schneider, B.; Glass, Ä.; Scherer, M.; Langner, S.; Erbersdobler, A.; Piek, J. Correlation of Ki-67 index with volumetric segmentation n and its value as a prognostic marker in glioblastoma. World Neurosurg. 2019, 125, e1093–e1103. [Google Scholar] [CrossRef]
- Ellingson, B.M.; Wen, P.Y.; Cloughesy, T.F. Evidence and context of use for contrast enhancement as a surrogate of disease burden and treatment response in malignant glioma. Neuro-Oncology 2018, 20, 457–471. [Google Scholar] [CrossRef] [PubMed]
- Petrecca, K.; Guiot, M.; Panet-Raymond, V.; Souhami, L. Failure pattern following complete resection plus radiotherapy and te-mozolomide is at the resection margin in patients with glioblastoma. J. Neuro-Oncol. 2013, 111, 19–23. [Google Scholar] [CrossRef]
- Müller, A.; Jurcoane, A.; Kebir, S.; Ditter, P.; Schrader, F.; Herrlinger, U.; Tzaridis, T.; Mädler, B.; Schild, H.H.; Glas, M.; et al. Quantitative T1-mapping detects cloudy-enhancing tumor compartments predicting outcome of patients with glioblastoma. Cancer Med. 2017, 6, 89–99. [Google Scholar] [CrossRef] [PubMed]
- Blystad, I.; Warntjes, J.B.M.; Smedby, Ö.; Lundberg, P.; Larsson, E.-M.; Tisell, A. Quantitative MRI using relaxometry in malignant gliomas detects contrast enhancement in peritumor aloedema. Sci. Rep. 2020, 10, 17986. [Google Scholar] [CrossRef] [PubMed]
- Yang, Y.; He, M.Z.; Li, T.; Yang, X. MRI combined with PET-CT of different tracers to improve the accuracy of glioma diagnosis: A systematic review and meta-analysis. Neurosurg. Rev. 2019, 42, 185–195. [Google Scholar] [CrossRef] [PubMed]
- Lemée, J.-M.; Clavreul, A.; Aubry, M.; Com, E.; De Tayrac, M.; Eliat, P.-A.; Henry, C.; Rousseau, A.; Mosser, J.; Menei, P. Characterizing the peritumoral brain zone in glioblastoma: A multidisciplinary analysis. J. Neuro-Oncol. 2015, 122, 53–61. [Google Scholar] [CrossRef] [PubMed]
- Eidel, O.; Burth, S.; Neumann, J.-O.; Kieslich, P.J.; Sahm, F.; Jungk, C.; Kickingereder, P.; Bickelhaupt, S.; Mundiyanapurath, S.; Bäumer, P.; et al. Tumor Infiltration in Enhancing and Non-Enhancing Parts of Glioblastoma: A Correlation with Histopathology. PLoS ONE 2017, 12, e0169292. [Google Scholar] [CrossRef]
- Lasocki, A.; Gaillard, F. Non-Contrast-Enhancing Tumor: A New Frontier in Glioblastoma Research. Am. J. Neuroradiol. 2019, 40, 758–765. [Google Scholar] [CrossRef]
- Grosu, A.; Weber, W.A.; Riedel, E.; Jeremic, B.; Nieder, C.; Franz, M.; Gumprecht, H.; Jaeger, R.; Schwaiger, M.; Molls, M. L-(methyl-11C) methionine positron emission tomography for target delineation in resected high-grade gliomas before radiotherapy. Int. J. Radiat. Oncol. Biol. Phys. 2005, 63, 64–74. [Google Scholar] [CrossRef] [PubMed]
- Lohmann, P.; Stavrinou, P.; Lipke, K.; Bauer, E.K.; Ceccon, G.; Werner, J.-M.; Neumaier, B.; Fink, G.R.; Shah, N.J.; Langen, K.-J.; et al. FET PET reveals considerable spatial differences in tumour burden compared to conventional MRI in newly diagnosed glioblastoma. Eur. J. Nucl. Med. Mol. Imaging 2019, 46, 591–602. [Google Scholar] [CrossRef] [PubMed]
- Song, S.; Cheng, Y.; Ma, J.; Wang, L.; Dong, C.; Wei, Y.; Xu, G.; An, Y.; Qi, Z.; Lin, Q.; et al. Simultaneous FET-PET and contrast-enhanced MRI based on hybrid PET/MR improves delineation of tumor spatial biodistribution in gliomas: A biopsy validation study. Eur. J. Nucl. Med. Mol. Imaging 2020, 47, 1458–1467. [Google Scholar] [CrossRef] [PubMed]
- Louis, D.N.; Perry, A.; Wesseling, P.; Brat, D.J.; Cree, I.A.; Figarella-Branger, D.; Hawkins, C.; Ng, H.K.; Pfister, S.M.; Reifenberger, G.; et al. The 2021 WHO Classification of Tumors of the Central Nervous System: A summary. Neuro-Oncology 2021, 23, 1231–1251. [Google Scholar] [CrossRef] [PubMed]
- Haque, W.; Thong, Y.; Verma, V.; Rostomily, R.; Butler, E.B.; Teh, B.S. Patterns of management and outcomes of unifocal versus multifocal glioblastoma. J. Clin. Neurosci. 2020, 74, 155–159. [Google Scholar] [CrossRef]
- Hu, X.; Miao, W.; Zou, Y.; Zhang, W.; Zhang, Y.; Liu, H. Expression of p53, epidermal growth factor receptor, Ki-67 and O6 methylguanine DNA me-thyltransferase in human gliomas. Oncol. Lett. 2013, 6, 130–134. [Google Scholar] [CrossRef] [PubMed][Green Version]
- Chen, W.-J.; He, D.-S.; Tang, R.-X.; Ren, F.-H.; Chen, G. Ki-67 is a Valuable Prognostic Factor in Gliomas: Evidence from a Systematic Review and Meta-analysis. Asian Pac. J. Cancer Prev. 2015, 16, 411–420. [Google Scholar] [CrossRef] [PubMed]
- Alkhaibary, A.; Alassiri, A.H.; AlSufiani, F.; Alharbi, M.A. Ki-67 labeling index in glioblastoma; does it really matter? Neuro Oncol. 2018, 20 (Suppl. S6), vi113–vi114. [Google Scholar] [CrossRef] [PubMed]
- Wong, E.; Nahar, N.; Hau, E.; Varikatt, W.; Gebski, V.; Ng, T.; Jayamohan, J.; Sundaresan, P. Cut-point for Ki-67 proliferation index as a prognostic marker for glioblastoma. Asia-Pac. J. Clin. Oncol. 2019, 15, 5–9. [Google Scholar] [CrossRef] [PubMed]
- Unterrrainer, M.; Winkelmann, I.; Suchorska, B.; Giese, A.; Wenter, V.; Kreth, F.W.; Herms, J.; Bartenstein, P.; Tonn, J.C.; Albert, N.L. Biological tumour volumes of gliomas in early and standard 20–40 min 18F-FET PET images differ according to IDH mutation status. Eur. J. Nucl. Med. Mol. Imaging 2018, 45, 1242–1249. [Google Scholar] [CrossRef] [PubMed]
- Armocida, D.; Pesce, A.; Di Giammarco, F.; Frati, A.; Santoro, A.; Salvati, M. Long Term Survival in Patients Suffering from Glio-blastoma Multiforme: A Single-Center Observational Cohort Study. Diagnostics 2019, 9, 209. [Google Scholar] [CrossRef] [PubMed]
- Kim, N.; Kim, S.H.; Kang, S.-G.; Moon, J.H.; Cho, J.; Suh, C.-O.; Yoon, H.I.; Chang, J.H. ATM mutations improve radio-sensitivity in wild-type isocitrate dehydrogenase-associated high-grade glioma: Retrospective analysis using next-generation sequencing data. Radiat. Oncol. 2020, 15, 184. [Google Scholar] [CrossRef]
- Ingrisch, M.; Schneider, M.J.; Nörenberg, D.; de Figueiredo, G.N.; Maier-Hein, K.; Suchorska, B.; Schüller, U.; Albert, N.; Brückmann, H.; Reiser, M.; et al. Radiomic Analysis Reveals Prognostic Information in T1-Weighted Baseline Magnetic Resonance Imaging in Patients With Glioblastoma. Investig. Radiol. 2017, 52, 360–366. [Google Scholar] [CrossRef] [PubMed]
- Cui, Y.; Tha, K.; Terasaka, S.; Yamaguchi, S.; Wang, J.; Kudo, K.; Xing, L.; Shirato, H.; Li, R. Prognostic Imaging Biomarkers in Glioblastoma: Development and Independent Validation on the Basis of Multiregion and Quantitative Analysis of MR Images. Radiology 2016, 278, 546–553. [Google Scholar] [CrossRef]
- Jia, Z.; Li, X.; Yan, Y.; Shen, X.; Wang, J.; Yang, H.; Liu, S.; Hu, C.H.Y. Exploring the relationship between age and prognosis in glioma: Rethinking current age stratification. BMC Neurol. 2022, 22, 350. [Google Scholar] [CrossRef]
- Illic, R.; Somma, T.; Savic, D.; Frio, F.; Milicevic, M.; Solari, D.; Nikitovic, M.; Lavrnic, S.; Raicevic, S.; Milosevic, S.; et al. A Survival Analysis with Identification of Prognostic Factors in a Series of 110 Patients with Newly Diagnosed Glioblastoma Before and After Introduction of the Stupp Regimen: A Single-Center Observational Study. World Neurosurg. 2017, 104, 581–588. [Google Scholar] [CrossRef]
- Clark, V.E.; Cahill, D.P. Extent of resection versus molecular classification: What matters when? Neurosurg. Clin. N. Am. 2019, 30, 95–101. [Google Scholar] [CrossRef]
- Kawaguchi, T.; Sonoda, Y.; Shibahara, I.; Saito, R.; Kanamori, M.; Kumabe, T.; Tominaga, T. Impact of gross total resection in patients with WHO grade III glioma harboring the IDH 1/2 mutation without the1p/19q co-deletion. J. Neuro-Oncol. 2016, 129, 505–514. [Google Scholar] [CrossRef]
- Galbraith, K.; Kumar, A.; Abdullah, K.G.; Walker, J.M.; Adams, S.H.; Prior, T.; Dimentberg, R.; Henderson, F.C.; Mirchia, K.; Sathe, A.A.; et al. Molecular Correlates of Long Survival in IDH-Wildtype Glioblastoma Cohorts. J. Neuropathol. Exp. Neurol. 2020, 79, 843–854. [Google Scholar] [CrossRef]
- Hartmann, C.; Hentschel, B.; Simon, M.; Westphal, M.; Schackert, G.; Tonn, J.C.; Loeffler, M.; Reifenberger, G.; Pietsch, T.; von Deimling, A.; et al. Long-Term survival in primary Glioblastoma with versus without isocitrate de-hydrogenase mutations. Clin. Cancer Res. 2013, 19, 5146–5157. [Google Scholar] [CrossRef]
- Patel, A.P.; Tirosh, I.; Trombetta, J.J.; Shalek, A.K.; Gillespie, S.M.; Wakimoto, H.; Cahill, D.P.; Nahed, B.V.; Curry, W.T.; Martuza, R.L.; et al. Single-cell RNA-seq highlights intratumoral heterogeneity in primary glioblastoma. Science 2014, 344, 1396–1401. [Google Scholar] [CrossRef] [PubMed]
- Neftel, C.; Laffy, J.; Filbin, M.G.; Hara, T.; Shore, M.E.; Rahme, G.J.; Richman, A.R.; Silverbush, D.; Shaw, M.L.; Hebert, C.M.; et al. An Integrative Model of Cellular States, Plasticity, and Genetics for Glioblastoma. Cell 2019, 178, 835–849.e21. [Google Scholar] [CrossRef] [PubMed]
- Xie, Q.; Mittal, S.; Berens, M.E. Targeting adaptive glioblastoma: An overview of proliferation and invasion. Neuro-Oncology 2014, 16, 1575–1584. [Google Scholar] [CrossRef] [PubMed]
- Sottoriva, A.; Verhoeff, J.J.C.; Borovski, T.; McWeeney, S.K.; Naumov, L.; Medema, J.; Sloot, P.M.A.; Vermeulen, L. Cancer stem cell tumor model reveals invasive morphology and increased phe-notypical heterogeneity. Cancer Res. 2010, 70, 46–56. [Google Scholar] [CrossRef] [PubMed]
- Olmeda, F.; Ben Amar, M. Clonal pattern dynamics in tumor: The concept of cancer stem cells. Sci. Rep. 2019, 9, 15607. [Google Scholar] [CrossRef]
- Dono, A.; Wang, E.; Lopez-Rivera, V.; Ramesh, A.V.; Tandon, N.; Ballester, L.Y.; Esquenazi, Y. Molecular characteristics and clinical features of multifocal glioblastoma. J. Neuro-Oncol. 2020, 148, 389–397. [Google Scholar] [CrossRef] [PubMed]
- Li, Y.; Zhang, Z.-X.; Huang, G.-H.; Xiang, Y.; Yang, L.; Pei, Y.-C.; Yang, W.; Lv, S.-Q. A systematic review of multifocal and multicentric glioblastoma. J. Clin. Neurosci. 2021, 83, 71–76. [Google Scholar] [CrossRef]
- Orimo, A.; Weinberg, R.A. Stromal Fibroblasts in Cancer: A Novel Tumor-Promoting Cell Type. Cell Cycle 2006, 5, 1597–1601. [Google Scholar] [CrossRef]
- Dalrymple, S.J.; Parisi, J.E.; Roche, P.C.; Ziesmer, S.C.; Scheithauer, B.W.; Kelly, P.J. Changes in Proliferating Cell Nuclear Antigen Expression in Glioblastoma Multiforme Cells along a Stereotactic Biopsy Trajectory. Neurosurgery 1994, 35, 1036–1044. [Google Scholar] [CrossRef]
- Byrne, H. The effect of time delays on the dynamics of avascular tumor growth. Math. Biosci. 1997, 144, 83–117. [Google Scholar] [CrossRef]
- DeGrado, T.R.; Reiman, R.E.; Price, D.T.; Wang, S.; Coleman, R.E. Pharmacokinetics and radiation dosimetry of 18F-fluorocholine. J. Nucl. Med. 2002, 43, 92–96. [Google Scholar]
- Herholz, K. Brain Tumors: An Update on Clinical PET Research in Gliomas. Semin. Nucl. Med. 2017, 47, 5–17. [Google Scholar] [CrossRef]
- Brú, A.; Albertos, S.; Subiza, J.L.; García-Asenjo, J.L.; Brú, I. The Universal Dynamics of Tumor Growth. Biophys. J. 2003, 85, 2948–2961. [Google Scholar] [CrossRef]
- Sher, A.; Lacoeuille, F.; Fosse, P.; Vervueren, L.; Cahouet-Vannier, A.; Dabli, D.; Bouchet, F.; Couturier, O. For avid glucose tumors, the SUV peak is the most reliable parameter for [18F] FDG-PET/CT quantification, regardless of acquisition time. Eur. J. Nucl. Med. Mol. Imaging Res. 2016, 6, 21. [Google Scholar] [CrossRef] [PubMed]
- Akamatsu, G.; Ikari, Y.; Nishida, H.; Nishio, T.; Ohnishi, A.; Maebatake, A.; Sasaki, M.; Senda, M. Influence of Statistical Fluctuation on Reproducibility and Accuracy of SUVmax and SUVpeak: A Phantom Study. J. Nucl. Med. Technol. 2015, 43, 222–226. [Google Scholar] [CrossRef] [PubMed]


| Characteristics | n (%) |
|---|---|
| Histology/WHO category | |
| Anaplastic astrocytoma/III | 6 (11.1) |
| Glioblastoma/IV | 48 (88.9) |
| Ki-67 category | |
| High (≥20%) | 31 (57.4) |
| Low (<20%) | 12 (22.2) |
| n.a. | 11 (20.4) |
| Tumor resection | |
| Complete | 27 (50.0) |
| Partial | 13 (24.1) |
| Biopsy | 14 (25.9) |
| Post-surgery ECOG | |
| 0 | 46 (85.2) |
| 1 | 5 (9.3) |
| 2–3 | 3 (5.5) |
| Multiple lesions on FCH PET/CT | |
| Yes | 18 (33.3) |
| No | 36 (66.7) |
| Multiple lesions on CE-MRI (n = 47) | |
| Yes | 3 (6.4) |
| No | 44 (93.6) |
| Treatment (Stupp complete) | |
| Yes | 34 (63.0) |
| No | 20 (37.0) |
| FCH PET/CT Variables | Mean ± SD |
|---|---|
| SUVmax | 4.04 ± 1.89 |
| SUVmean | 1.37 ± 0.58 |
| SUVpeak | 3.01 ± 1.35 |
| MTV (mL) | 42.68 ± 26.30 |
| TLA (mL) | 56.15 ± 42.15 |
| Total volume (mL) | 46.14 ± 30.20 |
| COV | 0.46 ± 0.12 |
| Surface (s.c.) | 87.68 ± 53.27 |
| Sphericity | 0.63 ± 0.14 |
| maxD (cm) | 6.00 ± 1.76 |
| SmCD | 14.87 ± 5.46 |
| SpCD | 13.71 ± 5.48 |
| nSpCD | 0.66 ± 0.23 |
| T1-Gd MRI Variables | Mean ± SD |
| CE volume (mL) | 18.53 ± 13.62 |
| Total volume (mL) | 28.41 ± 25.28 |
| Surface (s.c.) | 67.46 ± 47.43 |
| maxD (cm) | 4.99 ± 1.65 |
| Sphericity | 0.52 ± 0.11 |
| CE width (cm) | 0.62 ± 0.27 |
| PET/CT Variables | CE-MRI Variables | |||||
|---|---|---|---|---|---|---|
| Total Volume | CE Volume | CE Width | maxD | Surface | Sphericity | |
| SUVmax | r = −0.210 | r = 0.085 | r = 0.198 | r = 0.128 | r = 0.002 | r = −0.016 |
| p = 0.890 | p = 0.570 | p = 0.181 | p = 0.391 | p = 0.989 | p = 0.914 | |
| SUVmean | r = −0.150 | r = −0.088 | r = 0.082 | r = 0.016 | r = −0.126 | r = −0.037 |
| p = 0.314 | p = 0.557 | p = 0.582 | p = 0.917 | p = 0.399 | p = 0.805 | |
| MTV | r = 0.776 | r = 0.779 | r = 0.212 | r = 0.679 | r = 0.794 | r = −0.290 |
| p < 0.001 | p < 0.001 | p = 0.152 | p < 0.001 | p < 0.001 | p = 0.048 | |
| TLA | r = 0.491 | r = 0.573 | r = 0.330 | r = 0.549 | r = 0.513 | r = −0.230 |
| p < 0.001 | p < 0.001 | p = 0.024 | p < 0.001 | p < 0.001 | p = 0.119 | |
| COV | r = −0.030 | r = 0.079 | r = 0.316 | r = −0.027 | r = −0.024 | r = 0.071 |
| p = 0.842 | p = 0.598 | p = 0.030 | p = 0.857 | p = 0.874 | p = 0.634 | |
| maxD | r = 0.430 | r = 0.443 | r = 0.109 | r = 0.416 | r = 0.475 | r = −0.182 |
| p = 0.003 | p = 0.002 | p = 0.466 | p = 0.004 | p = 0.001 | p = 0.222 | |
| Surface | r = 0.751 | r = 0.701 | r = 0.115 | r = 0.614 | r = 0.780 | r = −0.280 |
| p < 0.001 | p < 0.001 | p = 0.441 | p < 0.001 | p < 0.001 | p = 0.056 | |
| Sphericity | r = −0.480 | r = −0.381 | r = 0.044 | r = −0.304 | r = −0.470 | r = 0.146 |
| p = 0.001 | p = 0.008 | p = 0.769 | p = 0.038 | p = 0.001 | p = 0.328 | |
| SmCD | r = 0.408 | r = 0.410 | r = −0.027 | r = 0.522 | r = 0.510 | r = −0.327 |
| p = 0.004 | p = 0.004 | p = 0.855 | p < 0.001 | p < 0.001 | p = 0.025 | |
| nSpCD | r = −0.067 | r = −0.059 | r = −0.157 | r = 0.084 | r = 0.040 | r = −0.118 |
| p = 0.653 | p = 0.694 | p = 0.293 | p = 0.574 | p = 0.789 | p = 0.429 | |
| PFS≤ 5 Months, n = 31 (Mean ± SD) | PFS > 5 Months, n = 23 (Mean ± SD) | p Value | |
|---|---|---|---|
| SUVmax | 4.40 ± 1.96 | 3.56 ± 1.72 | 0.107 |
| SUVmean | 1.48 ± 0.64 | 1.21 ± 0.45 | 0.093 |
| SUVpeak | 3.25 ± 1.34 | 2.69 ± 1.31 | 0.129 |
| MTV (mL) | 42.60 ± 25.83 | 42.80 ± 27.51 | 0.978 |
| TLA (mL) | 61.83 ± 45.82 | 48.49 ± 36.20 | 0.254 |
| COV | 0.46 ± 0.12 | 0.46 ± 0.13 | 0.919 |
| Surface (s.c.) | 88.52 ± 53.14 | 86.55 ± 54.62 | 0.895 |
| Sphericity | 0.61 ± 0.14 | 0.65 ± 0.12 | 0.229 |
| maxD (cm) | 6.09 ± 1.80 | 5.89 ± 1.73 | 0.696 |
| SmCD | 15.03 ± 5.54 | 14.65 ± 5.48 | 0.800 |
| nSpCD | 0.66 ± 0.25 | 0.67 ± 0.21 | 0.868 |
| OS≤ 11 Months, n = 30 (Mean ± SD) | OS > 11 Months, n = 24 (Mean ± SD) | p Value | |
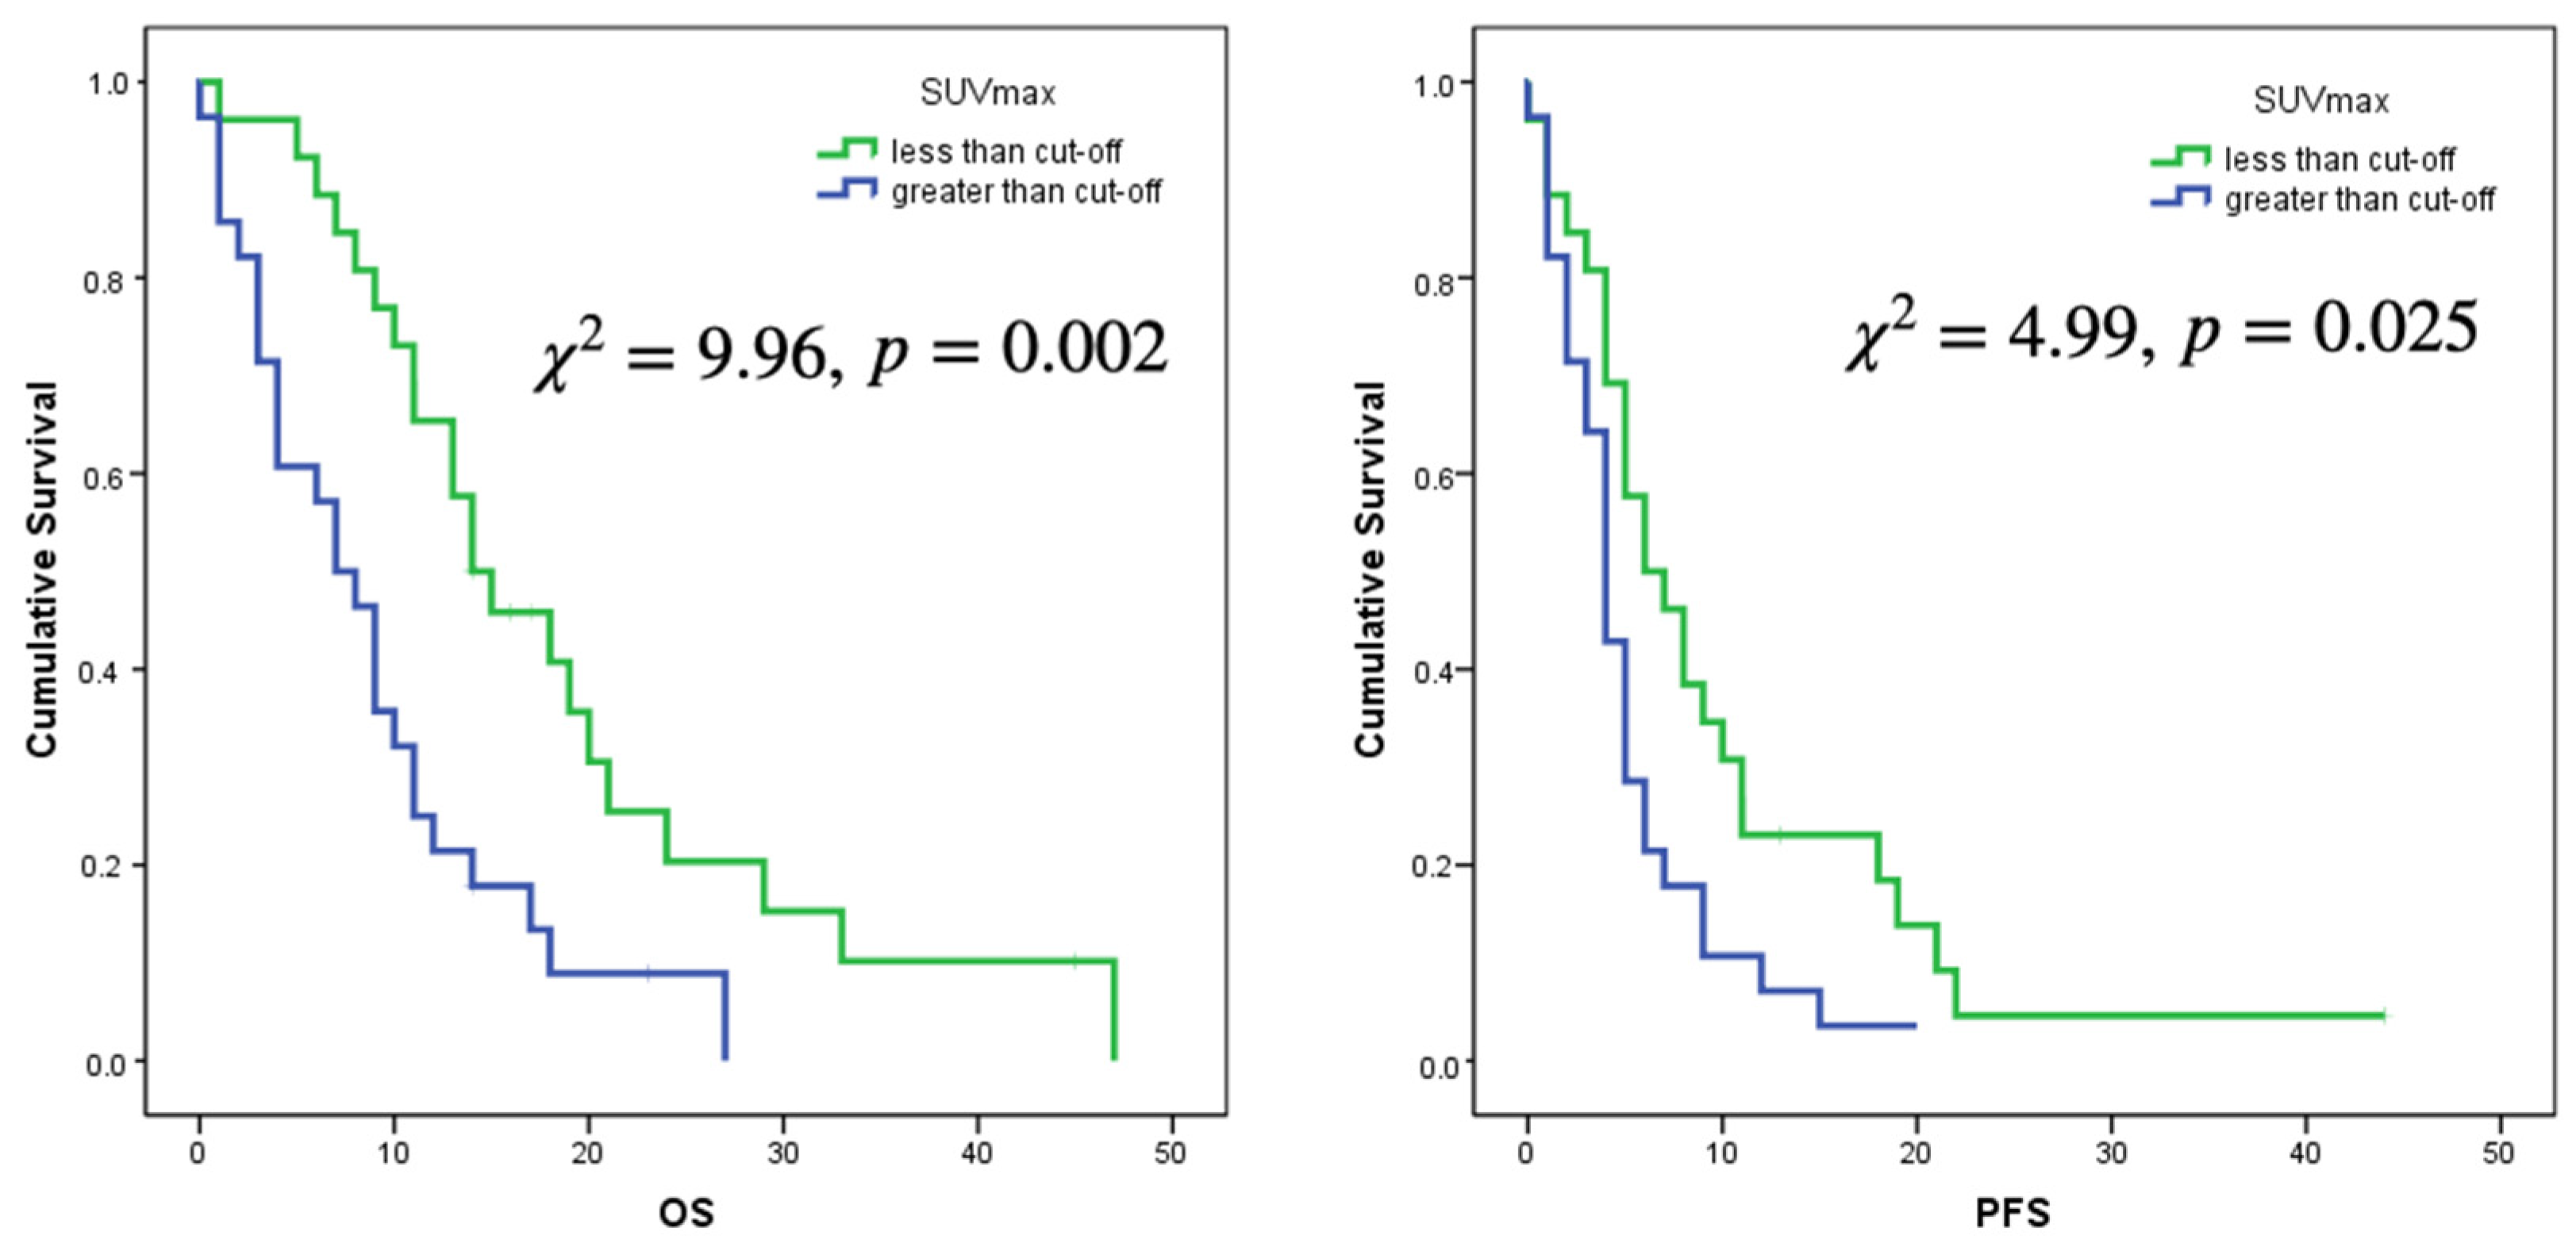
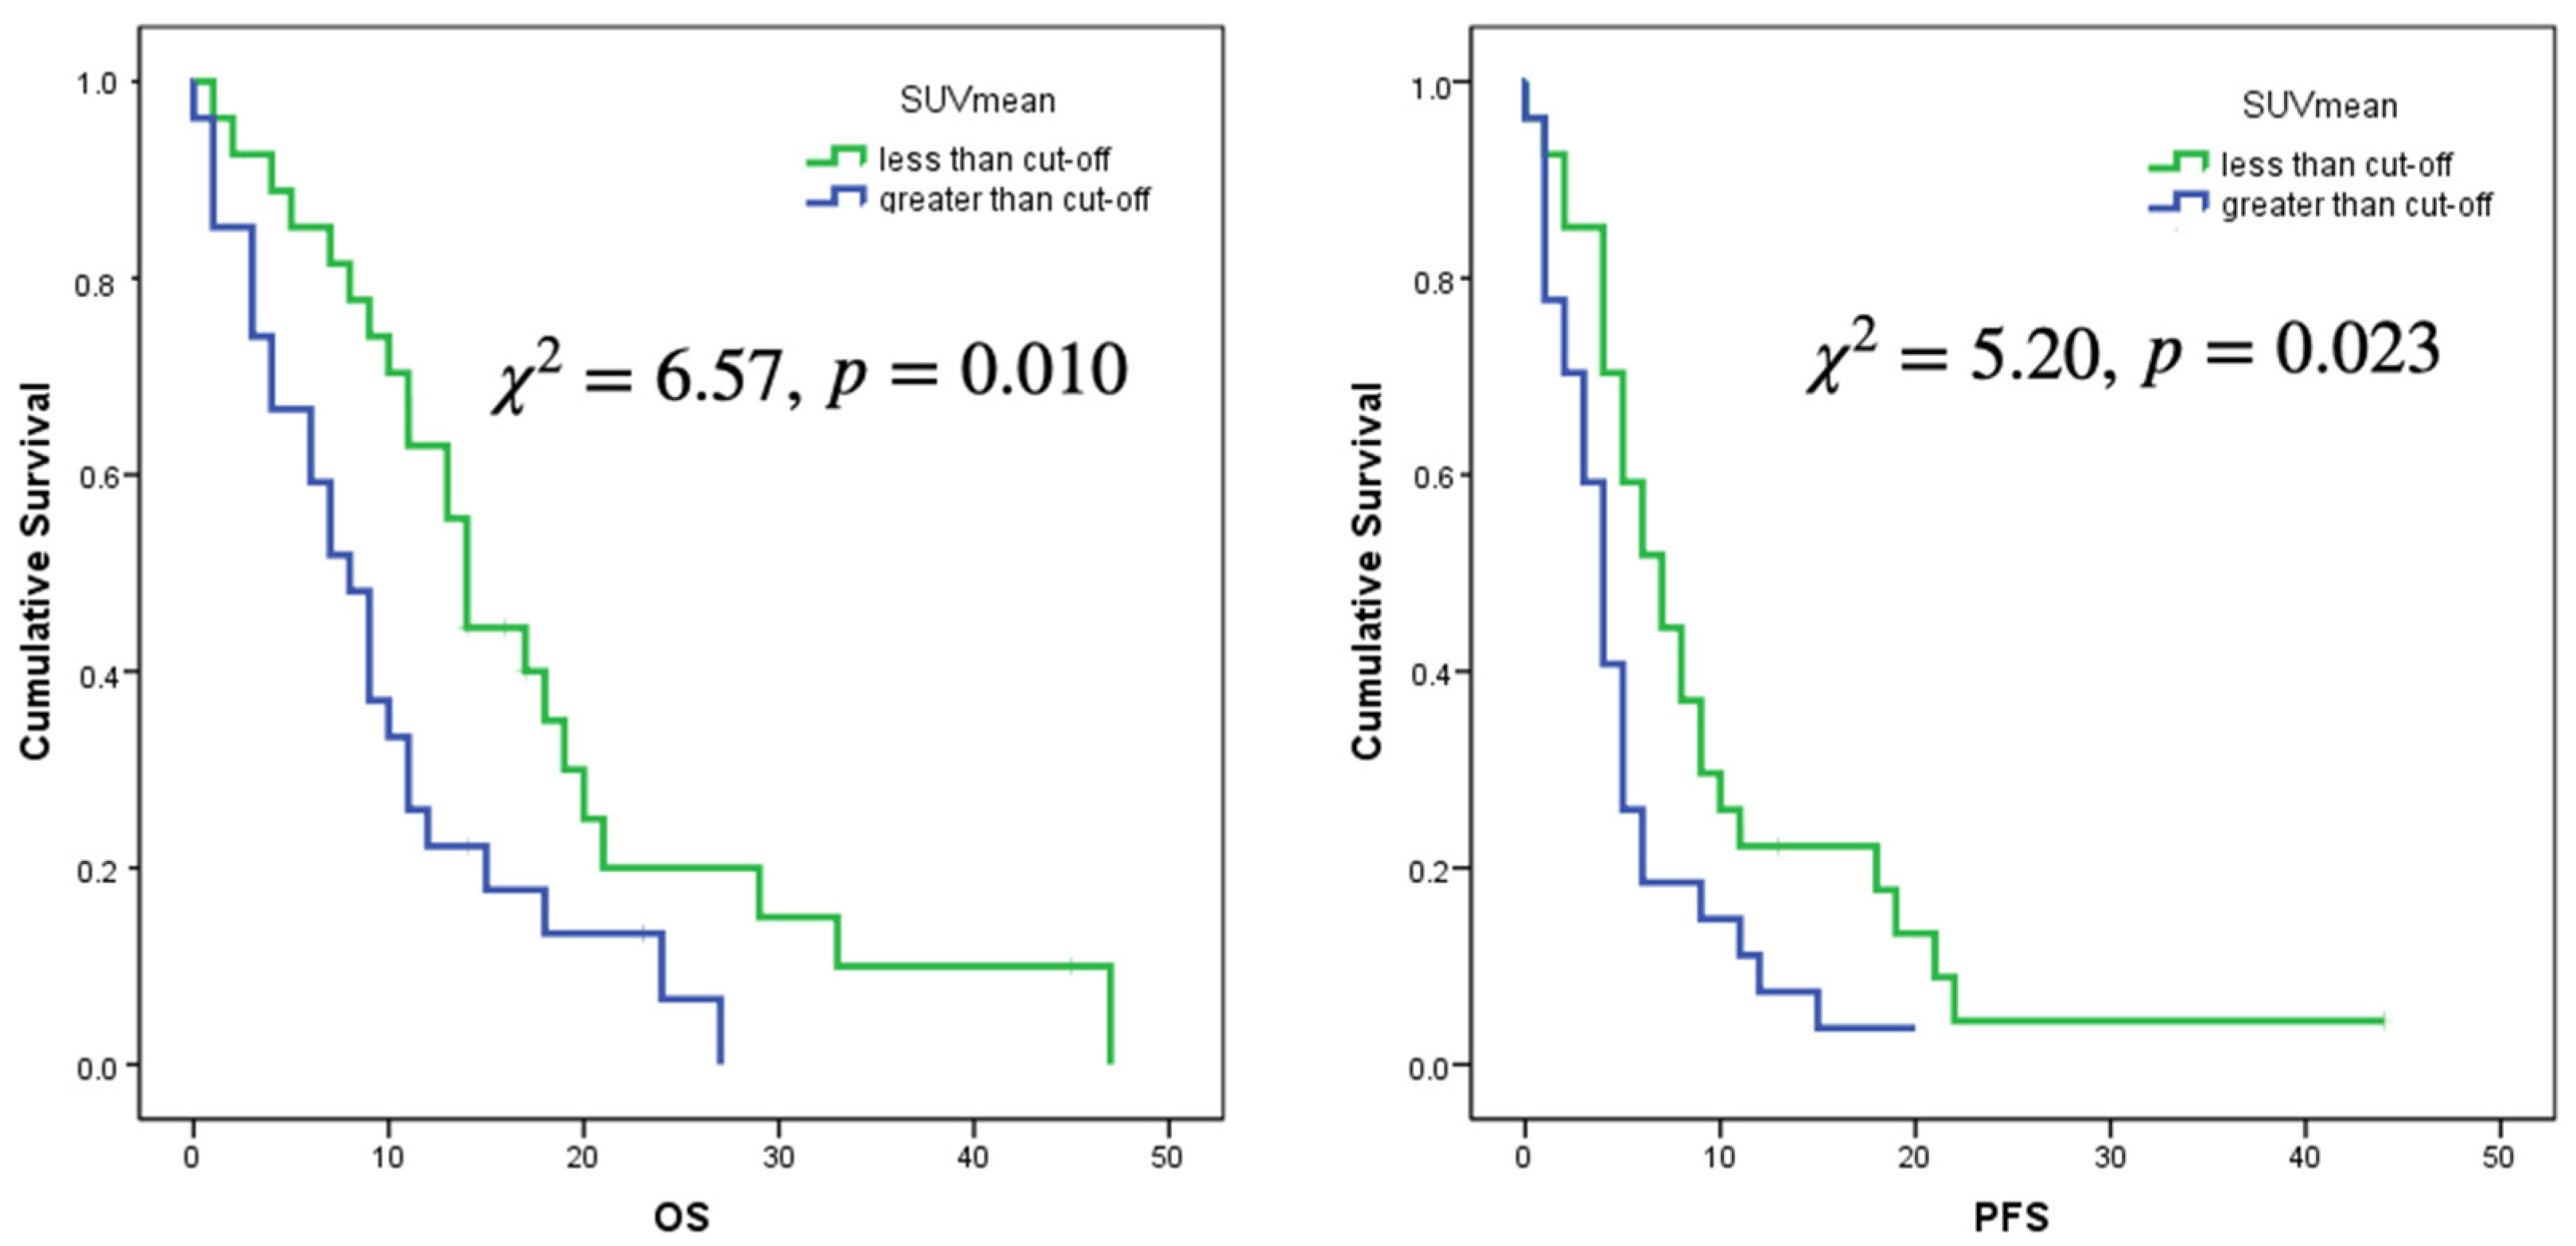
| SUVmax | 4.57 ± 2.02 | 3.37 ± 1.50 | 0.019 |
| SUVmean | 1.51 ± 0.66 | 1.18 ± 0.38 | 0.032 |
| SUVpeak | 3.39 ± 1.42 | 2.55 ± 1.11 | 0.021 |
| MTV (mL) | 42.59 ± 28.11 | 42.80 ± 24.46 | 0.978 |
| TLA (mL) | 62.20 ± 47.91 | 48.59 ± 33.05 | 0.242 |
| COV | 0.46 ± 0.13 | 0.46 ± 0.11 | 0.990 |
| Surface (s.c.) | 88.42 ± 55.78 | 86.76 ± 51.14 | 0.910 |
| Sphericity | 0.60 ± 0.14 | 0.66 ± 0.13 | 0.117 |
| maxD (cm) | 6.10 ± 1.80 | 5.89 ± 1.74 | 0.663 |
| SmCD | 15.55 ± 5.99 | 14.02 ± 4.71 | 0.310 |
| nSpCD | 0.69 ± 0.23 | 0.62 ± 0.23 | 0.231 |
| OS | PFS | |||||
|---|---|---|---|---|---|---|
| p-Value | HR | 95% CI | p-Value | HR | 95% CI | |
| Age | 0.002 | 1.044 | 1.016–1.073 | 0.021 | 1.027 | 1.044–1.051 |
| Stupp complete (No vs Yes) | 0.001 | 2.813 | 1.519–5.209 | 0.008 | 2.197 | 1.228–3.930 |
| Multiple lesions (Yes vs No) | 0.013 | 2.203 | 1.177–4.122 | |||
| Sphericity | 0.027 | 0.788 | 0.637–0.973 | |||
Publisher’s Note: MDPI stays neutral with regard to jurisdictional claims in published maps and institutional affiliations. |
© 2022 by the authors. Licensee MDPI, Basel, Switzerland. This article is an open access article distributed under the terms and conditions of the Creative Commons Attribution (CC BY) license (https://creativecommons.org/licenses/by/4.0/).
Share and Cite
Garcia Vicente, A.M.; Pérez-Beteta, J.; Amo-Salas, M.; Bosque, J.J.; Noriega-Álvarez, E.; Soriano Castrejon, Á.M.; Pérez-García, V.M. A Head-to-Head Comparison of 18F-Fluorocholine PET/CT and Conventional MRI as Predictors of Outcome in IDH Wild-Type High-Grade Gliomas. J. Clin. Med. 2022, 11, 6065. https://doi.org/10.3390/jcm11206065
Garcia Vicente AM, Pérez-Beteta J, Amo-Salas M, Bosque JJ, Noriega-Álvarez E, Soriano Castrejon ÁM, Pérez-García VM. A Head-to-Head Comparison of 18F-Fluorocholine PET/CT and Conventional MRI as Predictors of Outcome in IDH Wild-Type High-Grade Gliomas. Journal of Clinical Medicine. 2022; 11(20):6065. https://doi.org/10.3390/jcm11206065
Chicago/Turabian StyleGarcia Vicente, Ana María, Julián Pérez-Beteta, Mariano Amo-Salas, Jesús J. Bosque, Edel Noriega-Álvarez, Ángel María Soriano Castrejon, and Víctor M. Pérez-García. 2022. "A Head-to-Head Comparison of 18F-Fluorocholine PET/CT and Conventional MRI as Predictors of Outcome in IDH Wild-Type High-Grade Gliomas" Journal of Clinical Medicine 11, no. 20: 6065. https://doi.org/10.3390/jcm11206065
APA StyleGarcia Vicente, A. M., Pérez-Beteta, J., Amo-Salas, M., Bosque, J. J., Noriega-Álvarez, E., Soriano Castrejon, Á. M., & Pérez-García, V. M. (2022). A Head-to-Head Comparison of 18F-Fluorocholine PET/CT and Conventional MRI as Predictors of Outcome in IDH Wild-Type High-Grade Gliomas. Journal of Clinical Medicine, 11(20), 6065. https://doi.org/10.3390/jcm11206065