
Glycemic Control after Initiation of Anti-VEGF Treatment for Diabetic Macular Edema

 , , ,
, , ,
Abstract
1. Introduction
2. Materials and Methods
- 1.
- Since starting anti-VEGF therapy, have you become more active in glycemic control through diet and/or exercise therapy?
- 2.
- Until you were aware of your vision impairment due to DME, did you know that diabetes mellitus can cause visual impairment?
- 3.
- Have you started to regular visit an ophthalmologist after vision loss?
- 4.
- Do you think the cost of anti-VEGF drugs is high?
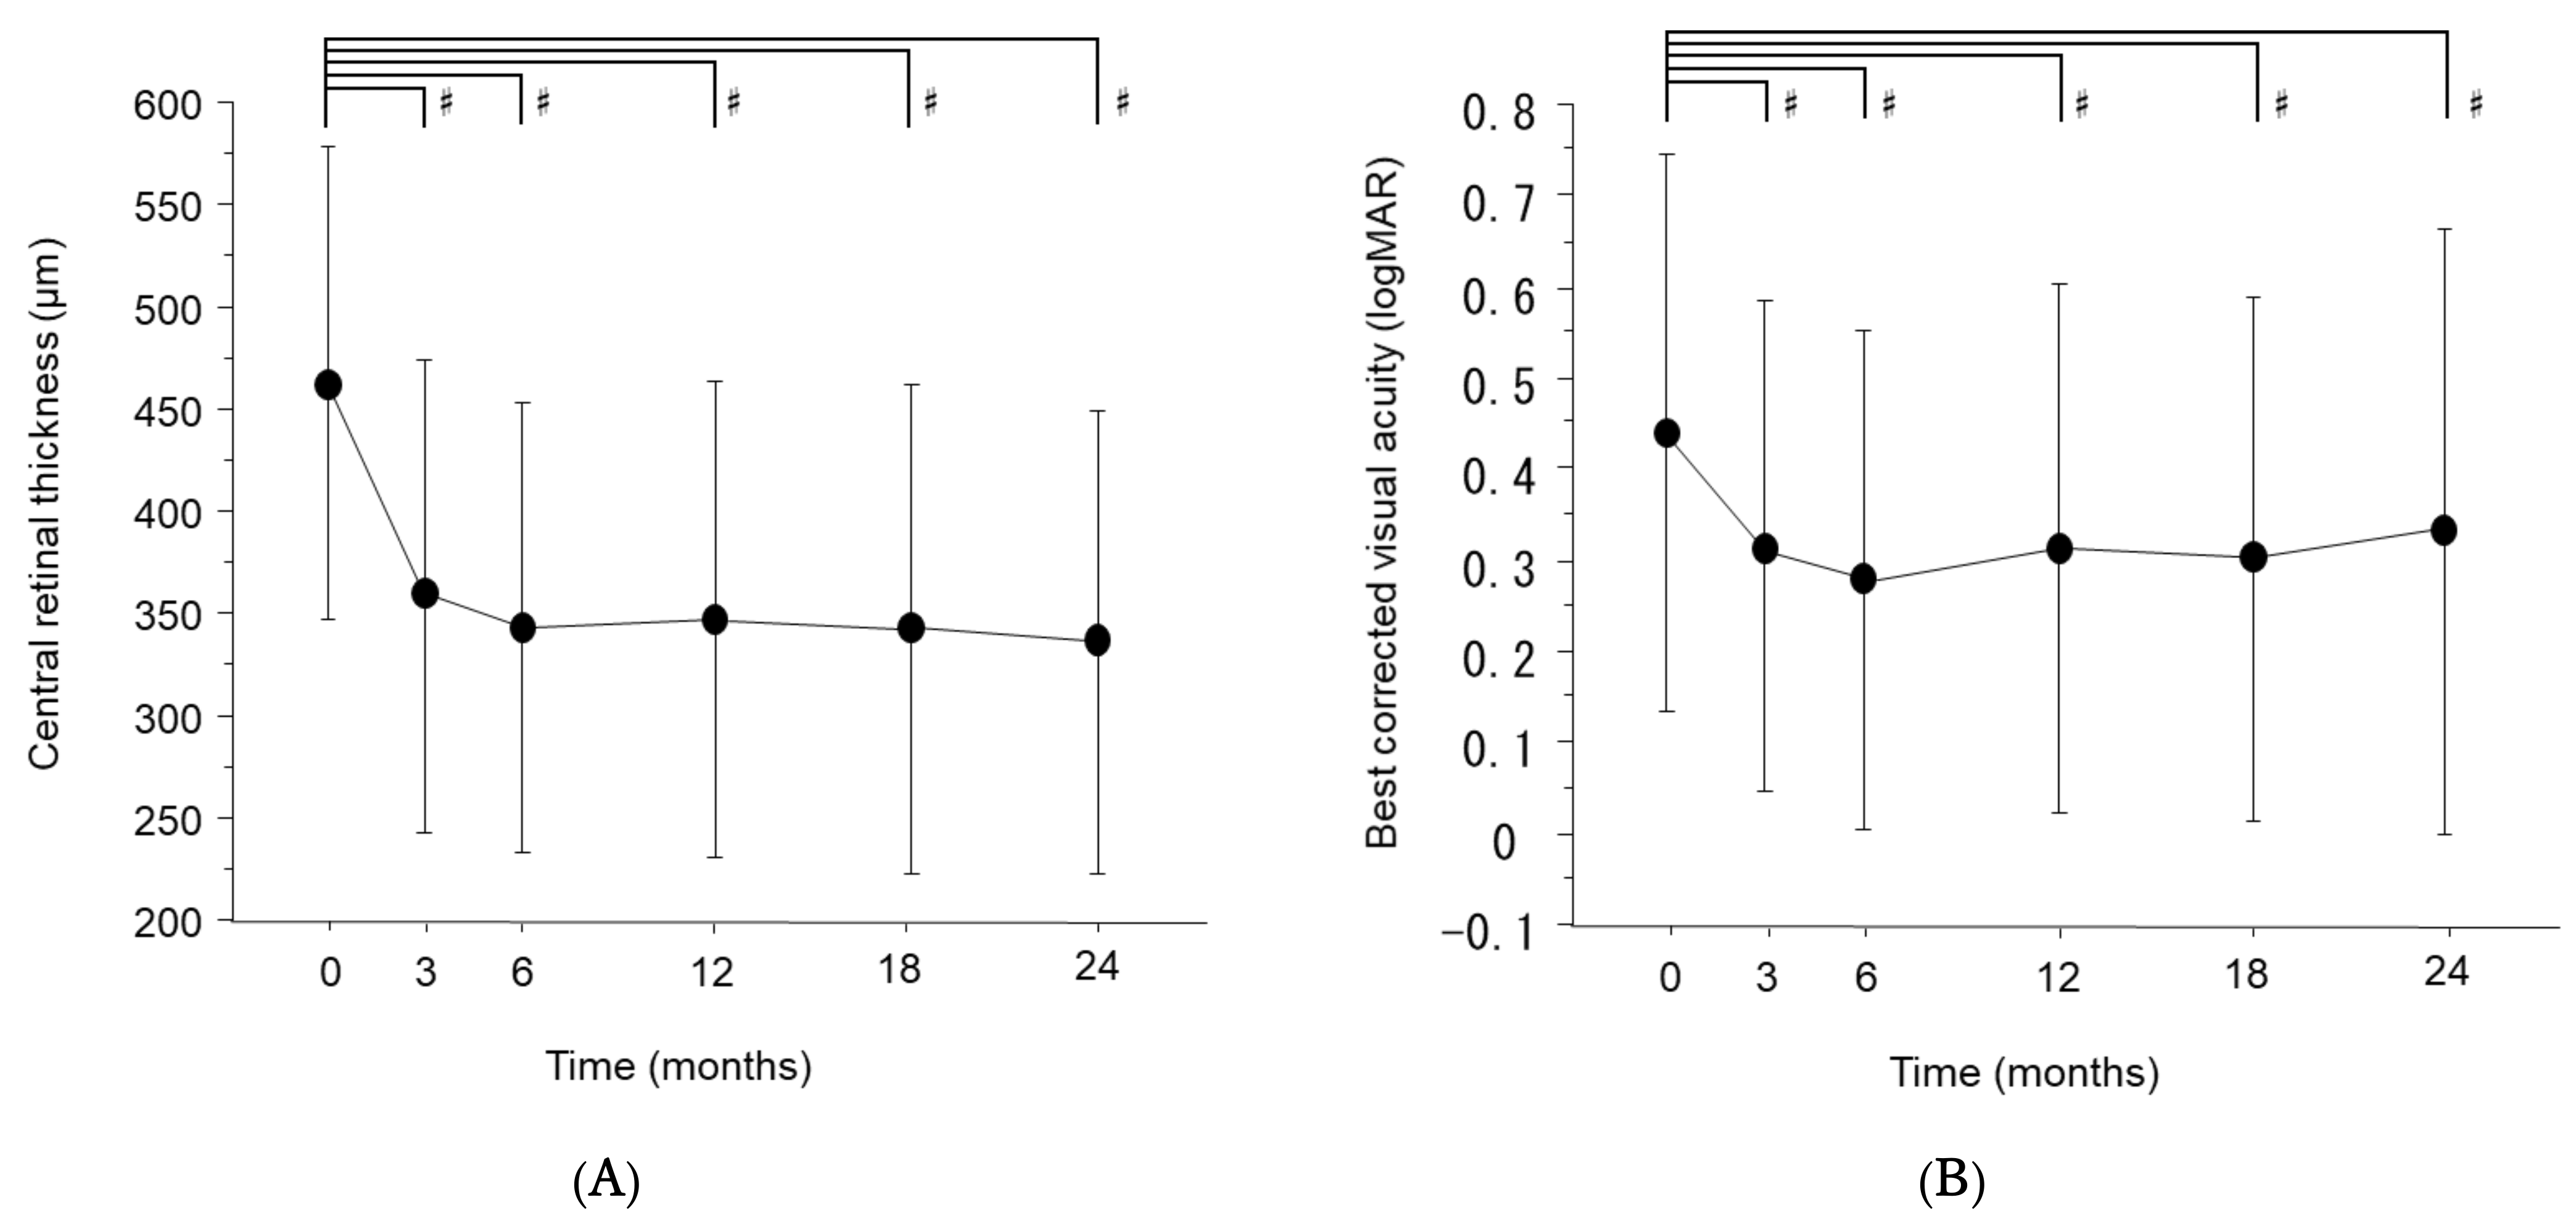
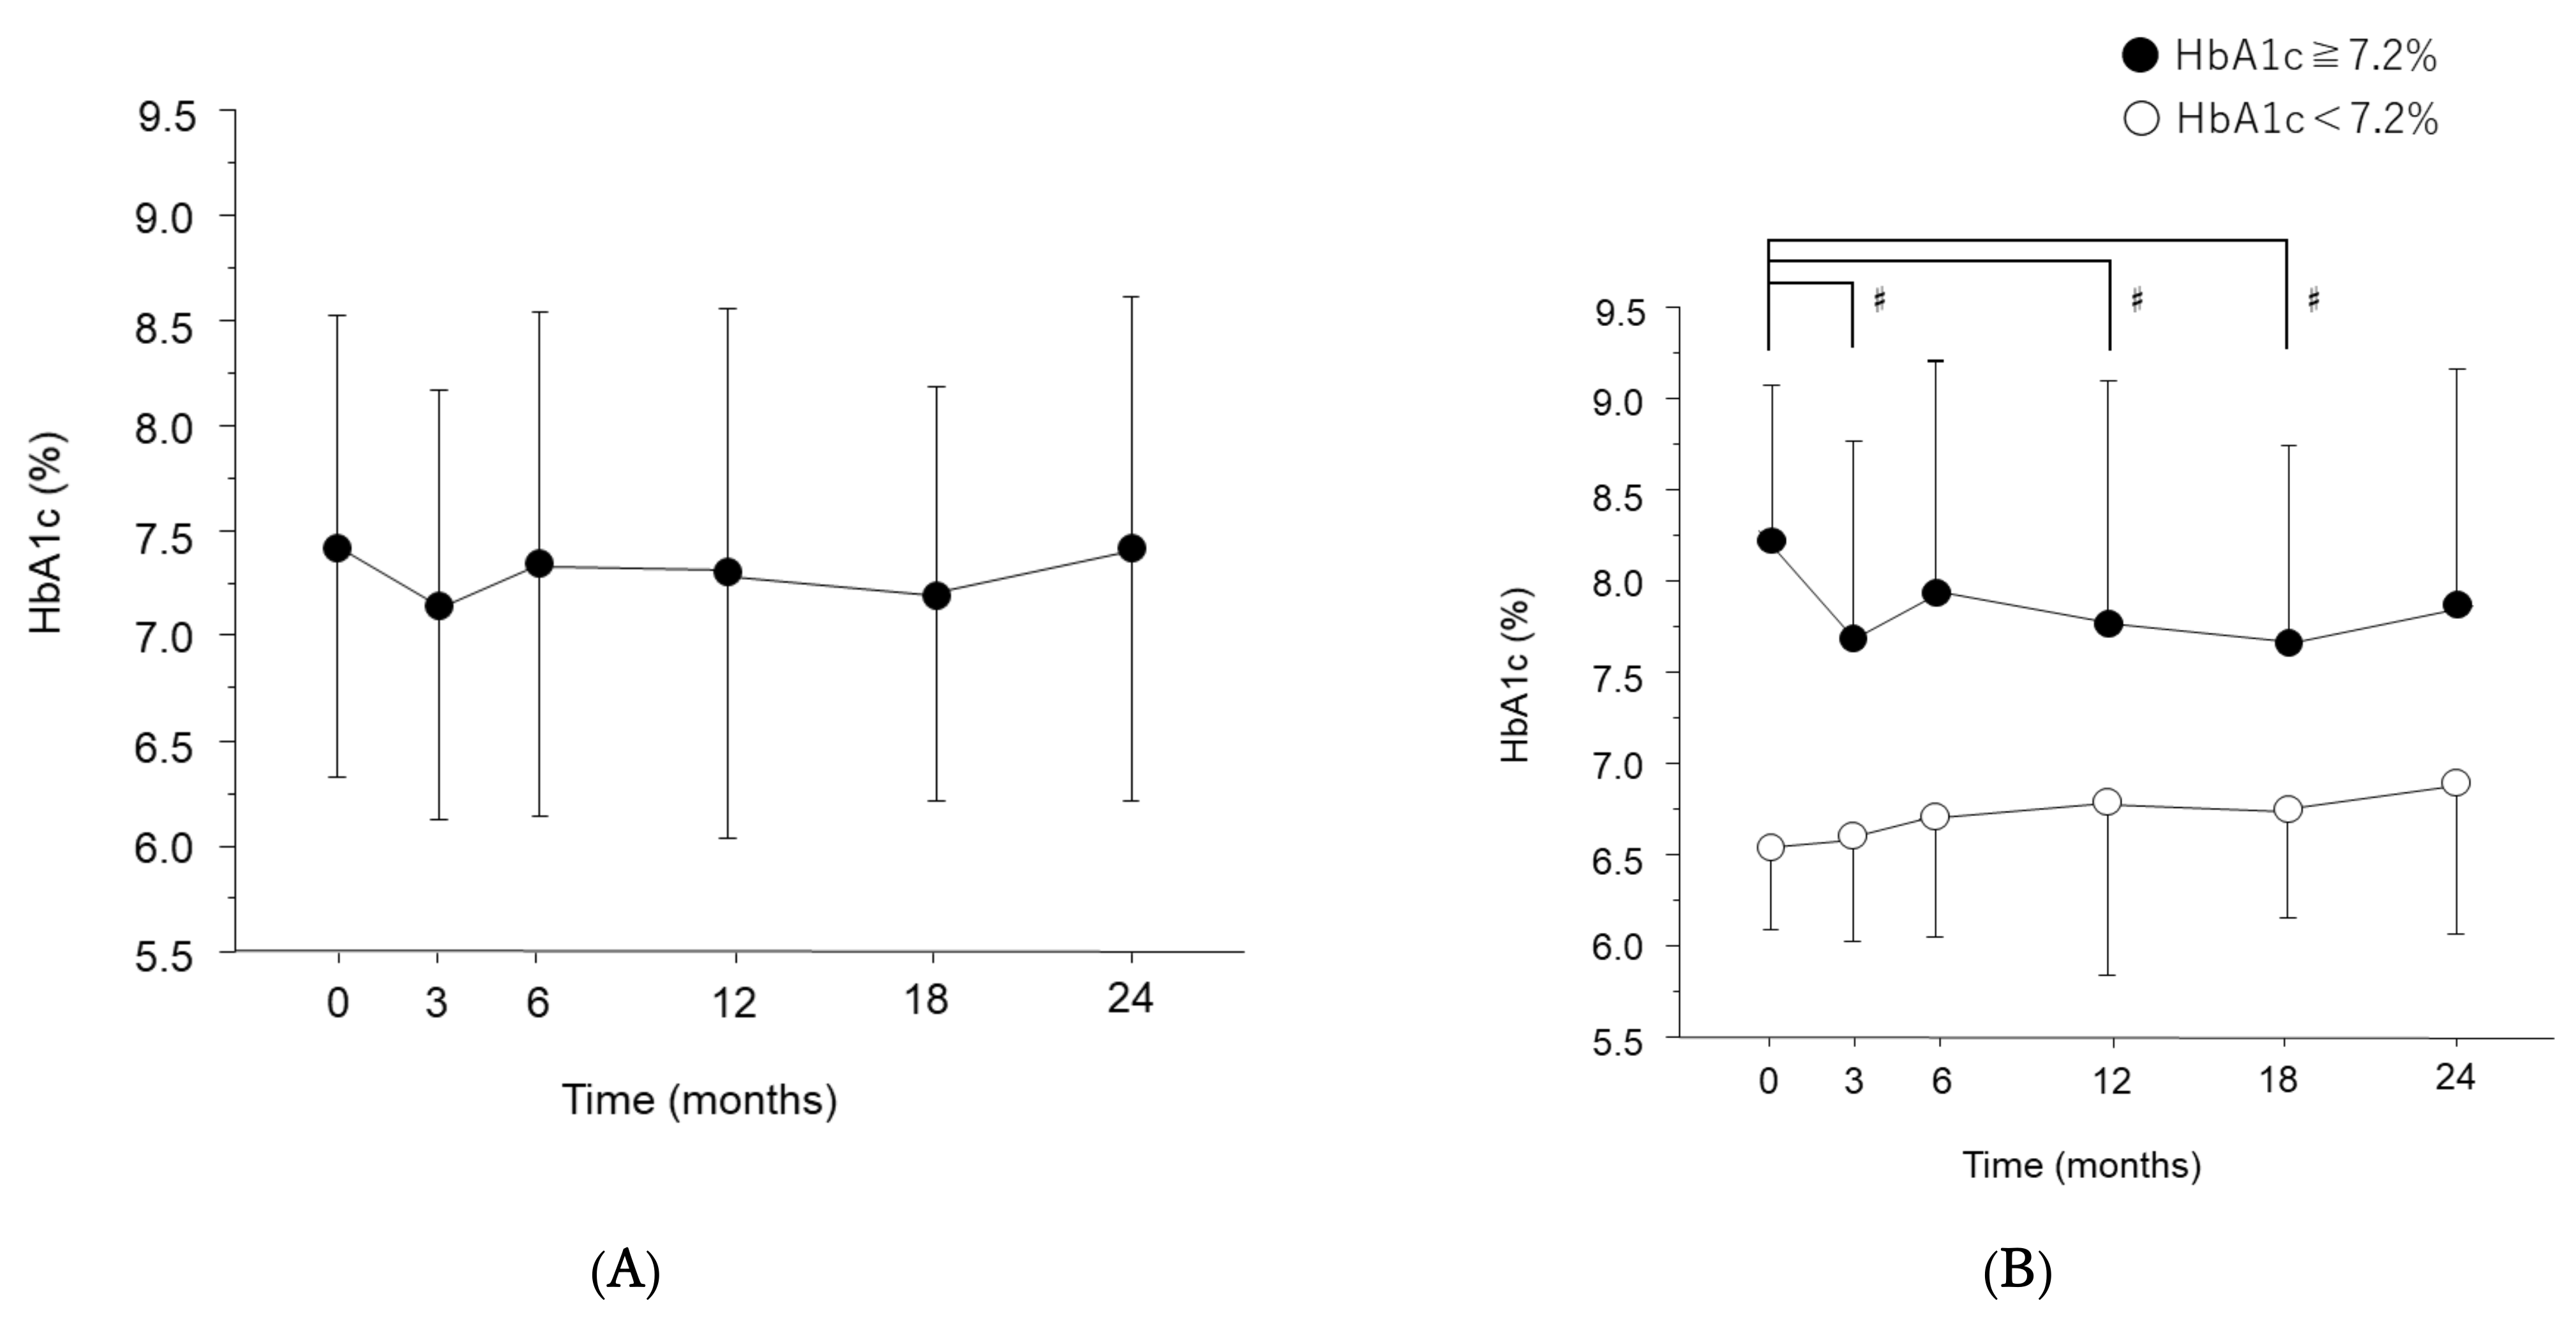
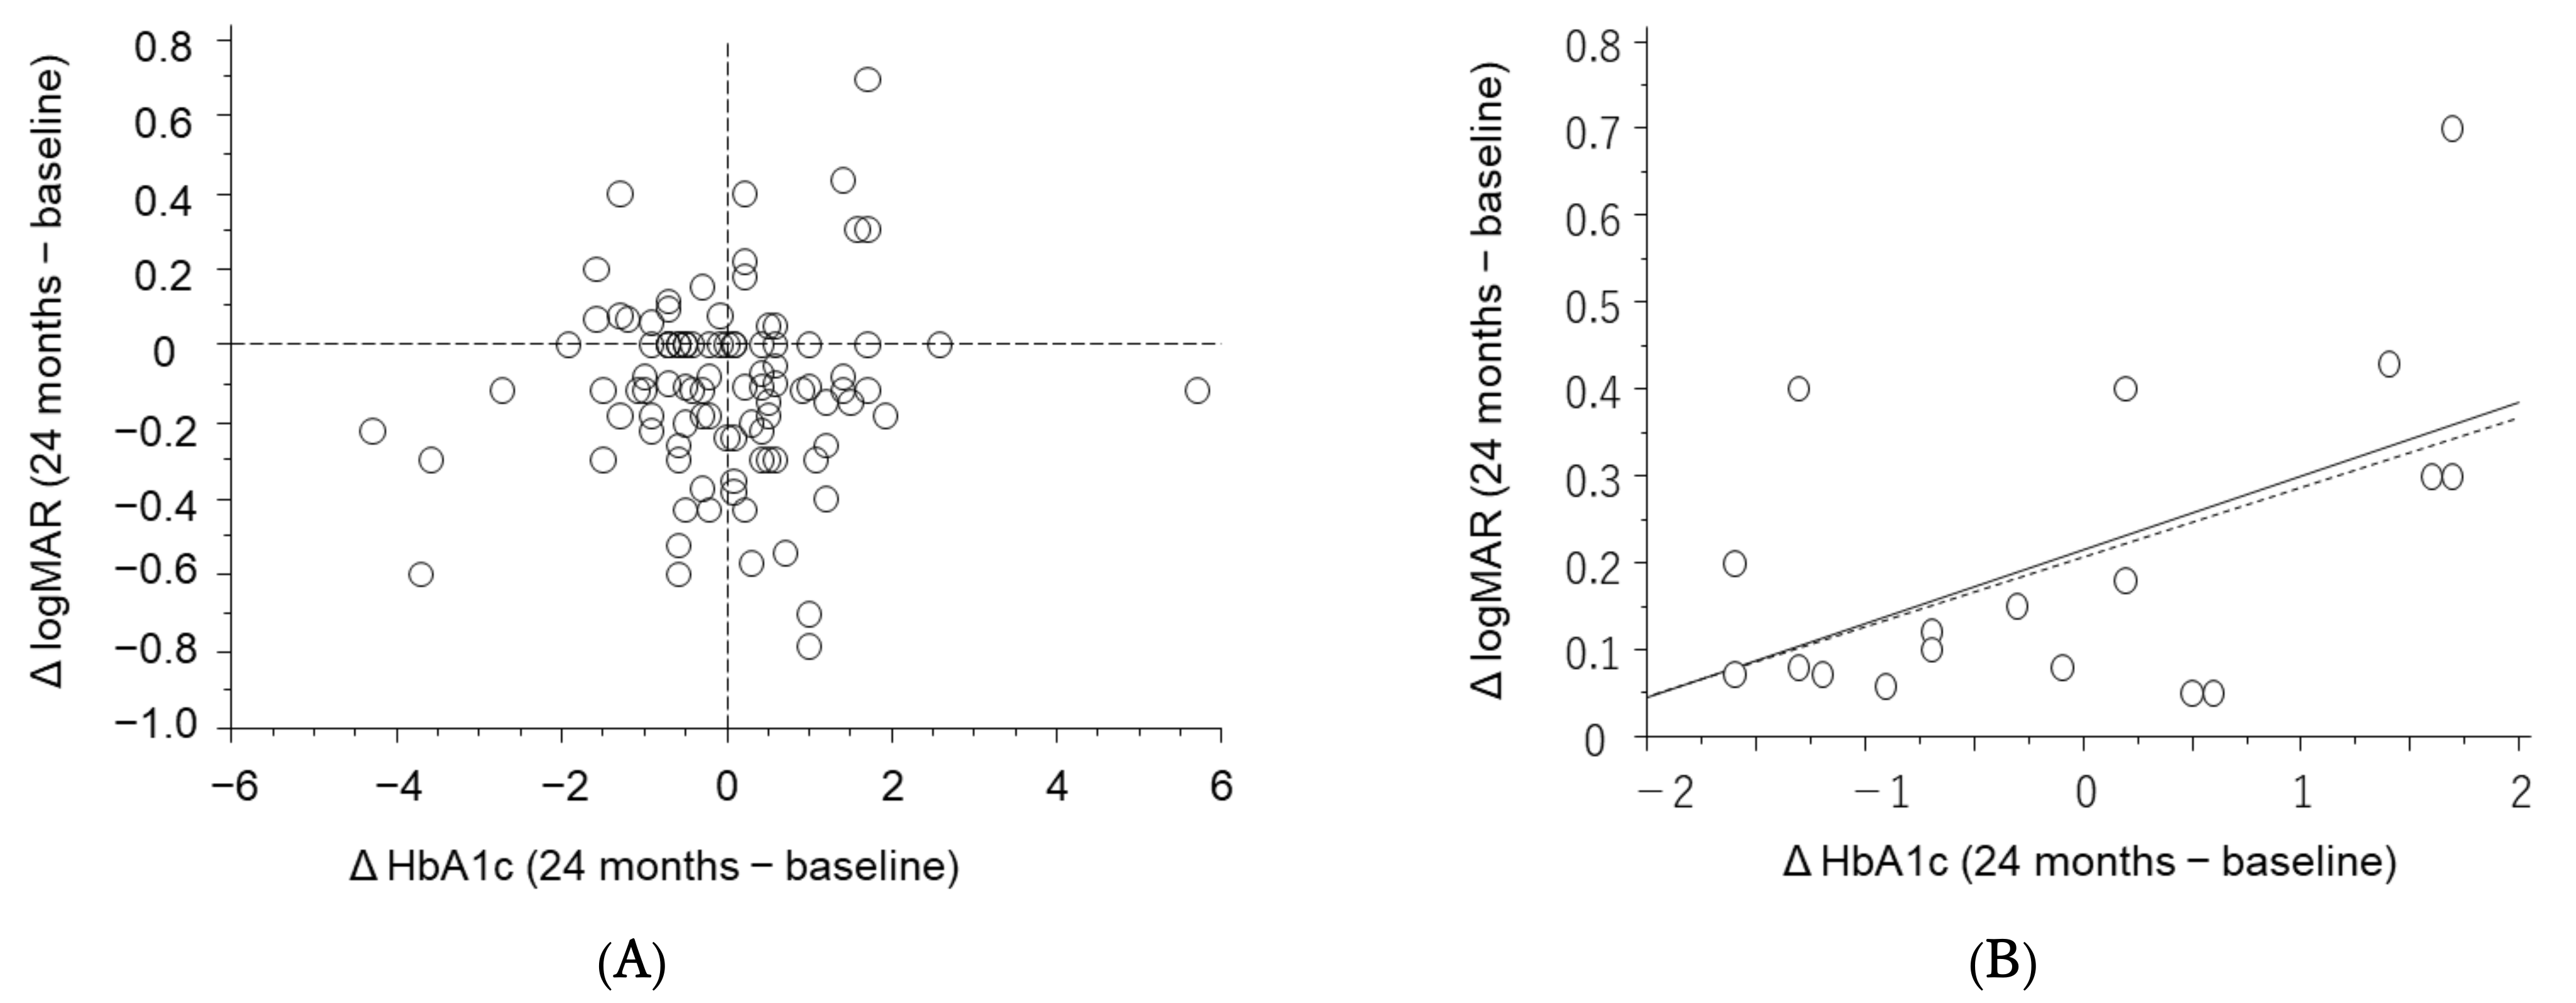
3. Results
4. Discussion
Author Contributions
Funding
Institutional Review Board Statement
Informed Consent Statement
Data Availability Statement
Conflicts of Interest
References
- Nathan, D.M.; DCCT/EDIC Research Group. The Diabetes Control and Complications Trial/Epidemiology of Diabetes Interventions and Complications Study at 30 Years: Overview. Diabetes Care 2014, 37, 9–16. [Google Scholar] [CrossRef] [PubMed]
- Kim, H.U.; Park, S.P.; Kim, Y.-K. Long-Term HbA1c Variability and the Development and Progression of Diabetic Retinopathy in Subjects with Type 2 Diabetes. Sci. Rep. 2021, 11, 4731. [Google Scholar] [CrossRef] [PubMed]
- Sheu, S.-J.; Liu, N.-C.; Ger, L.-P.; Ho, W.-L.; Lin, J.-Y.; Chen, S.-C.; Horng, Y.-H.; Lam, H.-C. High HbA1c Level Was the Most Important Factor Associated with Prevalence of Diabetic Retinopathy in Taiwanese Type II Diabetic Patients with a Fixed Duration. Graefes Arch. Clin. Exp. Ophthalmol. 2013, 251, 2087–2092. [Google Scholar] [CrossRef] [PubMed]
- Shimura, M.; Kitano, S.; Muramatsu, D.; Fukushima, H.; Takamura, Y.; Matsumoto, M.; Kokado, M.; Kogo, J.; Sasaki, M.; Morizane, Y.; et al. Real-World Management of Treatment-Naïve Diabetic Macular Oedema in Japan: Two-Year Visual Outcomes with and without Anti-VEGF Therapy in the STREAT-DME Study. Br. J. Ophthalmol. 2020, 104, 1209–1215. [Google Scholar] [CrossRef]
- Terasaki, H.; Ogura, Y.; Kitano, S.; Sakamoto, T.; Murata, T.; Hirakata, A.; Ishibashi, T. Management of Diabetic Macular Edema in Japan: A Review and Expert Opinion. Jpn. J. Ophthalmol. 2018, 62, 1–23. [Google Scholar] [CrossRef]
- Wells, J.A.; Glassman, A.R.; Ayala, A.R.; Jampol, L.M.; Bressler, N.M.; Bressler, S.B.; Brucker, A.J.; Ferris, F.L.; Hampton, G.R.; Jhaveri, C.; et al. Aflibercept, Bevacizumab, or Ranibizumab for Diabetic Macular Edema Two-Year Results from a Comparative Effectiveness Randomized Clinical Trial. Ophthalmology 2016, 123, 1351–1359. [Google Scholar] [CrossRef]
- Ishibashi, T.; Li, X.; Koh, A.; Lai, T.Y.Y.; Lee, F.-L.; Lee, W.-K.; Ma, Z.; Ohji, M.; Tan, N.; Cha, S.B.; et al. The REVEAL Study. Ophthalmology 2015, 122, 1402–1415. [Google Scholar] [CrossRef]
- Mitchell, P.; Bandello, F.; Schmidt-Erfurth, U.; Lang, G.E.; Massin, P.; Schlingemann, R.O.; Sutter, F.; Simader, C.; Burian, G.; Gerstner, O.; et al. The RESTORE Study: Ranibizumab Monotherapy or Combined with Laser versus Laser Monotherapy for Diabetic Macular Edema. Ophthalmology 2011, 118, 615–625. [Google Scholar] [CrossRef]
- Morioka, M.; Takamura, Y.; Yamada, Y.; Matsumura, T.; Gozawa, M.; Inatani, M. Flare Levels after Intravitreal Injection of Ranibizumab, Aflibercept, or Triamcinolone Acetonide for Diabetic Macular Edema. Graefe’s Arch. Clin. Exp. Ophthalmol. 2018, 256, 2301–2307. [Google Scholar] [CrossRef]
- Parikh, R.; Ross, J.S.; Sangaralingham, L.R.; Adelman, R.A.; Shah, N.D.; Barkmeier, A.J. Trends of Anti-Vascular Endothelial Growth Factor Use in Ophthalmology Among Privately Insured and Medicare Advantage Patients. Ophthalmology 2017, 124, 352–358. [Google Scholar] [CrossRef]
- Takamura, Y.; Kida, T.; Noma, H.; Inoue, M.; Yoshida, S.; Nagaoka, T.; Noda, K.; Yamada, Y.; Morioka, M.; Gozawa, M.; et al. The Impact of Interval between Recurrence and Reinjection in Anti-Vegf Therapy for Diabetic Macular Edema in pro Re Nata Regimen. J. Clin. Med. 2021, 10, 5738. [Google Scholar] [CrossRef]
- Polonsky, W.H.; Anderson, B.J.; Lohrer, P.A.; Welch, G.; Jacobson, A.M.; Aponte, J.E.; Schwartz, C.E. Assessment of Diabetes-Related Distress. Diabetes Care 1995, 18, 754–760. [Google Scholar] [CrossRef]
- Lipscombe, C.; Burns, R.J.; Schmitz, N. Exploring Trajectories of Diabetes Distress in Adults with Type 2 Diabetes; a Latent Class Growth Modeling Approach. J. Affect. Disord. 2015, 188, 160–166. [Google Scholar] [CrossRef]
- Pandit, A.U.; Bailey, S.C.; Curtis, L.M.; Seligman, H.K.; Davis, T.C.; Parker, R.M.; Schillinger, D.; DeWalt, D.; Fleming, D.; Mohr, D.C.; et al. Disease-Related Distress, Self-Care and Clinical Outcomes among Low-Income Patients with Diabetes. J. Epidemiol. Community Health 2014, 68, 557–564. [Google Scholar] [CrossRef]
- Zulman, D.M.; Rosland, A.M.; Choi, H.J.; Langa, K.M.; Heisler, M. The Influence of Diabetes Psychosocial Attributes and Self-Management Practices on Change in Diabetes Status. Patient Educ. Couns. 2012, 87, 74–80. [Google Scholar] [CrossRef]
- Kasteleyn, M.J.; de Vries, L.; van Puffelen, A.L.; Schellevis, F.G.; Rijken, M.; Vos, R.C.; Rutten, G.E.H.M.; Gorter, K.J.; Heijmans, M.J.W.M.; van der Heijden, A.A.W.A.; et al. Diabetes-Related Distress over the Course of Illness: Results from the Diacourse Study. Diabet. Med. 2015, 32, 1617–1624. [Google Scholar] [CrossRef]
- Diabetes Control and Complications Trial Research Group. The Effect of Intensive Treatment of Diabetes on the Development and Progression of Long-Term Complications in Insulin-Dependent Diabetes Mellitus. N. Engl. J. Med. 1993, 329, 977–986. [Google Scholar] [CrossRef]
- Baumeister, H.; Hutter, N.; Bengel, J. Psychological and Pharmacological Interventions for Depression in Patients with Diabetes Mellitus: An Abridged Cochrane Review. Diabet. Med. 2014, 31, 773–786. [Google Scholar] [CrossRef]
- Amanat, S.; Ghahri, S.; Dianatinasab, A.; Fararouei, M.; Dianatinasab, M. Exercise and Type 2 Diabetes. Adv. Exp. Med. Biol. 2020, 1228, 91–105. [Google Scholar] [CrossRef]
- Kuwata, H.; Okamura, S.; Hayashino, Y.; Tsujii, S.; Ishii, H. Higher Levels of Physical Activity Are Independently Associated with a Lower Incidence of Diabetic Retinopathy in Japanese Patients with Type 2 Diabetes: A Prospective Cohort Study, Diabetes Distress and Care Registry at Tenri (DDCRT15). PLoS ONE 2017, 12, e0172890. [Google Scholar] [CrossRef]
- McPherson, M.L.; Smith, S.W.; Powers, A.; Zuckerman, I.H. Association between Diabetes Patients’ Knowledge about Medications and Their Blood Glucose Control. Res. Social Adm. Pharm. 2008, 4, 37–45. [Google Scholar] [CrossRef]
- Klungel, O.H.; Storimans, M.J.; Floor-Schreudering, A.; Talsma, H.; Rutten, G.E.H.M.; de Blaey, C.J. Perceived Diabetes Status Is Independently Associated with Glucose Monitoring Behaviour among Type 2 Diabetes Mellitus Patients. Prim. Care Diabetes 2008, 2, 25–30. [Google Scholar] [CrossRef][Green Version]
- Sugiyama, T.; Imai, K.; Ihana-Sugiyama, N.; Tanaka, H.; Yanagisawa-Sugita, A.; Sasako, T.; Higashi, T.; Okamura, T.; Yamauchi, T.; Ueki, K.; et al. Variation in Process Quality Measures of Diabetes Care by Region and Institution in Japan during 2015–2016: An Observational Study of Nationwide Claims Data. Diabetes Res. Clin. Pract. 2019, 155, 107750. [Google Scholar] [CrossRef]
- Sugimoto, M.; Tsukitome, H.; Okamoto, F.; Oshika, T.; Ueda, T.; Niki, M.; Mitamura, Y.; Ishikawa, H.; Gomi, F.; Kitano, S.; et al. Clinical Preferences and Trends of Anti-Vascular Endothelial Growth Factor Treatments for Diabetic Macular Edema in Japan. J. Diabetes Investig. 2019, 10, 475–483. [Google Scholar] [CrossRef]
- Bansal, A.S.; Khurana, R.N.; Wieland, M.R.; Wang, P.-W.; Van Everen, S.A.; Tuomi, L. Influence of Glycosylated Hemoglobin on the Efficacy of Ranibizumab for Diabetic Macular Edema: A Post Hoc Analysis of the RIDE/RISE Trials. Ophthalmology 2015, 122, 1573–1579. [Google Scholar] [CrossRef]
- Matsuda, S.; Tam, T.; Singh, R.P.; Kaiser, P.K.; Petkovsek, D.; Carneiro, G.; Zanella, M.T.; Ehlers, J.P. The Impact of Metabolic Parameters on Clinical Response to VEGF Inhibitors for Diabetic Macular Edema. J. Diabetes Complicat. 2014, 28, 166–170. [Google Scholar] [CrossRef]
- Usui-Ouchi, A.; Tamaki, A.; Sakanishi, Y.; Tamaki, K.; Mashimo, K.; Sakuma, T.; Ebihara, N. Factors Affecting a Short-Term Response to Anti-VEGF Therapy in Diabetic Macular Edema. Life 2021, 11, 83. [Google Scholar] [CrossRef]
- Hirano, T.; Toriyama, Y.; Takamura, Y.; Sugimoto, M.; Nagaoka, T.; Sugiura, Y.; Okamoto, F.; Saito, M.; Noda, K.; Yoshida, S.; et al. Outcomes of a 2-Year Treat-and-Extend Regimen with Aflibercept for Diabetic Macular Edema. Sci. Rep. 2021, 11, 4488. [Google Scholar] [CrossRef]
- Glassman, A.R.; Wells, J.A.; Josic, K.; Maguire, M.G.; Antoszyk, A.N.; Baker, C.; Beaulieu, W.T.; Elman, M.J.; Jampol, L.M.; Sun, J.K. Five-Year Outcomes after Initial Aflibercept, Bevacizumab, or Ranibizumab Treatment for Diabetic Macular Edema (Protocol T Extension Study). Ophthalmology 2020, 127, 1201–1210. [Google Scholar] [CrossRef]
- Costagliola, C.; Sasso, F.C. The Importance of Telemedicine during COVID-19 Pandemic: A Focus on Diabetic Retinopathy. J. Diabetes Res. 2020, 2020, 9036847. [Google Scholar] [CrossRef]
- Sasso, F.C.; Pafundi, P.C.; Gelso, A.; Bono, V.; Costagliola, C.; Marfella, R.; Sardu, C.; Rinaldi, L.; Galiero, R.; Acierno, C.; et al. Telemedicine for Screening Diabetic Retinopathy: The NO BLIND Italian Multicenter Study. Diabetes Metab. Res. Rev. 2019, 35, e3113. [Google Scholar] [CrossRef]
- Klein, R.; Klein, B.E.; Moss, S.E.; Davis, M.D.; DeMets, D.L. The Wisconsin Epidemiologic Study of Diabetic Retinopathy. II. Prevalence and Risk of Diabetic Retinopathy When Age at Diagnosis Is Less than 30 Years. Arch. Ophthalmol. 1984, 102, 520–526. [Google Scholar] [CrossRef] [PubMed]
- Takamura, Y.; Matsumura, T.; Ohkoshi, K.; Takei, T.; Ishikawa, K.; Shimura, M.; Ueda, T.; Sugimoto, M.; Hirano, T.; Takayama, K.; et al. Functional and Anatomical Changes in Diabetic Macular Edema after Hemodialysis Initiation: One-Year Follow-up Multicenter Study. Sci. Rep. 2020, 10, 7788. [Google Scholar] [CrossRef] [PubMed]
- Chew, E.Y.; Klein, M.L.; Ferris, F.L.; Remaley, N.A.; Murphy, R.P.; Chantry, K.; Hoogwerf, B.J.; Miller, D. Association of Elevated Serum Lipid Levels with Retinal Hard Exudate in Diabetic Retinopathy. Early Treatment Diabetic Retinopathy Study (ETDRS) Report 22. Arch. Ophthalmol. 1996, 114, 1079–1084. [Google Scholar] [CrossRef]
- Man, R.E.K.; Sasongko, M.B.; Wang, J.J.; MacIsaac, R.; Wong, T.Y.; Sabanayagam, C.; Lamoureux, E.L. The Association of Estimated Glomerular Filtration Rate with Diabetic Retinopathy and Macular Edema. Investig. Ophthalmol. Vis. Sci. 2015, 56, 4810–4816. [Google Scholar] [CrossRef]
- Yamamoto, M.; Fujihara, K.; Ishizawa, M.; Osawa, T.; Kaneko, M.; Ishiguro, H.; Matsubayashi, Y.; Seida, H.; Yamanaka, N.; Tanaka, S.; et al. Overt Proteinuria, Moderately Reduced EGFR and Their Combination Are Predictive of Severe Diabetic Retinopathy or Diabetic Macular Edema in Diabetes. Investig. Ophthalmol. Vis. Sci. 2019, 60, 2685–2689. [Google Scholar] [CrossRef]


| Patients (n = 112) | |
|---|---|
| Age (year) | 67.0 ± 10.3 |
| Male gender | 80/32 (71.4%) |
| Duration of diabetes mellitus (year) | 12.7 ± 10.6 |
| Number of anti-VEGF injections (2 years) | 6.4 ± 4.5 |
| Hemoglobin A1c (%) | 7.4 ± 1.08 |
| Creatinine (mg/dL) | 1.04 ± 1.16 |
| Question | Groups | n (%) | The Ratio of A1a n (%) | p Value a |
|---|---|---|---|---|
| 1. Since starting anti-vascular endothelial growth factor (VEGF) therapy, have you become more active in glycemic control through diet and/or exercise therapy? | A1a: Yes | 67 (59.8) | 67/67 (100) | - |
| A1b: No | 45 (40.2) | 0/45 (0) | ||
| 2. Until you were aware of your vision impairment due to DME, did you know that diabetes mellitus can cause visual impairment? | A2a: Yes | 83 (74.1) | 47/83 (56.6) | 0.2433 |
| A2b: No | 29 (25.9) | 20/29 (69.0) | ||
| 3. Have you started to regular visit an ophthalmologist after vision loss? | A3a: Yes | 74 (66.1) | 52/74 (70.2) | 0.0016 |
| A3b: No | 38 (33.9) | 15/38 (39.5) | ||
| 4. Do you think the cost of anti-VEGF drugs is high? | A4a: Yes | 76 (67.9) | 47/76 (61.8) | 0.5262 |
| A4b: No | 36 (32.1) | 20/36 (55.6) |
Publisher’s Note: MDPI stays neutral with regard to jurisdictional claims in published maps and institutional affiliations. |
© 2022 by the authors. Licensee MDPI, Basel, Switzerland. This article is an open access article distributed under the terms and conditions of the Creative Commons Attribution (CC BY) license (https://creativecommons.org/licenses/by/4.0/).
Share and Cite
Oshima, H.; Takamura, Y.; Hirano, T.; Shimura, M.; Sugimoto, M.; Kida, T.; Matsumura, T.; Gozawa, M.; Yamada, Y.; Morioka, M.; et al. Glycemic Control after Initiation of Anti-VEGF Treatment for Diabetic Macular Edema. J. Clin. Med. 2022, 11, 4659. https://doi.org/10.3390/jcm11164659
Oshima H, Takamura Y, Hirano T, Shimura M, Sugimoto M, Kida T, Matsumura T, Gozawa M, Yamada Y, Morioka M, et al. Glycemic Control after Initiation of Anti-VEGF Treatment for Diabetic Macular Edema. Journal of Clinical Medicine. 2022; 11(16):4659. https://doi.org/10.3390/jcm11164659
Chicago/Turabian StyleOshima, Hideyuki, Yoshihiro Takamura, Takao Hirano, Masahiko Shimura, Masahiko Sugimoto, Teruyo Kida, Takehiro Matsumura, Makoto Gozawa, Yutaka Yamada, Masakazu Morioka, and et al. 2022. "Glycemic Control after Initiation of Anti-VEGF Treatment for Diabetic Macular Edema" Journal of Clinical Medicine 11, no. 16: 4659. https://doi.org/10.3390/jcm11164659
APA StyleOshima, H., Takamura, Y., Hirano, T., Shimura, M., Sugimoto, M., Kida, T., Matsumura, T., Gozawa, M., Yamada, Y., Morioka, M., & Inatani, M. (2022). Glycemic Control after Initiation of Anti-VEGF Treatment for Diabetic Macular Edema. Journal of Clinical Medicine, 11(16), 4659. https://doi.org/10.3390/jcm11164659