
Differentiation of Cerebral Dissecting Aneurysm from Hemorrhagic Saccular Aneurysm by Machine-Learning Based on Vessel Wall MRI: A Multicenter Study

Abstract
:1. Introduction
2. Methods
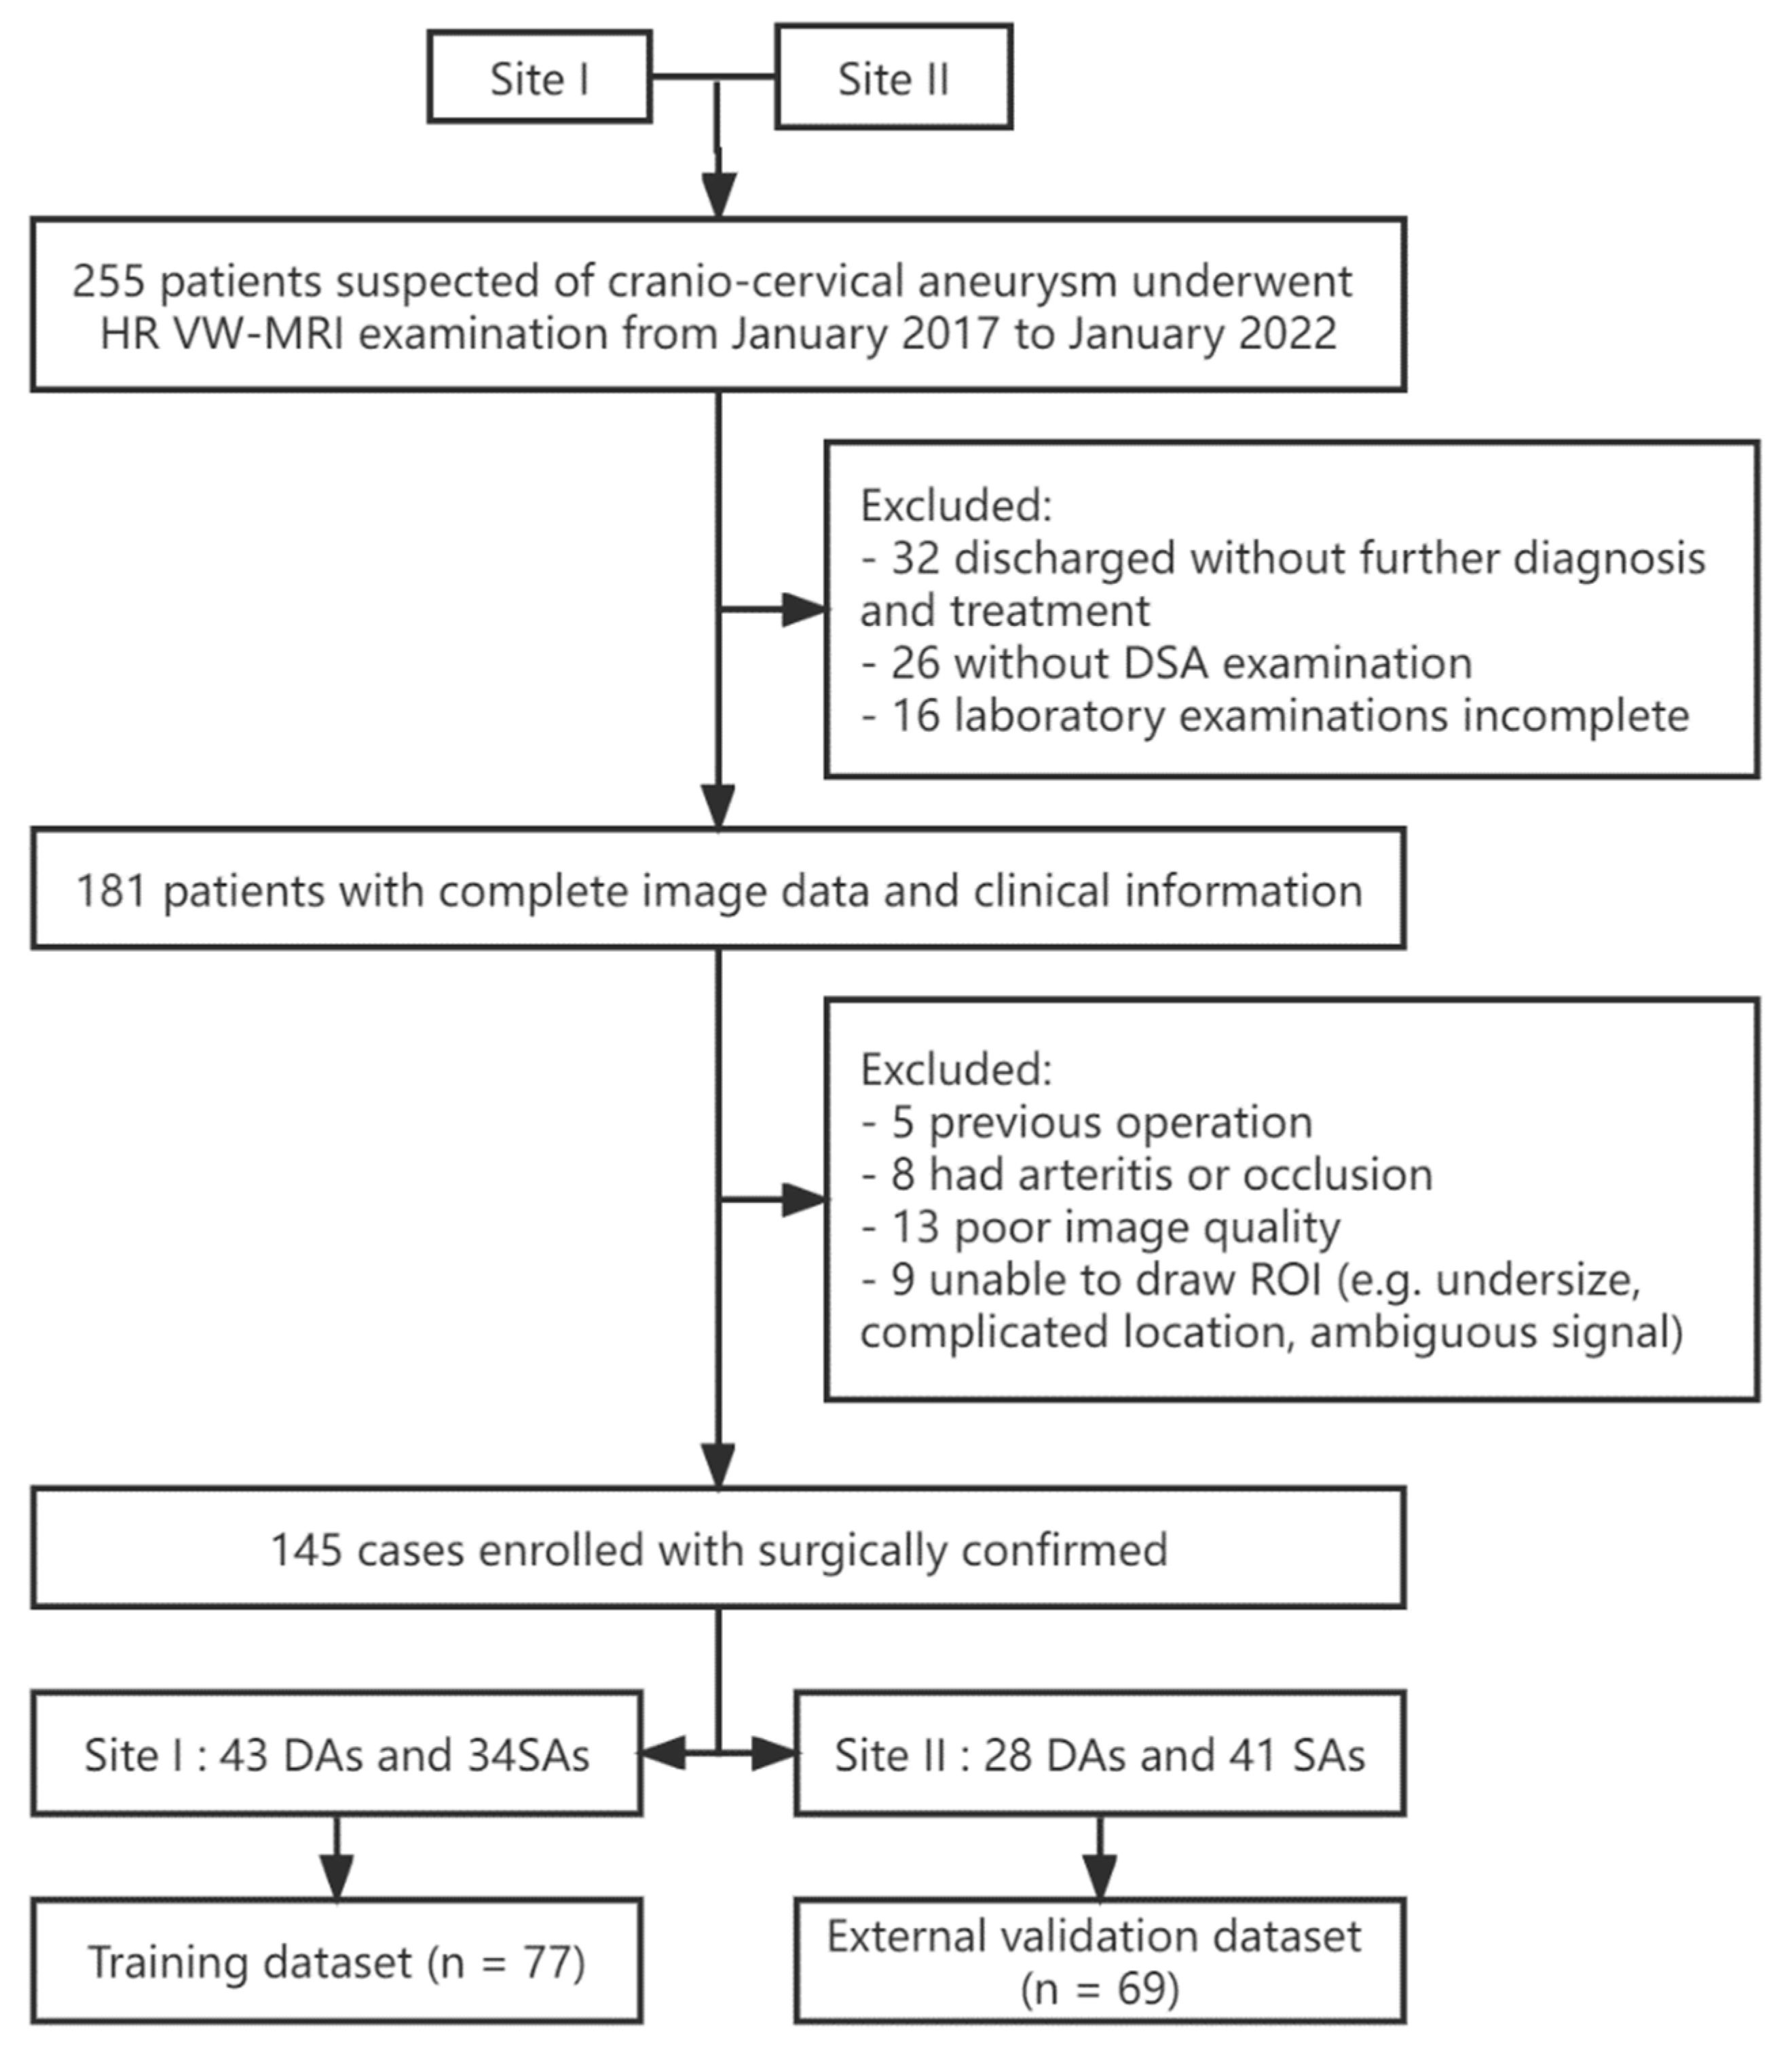
3. Participants
3.1. Image Data Acquisition
3.2. Image Processing and Radiomic Feature Extraction
3.3. Model Building
3.4. Model Evaluation and Statistical Analysis
3.5. Radiologists′ Diagnosis
4. Results
5. Discussion
Author Contributions
Funding
Institutional Review Board Statement
Informed Consent Statement
Data Availability Statement
Conflicts of Interest
References
- Tian, Z.; Wang, Z.; Li, W.; Zhu, W.; Liu, J.; Zhang, Y.; Yang, X.; Zhang, Y. Dynamic contrast-enhanced MRI analysis for prognosis of intracranial dissecting aneurysm with intramural haematoma after endovascular treatment: An observational registry study. Stroke Vasc. Neurol. 2020, 6, 133–138. [Google Scholar] [CrossRef] [PubMed]
- Beletsky, V.; Norris, J.W. Spontaneous dissection of the carotid and vertebral arteries. N. Engl. J. Med. 2001, 345, 467. [Google Scholar] [PubMed]
- Kurata, A.; Ohmomo, T.; Miyasaka, Y.; Fujii, K.; Kan, S.; Kitahara, T. Coil embolization for the treatment of ruptured dissecting vertebral aneurysms. AJNR Am. J. Neuroradiol. 2001, 22, 11–18. [Google Scholar]
- Su, W.; Gou, S.; Ni, S.; Li, G.; Liu, Y.; Zhu, S.; Li, X. Management of ruptured and unruptured intracranial vertebral artery dissecting aneurysms. J. Clin. Neurosci. 2011, 18, 1639–1644. [Google Scholar] [CrossRef] [PubMed]
- Bender, M.T.; Colby, G.P.; Jiang, B.; Lin, L.M.; Campos, J.K.; Xu, R.; Westbroek, E.M.; Vo, C.D.; Zarrin, D.A.; Caplan, J.M.; et al. Flow diversion of posterior circulation cerebral aneurysms: A single-institution series of 59 cases. Neurosurgery 2019, 84, 206–216. [Google Scholar] [CrossRef] [PubMed] [Green Version]
- International Study of Unruptured Intracranial Aneurysms Investigators. Unruptured intracranial aneurysms—Risk of rupture and risks of surgical intervention. N. Engl. J. Med. 1998, 339, 1725–1733. [Google Scholar] [CrossRef]
- Foster, M.T.; Herwadkar, A.; Patel, H.C. Posterior inferior cerebellar artery/vertebral artery subarachnoid hemorrhage: A comparison of saccular vs dissecting aneurysms. Neurosurgery 2018, 82, 93–98. [Google Scholar] [CrossRef]
- Alfotih, G.T.; Li, F.; Xu, X.; Zhang, S. Risk factors for re-bleeding of aneurysmal subarachnoid hemorrhage: Meta-analysis of observational studies. Neurol. Neurochir. Pol. 2014, 48, 346–355. [Google Scholar] [CrossRef]
- Zhao, X.; Wang, H.; Liu, J.; Zhang, Z.; Li, Z. Endovascular treatment of vertebral artery dissecting aneurysm: A single-center experience. Exp. Ther. Med. 2019, 18, 4838–4844. [Google Scholar] [CrossRef] [Green Version]
- Bachmann, R.; Nassenstein, I.; Kooijman, H.; Dittrich, R.; Stehling, C.; Kugel, H.; Niederstadt, T.; Kuhlenbaumer, G.; Ringelstein, E.B.; Kramer, S.; et al. High-resolution magnetic resonance imaging (MRI) at 3.0 Tesla in the short-term follow-up of patients with proven cervical artery dissection. Investig. Radiol. 2007, 42, 460–466. [Google Scholar] [CrossRef]
- Oppenheim, C.; Naggara, O.; Touze, E.; Lacour, J.C.; Schmitt, E.; Bonneville, F.; Crozier, S.; Guegan-Massardier, E.; Gerardin, E.; Leclerc, X.; et al. High-resolution MR imaging of the cervical arterial wall: What the radiologist needs to know. Radiographics 2009, 29, 1413–1431. [Google Scholar] [CrossRef] [PubMed]
- Horie, N.; Morikawa, M.; Fukuda, S.; Hayashi, K.; Suyama, K.; Nagata, I. Detection of blood blister-like aneurysm and intramural hematoma with high-resolution magnetic resonance imaging. J. Neurosurg. 2011, 115, 1206–1209. [Google Scholar] [CrossRef] [PubMed]
- Wang, Y.; Lou, X.; Li, Y.; Sui, B.; Sun, S.; Li, C.; Jiang, P.; Siddiqui, A.; Yang, X. Imaging investigation of intracranial arterial dissecting aneurysms by using 3 T high-resolution MRI and DSA: From the interventional neuroradiologists’ view. Acta Neurochir. 2014, 156, 515–525. [Google Scholar] [CrossRef] [PubMed]
- Tian, Z.; Chen, J.; Zhang, Y.; Liu, J.; Wang, Y.; Sui, B.; Yang, X. Quantitative analysis of intracranial vertebrobasilar dissecting aneurysm with intramural hematoma after endovascular treatment using 3-T high-resolution magnetic resonance imaging. World Neurosurg. 2017, 108, 236–243. [Google Scholar] [CrossRef]
- Podgorsak, A.R.; Rava, R.A.; Shiraz Bhurwani, M.M.; Chandra, A.R.; Davies, J.M.; Siddiqui, A.H.; Ionita, C.N. Automatic radiomic feature extraction using deep learning for angiographic parametric imaging of intracranial aneurysms. J. Neurointerv. Surg. 2020, 12, 417–421. [Google Scholar] [CrossRef]
- Nakao, T.; Hanaoka, S.; Nomura, Y.; Sato, I.; Nemoto, M.; Miki, S.; Maeda, E.; Yoshikawa, T.; Hayashi, N.; Abe, O. Deep neural network-based computer-assisted detection of cerebral aneurysms in MR angiography. J. Magn. Reson. Imaging 2018, 47, 948–953. [Google Scholar] [CrossRef]
- Liu, J.; Chen, Y.; Lan, L.; Lin, B.; Chen, W.; Wang, M.; Li, R.; Yang, Y.; Zhao, B.; Hu, Z.; et al. Prediction of rupture risk in anterior communicating artery aneurysms with a feed-forward artificial neural network. Eur. Radiol. 2018, 28, 3268–3275. [Google Scholar] [CrossRef]
- Weninger, L.; Haarburger, C.; Merhof, D. Robustness of radiomics for survival prediction of brain tumor patients depending on resection status. Front. Comput. Neurosci. 2019, 13, 73. [Google Scholar] [CrossRef]
- van Griethuysen, J.J.M.; Fedorov, A.; Parmar, C.; Hosny, A.; Aucoin, N.; Narayan, V.; Beets-Tan, R.G.H.; Fillion-Robin, J.C.; Pieper, S.; Aerts, H. Computational radiomics system to decode the radiographic phenotype. Cancer Res. 2017, 77, e104–e107. [Google Scholar] [CrossRef] [Green Version]
- Sun, R.; Limkin, E.J.; Vakalopoulou, M.; Dercle, L.; Champiat, S.; Han, S.R.; Verlingue, L.; Brandao, D.; Lancia, A.; Ammari, S.; et al. A radiomics approach to assess tumour-infiltrating CD8 cells and response to anti-PD-1 or anti-PD-L1 immunotherapy: An imaging biomarker, retrospective multicohort study. Lancet Oncol. 2018, 19, 1180–1191. [Google Scholar] [CrossRef]
- Cawley, G.C.; Talbot, N.L.C. On over-fitting in model selection and subsequent selection bias in performance evaluation. J. Mach. Learn. Res. 2010, 11, 2079–2107. [Google Scholar]
- Zhang, M.; Ye, G.; Liu, Y.; Wang, Q.; Li, S.; Wang, Y. Clinical application of high-resolution MRI in combination with digital subtraction angiography in the diagnosis of vertebrobasilar artery dissecting aneurysm: An observational study (STROBE compliant). Medicine 2019, 98, e14857. [Google Scholar] [CrossRef] [PubMed]
- Kim, S.; Chung, J.; Cha, J.; Kim, B.M.; Kim, D.J.; Kim, Y.B.; Lee, J.W.; Huh, S.K.; Park, K.Y. Usefulness of high-resolution three-dimensional proton density-weighted turbo spin-echo MRI in distinguishing a junctional dilatation from an intracranial aneurysm of the posterior communicating artery: A pilot study. J. NeuroInterv. Surg. 2019, 12, 315–319. [Google Scholar] [CrossRef] [PubMed]
- Cao, X.; Xia, W.; Tang, Y.; Zhang, B.; Yang, J.M.; Zeng, Y.W.; Geng, D.Y.; Zhang, J. Radiomic model for distinguishing dissecting aneurysms from complicated saccular aneurysms on high-resolution magnetic resonance imaging. J. Stroke Cerebrovasc. Dis. 2020, 29, 105268. [Google Scholar] [CrossRef] [PubMed]
- Yao, X.; Liao, L.; Han, Y.; Wei, T.; Wu, H.; Wang, Y.; Li, Y.; Zhang, X.; Ren, K. Computerized tomography radiomics features analysis for evaluation of perihematomal edema in basal ganglia hemorrhage. J. Craniofacial Surg. 2019, 30, e768–e771. [Google Scholar] [CrossRef] [PubMed]
- Gui, J.; Li, H. Penalized Cox regression analysis in the high-dimensional and low-sample size settings, with applications to microarray gene expression data. Bioinformatics 2005, 21, 3001–3008. [Google Scholar] [CrossRef] [PubMed] [Green Version]
- Hui Zou, T.H. Regularization and variable selection via the elastic net. J. R. Stat. Soc. 2005, 67, 768. [Google Scholar] [CrossRef]
- Aerts, H.J.; Velazquez, E.R.; Leijenaar, R.T.; Parmar, C.; Grossmann, P.; Carvalho, S.; Bussink, J.; Monshouwer, R.; Haibe-Kains, B.; Rietveld, D.; et al. Decoding tumour phenotype by noninvasive imaging using a quantitative radiomics approach. Nat. Commun. 2014, 5, 4006. [Google Scholar] [CrossRef]
- Andreassen, C.N.; Schack, L.M.; Laursen, L.V.; Alsner, J. Radiogenomics—Current status, challenges and future directions. Cancer Lett. 2016, 382, 127–136. [Google Scholar] [CrossRef]
- Passero, S.G.; Rossi, S. Natural history of vertebrobasilar dolichoectasia. Neurology 2008, 70, 66–72. [Google Scholar] [CrossRef]
- Braunstein, H. Pathogenesis of dissecting aneurysm. Circulation 1963, 28, 1071–1080. [Google Scholar] [CrossRef] [PubMed] [Green Version]
- Wang, X.; Zhao, X.; Li, Q.; Xia, W.; Peng, Z.; Zhang, R.; Li, Q.; Jian, J.; Wang, W.; Tang, Y.; et al. Can peritumoral radiomics increase the efficiency of the prediction for lymph node metastasis in clinical stage T1 lung adenocarcinoma on CT? Eur. Radiol. 2019, 29, 6049–6058. [Google Scholar] [CrossRef] [PubMed]
- Meng, X.; Xia, W.; Xie, P.; Zhang, R.; Li, W.; Wang, M.; Xiong, F.; Liu, Y.; Fan, X.; Xie, Y.; et al. Preoperative radiomic signature based on multiparametric magnetic resonance imaging for noninvasive evaluation of biological characteristics in rectal cancer. Eur. Radiol. 2019, 29, 3200–3209. [Google Scholar] [CrossRef] [PubMed]
- Martin-Carreras, T.; Li, H.; Cooper, K.; Fan, Y.; Sebro, R. Radiomic features from MRI distinguish myxomas from myxofibrosarcomas. BMC Med. Imaging 2019, 19, 67. [Google Scholar] [CrossRef]
- Yang, M.; Ren, Y.; She, Y.; Xie, D.; Sun, X.; Shi, J.; Zhao, G.; Chen, C. Imaging phenotype using radiomics to predict dry pleural dissemination in non-small cell lung cancer. Ann. Transl. Med. 2019, 7, 259. [Google Scholar] [CrossRef]
- Liao, X.; Cai, B.; Tian, B.; Luo, Y.; Song, W.; Li, Y. Machine-learning based radiogenomics analysis of MRI features and metagenes in glioblastoma multiforme patients with different survival time. J. Cell. Mol. Med. 2019, 23, 4375–4385. [Google Scholar] [CrossRef]
- Wang, H.; Hu, D.; Yao, H.; Chen, M.; Li, S.; Chen, H.; Luo, J.; Feng, Y.; Guo, Y. Radiomics analysis of multiparametric MRI for the preoperative evaluation of pathological grade in bladder cancer tumors. Eur. Radiol. 2019, 29, 6182–6190. [Google Scholar] [CrossRef]
- He, B.; Ji, T.; Zhang, H.; Zhu, Y.; Shu, R.; Zhao, W.; Wang, K. MRI-based radiomics signature for tumor grading of rectal carcinoma using random forest model. J. Cell. Physiol. 2019, 234, 20501–20509. [Google Scholar] [CrossRef]
- Yu, F.H.; Wang, J.X.; Ye, X.H.; Deng, J.; Hang, J.; Yang, B. Ultrasound-based radiomics nomogram: A potential biomarker to predict axillary lymph node metastasis in early-stage invasive breast cancer. Eur. J. Radiol. 2019, 119, 108658. [Google Scholar] [CrossRef]
- Tran, B.; Dancey, J.E.; Kamel-Reid, S.; McPherson, J.D.; Bedard, P.L.; Brown, A.M.; Zhang, T.; Shaw, P.; Onetto, N.; Stein, L.; et al. Cancer genomics: Technology, discovery, and translation. J. Clin. Oncol. 2012, 30, 647–660. [Google Scholar] [CrossRef]

| Training Set (n = 77) | External Test Set (n = 69) | |||||
|---|---|---|---|---|---|---|
| DA | SA | p | DA | SA | p | |
| No. of patients | 43 | 34 | 28 | 41 | ||
| Female (n, %) | 13 (30.23%) | 23 (67.65%) | 0.001 | 9 (32.14%) | 32 (78.05%) | <0.001 |
| Age (year) | 49.79 ± 12.06 | 55.00 ± 13.55 | 0.094 | 54.29 ± 11.43 | 57.54 ± 14.91 | 0.035 |
| Clinical symptoms (n, %) | 37 (86.05%) | 24 (70.59%) | 0.097 | 11 (39.29%) | 32 (78.05%) | 0.001 |
| MRI features (n, %) | ||||||
| Sign resembling the intimal flap | 21 (48.84%) | 23 (67.65%) | 0.098 | 10 (35.71%) | 26 (63.42%) | 0.024 |
| HHT | 34 (79.07%) | 12 (35.29%) | <0.001 | 19 (67.86%) | 14 (34.15%) | 0.006 |
| Size (cm) | ||||||
| Long diameter | 1.91 ± 1.04 | 1.66 ± 0.92 | 0.543 | 1.47 ± 0.80 | 1.94 ± 0.95 | 0.004 |
| Short diameter | 1.15 ± 0.60 | 1.30 ± 0.73 | 0.203 | 1.22 ± 0.75 | 1.59 ± 0.78 | 0.005 |
| Lesion location (n, %) | ||||||
| Anterior circulation | 13 (30.23%) | 26 (76.47) | <0.001 | 5 (17.86%) | 33 (80.49%) | <0.001 |
| ICA | 11 (25.58%) | 18 (52.94%) | 0.014 | 1 (3.57%) | 23 (56.10%) | <0.001 |
| MCA | 2 (4.65%) | 9 (26.47%) | 0.007 | 4 (14.29%) | 9 (21.95%) | 0.424 |
| Posterior circulation | 30 (69.77%) | 7 (20.59%) | <0.001 | 23 (82.14%) | 8 (19.51%) | <0.001 |
| BA | 4 (9.30%) | 2 (5.88%) | 0.578 | 5 (14.86%) | 1 (2.44%) | 0.026 |
| VA | 24 (55.81%) | 2 (5.88%) | <0.001 | 18 (64.29%) | 3 (7.32%) | <0.001 |
| PCA | 2 (4.65%) | 3 (8.82%) | 0.461 | 0 | 4 (9.76%) | 0.089 |
| Coagulation examination | ||||||
| INR | 0.97 ± 0.06 | 0.96 ± 0.10 | 0.372 | 0.96 ± 0.05 | 0.96 ± 0.13 | 0.214 |
| Model or Radiologists | Training Set | External Test Set | ||||||
|---|---|---|---|---|---|---|---|---|
| AUC | ACC | SEN | SPE | AUC | ACC | SEN | SPE | |
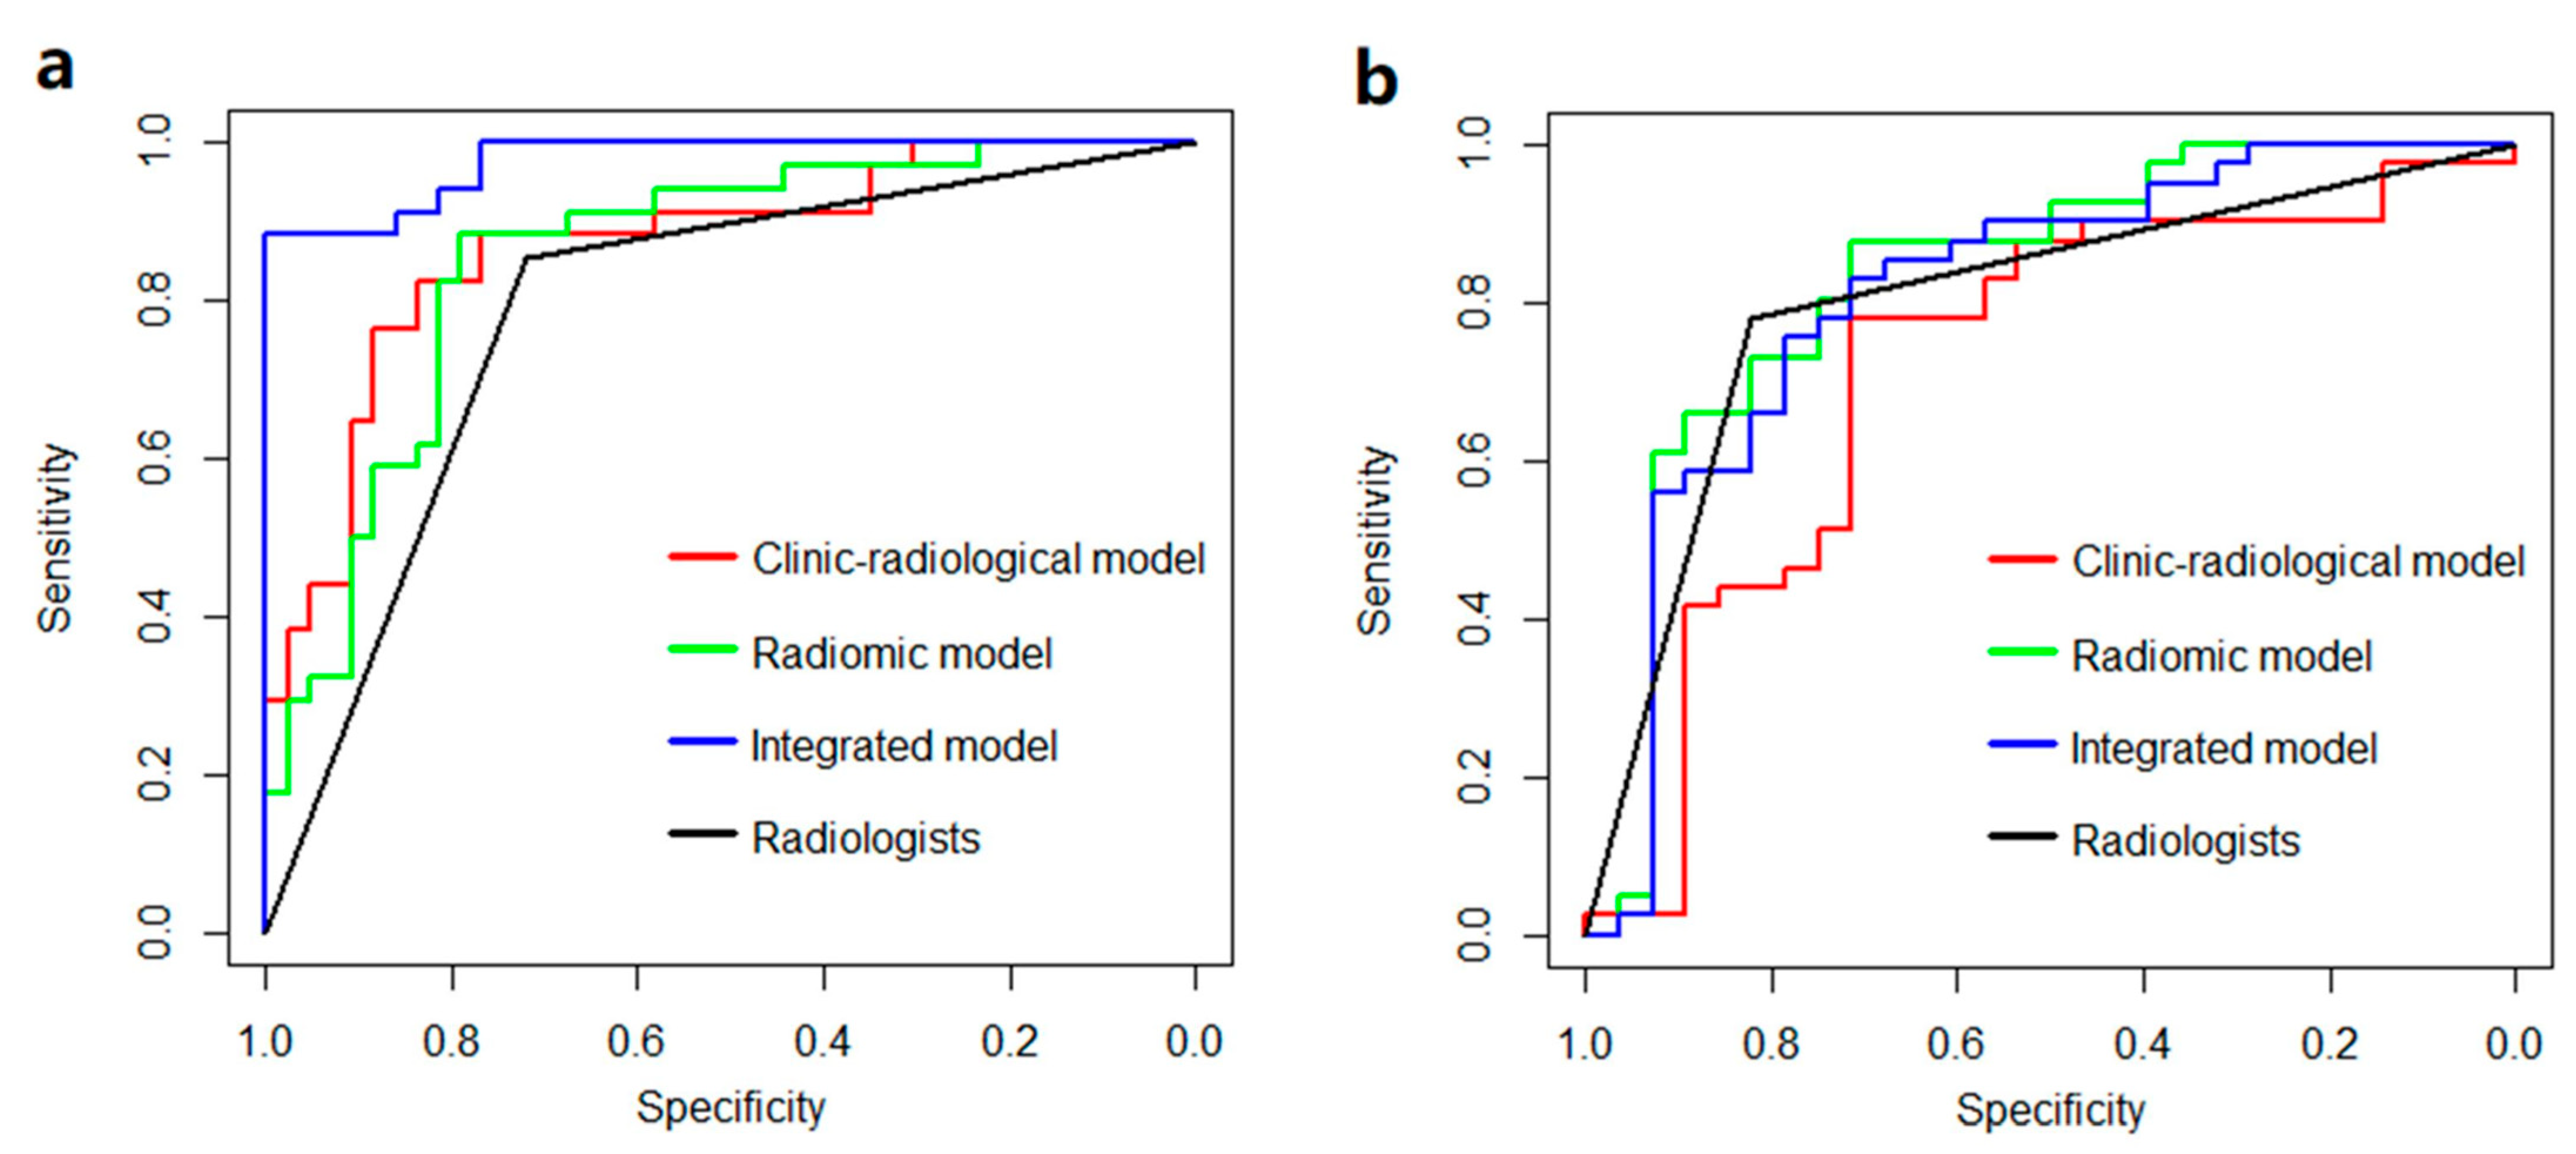
| Clinico-radiological model | 0.867 | 0.831 | 0.823 | 0.837 | 0.717 | 0.753 | 0.780 | 0.714 |
| Radiomic model | 0.853 | 0.831 | 0.882 | 0.791 | 0.831 | 0.812 | 0.878 | 0.714 |
| Integrated model | 0.977 | 0.948 | 0.882 | 1.000 | 0.813 | 0.782 | 0.829 | 0.714 |
| Radiologists | 0.787 | 0.779 | 0.852 | 0.720 | 0.801 | 0.797 | 0.780 | 0.821 |
Publisher’s Note: MDPI stays neutral with regard to jurisdictional claims in published maps and institutional affiliations. |
© 2022 by the authors. Licensee MDPI, Basel, Switzerland. This article is an open access article distributed under the terms and conditions of the Creative Commons Attribution (CC BY) license (https://creativecommons.org/licenses/by/4.0/).
Share and Cite
Cao, X.; Zeng, Y.; Wang, J.; Cao, Y.; Wu, Y.; Xia, W. Differentiation of Cerebral Dissecting Aneurysm from Hemorrhagic Saccular Aneurysm by Machine-Learning Based on Vessel Wall MRI: A Multicenter Study. J. Clin. Med. 2022, 11, 3623. https://doi.org/10.3390/jcm11133623
Cao X, Zeng Y, Wang J, Cao Y, Wu Y, Xia W. Differentiation of Cerebral Dissecting Aneurysm from Hemorrhagic Saccular Aneurysm by Machine-Learning Based on Vessel Wall MRI: A Multicenter Study. Journal of Clinical Medicine. 2022; 11(13):3623. https://doi.org/10.3390/jcm11133623
Chicago/Turabian StyleCao, Xin, Yanwei Zeng, Junying Wang, Yunxi Cao, Yifan Wu, and Wei Xia. 2022. "Differentiation of Cerebral Dissecting Aneurysm from Hemorrhagic Saccular Aneurysm by Machine-Learning Based on Vessel Wall MRI: A Multicenter Study" Journal of Clinical Medicine 11, no. 13: 3623. https://doi.org/10.3390/jcm11133623
APA StyleCao, X., Zeng, Y., Wang, J., Cao, Y., Wu, Y., & Xia, W. (2022). Differentiation of Cerebral Dissecting Aneurysm from Hemorrhagic Saccular Aneurysm by Machine-Learning Based on Vessel Wall MRI: A Multicenter Study. Journal of Clinical Medicine, 11(13), 3623. https://doi.org/10.3390/jcm11133623