
Comparison between Deep-Learning-Based Ultra-Wide-Field Fundus Imaging and True-Colour Confocal Scanning for Diagnosing Glaucoma

 , , and
Abstract
:1. Introduction
2. Methods
2.1. Participants
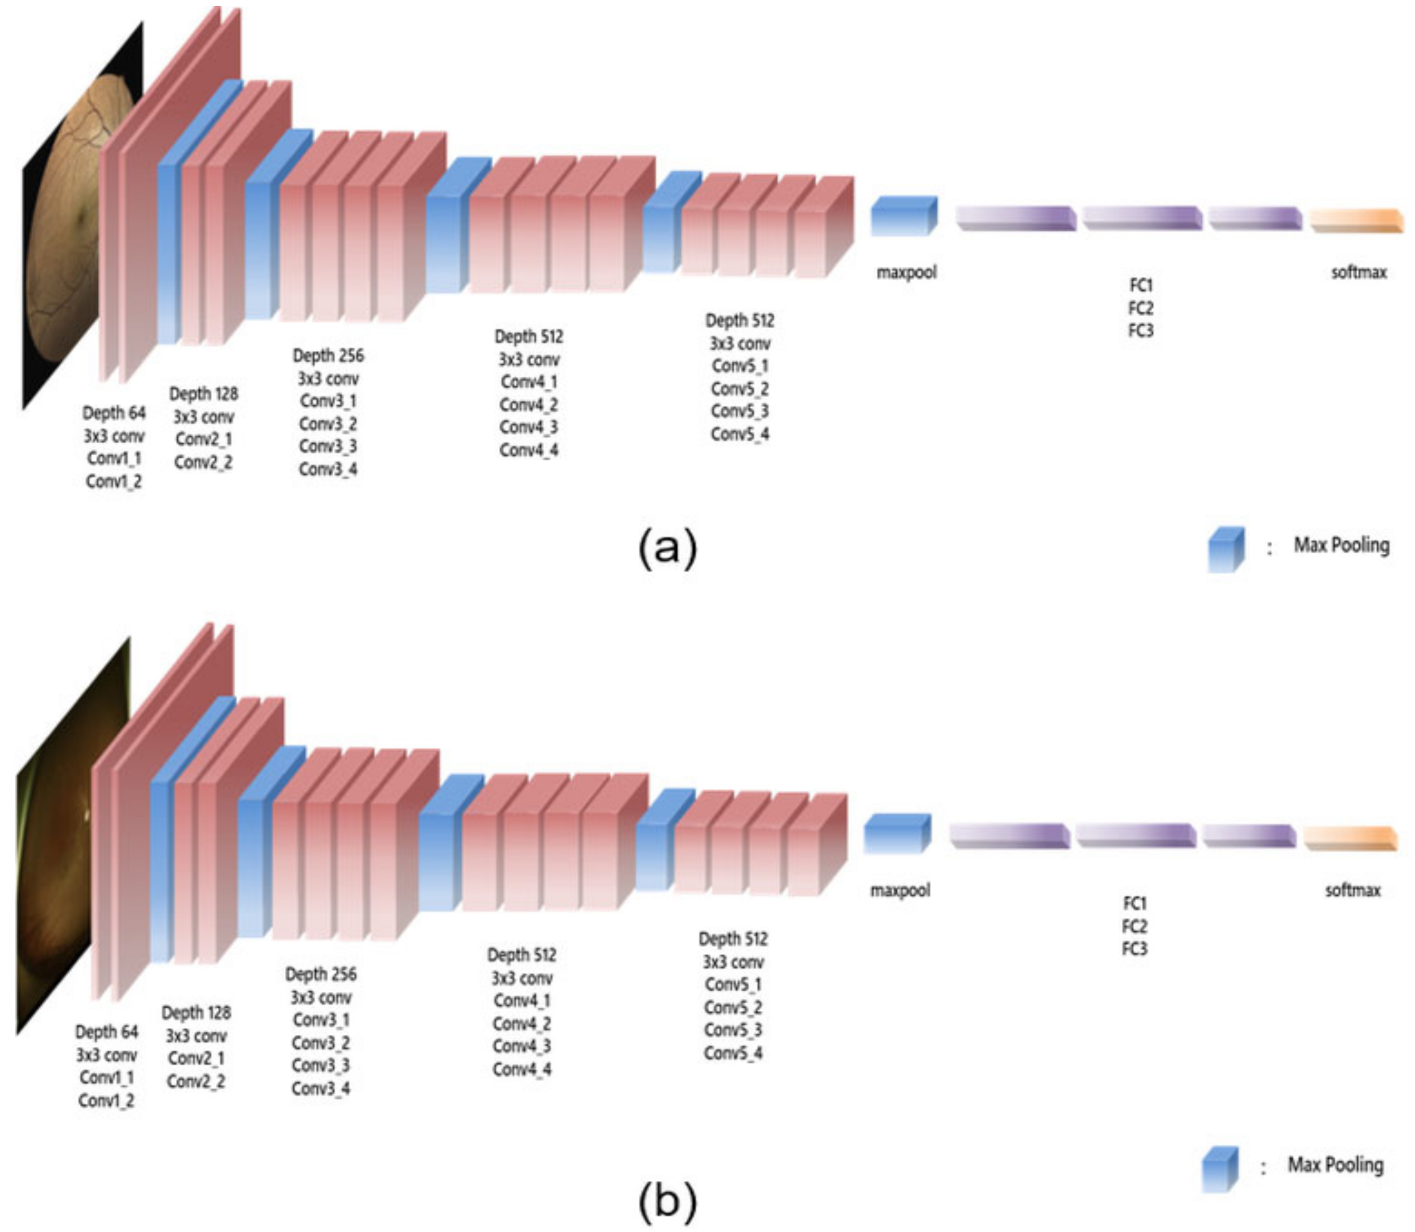
2.2. Glaucoma Diagnosis Using UWF Fundus Imaging and True-Colour Confocal Scanning
2.3. Statistical Analyses
3. Results
Healthy Group versus Glaucoma Group
4. Discussion
5. Conclusions
Supplementary Materials
Author Contributions
Funding
Institutional Review Board Statement
Informed Consent Statement
Data Availability Statement
Conflicts of Interest
References
- Sommer, A.; Katz, J.; Quigley, H.A.; Miller, N.R.; Robin, A.L.; Richter, R.C.; Witt, K.A. Clinically detectable nerve fiber atrophy precedes the onset of glaucomatous field loss. Arch. Ophthalmol. 1991, 109, 77–83. [Google Scholar] [CrossRef] [PubMed]
- Sommer, A. Retinal Nerve Fiber Layer. Am. J. Ophthalmol. 1995, 120, 665–667. [Google Scholar] [CrossRef]
- Quigley, H.A.; Katz, J.; Derick, R.J.; Gilbert, D.; Sommer, A. An evaluation of optic disc and nerve fiber layer examinations in monitoring progression of early glaucoma damage. Ophthalmology 1992, 99, 19–28. [Google Scholar] [CrossRef]
- Hoyt, W.F.; Frisen, L.; Newman, N.M. Fundoscopy of nerve fiber layer defects in glaucoma. Investig. Ophthalmol. Vis. Sci. 1973, 12, 814–829. [Google Scholar]
- Sommer, A.; Miller, N.R.; Pollack, I.; Maumenee, A.E.; George, T. The nerve fiber layer in the diagnosis of glaucoma. Arch. Ophthalmol. 1977, 95, 2149–2156. [Google Scholar] [CrossRef]
- Jonas, J.B.; Schiro, D. Localised wedge shaped defects of the retinal nerve fibre layer in glaucoma. Br. J. Ophthalmol. 1994, 78, 285–290. [Google Scholar] [CrossRef]
- Tuulonen, A.; Airaksinen, P.J.; Montagna, A.; Nieminen, H. Screening for glaucoma with a non-mydriatic fundus camera. Acta Ophthalmol. 1990, 68, 445–449. [Google Scholar] [CrossRef]
- Kim, K.E.; Oh, S.; Jeoung, J.W.; Suh, M.H.; Seo, J.H.; Kim, M.; Park, K.H.; Kim, D.M.; Kim, S.H. Spectral-domain optical coherence tomography in manifest glaucoma: Its additive role in structural diagnosis. Am. J. Ophthalmol. 2016, 171, 18–26. [Google Scholar] [CrossRef]
- Patel, S.N.; Shi, A.; Wibbelsman, T.D.; Klufas, M.A. Ultra-widefield retinal imaging: An update on recent advances. Ther. Adv. Ophthalmol. 2020, 12, 2515841419899495. [Google Scholar] [CrossRef] [Green Version]
- Witmer, M.T.; Kiss, S. Wide-field imaging of the retina. Surv. Ophthalmol. 2013, 58, 143–154. [Google Scholar] [CrossRef]
- Borrelli, E.; Lei, J.; Balasubramanian, S.; Uji, A.; Cozzi, M.; Sarao, V.; Lanzetta, P.; Staurenghi, G.; Sadda, S.R. Green emission fluorophores in eyes with atrophic age-related macular degeneration: A colour fundus autofluorescence pilot study. Br. J. Ophthalmol. 2018, 102, 827–832. [Google Scholar] [CrossRef] [PubMed]
- Lee, J.S.; Seong, M.; Lee, W.J. Comparison between Two Modalities for Diagnosis of Localized Retinal Nerve Fiber Layer Defect: Ultra-wide field fundus photography versus True-color Confocal Scanning Images. J. Korean Glaucoma Soc. 2021, 10, 63–70. [Google Scholar] [CrossRef]
- Shibata, N.; Tanito, M.; Mitsuhashi, K.; Fujino, Y.; Matsuura, M.; Murata, H.; Asaoka, R. Development of a deep residual learning algorithm to screen for glaucoma from fundus photography. Sci. Rep. 2018, 8, 14665. [Google Scholar] [CrossRef] [PubMed] [Green Version]
- Raghavendra, U.; Fujita, H.; Bhandary, S.V.; Gudigar, A.; Tan, J.H.; Acharya, U.R. Deep convolution neural network for accurate diagnosis of glaucoma using digital fundus images. Inf. Sci. 2018, 441, 41–49. [Google Scholar] [CrossRef]
- Kim, K.E.; Kim, J.M.; Song, J.E.; Kee, C.; Han, J.C.; Hyun, S.H. Development and Validation of a Deep Learning System for Diagnosing Glaucoma Using Optical Coherence Tomography. J. Clin. Med. 2020, 9, 2167. [Google Scholar] [CrossRef] [PubMed]
- Ahn, J.M.; Kim, S.; Ahn, K.-S.; Cho, S.-H.; Lee, K.B.; Kim, U.S. A deep learning model for the detection of both advanced and early glaucoma using fundus photography. PLoS ONE 2018, 13, e0207982. [Google Scholar] [CrossRef] [Green Version]
- Wang, H.; Hu, J.; Zhang, J. SCRD-Net: A Deep Convolutional Neural Network Model for Glaucoma Detection in Retina Tomography. Complexity 2021, 2021, 9858343. [Google Scholar] [CrossRef]
- Liu, H.; Li, L.; Wormstone, I.M.; Qiao, C.; Zhang, C.; Liu, P.; Li, S.; Wang, H.; Mou, D.; Pang, R.; et al. Development and Validation of a Deep Learning System to Detect Glaucomatous Optic Neuropathy Using Fundus Photographs. JAMA Ophthalmol. 2019, 137, 1353–1360. [Google Scholar] [CrossRef]
- Christopher, M.; Belghith, A.; Bowd, C.; Proudfoot, J.A.; Goldbaum, M.H.; Weinreb, R.N.; Girkin, C.A.; Liebmann, J.M.; Zangwill, L.M. Performance of Deep Learning Architectures and Transfer Learning for Detecting Glaucomatous Optic Neuropathy in Fundus Photographs. Sci. Rep. 2018, 8, 16685. [Google Scholar] [CrossRef] [Green Version]
- Fu, H.; Cheng, J.; Xu, Y.; Zhang, C.; Wong, D.W.K.; Liu, J.; Cao, X. Disc-Aware Ensemble Network for Glaucoma Screening From Fundus Image. IEEE Trans. Med. Imaging 2018, 37, 2493–2501. [Google Scholar] [CrossRef] [Green Version]
- Phene, S.; Dunn, R.C.; Hammel, N.; Liu, Y.; Krause, J.; Kitade, N.; Schaekermann, M.; Sayres, R.; Wu, D.J.; Bora, A.; et al. Deep Learning and Glaucoma Specialists: The Relative Importance of Optic Disc Features to Predict Glaucoma Referral in Fundus Photographs. Ophthalmology 2019, 126, 1627–1639. [Google Scholar] [CrossRef] [PubMed] [Green Version]
- Li, F.; Yan, L.; Wang, Y.; Shi, J.; Chen, H.; Zhang, X.; Jiang, M.; Wu, Z.; Zhou, K. Deep learning-based automated detection of glaucomatous optic neuropathy on color fundus photographs. Graefes Arch. Clin. Exp. Ophthalmol. 2020, 258, 851–867. [Google Scholar] [CrossRef] [PubMed]
- Hemelings, R.; Elen, B.; Barbosa-Breda, J.; Lemmens, S.; Meire, M.; Pourjavan, S.; Vandewalle, E.; Van de Veire, S.; Blaschko, M.B.; De Boever, P.; et al. Accurate prediction of glaucoma from colour fundus images with a convolutional neural network that relies on active and transfer learning. Acta Ophthalmol. 2020, 98, e94–e100. [Google Scholar] [CrossRef]
- Hemelings, R.; Elen, B.; Barbosa-Breda, J.; Blaschko, M.B.; De Boever, P.; Stalmans, I. Deep learning on fundus images detects glaucoma beyond the optic disc. Sci. Rep. 2021, 11, 20313. [Google Scholar] [CrossRef] [PubMed]
- Li, L.; Xu, M.; Liu, H.; Li, Y.; Wang, X.; Jiang, L.; Wang, Z.; Fan, X.; Wang, N. A Large-Scale Database and a CNN Model for Attention-Based Glaucoma Detection. IEEE Trans. Med. Imaging 2020, 39, 413–424. [Google Scholar] [CrossRef]
- Ajitha, S.; Akkara, J.D.; Judy, M. Identification of glaucoma from fundus images using deep learning techniques. Indian J. Ophthalmol. 2021, 69, 2702–2709. [Google Scholar]
- Shin, Y.; Cho, H.; Jeong, H.C.; Seong, M.; Choi, J.W.; Lee, W.J. Deep Learning-based Diagnosis of Glaucoma Using Wide-field Optical Coherence Tomography Images. J. Glaucoma 2021, 30, 803–812. [Google Scholar] [CrossRef]
- Muhammad, H.; Fuchs, T.J.; De Cuir, N.; De Moraes, C.G.; Blumberg, D.M.; Liebmann, J.M.; Ritch, R.; Hood, D.C. Hybrid Deep Learning on Single Wide-field Optical Coherence tomography Scans Accurately Classifies Glaucoma Suspects. J. Glaucoma 2017, 26, 1086–1094. [Google Scholar] [CrossRef]
- Shin, J.; Kim, S.; Kim, J.; Park, K. Visual Field Inference From Optical Coherence Tomography Using Deep Learning Algorithms: A Comparison Between Devices. Transl. Vis. Sci. Technol. 2021, 10, 4. [Google Scholar] [CrossRef]
- Kim, M.J.; Lee, J.H.; Park, J.I.; Choi, J.Y.; Sohn, J.; Hwang, H.S.; Hwang, D.D. Novel utilisation of ultrawide-field fundus photography for detecting retinal nerve fibre layer defects in glaucomatous eyes. Br. J. Ophthalmol. 2021. [Google Scholar] [CrossRef]
- Li, Z.; Guo, C.; Lin, D.; Nie, D.; Zhu, Y.; Chen, C.; Zhao, L.; Wang, J.; Zhang, X.; Dongye, M.; et al. Deep learning for automated glaucomatous optic neuropathy detection from ultra-widefield fundus images. Br. J. Ophthalmol. 2021, 105, 1548–1554. [Google Scholar] [CrossRef]
- Ohsugi, H.; Tabuchi, H.; Enno, H.; Ishitobi, N. Accuracy of deep learning, a machine-learning technology, using ultra–wide-field fundus ophthalmoscopy for detecting rhegmatogenous retinal detachment. Sci. Rep. 2017, 7, 9425. [Google Scholar] [CrossRef] [PubMed]
- Tang, F.; Luenam, P.; Ran, A.R.; Quadeer, A.A.; Raman, R.; Sen, P.; Khan, R.; Giridhar, A.; Haridas, S.; Iglicki, M.; et al. Detection of Diabetic Retinopathy from Ultra-Widefield Scanning Laser Ophthalmoscope Images: A Multicenter Deep Learning Analysis. Ophthalmol. Retina 2021, 5, 1097–1106. [Google Scholar] [CrossRef] [PubMed]
- Antaki, F.; Coussa, R.G.; Kahwati, G.; Hammamji, K.; Sebag, M.; Duval, R. Accuracy of automated machine learning in classifying retinal pathologies from ultra-widefield pseudocolour fundus images. Br. J. Ophthalmol. 2021. [Google Scholar] [CrossRef] [PubMed]
- Olvera-Barrios, A.; Heeren, T.F.; Balaskas, K.; Chambers, R.; Bolter, L.; Tufail, A.; Egan, C.; Anderson, J. Comparison of true-colour wide-field confocal scanner imaging with standard fundus photography for diabetic retinopathy screening. Br. J. Ophthalmol. 2020, 104, 1579–1584. [Google Scholar] [CrossRef] [PubMed]
- Olvera-Barrios, A.; Heeren, T.F.; Balaskas, K.; Chambers, R.; Bolter, L.; Egan, C.; Tufail, A.; Anderson, J. Diagnostic accuracy of diabetic retinopathy grading by an artificial intelligence-enabled algorithm compared with a human standard for wide-field true-colour confocal scanning and standard digital retinal images. Br. J. Ophthalmol. 2021, 105, 265–270. [Google Scholar] [CrossRef]
- Sarao, V.; Veritti, D.; Lanzetta, P. Automated diabetic retinopathy detection with two different retinal imaging devices using artificial intelligence: A comparison study. Graefes Arch. Clin. Exp. Ophthalmol. 2020, 258, 2647–2654. [Google Scholar] [CrossRef]
- Anderson, D.; Patella, V. Automated Static Perimetry, 2nd ed.; Mosby: St. Louis, MI, USA, 1999. [Google Scholar]
- Paszke, A.; Gross, S.; Chintala, S.; Chanan, G.; Yang, E.; DeVito, Z.; Lin, Z.; Desmaison, A.; Antiga, L.; Lerer, A. Automatic differentiation in pytorch. In Proceedings of the NIPS 2017 Autodiff Workshop 2017, Long Beach, CA, USA, 4–9 December 2017. [Google Scholar]
- Simonyan, K.; Zisserman, A. Very deep convolutional networks for large-scale image recognition. arXiv 2014, arXiv:1409.1556. [Google Scholar]
- Krizhevsky, A.; Sutskever, I.; Hinton, G.E. Imagenet classification with deep convolutional neural networks. Adv. Neural Inf. Process. Syst. 2012, 25, 1097–1105. [Google Scholar] [CrossRef]
- He, K.; Zhang, X.; Ren, S.; Sun, J. Deep residual learning for image recognition. In Proceedings of the IEEE Conference on Computer Vision and Pattern Recognition, Las Vegas, NV, USA, 27–30 June 2016; pp. 770–778. [Google Scholar]
- Kim, Y.J.; Na, K.I.; Lim, H.W.; Seong, M.; Lee, W.J. Combined wide-field optical coherence tomography angiography density map for high myopic glaucoma detection. Sci. Rep. 2021, 11, 22034. [Google Scholar] [CrossRef]
- Kim, H.; Park, H.M.; Jeong, H.C.; Moon, S.Y.; Cho, H.; Lim, H.W.; Seong, M.; Park, J.; Lee, W.J. Wide-field optical coherence tomography deviation map for early glaucoma detection. Br. J. Ophthalmol. 2021. [Google Scholar] [CrossRef] [PubMed]

| Overall | Training | Test | p-Value | |||||||
|---|---|---|---|---|---|---|---|---|---|---|
| Overall | Normal | Glaucoma | Overall | Normal | Glaucoma | Overall | Normal | Glaucoma | ||
| N | 777 | 274 (35.3%) | 503 (64.7%) | 545 | 192 (35.2%) | 353 (64.8%) | 232 | 82 (35.3%) | 150 (64.7%) | 0.975 |
| Sex (M) | 417 (53.7%) | 142 (51.8%) | 275 (54.7%) | 302 (55.4%) | 103 (53.6%) | 199 (56.4%) | 115 (49.6%) | 39 (47.6%) | 76 (50.7%) | 0.135 |
| Age (year) | 58.4 ± 15.8 | 53.3 ± 16.1 | 61.2 ± 14.9 | 58.2 ± 16.0 | 53.2 ± 16.7 | 60.8 ± 15.0 | 59.0 ± 15.3 | 53.6 ± 14.9 | 61.9 ± 14.8 | 0.516 |
| SE (dioptre) | −1.49 ± 2.66 | −1.43 ± 2.77 | −1.52 ± 2.61 | −1.58 ± 2.73 | −1.69 ± 2.96 | −1.52 ± 2.61 | −1.29 ± 2.48 | −0.87 ± 2.19 | −1.52 ± 2.61 | 0.172 |
| AXL (mm) | 24.74 ± 1.75 | 24.71 ± 1.79 | 24.75 ± 1.73 | 24.78 ± 1.84 | 24.71 ± 1.86 | 24.81 ± 1.83 | 24.64 ± 1.52 | 24.70 ± 1.59 | 24.62 ± 1.50 | 0.526 |
| IOP (mmHg) | 14.9 ± 2.9 | 15.0 ± 3.0 | 14.8 ± 2.9 | 15.0 ± 3.0 | 15.4 ± 3.4 | 15.1 ± 3.4 | 14.6 ± 2.7 | 14.9 ± 2.9 | 14.5 ± 3.3 | 0.131 |
| MD (dB) | −6.0 ± 7.4 | −2.1 ± 2.7 | −7.7 ± 8.1 | −5.8 ± 7.2 | −2.1 ± 2.0 | −7.3 ± 8.0 | −6.6 ± 7.9 | −2.0 ± 208 | −8.6 ± 8.3 | 0.180 |
| VFI (%) | 84.9 ± 23.1 | 97.0 ± 5.0 | 79.9 ± 25.6 | 85.6 ± 22.4 | 97.3 ± 3.0 | 80.8 ± 24.9 | 83.3 ± 24.5 | 96.5 ± 7.7 | 77.7 ± 27.0 | 0.241 |
| RNFL (µm) | 84.6 ± 21.4 | 103.0 ± 12.0 | 74.6 ± 18.6 | 84.7 ± 21.7 | 103.2 ± 12.9 | 74.6 ± 18.6 | 84.5 ± 20.9 | 102.4 ± 9.8 | 74.7 ± 18.8 | 0.899 |
| GCIPL (µm) | 61.9 ± 9.7 | 69.9 ± 5.5 | 57.6 ± 8.7 | 61.9 ± 10.1 | 70.1 ± 5.9 | 57.4 ± 9.1 | 61.9 ± 8.7 | 69.3 ± 4.6 | 57.9 ± 7.7 | 0.983 |
| GCC (µm) | 94.9 ± 14.4 | 107.3 ± 7.4 | 88.1 ± 12.7 | 95.0 ± 15.0 | 108.1 ± 7.4 | 87.8 ± 13.2 | 94.6 ± 13.0 | 105.3 ± 7.1 | 88.8 ± 11.7 | 0.753 |
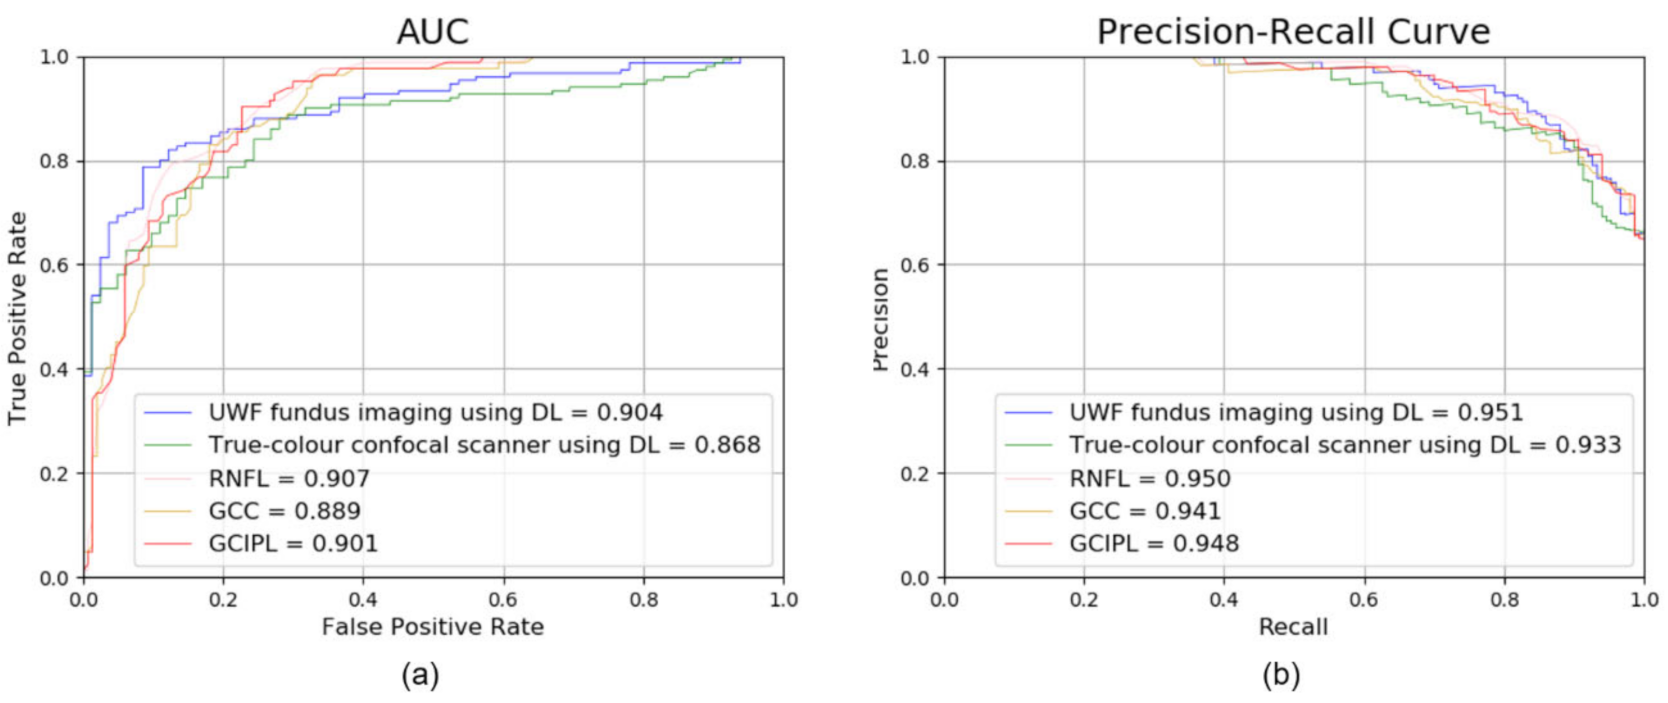
| Accuracy (%) | AUC (95% CI) | |
|---|---|---|
| UWF fundus imaging using DL | 83.62 | 0.904 (0.861–0.937) |
| True-colour confocal scanner using DL | 81.46 | 0.868 (0.824–0.912) |
| RNFL | 84.40 | 0.907 (0.871–0.947) |
| GCIPL | 80.60 | 0.901 (0.862–0.941) |
| GCC | 81.45 | 0.889 (0.850–0.933) |
| UWF Fundus Imaging Using DL | True-Colour Confocal Scanner Using DL | RNFL | GCIPL | GCC | |
|---|---|---|---|---|---|
| UWF fundus imaging using DL | NA | 0.135 | 0.759 | 0.998 | 0.645 |
| True-colour confocal scanner using DL | 0.360 | NA | 0.077 | 0.215 | 0.421 |
| RNFL | 0.003 | 0.039 | NA | 0.683 | 0.324 |
| GCIPL | 0.003 | 0.033 | 0.006 | NA | 0.274 |
| GCC | 0.001 | 0.021 | 0.018 | 0.012 | NA |
Publisher’s Note: MDPI stays neutral with regard to jurisdictional claims in published maps and institutional affiliations. |
© 2022 by the authors. Licensee MDPI, Basel, Switzerland. This article is an open access article distributed under the terms and conditions of the Creative Commons Attribution (CC BY) license (https://creativecommons.org/licenses/by/4.0/).
Share and Cite
Shin, Y.; Cho, H.; Shin, Y.U.; Seong, M.; Choi, J.W.; Lee, W.J. Comparison between Deep-Learning-Based Ultra-Wide-Field Fundus Imaging and True-Colour Confocal Scanning for Diagnosing Glaucoma. J. Clin. Med. 2022, 11, 3168. https://doi.org/10.3390/jcm11113168
Shin Y, Cho H, Shin YU, Seong M, Choi JW, Lee WJ. Comparison between Deep-Learning-Based Ultra-Wide-Field Fundus Imaging and True-Colour Confocal Scanning for Diagnosing Glaucoma. Journal of Clinical Medicine. 2022; 11(11):3168. https://doi.org/10.3390/jcm11113168
Chicago/Turabian StyleShin, Younji, Hyunsoo Cho, Yong Un Shin, Mincheol Seong, Jun Won Choi, and Won June Lee. 2022. "Comparison between Deep-Learning-Based Ultra-Wide-Field Fundus Imaging and True-Colour Confocal Scanning for Diagnosing Glaucoma" Journal of Clinical Medicine 11, no. 11: 3168. https://doi.org/10.3390/jcm11113168
APA StyleShin, Y., Cho, H., Shin, Y. U., Seong, M., Choi, J. W., & Lee, W. J. (2022). Comparison between Deep-Learning-Based Ultra-Wide-Field Fundus Imaging and True-Colour Confocal Scanning for Diagnosing Glaucoma. Journal of Clinical Medicine, 11(11), 3168. https://doi.org/10.3390/jcm11113168