Article

Real-Time Brain Monitoring by Near-Infrared Spectroscopy Predicts Neurological Outcome after Cardiac Arrest and Resuscitation in Rats: A Proof of Concept Study of a Novel Prognostic Measure after Cardiac Arrest

1
Feinstein Institutes for Medical Research, Northwell Health, Manhasset, NY 11030, USA
2
Department of Emergency Medicine, North Shore University Hospital, Northwell Health System, Manhasset, NY 11030, USA
3
Department of Traumatology and Acute Critical Medicine, Graduate School of Medicine, Osaka University, Osaka 565-0871, Japan
4
Zucker School of Medicine at Hofstra/Northwell, Hempstead, NY 11549, USA
5
Department of Surgery, North Shore University Hospital, Northwell Health, Manhasset, NY 11030, USA
*
Author to whom correspondence should be addressed.
J. Clin. Med. 2022, 11(1), 131; https://doi.org/10.3390/jcm11010131
Submission received: 25 November 2021 / Revised: 21 December 2021 / Accepted: 23 December 2021 / Published: 27 December 2021
(This article belongs to the Special Issue New Therapies for Post-cardiac Arrest Syndrome)

Abstract

:
Clinical studies have demonstrated that dynamic changes in regional cerebral oxygen saturation (rSO2) after cardiac arrest (CA) and cardiopulmonary resuscitation (CPR) have a role in predicting neurological outcomes after the return of spontaneous circulation (ROSC). Our study evaluated whether the timing of rSO2 decline shortly after CPR reflects the severity of brain injury in a rat model of CA. Rats were subjected to different durations of asphyxia to produce variable severities of brain injury, due to CA. Time from ROSC to achieving the initial minimum rSO2 was defined as Tnadir. A Tnadir cut-off of 24 min had optimal sensitivity and specificity for predicting good neurological outcomes at 72 h after ROSC (AUC, 0.88; sensitivity, 89%; specificity, 86%; p < 0.01). Immunohistochemistry at 72 h post-CA revealed that the number of Fluoro-Jade B positive degenerating neurons in the hippocampus CA1 sector were markedly higher in animals with Tnadir > 24 min than that in animals with Tnadir ≤ 24 min. There was no difference in the gene expressions of cytokines and mitochondrial fission proteins in the brain at 2 h after ROSC between rats with Tnadir > 24 min and with Tnadir ≤ 24 min. In conclusion, Tnadir can be a novel predictor of good neurological outcomes after CA/CPR.

1. Introduction

Sudden cardiac arrest (CA) is a major public health problem globally, which accounts for over 355,000 emergency medical, service-assessed, out-of-hospital cardiac arrest (OHCA) cases in the United States [1]. Although several studies have reported the trend of improved survival rates and favorable neurological outcomes in patients with OHCA who received cardiopulmonary resuscitation (CPR) [1,2,3], the global rate of hospital discharge, with intact neurocognitive function among these patients is still low [2,4]. Adopting more effective methods of real-time brain monitoring may improve cognitive outcomes after return of spontaneous circulation (ROSC) [5] and optimize therapeutic interventions; however, no timely and reliable single prognostication marker is available for patients who remain comatose after CA/CPR [6].
Recently, regional cerebral oxygen saturation (rSO2), measured using near-infrared spectroscopy (NIRS), has emerged as a monitoring system for predicting the probability of ROSC and/or favorable neurological outcomes after successful CPR [7,8,9]. More recent studies have suggested that dynamic assessments of rSO2, obtained throughout resuscitation, are more appropriate than single-time assessments for predicting the outcomes in patients with OHCA [9,10,11,12,13]. Although the role of temporal changes in rSO2 shortly after ROSC in the neurological prognosis remains undetermined, some clinical studies have reported that rSO2 shortly after ROSC shows a biphasic pattern, such that lower rSO2 shortly post-ROSC is associated with favorable neurological outcomes [12,14]. These observations suggest that the duration in which rSO2 reaches the initial lowest value (“nadir”) may reflect the duration in which brain activity and oxygen metabolism would resume after ROSC. However, the prognostic implication of temporal changes in rSO2 after ROSC, that can be measured in a timely and non-invasive manner, is unclear and remains to be investigated.
Therefore, in the present study, we elucidated the role of temporal changes in rSO2, shortly after ROSC, in: (1) assessing the severity of brain damage and (2) CA-related pathophysiological changes, as well as (3) predicting neurological outcomes after CA/CPR in rats.

2. Materials and Methods

2.1. Experimental Animals

Adult male Sprague-Dawley rats (435 ± 26.7 g, 12–16 weeks old; Charles River Laboratories, Wilmington, MA, USA) were used in this study. All experiments were performed in accordance with the National Institutes of Health guidelines for the use of experimental animals. The animals were housed in a rodent facility, under a 12:12-h light:dark cycle, and had free access to food and water.
After being anesthetized with 4% isoflurane, the animals were intubated with a 14-gauge plastic catheter (Surflo, Terumo Medical Corporation, Somerset, NJ, USA), mechanically ventilated, and then surgically prepared under anesthesia (2% isoflurane), as described previously [15]. End-tidal carbon dioxide was maintained at 40 ± 5 mmHg during the experiment, due to the adjustment of respiratory rate (RR) and tidal volume (TV). These settings were adjusted, within the range of 35–50 per min of RR and 3.0–5.0 mL of TV. Microcatheters (PE-50, Becton Dickinson, Franklin Lakes, NJ, USA) were inserted into the left femoral artery and the left femoral vein for monitoring blood pressure and drug administration, respectively. After cannulation, heparin (300 U) was injected via the femoral vein. A customized brain oximeter was attached to the rats’ bare heads, to monitoring rSO2 for 2 h during the experimental period. Esophageal temperature was maintained at 36.5 ± 0.5 °C, using a thermostatically regulated heating pad and heating lamp during the experiment. Blood pressure and needle-probe electrocardiogram monitoring data were recorded and analyzed using a personal computer-based data acquisition system.

2.2. Monitoring by Near-Infrared Spectroscopy

A brain oximeter, TOS-QQ® (TOSTEC, CO., Tokyo, Japan), was used in this study. This device measures oxygen saturation in the brain every second, based on the Beer–Lambert law, using two different wavelengths of near-infrared LED light, i.e., 770 nm and 870 nm, which are the wavelengths specific for the absorbance of deoxyhemoglobin and oxyhemoglobin, respectively [13]. As the source–detector distance is 10 mm, near-infrared LED light is estimated to pass through the skin to a depth of approximately 7–8 mm, suggesting that it can measure the maximum depth of the hippocampus in rats.

2.3. Definition of Tnadir as a Predictive Marker for Neurological Outcome after CA/CPR

Using the rSO2 data extracted every 1 min, we measured the duration from ROSC to the time point at which rSO2 reached the first and lowest value after ROSC, which was predefined as Tnadir, based on our pilot study. Our pilot study, using a rat model of asphyxia-induced CA for 6–12 min, found that rSO2 always increased quickly and achieved the highest value within 15 min after ROSC, following which, it decreased gradually within approximately 15–60 min, according to the individual’s condition. Moreover, from the clinical viewpoint, we consider that Tnadir should be determined in real time. Taken together, the first and lowest rSO2 value after ROSC were determined, if the following conditions were met: (1) rSO2 decreased by more than 3% from the highest rSO2 shortly after ROSC, and (2) rSO2 increased by more than 1%, or remained unchanged for a continuous 3 min. According to the criteria, we defined the duration from ROSC to the time point at which rSO2 achieved the first and lowest value as Tnadir.

2.4. Study Design

Rats were subjected to different durations of asphyxia to produce variable severities of brain injury due to CA. Four separate protocols were used in this study (Figure 1).
In Experiment 1, to test the hypothesis that a longer CA duration results in a longer cerebral electrical recovery latency post-ROSC, electroencephalography (EEG) was monitored in rats subjected to 6 or 12 min CA (n = 5 per group).
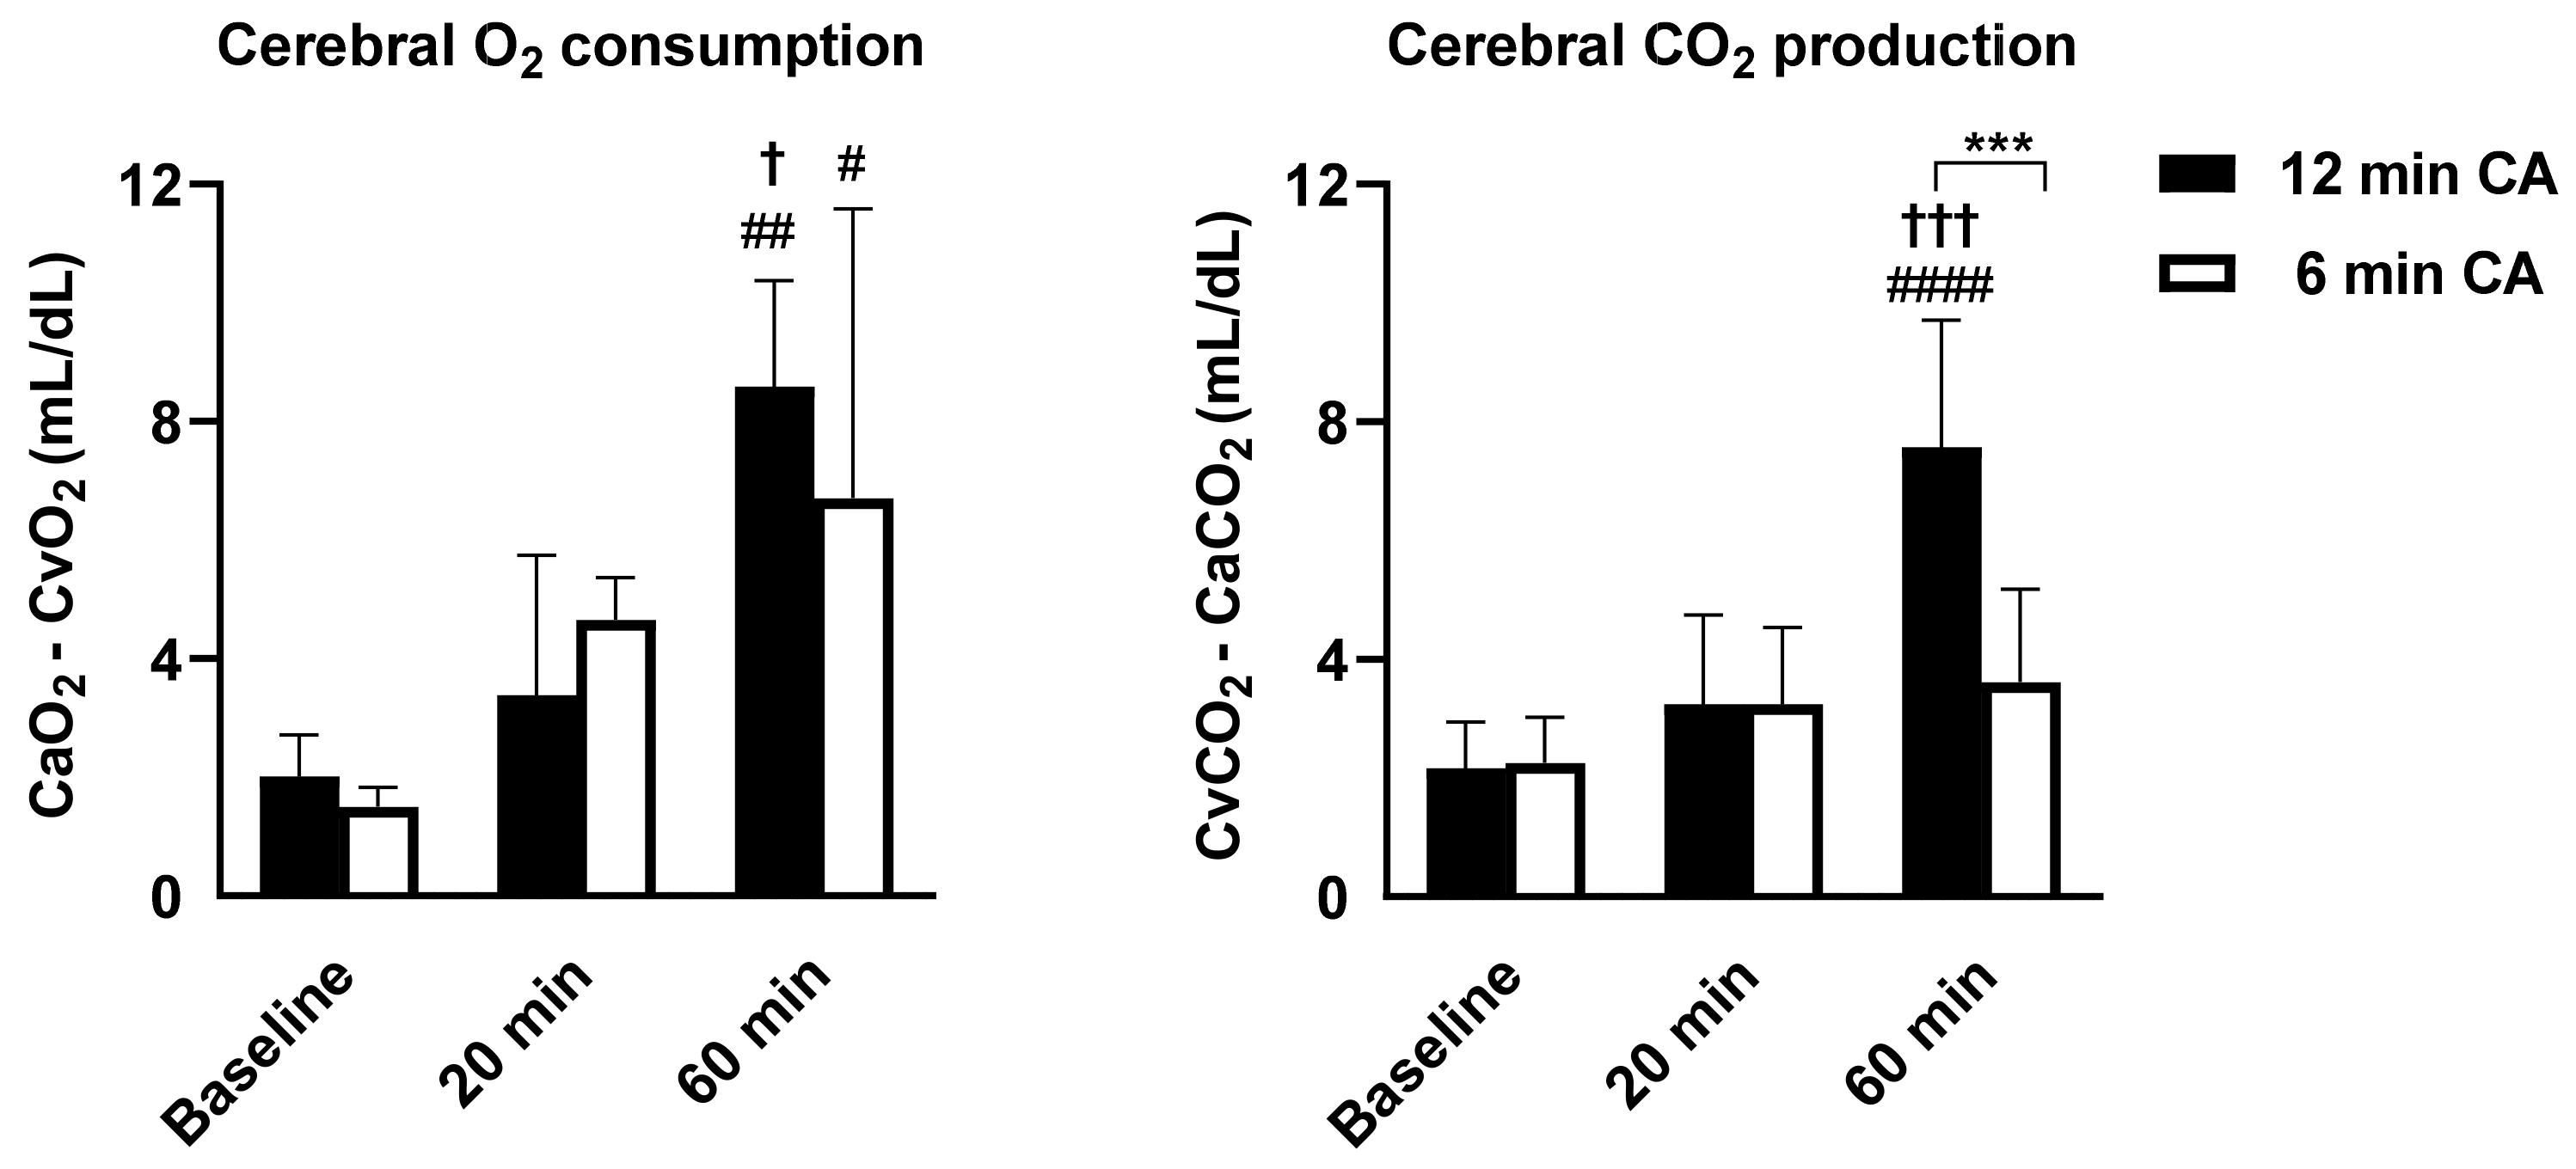
In Experiment 2, to test if CA duration is related to cerebral oxygen metabolism post-ROSC, we measured the oxygen/carbon dioxide levels by using the arterial and venous blood gas analyses in rats subjected to 6 or 12 min CA (n = 5 per group).
In Experiment 3, we aimed to assess the association of Tnadir with neurofunctional status at 72 h after CA/CPR. Rats were subjected to 6, 9, or 12 min of CA, to induce various types of brain damages after CA/CPR, as previously reported [16]. To minimize variability, we assigned animals to 6, 9, or 12 min of CA, on the basis of similar weight, age, and, when possible, delivery date (n = 10 per group). Using rats survived for 72 h, the brains were obtained and used for immunohistochemistry.
In Experiment 4, to determine the mechanisms associated with the predictive role of Tnadir, we assessed the association of Tnadir with mRNA levels of genes encoding proinflammatory cytokines and mitochondrial fission-related proteins in the brains of animals at 2 h post-ROSC.

2.5. Rat Model of Asphyxial CA and CPR

Cardiac arrest and CPR in rats were performed, as previously described, with minor modifications [15,17,18]. Briefly, prior to the induction of asphyxial CA, animals were mechanically ventilated, with a fraction of inspired O2 (FIO2) of 0.25, and anesthesia was maintained with 2% isoflurane during surgical procedures. Asphyxia was induced by intravenous vecuronium bromide (2 mg/kg), followed by switching off the ventilator, and discontinuation of isoflurane. Cardiac arrest was defined by a mean arterial pressure below 20 mmHg. After asphyxia and CA, mechanical ventilation was restarted at an FIO2 of 1.0, and manual chest compressions were performed at a rate of 240–300 per min. The investigator who provided finger–chest compressions was not blinded to the experimental groups. At 30 s, after the beginning of chest compressions, a 20 μg/kg bolus of epinephrine was administered, and chest compressions were continued. ROSC was defined as the return of supraventricular rhythm, with a mean arterial pressure > 60 mmHg. Animals were mechanically ventilated with an FIO2 of 1.0 for the first 105 min after ROSC. Thereafter, FIO2 was gradually reduced to 0.6, 0.3, and 0.25 at 110, 115, and 120 min, respectively, followed by disconnection from mechanical ventilator and extubation. Arterial blood pressure, rSO2, electrocardiogram recordings, and esophageal temperature were monitored for 2 h. No inotropic agent was administered. After a recovery period of 2 h, the animals were weaned from the ventilator, all vascular catheters and tracheal tubes were removed, and surgical wounds were sutured. For the survival study (Experiment 3), animals were returned to their cages, with easily accessible food and water, and observed in a rodent facility, with a controlled room temperature of 22 °C. Buprenorphine (0.02 mg/kg) was injected subcutaneously daily to relieve the animals from pain, due to surgery, during the recovery period. The survival time after CA/CPR was recorded up to 72 h. Sham-operated rats were administered with anesthesia, underwent surgery, and received ventilation, but no CA.

2.6. Electroencephalography Monitoring

In Experiment 1, EEG after ROSC was monitored, as reported previously [19]. Briefly, before intubation and cannulation procedures, animals underwent implantation of EEG electrodes bilaterally under isoflurane, using a stereotaxic apparatus (Stoelting, Chicago, IL, USA). Each animal had five screw electrodes (Plastics One, Roanoke, VA, USA) cortically implanted 2 mm lateral and 2 mm anterior or posterior to the bregma. In addition, a ground electrode was placed at 3 mm lateral on the right and 9 mm anterior to the bregma in the midline. EEGs were recorded using an Intan RHS Stim/Recording 16 channel recording controller (Intan Technologies, Los Angeles, CA, USA) during the baseline, asphyxial CA, resuscitation, and after ROSC. Raw EEG signals were used to determine the electrical activity. In addition, the durations between ROSC and onset of both EEG amplitude activity (defined as >5% of the basal value with no EEG activity), as well as continuous background EEG as markers of brain’s electrical recovery after CA/CPR, were also recorded [20]. Continuous background EEG activity was defended as continuous EEG activity/burst without low amplitude activity (suppression, <10 µV). EEG analysis was performed offline using MATLAB 7.0 (MathWorks, Inc., Natick, MA, USA) after the experiment was completed.

2.7. Assessment of Oxygen Consumption and Carbon Dioxide Production in the Brain

In Experiment 2, the right jugular vein and right carotid artery were cannulated (PE-50) for blood collection, and blood gases were analyzed at baseline, 20 min, and 60 min after ROSC, in rats subjected 6 or 12 min CA (n = 5 per group). Cerebral O2 consumption was calculated as the difference between O2 content of the carotid artery (CaO2) and jugular vein (CjvO2): CaO2 − CjvO2 = (1.36 × Hemoglobin (g/dL) × (arterial venous oxygen saturation (SaO2] − jugular bulb venous oxygen saturation (SjvO2])/100) + (arterial oxygen tension (PaO2) − jugular bulb venous oxygen tension (PjvO2]) × 0.0031 [21,22]. Cerebral CO2 production was calculated as the difference between CO2 content of the jugular vein (CjvCO2) and carotid artery (CaCO2). The difference in CO2 content was calculated using the McHardy equation: CjvCO2 − CaCO2 = 11.02 ((PjvCO2) 0.396 − (PaCO2) 0.396) − (15 − Hb) 0.015 × (PjvCO2 − PaCO2) − (95−SaO2) × 0.064 [23].

2.8. Assessment of Neurological Function

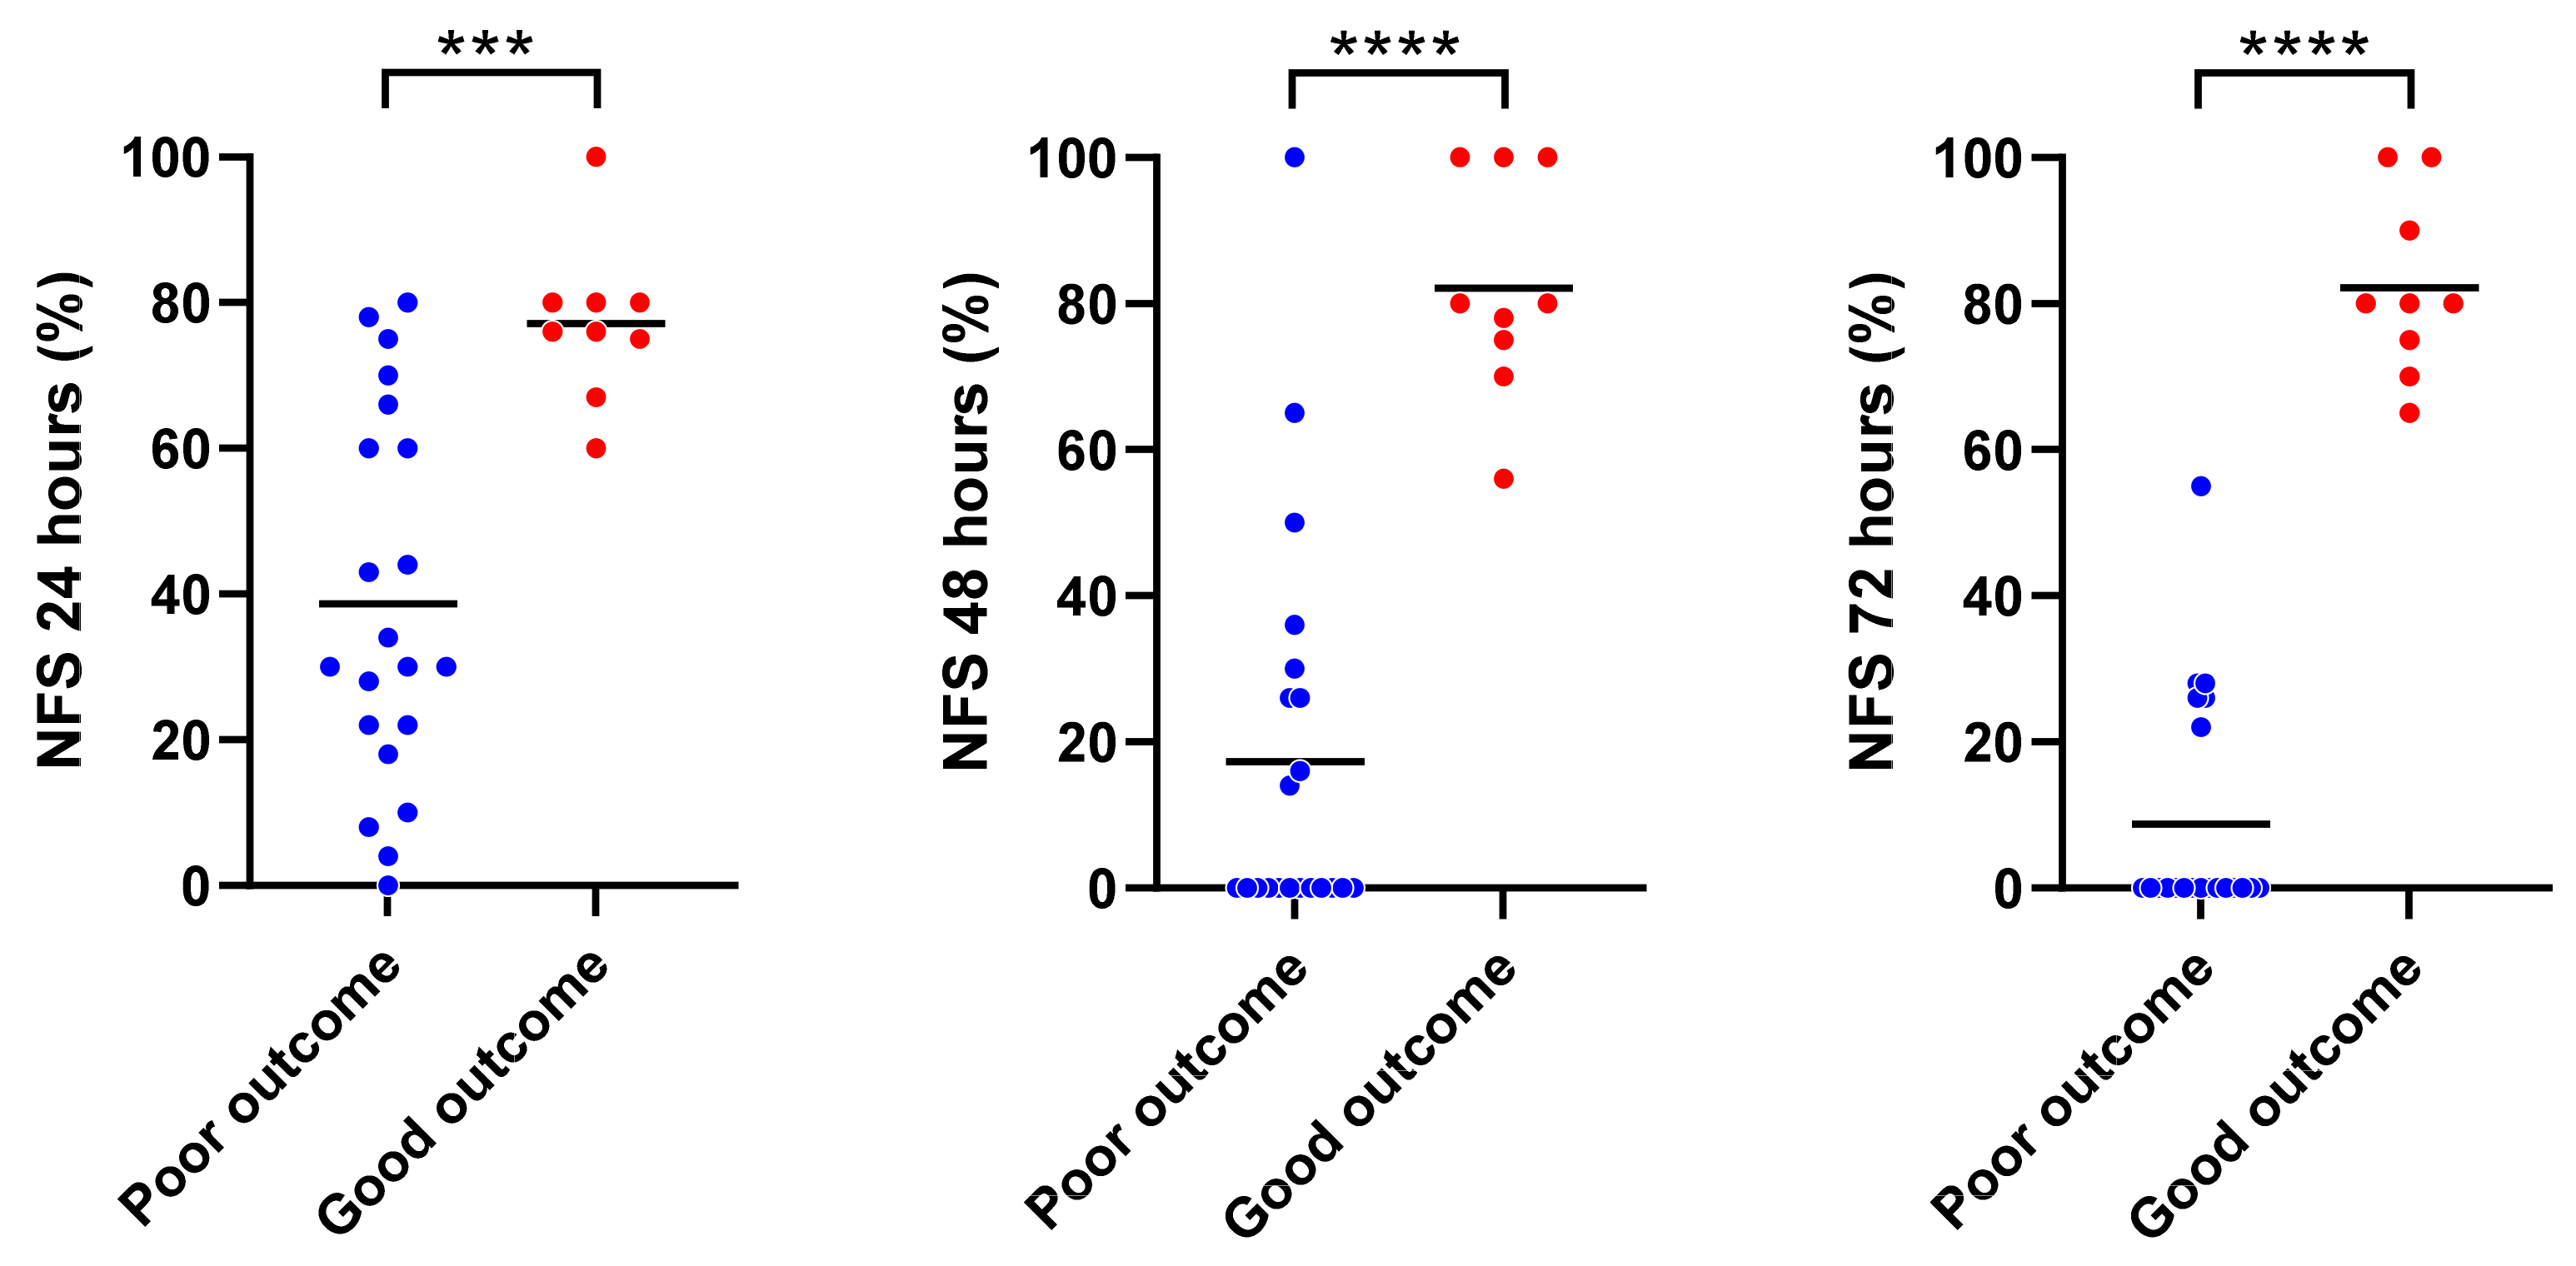
For the survival study (Experiment 3), neurological function score (NFS) was evaluated daily after CA/CPR by an investigator blinded to the experimental groups, using a previously reported neurofunctional scoring system with minor modification [24]. Specifically, original scoring system provided the percentage of the deficit score, but we showed the percentage of total score. Eventually, dead or brain-dead rats were scored at 0 points. The resuscitated animals were classified into binary groups using the NFS cut-off for good (NFS ≥ 60) and poor (NFS < 60) outcomes at 72 h post-ROSC, as previously described [16].

2.9. Measurement of Interleukin (IL)-6 Levels in the Plasma

In Experiment 3, plasma samples were obtained at baseline and 60 min after ROSC. The levels of plasma IL-6 were measured using ELISA kits (Quantikine® ELISA, R&D Systems, Inc., Minneapolis, MN, USA), according to the manufacturer’s instructions.

2.10. Brain Immunohistochemistry

In Experiment 3, brain samples were harvested from rats survived for 72 h. Neuronal degeneration was evaluated using Fluoro-Jade B (FJB) staining, as described previously [25,26]. Briefly, following the 72-h survival in rats subjected to 6–12 min CA, animals were anesthetized with isoflurane, perfused with saline via the left ventricle, and then decapitated. The brains were fixed with 4% paraformaldehyde at 4 °C. Tissues were embedded in OCT Compound (Tissue-Tec, Sakura Finetek USA, Inc., Torrance, CA, USA), frozen in liquid nitrogen, cut serially with 10 µm thickness in a cryostat, and collected on glass slides. Three microscopic fields (at 40× magnification) were selected from the cerebral cortex, hippocampus, and caudoputamen by an investigator who was blinded to the experimental groups. The investigator selected arbitrary points that were considered to show the representative images of the entire area of each brain region. The number of FJB-positive cells was counted by an investigator who was blinded to the experimental groups (n = 6, 4, and 5 for 6, 9, and 12 min CA, respectively). Images were captured using a BZ-X800 fluorescence microscope (Keyence Corporation of America, Elmwood Park, NJ, USA).

2.11. Measurements of Gene Expressions

In Experiment 4, Total RNA was extracted from the whole brain of rats 2 h after CA/CPR in rats subjected to 6–12 min CA, using RNeasy Plus Mini Kit (Qiagen, Hilden, Germany), and cDNA was synthesized using High-Capacity cDNA Reverse Transcription Kit (Thermo Fisher Scientific, Waltham, MA, USA) (n = 11 per group). The mRNA levels of interleukin (IL)-1β, IL-6, tumor necrosis factor (TNF)-α, high mobility group box 1 (HMGB1) protein, dynamin-1-like (Dnm1L) protein, mitochondrial fission 1 (FIS1) protein, mitochondrial elongation factor 1 (MIEF1) protein, and GAPDH were measured in real-time PCR, using the TaqMan assay (Thermo Fisher Scientific). The mRNA expression levels were normalized against the levels of GAPDH mRNA in the same sample. Relative mRNA levels in each sample were evaluated using the ΔΔCT method. Data are presented as fold changes relative to the control group. The assay IDs and primer sequences for each gene are listed in Table S1.

2.12. Statistical Analysis

Continuous variables are presented as means ± standard deviation (SD). An unpaired two tailed Student’s t-test or Mann-Whitney U test was used to compare two independent groups for continuous variables, according to normality. For multiple comparisons, two-way repeated measures analysis of variance (ANOVA), followed by Sidak correction for post-hoc comparisons, was used. Kaplan–Meier analysis and the log-rank test were used to calculate survival rates. Spearman’s correlation coefficients (r) were calculated to evaluate the correlation between Tnadir and neurological outcomes 72 h after ROSC. In Experiment 3, the predictive accuracy of Tnadir was determined by receiver operating characteristic (ROC) curve analysis (specifically, area under the curve [AUC]). ROC curve analyses determined the optimal cutoff value for differentiating between good and poor neurologic outcomes at 72 h after CA/CPR. The AUCs between Tnadir and IL-6 were compared using a paired comparison, originally described by Hanley and McNeil [27]. Differences with two-sided p-value < 0.05 were considered statistically significant. All statistical analyses were performed using GraphPad Prism, version 8.3.0 (GraphPad Software, Inc., San Diego, CA, USA), and JMP Statistical Software, version 14.3.0 (SAS Institute, Cary, NC, USA).

3. Results

This section may be divided by subheadings. It should provide a concise and precise description of the experimental results and their interpretation, as well as the experimental conclusions that can be drawn.

3.1. The Impact of Different CA Durations on Brain Recovery Time and Cerebral Metabolism after ROSC

First, to confirm whether a longer duration of CA affects brain recovery time and cerebral metabolism, we measured electrical activity and cerebral oxygen consumption after CA/CPR in the brain in CA models of two different severities (6 min CA vs. 12 min CA). Animals subjected to 12 min CA had markedly longer duration from ROSC to the onset of both appearance of EEG amplitude activity (12 min CA vs. 6 min CA, 1590 ± 292 s vs. 933 ± 82 s, p = 0.048) and continuous EEG (3295 ± 774 s vs. 1019 ± 105 s, p < 0.0001) (Figure 2). In both 6 min and 12 min CA groups, cerebral O2 consumption at 60 min post-ROSC was significantly higher than that at baseline. While animals subjected to 6 min CA did not exhibit a substantial difference in cerebral CO2 production over time, animals subjected to 12 min CA showed a marked increase in cerebral CO2 production, compared to that at baseline and 20 min post-ROSC (Figure 3). In addition, animals subjected to 12 min CA had markedly larger cerebral CO2 production than animals subjected to 6 min CA (7.57 ± 2.14 mL/dL vs. 3.61 ± 1.57 mL/dL, p = 0.0006). These observations suggest that prolonged CA was associated with both delayed electrical recovery of the brain and greater changes in cerebral oxygen metabolism.

3.2. Tnadir by Real-Time NIRS Monitoring Predicted a Short-Term Neurofunctional Status after CA/CPR

In total, 30 rats were randomly subjected to 6, 9, or 12 min of CA, followed by CPR. There were no significant differences in the baseline characteristics of animals among the three different CA duration groups (Table S2). Survival rates at 72 h after ROSC were 60%, 40%, and 50%, and NFS at 72 h after ROSC were 53 ± 46, 27 ± 35, and 13 ± 14 in 6 min, 9 min, and 12 min CA groups, respectively. To assess the role of Tnadir in predicting neurofunctional status after CA/CPR, we compared Tnadir between post-arrest animals with good neurological outcomes and those with poor neurological outcomes. The baseline characteristics and perioperative parameters of the animals in good and poor neurological outcome groups are shown in Table 1. Significant differences were observed in heart rate and body temperature at baseline, time to cardiac arrest, and heart rate at 20 min after ROSC between the two groups. The survival rate was markedly higher in the good neurological outcome group than in the poor neurological outcome group (100% vs. 28.6%, log-rank p = 0.001). NFS at 24, 48, and 72 h after ROSC in good vs. poor neurological outcome groups are shown in Figure 4. The serial changes in rSO2 within the first 2 h after ROSC in each group are shown in Figure 5. No differences were observed in rSO2 values at any time point over the first 2 h after ROSC between the groups (p = 0.92). The mean Tnadir of all post-arrest animals was 28.7 ± 1.4 min. Survived animals in the good outcome group had markedly shorter Tnadir than those in the poor outcome group (22.2 ± 3.2 min vs. 31.5 ± 7.7 min, p < 0.001, Figure 6A). Furthermore, a significant negative correlation between Tnadir and the NFS 72 h after ROSC (r = −0.48, p = 0.007, Figure 6B) was observed. However, there was no significant correlation between survival time and Tnadir (r = −0.30, p = 0.11).

3.3. Predictive Value of Tnadir on Good Neurological Outcome Was Superior to That of Plasma IL-6 Level at 1 h after ROSC

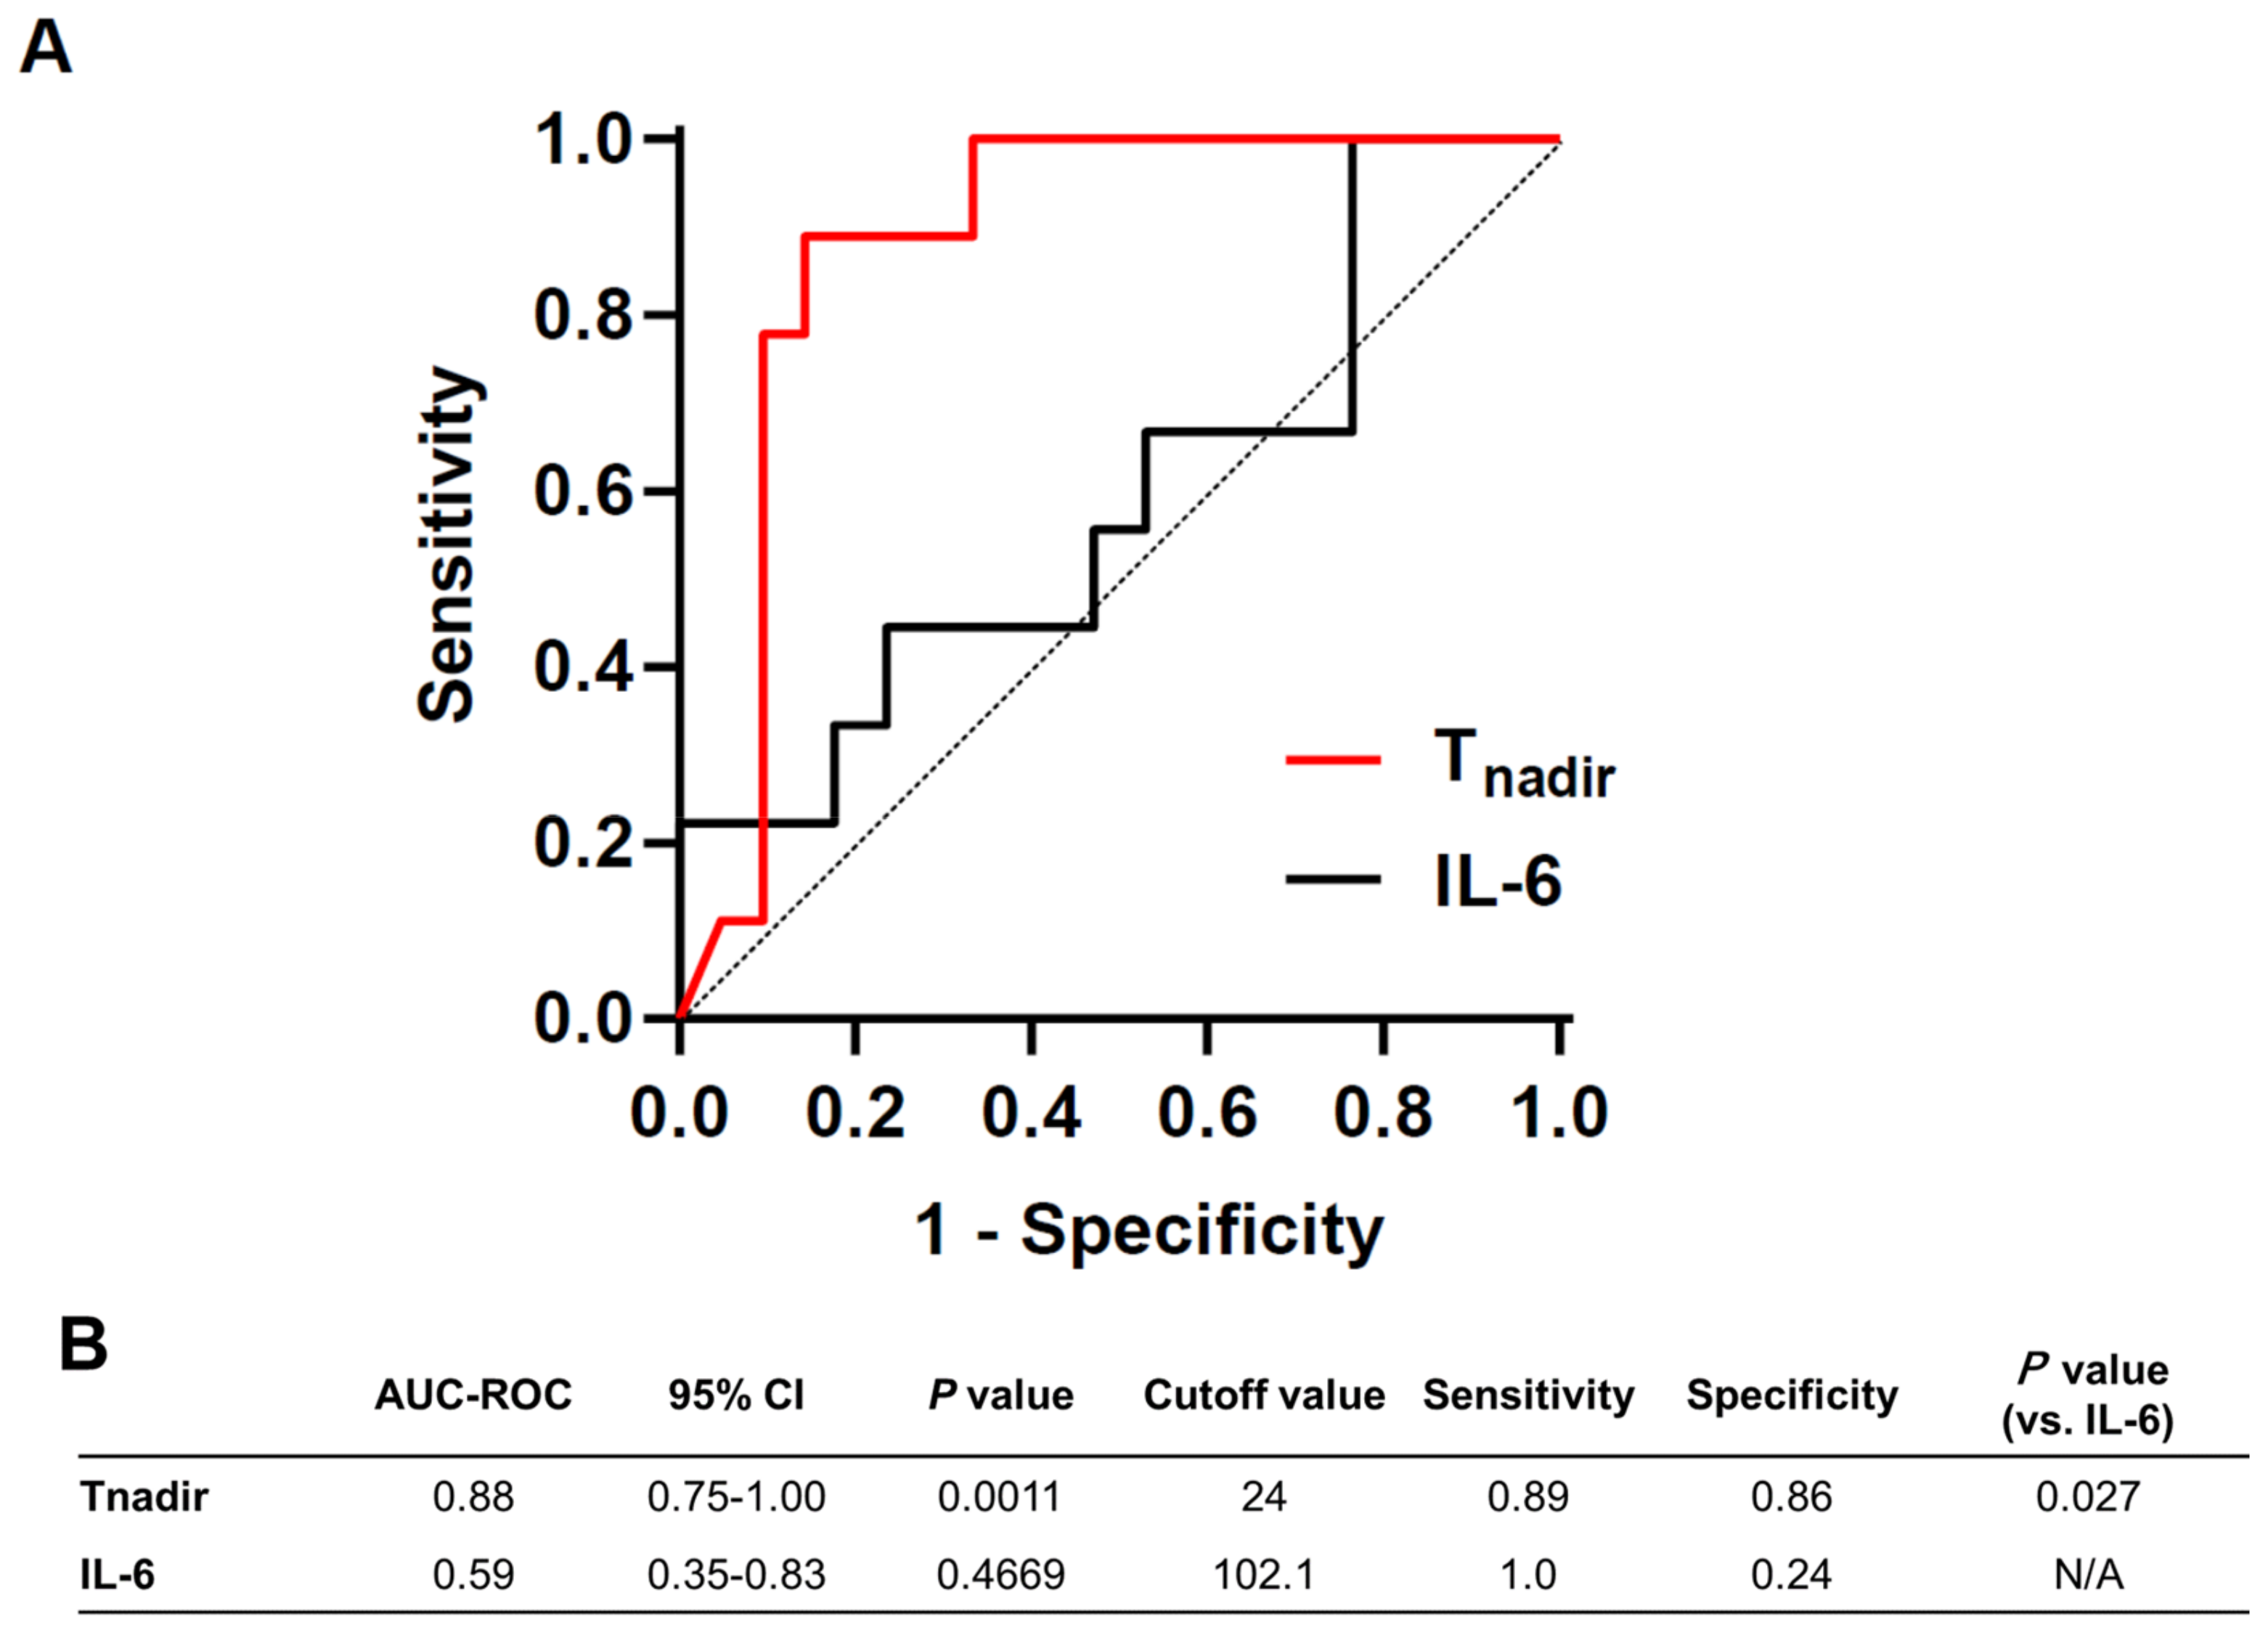
Since plasma IL-6 levels after ROSC have been shown to be independently associated with poor neurological outcomes in patients with CA [28,29,30,31], we measured plasma IL-6 levels shortly after CA. Cardiac arrest led to increased IL-6 levels at 1 h post-ROSC (baseline vs. 1 h post-ROSC, 92.1 ± 13.7 pg/mL vs. 120.5 ± 42.5 pg/mL, p < 0.0001). There was no significant correlation between survival time and IL-6 levels (r = 0.17, p = 0.40). ROC curve analyses were performed to assess the accuracy of Tnadir and plasma IL-6 levels in differentiating between good and poor neurological outcomes at 72 h post-ROSC. ROC analyses revealed that a Tnadir cut-off of 24 min provided optimal sensitivity and specificity for predicting good neurological outcomes (AUC, 0.88; 95% confidence interval (CI), 0.75–1.0; sensitivity, 88.9%; specificity, 85.7%; p = 0.001). The AUC of IL-6 level at 1 h after ROSC, for predicting good neurological outcomes, was 0.59 (95% CI, 0.35–0.83; p = 0.47). The AUC of Tnadir was significantly superior to that of plasma IL-6 (p = 0.027, Figure 7).

3.4. Tnadir Was Associated with Alterations in Proinflammatory Cytokines in the Brain Immediately after ROSC

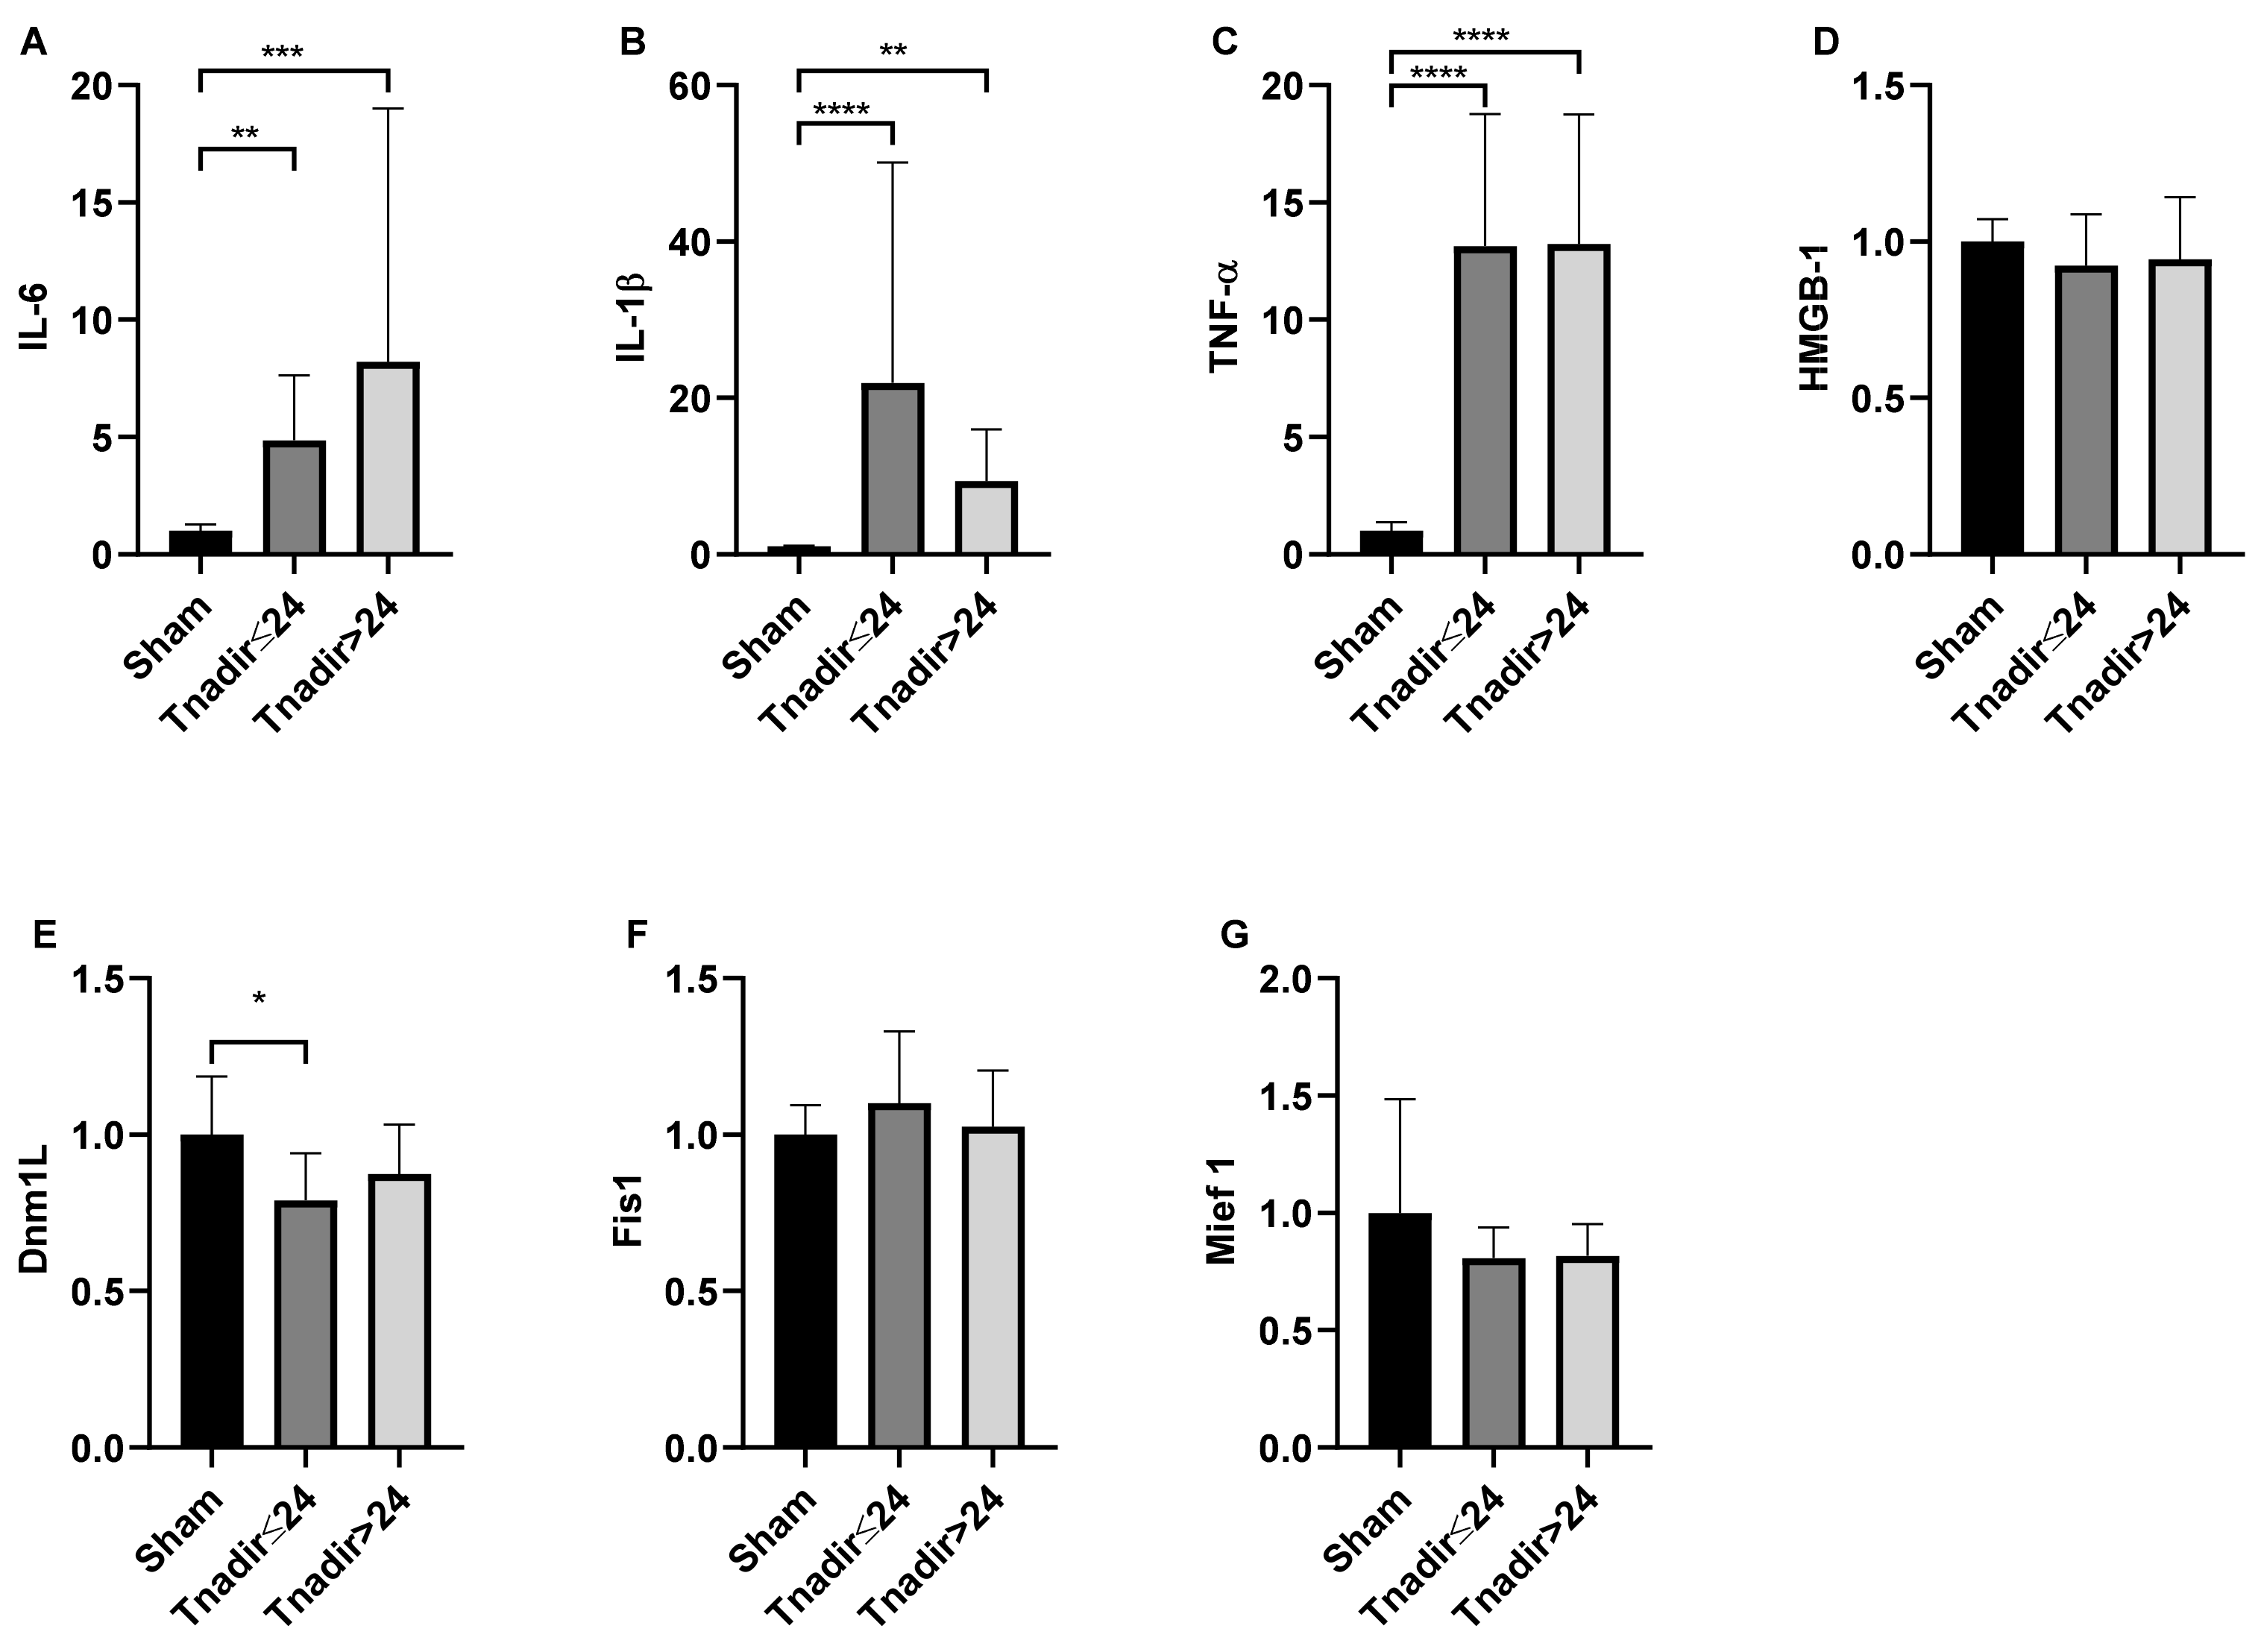
It has been reported that excessive cytokine production and dysfunctional mitochondrial dynamics are negatively associated with neurological outcomes after CA [28,31,32,33]. In the brain 2 h post-ROSC, cardiac arrest and CPR led to an increase in the mRNA levels of IL-6, IL-1β, and TNF-α, but not HMGB-1 (Figure 8). However, in comparisons between animals with Tnadir ≤ 24 min and with Tnadir > 24 min, there was no significant difference in IL-6 (p = 0.99), IL-1β (p = 0.44), and TNF-α (p = 0.99). A significant difference in Dnm1L gene expression was observed between sham animals and those with Tnadir ≤ 24 min, but not between animals with Tnadir ≤ 24 min and Tnadir > 24 min (p = 0.38). These observations suggest that Tnadir is not associated with cytokine productions and mitochondrial fission genes in the brain at 2 h after ROSC.

3.5. Tnadir Was Associated with Neuronal Degeneration Immediately after ROSC

To further elucidate the predictive role of Tnadir on global brain damage after CA, we evaluated neuronal degeneration in the cerebral cortex, hippocampus, and caudoputamen by FJB immunostaining. FJB-positive degenerating neurons were conspicuous in animals with Tnadir > 24 min, whereas animals with Tnadir ≤ 24 min showed significantly fewer degenerating neurons than those with Tnadir > 24 min in the hippocampus region (Figure 9). These observations suggest that Tnadir, measured within an hour after ROSC, was associated with degenerating neurons in the hippocampus region of the brain 72 h after ROSC.

4. Discussion

In the present study, we demonstrated that a longer CA duration resulted in delayed electrical recovery in the brain and greater degree of alterations in cerebral oxygen metabolism post-ROSC. To the best of our knowledge, this is the first study to demonstrate that the temporal changes in rSO2 shortly after ROSC were associated with severity of brain damage after CA/CPR in rats. There were no significant differences in rSO2 values, over 2 h after ROSC, between good and poor neurological outcome groups. However, Tnadir predicted good neurological outcome at 72 h after ROSC. Tnadir is a novel definition we found and means the time from ROSC to the nadir value. Based on the AUC analysis, Tnadir appears to be an excellent prognostic marker with significant advantages over plasma IL-6. Furthermore, Tnadir ≤ 24 min was significantly associated with lower neuronal degeneration in the hippocampus.
NIRS has long offered promise in monitoring the course of resuscitation after cardiac arrest and has remained inconclusive. A key impediment of rSO2 has been lack of a reliable scale of magnitude, which is susceptible to variation in device placement and subject anatomy. Since most clinical NIRS devices assume a venous/arterial distribution in the cerebral cortical tissue as 70/30% or 75/25% [34], rSO2 values are primarily influenced by cerebral venous oxygen saturation [35]. Monitoring of rSO2, during resuscitation in CA patients, has attracted attention because it can be a useful measure to predict the probability of ROSC and neurological outcomes [7,8,9,10,11,12,13]. However, previous systematic reviews and meta-analyses did not reveal any definite rSO2 cutoff values to predict ROSC and good neurological outcome [7,8,36,37,38]. Given that the absolute values and/or different degrees of variability in rSO2, due to several factors, vary among NIRS devices under various conditions [37,38,39,40], it will be challenging to clarify the definite cutoff value that can predict outcomes in patients with CA. In this regard, previous studies have suggested that relative changes in rSO2 from baseline are more appropriate for guiding resuscitative efforts than absolute values [7,9,10,11,12,13].
The present study demonstrates that Tnadir had a significant negative correlation with favorable neurological outcomes, with a cutoff value of 24 min, predicting a good neurological outcome, with an area under the receiver operating characteristic curve of 0.881. The exact mechanism of rapid decrease in rSO2, shortly after ROSC in rats with good neurological outcome, remains unknown. However, given the earlier recovery of EEG activity and a tendency of higher oxygen consumption immediately after ROSC in the lower severity model (6 min CA), it can be speculated that impaired neural activity and metabolism shortly after ROSC may affect the time-dependent changes in rSO2. Furthermore, our results showed that Tnadir was not associated with 72 h survival. Taken together, Tnadir can only predict brain injury but not mortality, which is clinically relevant for the prognostication of neurological recovery in the management of patients resuscitated from CA.
In the present study, the NIRS sensor has been designed to measure the rSO2 value at a depth of up to 10 mm from the attached skin, which corresponds to the depth of the hippocampus in rats. The group with Tnadir ≤ 24 min, which had a good neurological outcome, showed less neuronal degeneration (as assessed by FJB staining in the hippocampal CA1 region but not in the cerebral cortex or caudoputamen) than rats with Tnadir > 24 min. These observations suggest that in our rat model, rSO2 values reflect the corresponding area of interest in the brain.
The excess release of circulating cytokines, such as ILs and TNF, mediates ischemia/reperfusion injury, brain dysfunction, and myocardial dysfunction, following CA [6]. Consistent with these observations, in our study, the plasma IL-6 levels increased significantly 1 h after ROSC, compared to the baseline. Previous studies have shown that high levels of inflammatory cytokines are associated with mortality and/or poor neurological outcomes [28,31,32,41]. We demonstrated that AUC was significantly higher for Tnadir than plasma IL-6 1 h post-ROSC, suggesting that non-invasive, continuous measurements of rSO2 are more useful in the very early phase after ROSC than the known biomarker. However, we failed to show that plasma IL-6 level was a reliable predictor of neurological outcome and mortality. The discrepancy from the previous report [28,31,32,41] may have resulted from the early sample collection time in the present study. Moreover, the present study showed that inflammatory markers (IL-6, TNF-α, IL-1β) and mitochondrial fission markers in the brain 2 h post-ROSC did not differ between animals with Tnadir ≤ 24 min and Tnadir > 24 min. Further studies are warranted to determine whether the systemic inflammatory response and mitochondrial dynamics are associated with the severity of post-CA brain injury.
This study had some limitations. First, the relationship between rSO2 and oxygen consumption needs confirmatory studies, using more invasive measurements. However, since our idea with Tnadir evaluates the difference in temporal location of an inflection point rather than an absolute value, it is not necessary to confirm the consistency between the two parameters. Second, the site of sensor attachment can potentially influence the measured rSO2 value because of the difference in arterial and venous distributions of each rat. We ensured sensor attachment to the same site in all experiments, to preserve accuracy of measurements. Third, we did not examine the exact causes of death after CA; therefore, the underlying reason for the inability of Tnadir to predict survival outcome remains unknown. Fourth, cerebral hemodynamic parameters (transcranial Doppler or cardiac output) were not assessed in conjunction with changes in rSO2 values; however, a combination of assessments with these parameters could have improved the understanding of cerebral hemodynamic disturbances. Fifth, a lack of rigorous CPR technique (constant rate, measured depth of chest compression) in a non-blinded manner could introduce potential bias for brain recovery after CA. Finally, the animals were mechanically ventilated with 100% O2 for 105 min after ROSC, which may have contributed to increased inflammatory markers and mortality rate. To minimize experimental variations, both groups were subjected to the same oxygen administrations throughout the experiment.

5. Conclusions

We have discovered a novel metric, using inflections during rSO2 monitoring, called Tnadir. The present study showed that Tnadir is a novel marker for predicting good neurological outcomes. The calculation of Tnadir in an individual may be useful for predicting neurological outcomes and tailoring the treatment in patients who resuscitated from CA, even if it is difficult to calculate the cutoff value that applies to all CA cases.

Supplementary Materials

The following are available online at https://www.mdpi.com/article/10.3390/jcm11010131/s1. Table S1: the assay IDs and primer sequences for each gene. Table S2: baseline characteristics of animals among the three different CA duration groups.

Author Contributions

Conceptualization, R.T. and K.H.; data curation, R.T., R.C.C., S.J.M. and H.K.; formal analysis, R.T., K.H. and R.C.C.; funding acquisition, L.B.B.; investigation, R.T., K.H., S.J.M., H.K. and Y.E.; methodology, R.T., K.H., T.Y. and Y.E.; project administration, K.H.; supervision, K.H.; writing—original draft, R.T.; writing—review and editing, K.H., M.S., E.P.M. and L.B.B. All authors have read and agreed to the published version of the manuscript.

Funding

This research received no external funding.

Institutional Review Board Statement

This study was approved by the Institutional Animal Care and Use Committee at Feinstein Institutes for Medical Research (Protocol No. 2020-003).

Informed Consent Statement

Not applicable.

Data Availability Statement

The datasets used and/or analyzed during the current study are available from the corresponding author on reasonable request.

Conflicts of Interest

The authors declare that they have no competing interest.

References

  1. Virani, S.S.; Alonso, A.; Aparicio, H.J.; Benjamin, E.J.; Bittencourt, M.S.; Callaway, C.W.; Carson, A.P.; Chamberlain, A.M.; Cheng, S.; Delling, F.N.; et al. Heart Disease and Stroke Statistics-2021 Update. Circulation 2021, 143, e254–e743. [Google Scholar] [CrossRef] [PubMed]
  2. Yan, S.; Gan, Y.; Jiang, N.; Wang, R.; Chen, Y.; Luo, Z.; Zong, Q.; Chen, S.; Lv, C. The global survival rate among adult out-of-hospital cardiac arrest patients who received cardiopulmonary resuscitation: A systematic review and meta-analysis. Crit. Care 2020, 24, 61. [Google Scholar] [CrossRef] [PubMed] [Green Version]
  3. Okubo, M.; Kiyohara, K.; Iwami, T.; Callaway, C.W.; Kitamura, T. Nationwide and regional trends in survival from out-of-hospital cardiac arrest in Japan: A 10-year cohort study from 2005 to 2014. Resuscitation 2017, 115, 120–128. [Google Scholar] [CrossRef] [PubMed]
  4. Soar, J.; Donnino, M.W.; Maconochie, I.; Aickin, R.; Atkins, D.L.; Andersen, L.W.; Berg, K.M.; Bingham, R.; Bottiger, B.W.; Callaway, C.W.; et al. 2018 International Consensus on Cardiopulmonary Resuscitation and Emergency Cardiovascular Care Science with Treatment Recommendations Summary. Circulation 2018, 138, e714–e730. [Google Scholar] [CrossRef] [Green Version]
  5. Li, Y.; Tang, Q.; Wang, P.; Qin, J.; Wu, H.; Lin, J.; Huang, Z. Dynamic Changes of Mitochondrial Fusion and Fission in Brain Injury after Cardiac Arrest in Rats. Biomed. Res. Int. 2017, 2017, 1948070. [Google Scholar] [CrossRef]
  6. Neumar, R.W.; Nolan, J.P.; Adrie, C.; Aibiki, M.; Berg, R.A.; Bottiger, B.W.; Callaway, C.; Clark, R.S.; Geocadin, R.G.; Jauch, E.C.; et al. Post-cardiac arrest syndrome: Epidemiology, pathophysiology, treatment, and prognostication. A consensus statement from the International Liaison Committee on Resuscitation (American Heart Association, Australian and New Zealand Council on Resuscitation, European Resuscitation Council, Heart and Stroke Foundation of Canada, InterAmerican Heart Foundation, Resuscitation Council of Asia, and the Resuscitation Council of Southern Africa); the American Heart Association Emergency Cardiovascular Care Committee; the Council on Cardiovascular Surgery and Anesthesia; the Council on Cardiopulmonary, Perioperative, and Critical Care; the Council on Clinical Cardiology; and the Stroke Council. Circulation 2008, 118, 2452–2483. [Google Scholar]
  7. Cournoyer, A.; Iseppon, M.; Chauny, J.M.; Denault, A.; Cossette, S.; Notebaert, E. Near-infrared Spectroscopy Monitoring during Cardiac Arrest: A Systematic Review and Meta-analysis. Acad. Emerg. Med. 2016, 23, 851–862. [Google Scholar] [CrossRef] [Green Version]
  8. Schnaubelt, S.; Sulzgruber, P.; Menger, J.; Skhirtladze-Dworschak, K.; Sterz, F.; Dworschak, M. Regional cerebral oxygen saturation during cardiopulmonary resuscitation as a predictor of return of spontaneous circulation and favourable neurological outcome—A review of the current literature. Resuscitation 2018, 125, 39–47. [Google Scholar] [CrossRef]
  9. Tobias, J.D. Cerebral oxygenation monitoring: Near-infrared spectroscopy. Expert Rev. Med. Devices 2006, 3, 235–243. [Google Scholar] [CrossRef]
  10. Thavasothy, M.; Broadhead, M.; Elwell, C.; Peters, M.; Smith, M. A comparison of cerebral oxygenation as measured by the NIRO 300 and the INVOS 5100 Near-Infrared Spectrophotometers. Anaesthesia 2002, 57, 999–1006. [Google Scholar] [CrossRef]
  11. Parnia, S.; Nasir, A.; Shah, C.; Patel, R.; Mani, A.; Richman, P. A feasibility study evaluating the role of cerebral oximetry in predicting return of spontaneous circulation in cardiac arrest. Resuscitation 2012, 83, 982–985. [Google Scholar] [CrossRef]
  12. Ehara, N.; Hirose, T.; Shiozaki, T.; Wakai, A.; Nishimura, T.; Mori, N.; Ohnishi, M.; Sadamitsu, D.; Shimazu, T. The relationship between cerebral regional oxygen saturation during extracorporeal cardiopulmonary resuscitation and the neurological outcome in a retrospective analysis of 16 cases. J. Intensive Care 2017, 5, 20. [Google Scholar] [CrossRef] [Green Version]
  13. Takegawa, R.; Hayashida, K.; Rolston, D.M.; Li, T.; Miyara, S.J.; Ohnishi, M.; Shiozaki, T.; Becker, L.B. Near-Infrared Spectroscopy Assessments of Regional Cerebral Oxygen Saturation for the Prediction of Clinical Outcomes in Patients with Cardiac Arrest: A Review of Clinical Impact, Evolution, and Future Directions. Front. Med. 2020, 7, 587930. [Google Scholar] [CrossRef]
  14. Takegawa, R.; Shiozaki, T.; Furuya, S.; Hirose, T.; Mori, N.; Ohnishi, M.; Shimazu, T. Biphasic changes of rSO2 after cardio–pulmonary resuscitation preceded the good neurological outcome: A case report. J. Jpn. Assoc. Acute Med. 2018, 29, 138–142. [Google Scholar]
  15. Okuma, Y.; Aoki, T.; Miyara, S.J.; Hayashida, K.; Nishikimi, M.; Takegawa, R.; Yin, T.; Kim, J.; Becker, L.B.; Shinozaki, K. The evaluation of pituitary damage associated with cardiac arrest: An experimental rodent model. Sci. Rep. 2021, 11, 629. [Google Scholar] [CrossRef]
  16. Geocadin, R.G.; Sherman, D.L.; Christian Hansen, H.; Kimura, T.; Niedermeyer, E.; Thakor, N.V.; Hanley, D.F. Neurological recovery by EEG bursting after resuscitation from cardiac arrest in rats. Resuscitation 2002, 55, 193–200. [Google Scholar] [CrossRef]
  17. Shinozaki, K.; Becker, L.B.; Saeki, K.; Kim, J.; Yin, T.; Da, T.; Lampe, J.W. Dissociated Oxygen Consumption and Carbon Dioxide Production in the Post-Cardiac Arrest Rat: A Novel Metabolic Phenotype. J. Am. Heart Assoc. 2018, 7, e007721. [Google Scholar] [CrossRef] [Green Version]
  18. Nishikimi, M.; Yagi, T.; Shoaib, M.; Takegawa, R.; Rasul, R.; Hayashida, K.; Okuma, Y.; Yin, T.; Choudhary, R.C.; Becker, L.B.; et al. Phospholipid Screening Postcardiac Arrest Detects Decreased Plasma Lysophosphatidylcholine: Supplementation as a New Therapeutic Approach. Crit. Care Med. 2021. [Google Scholar] [CrossRef]
  19. Young, L.M.; Choudhary, R.; Jia, X. Multimodel quantitative analysis of somatosensory evoked potentials after cardiac arrest with graded hypothermia. In Proceedings of the Annual International Conference of the IEEE Engineering in Medicine and Biology Society IEEE Engineering in Medicine and Biology Society Annual International Conference, Orlando, FL, USA, 16–20 August 2016; Volume 2016, pp. 1846–1849. [Google Scholar]
  20. Chen, B.; Chen, G.; Dai, C.; Wang, P.; Zhang, L.; Huang, Y.; Li, Y. Comparison of Quantitative Characteristics of Early Post-resuscitation EEG Between Asphyxial and Ventricular Fibrillation Cardiac Arrest in Rats. Neurocrit. Care 2018, 28, 247–256. [Google Scholar] [CrossRef]
  21. Hu, Z.; Xu, L.; Zhu, Z.; Seal, R.; McQuillan, P.M. Effects of Hypothermic Cardiopulmonary Bypass on Internal Jugular Bulb Venous Oxygen Saturation, Cerebral Oxygen Saturation, and Bispectral Index in Pediatric Patients Undergoing Cardiac Surgery: A Prospective Study. Medicine 2016, 95, e2483. [Google Scholar] [CrossRef]
  22. Plötz, F.B.; van Lingen, R.A.; Bos, A.P. Venous oxygen measurements in the inferior vena cava in neonates with respiratory failure. Crit. Care 1998, 2, 57. [Google Scholar] [CrossRef] [Green Version]
  23. Neviere, R.; Mathieu, D.; Riou, Y.; Guimez, P.; Renaud, N.; Chagnon, J.L.; Wattel, F. Carbon dioxide rebreathing method of cardiac output measurement during acute respiratory failure in patients with chronic obstructive pulmonary disease. Crit. Care Med. 1994, 22, 81–85. [Google Scholar] [CrossRef]
  24. Neumar, R.W.; Bircher, N.G.; Sim, K.M.; Xiao, F.; Zadach, K.S.; Radovsky, A.; Katz, L.; Ebmeyer, E.; Safar, P. Epinephrine and sodium bicarbonate during CPR following asphyxial cardiac arrest in rats. Resuscitation 1995, 29, 249–263. [Google Scholar] [CrossRef]
  25. Schmued, L.C.; Hopkins, K.J. Fluoro-Jade B: A high affinity fluorescent marker for the localization of neuronal degeneration. Brain Res. 2000, 874, 123–130. [Google Scholar] [CrossRef] [Green Version]
  26. Hayashida, K.; Bagchi, A.; Miyazaki, Y.; Hirai, S.; Seth, D.; Silverman, M.G.; Rezoagli, E.; Marutani, E.; Mori, N.; Magliocca, A.; et al. Improvement in Outcomes After Cardiac Arrest and Resuscitation by Inhibition of S-Nitrosoglutathione Reductase. Circulation 2019, 139, 815–827. [Google Scholar] [CrossRef]
  27. Hanley, J.A.; McNeil, B.J. A method of comparing the areas under receiver operating characteristic curves derived from the same cases. Radiology 1983, 148, 839–843. [Google Scholar] [CrossRef] [Green Version]
  28. Bro-Jeppesen, J.; Kjaergaard, J.; Stammet, P.; Wise, M.P.; Hovdenes, J.; Åneman, A.; Horn, J.; Devaux, Y.; Erlinge, D.; Gasche, Y.; et al. Predictive value of interleukin-6 in post-cardiac arrest patients treated with targeted temperature management at 33 °C or 36 °C. Resuscitation 2016, 98, 1–8. [Google Scholar] [CrossRef]
  29. Peberdy, M.A.; Andersen, L.W.; Abbate, A.; Thacker, L.R.; Gaieski, D.; Abella, B.S.; Grossestreuer, A.V.; Rittenberger, J.C.; Clore, J.; Ornato, J.; et al. Inflammatory markers following resuscitation from out-of-hospital cardiac arrest-A prospective multicenter observational study. Resuscitation 2016, 103, 117–124. [Google Scholar] [CrossRef]
  30. Oda, Y.; Tsuruta, R.; Kasaoka, S.; Inoue, T.; Maekawa, T. The cutoff values of intrathecal interleukin 8 and 6 for predicting the neurological outcome in cardiac arrest victims. Resuscitation 2009, 80, 189–193. [Google Scholar] [CrossRef]
  31. Bro-Jeppesen, J.; Kjaergaard, J.; Wanscher, M.; Nielsen, N.; Friberg, H.; Bjerre, M.; Hassager, C. Systemic Inflammatory Response and Potential Prognostic Implications after Out-of-Hospital Cardiac Arrest: A Substudy of the Target Temperature Management Trial. Crit. Care Med. 2015, 43, 1223–1232. [Google Scholar] [CrossRef]
  32. Jou, C.; Shah, R.; Figueroa, A.; Patel, J.K. The Role of Inflammatory Cytokines in Cardiac Arrest. J. Intensive Care Med. 2020, 35, 219–224. [Google Scholar] [CrossRef] [PubMed]
  33. Sharp, W.W.; Beiser, D.G.; Fang, Y.H.; Han, M.; Piao, L.; Varughese, J.; Archer, S.L. Inhibition of the mitochondrial fission protein dynamin-related protein 1 improves survival in a murine cardiac arrest model. Crit. Care Med. 2015, 43, e38–e47. [Google Scholar] [CrossRef] [PubMed]
  34. GenePisano, A.; Di Fraja, D.; Palmieri, C. Monitoring Cerebral Oximetry by Near-Infrared Spectroscopy (NIRS) in Anesthesia and Critical Care: Progress and Perspectives. In General Anesthesia Research; Cascella, M., Ed.; Springer: New York, NY, USA, 2020; pp. 75–96. [Google Scholar]
  35. Murkin, J.M.; Arango, M. Near-infrared spectroscopy as an index of brain and tissue oxygenation. Br. J. Anaesth. 2009, 103 (Suppl. 1), i3–i13. [Google Scholar] [CrossRef] [PubMed] [Green Version]
  36. Maconochie, I.K.; Aickin, R.; Hazinski, M.F.; Atkins, D.L.; Bingham, R.; Couto, T.B.; Guerguerian, A.-M.; Nadkarni, V.M.; Ng, K.-C.; Nuthall, G.A.; et al. Pediatric Life Support: 2020 International Consensus on Cardiopulmonary Resuscitation and Emergency Cardiovascular Care Science with Treatment Recommendations. Circulation 2020, 142, S140–S184. [Google Scholar] [CrossRef]
  37. Bickler, P.E.; Feiner, J.R.; Rollins, M.D. Factors affecting the performance of 5 cerebral oximeters during hypoxia in healthy volunteers. Anesth. Analg. 2013, 117, 813–823. [Google Scholar] [CrossRef]
  38. Andresen, B.; Greisen, G.; Hyttel-Sorensen, S. Comparison of INVOS 5100C and Nonin SenSmart X-100 oximeter performance in preterm infants with spontaneous apnea. Pediatric Res. 2020, 87, 1244–1250. [Google Scholar] [CrossRef]
  39. Davie, S.N.; Grocott, H.P. Impact of extracranial contamination on regional cerebral oxygen saturation: A comparison of three cerebral oximetry technologies. Anesthesiology 2012, 116, 834–840. [Google Scholar] [CrossRef] [Green Version]
  40. Zaouter, C.; Arbeid, E. Influence of ambient light on cerebral oximeters. Br. J. Anaesth. 2010, 105, 873–874. [Google Scholar] [CrossRef] [Green Version]
  41. Vaahersalo, J.; Skrifvars, M.B.; Pulkki, K.; Stridsberg, M.; Røsjø, H.; Hovilehto, S.; Tiainen, M.; Varpula, T.; Pettilä, V.; Ruokonen, E. Admission interleukin-6 is associated with post resuscitation organ dysfunction and predicts long-term neurological outcome after out-of- hospital ventricular fibrillation. Resuscitation 2014, 85, 1573–1579. [Google Scholar] [CrossRef]
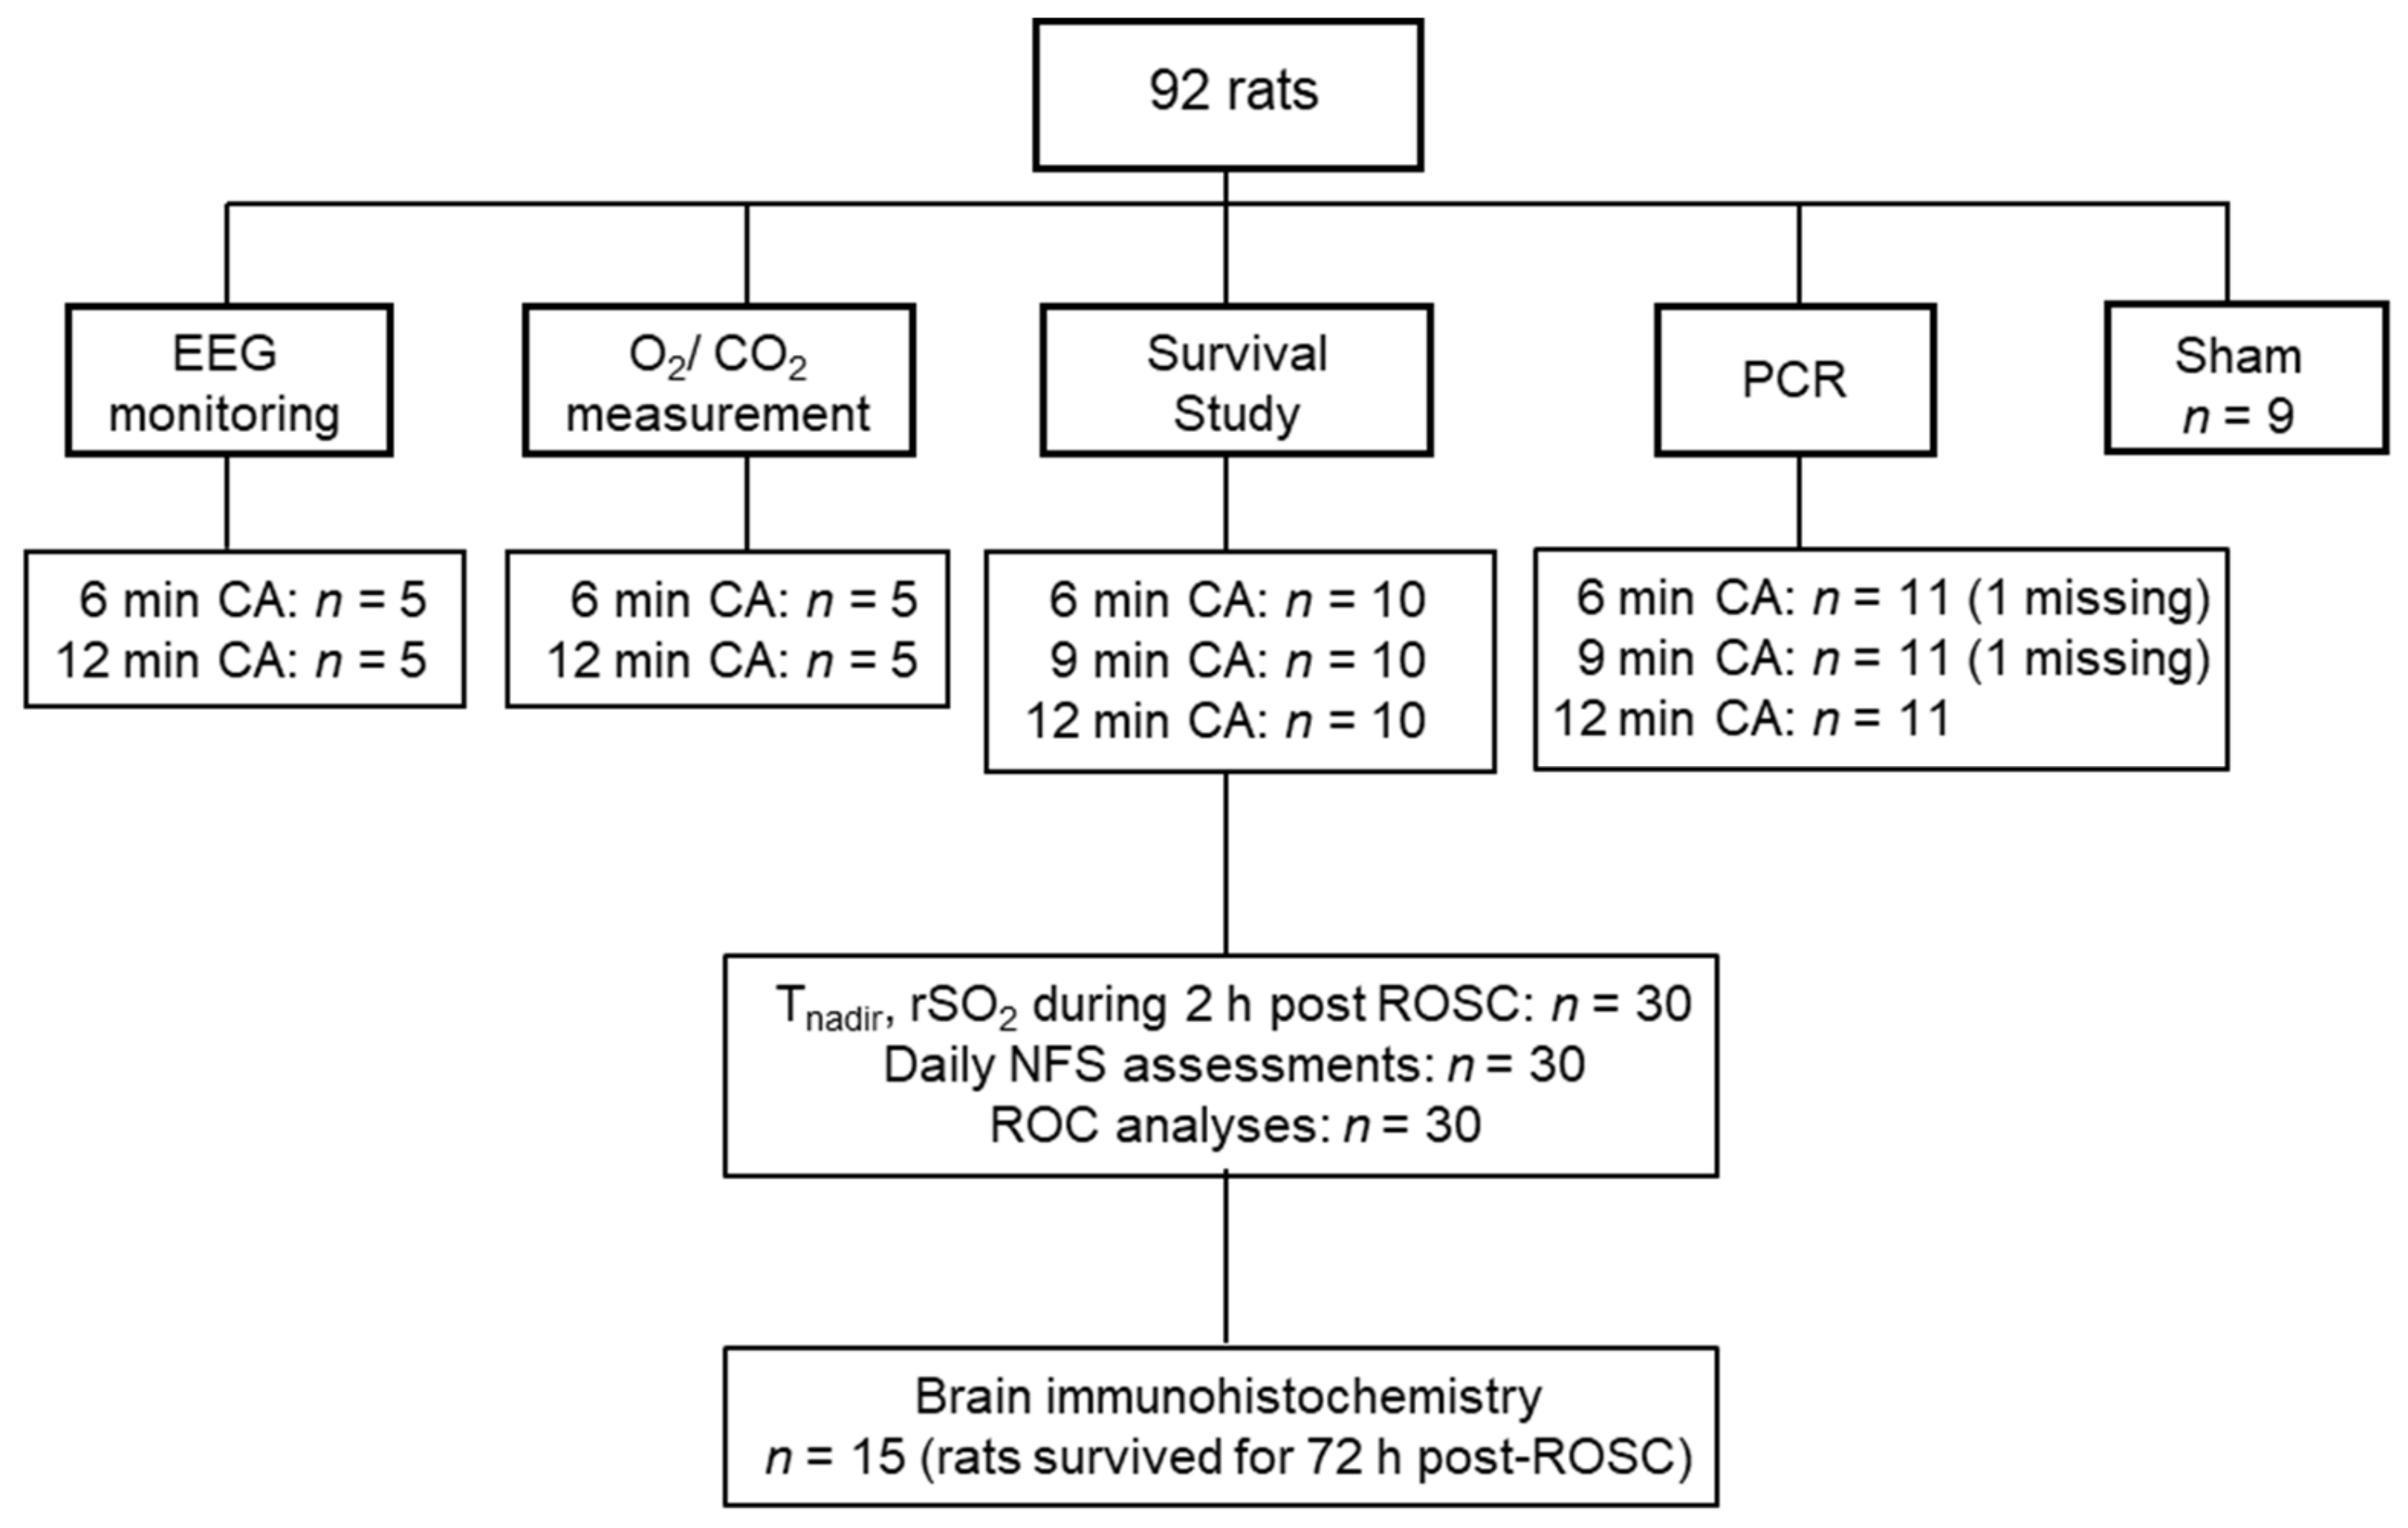
Figure 1. Flow diagram of the experimental groups. Data for two samples (in 6 and 9 min CA groups) in the PCR analysis were missing, due to technical failures. Brain samples from sham-operated rats were used for brain immunohistochemistry (n = 2) and PCR analysis (n = 7). EEG; electroencephalography, O2; Oxygen, CO2; carbon dioxide, PCR; polymerase chain reaction, CA; cardiac arrest, rSO2; regional cerebral oxygen saturation, ROSC: return of spontaneous circulation, NFS; neurological function score, ROC analyses; receiver operating characteristic analyses.
Jcm 11 00131 g001
Figure 2. Brain electrical recovery after cardiac arrest/cardiopulmonary resuscitation. The duration of both the appearance of the first EEG amplitude activity and continuous EEG activity were significantly longer in the 12 min CA group than in the 6 min CA group. Data are presented as mean ± SD. n = 5 each group. * p < 0.05, **** p < 0.0001. CA: cardiac arrest.
Jcm 11 00131 g002
Figure 3. Time-dependent changes in cerebral oxygen metabolisms between 6 and 12 min cardiac arrest and cardiopulmonary resuscitation. (Left) Cerebral O2 consumption and (right) cerebral CO2 production at baseline, 20 min, and 60 min after the return of spontaneous circulation in each group; n = 5 each group. Data are presented as mean ± SD. # p < 0.05, ## p < 0.01, #### p < 0.0001 vs. at baseline in the same group, p < 0.05, ††† p < 0.001 vs. at 20 min in the same group, *** p < 0.001 between each group.
Jcm 11 00131 g003
Figure 4. Daily neurological functional scores (NFS) in the good and poor outcome groups after the return of spontaneous circulation (ROSC). The good neurological outcome group exhibited markedly higher NFS at 24, 48, and 72 h post-ROSC. Lines indicate mean; *** p < 0.001, **** p < 0.0001.
Jcm 11 00131 g004
Figure 5. Serial change in regional cerebral oxygen saturation (rSO2) during first 2 h after the return of spontaneous circulation (ROSC) in the good (a red line) and poor outcome (a blue line) groups. The 72-h survived rats were classified into binary groups using the NFS cut-off for good (NFS ≥ 60) and poor (NFS < 60) outcomes at 72 h post-ROSC. The rSO2 value increased rapidly with ROSC and decreased to a “nadir” level after reaching the peak level. After reaching the nadir, the rSO2 value increased gradually, showing a biphasic pattern. Fraction of inspired oxygen (FIO2) was maintained at 1.0 after initiation of CPR. FIO2 was gradually reduced to 0.6, 0.3, and 0.25 at 110, 115, and 120 min, respectively, followed by disconnection from mechanical ventilator and extubation. There were no significant differences in rSO2 over time between the good and poor neurological outcome groups; p = 0.92 for the two-way analysis of variance. The red and blue arrows indicate the “nadir” of rSO2 in the good and poor outcome groups, respectively. Data are presented as mean ± SD.
Jcm 11 00131 g005
Figure 6. The association of Tnadir with neurological function score (NFS) at 72 h post-return of spontaneous circulation. (A) Animals in the good outcome group exhibited a shorter Tnadir than those in the poor outcome group (22.2 ± 3.2 min vs. 31.5 ± 7.7 min, *** p < 0.001). Closed circles indicate Tnadir in each individual. The tentacles indicate mean ± SD in each group. (B). There was a significant negative correlation between Tnadir and NFS at 72 h after return of spontaneous circulation (r = −0.48; p = 0.007). Solid line indicates a correlation coefficient (r). Dashed lines show 95% confidence intervals.
Jcm 11 00131 g006
Figure 7. ROC analyses. (A) The ROC-AUC revealed that a Tnadir cut-off of 24 min provided optimal sensitivity and specificity for predicting good neurological outcomes (AUC, 0.88; 95% CI, 0.75–1.0; sensitivity, 88.9%; specificity, 85.7%; p = 0.001). (B) The AUC of plasma IL-6 levels at 1 h after return of spontaneous circulation, for predicting good neurological outcomes, was 0.59 (95% CI, 0.35–0.83; p = 0.47). The AUC of Tnadir was significantly superior to that of plasma IL-6 (p = 0.027). AUC: area under the curve, CI: confidence interval, IL-6: interleukin 6.
Jcm 11 00131 g007
Figure 8. The associations between Tnadir and biomarkers in the post-cardiac arrest brain. The levels of (A) interleukin (IL)-6, (B) IL-1β, (C) tumor necrosis factor (TNF) α, (D) high-mobility group box 1 (HMGB-1), (E) dynamin 1-like protein (Dnm1L), (F) fission 1 protein (Fis 1), and (G) mitochondrial elongation factor 1 (Mief 1) in the brains of sham-operated rats and rats 2 h post return of spontaneous circulation. Data are presented as mean ± SD. n = 7, 10, and 21 in sham, Tnadir ≤ 24 min, and Tnadir > 24 min groups, respectively; * p < 0.05, ** p < 0.01, *** p < 0.001, **** p < 0.0001.
Jcm 11 00131 g008
Figure 9. Fluoro-Jade B (FJB) immunostaining in the cortex, caudoputamen, and hippocampus. (Upper) Representative photomicrographs of brain sections (cortex, caudoputamen (CPu), and hippocampus (Hipp) CA1 region), showing FJB-positive cells in sham-operated rats and post-cardiac arrest rats having Tnadir ≤ 24 min and Tnadir > 24 min. (Lower) Number of FJB-positive cells in the cortex, caudoputamen, and hippocampus regions in survived rats having Tnadir ≤ 24 min (n = 9) and Tnadir > 24 min (n = 6). Data are presented as mean ± SD. * p < 0.05.
Jcm 11 00131 g009
Table 1. Baseline characteristics and perioperative parameters between good and poor neurological outcome groups.
Poor Neurological Outcome Group
(n = 21)
Good Neurological Outcome Group
(n = 9)
p Value
Weight, g441.0 ± 31.5432.7 ± 27.60.50
MAP baseline, mmHg87.7 ± 13.282.0 ± 17.00.12
HR baseline, bpm294.4 ± 35.4262.6 ± 24.50.02
BT baseline, °C36.4 ± 0.236.6 ± 0.20.004
EtCO2 baseline, mmHg38.9 ± 4.039.8 ± 2.90.29
rSO2 value baseline, %66.6 ± 2.166.4 ± 1.90.77
Time to CA, s186.3 ± 22.7165.9 ± 26.90.04
Time to ROSC, s80.1 ± 22.567.7 ± 9.00.13
MAP 20 min after ROSC, mmHg123.2 ± 23.7116.0 ± 14.20.41
HR 20 min after ROSC, bpm335.1 ± 44.2390.1 ± 39.40.003
BT 20 min after ROSC,36.8 ± 0.336.8 ± 0.30.69
EtCO2 20 min after ROSC, mmHg40.5 ± 4.143.0 ± 5.90.19
rSO2 value 20 min after ROSC, %62.6 ± 5.361.0 ± 2.10.05
MAP 90 min after ROSC, mmHg101.2 ± 12.9108.4 ± 8.60.14
HR 90 min after ROSC, bpm331.4 ± 35.7354.4 ± 50.80.17
BT 90 min after ROSC, 36.7 ± 0.336.7 ± 0.40.96
EtCO2 90 min after ROSC, mmHg38.7 ± 10.137.6 ± 4.40.66
rSO2 value 90 min after ROSC, %60.8 ± 2.862.7 ± 2.50.09
MAP, mean arterial pressure; HR, heart rate; BT, body temperature; EtCO2, end tidal carbon dioxide; rSO2, regional cerebral oxygen saturation; CA, cardiac arrest.
Publisher’s Note: MDPI stays neutral with regard to jurisdictional claims in published maps and institutional affiliations.