
Comorbidities and Susceptibility to COVID-19: A Generalized Gene Set Data Mining Approach

Abstract
1. Introduction
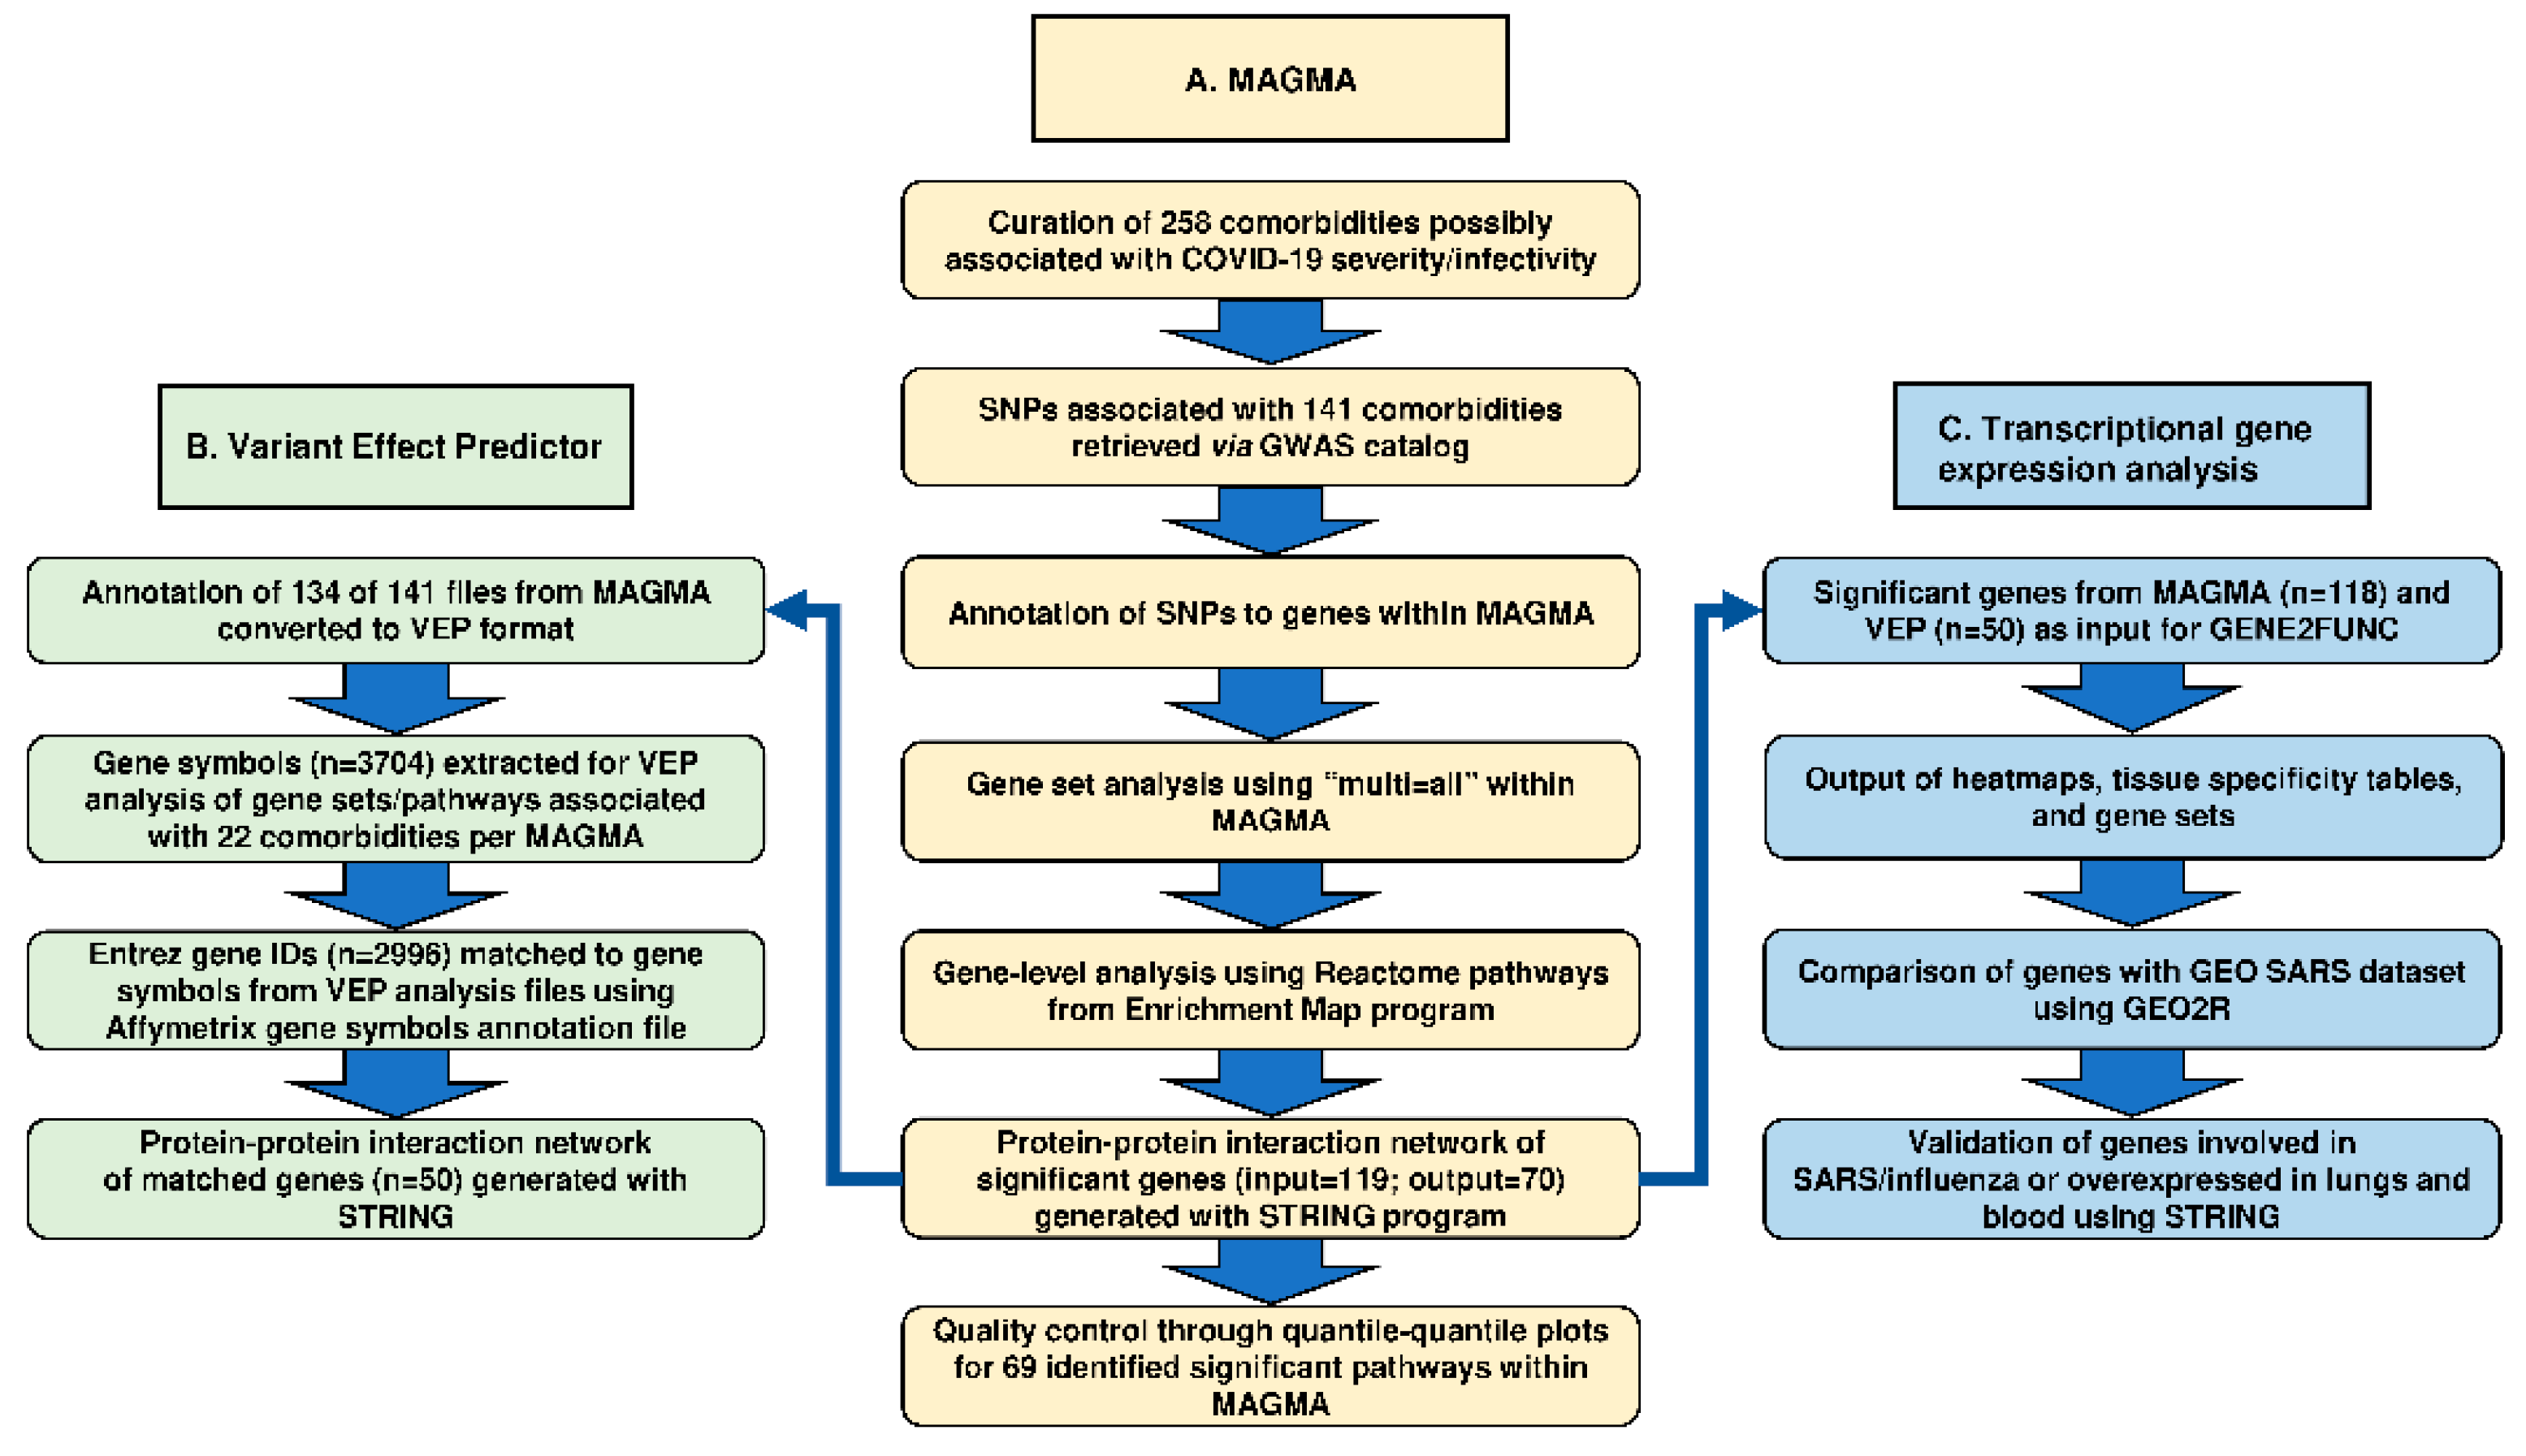
2. Methods
2.1. Multi-Marker Analysis of Genomic Annotation (MAGMA)
2.1.1. GWAS Catalog and Gene Mapping
2.1.2. Determination of Multiple SNPs Significance
2.2. Pathway Analysis Using Enrichment Map and MAGMAv1.07b Programs
2.2.1. Reactome Pathway Analysis
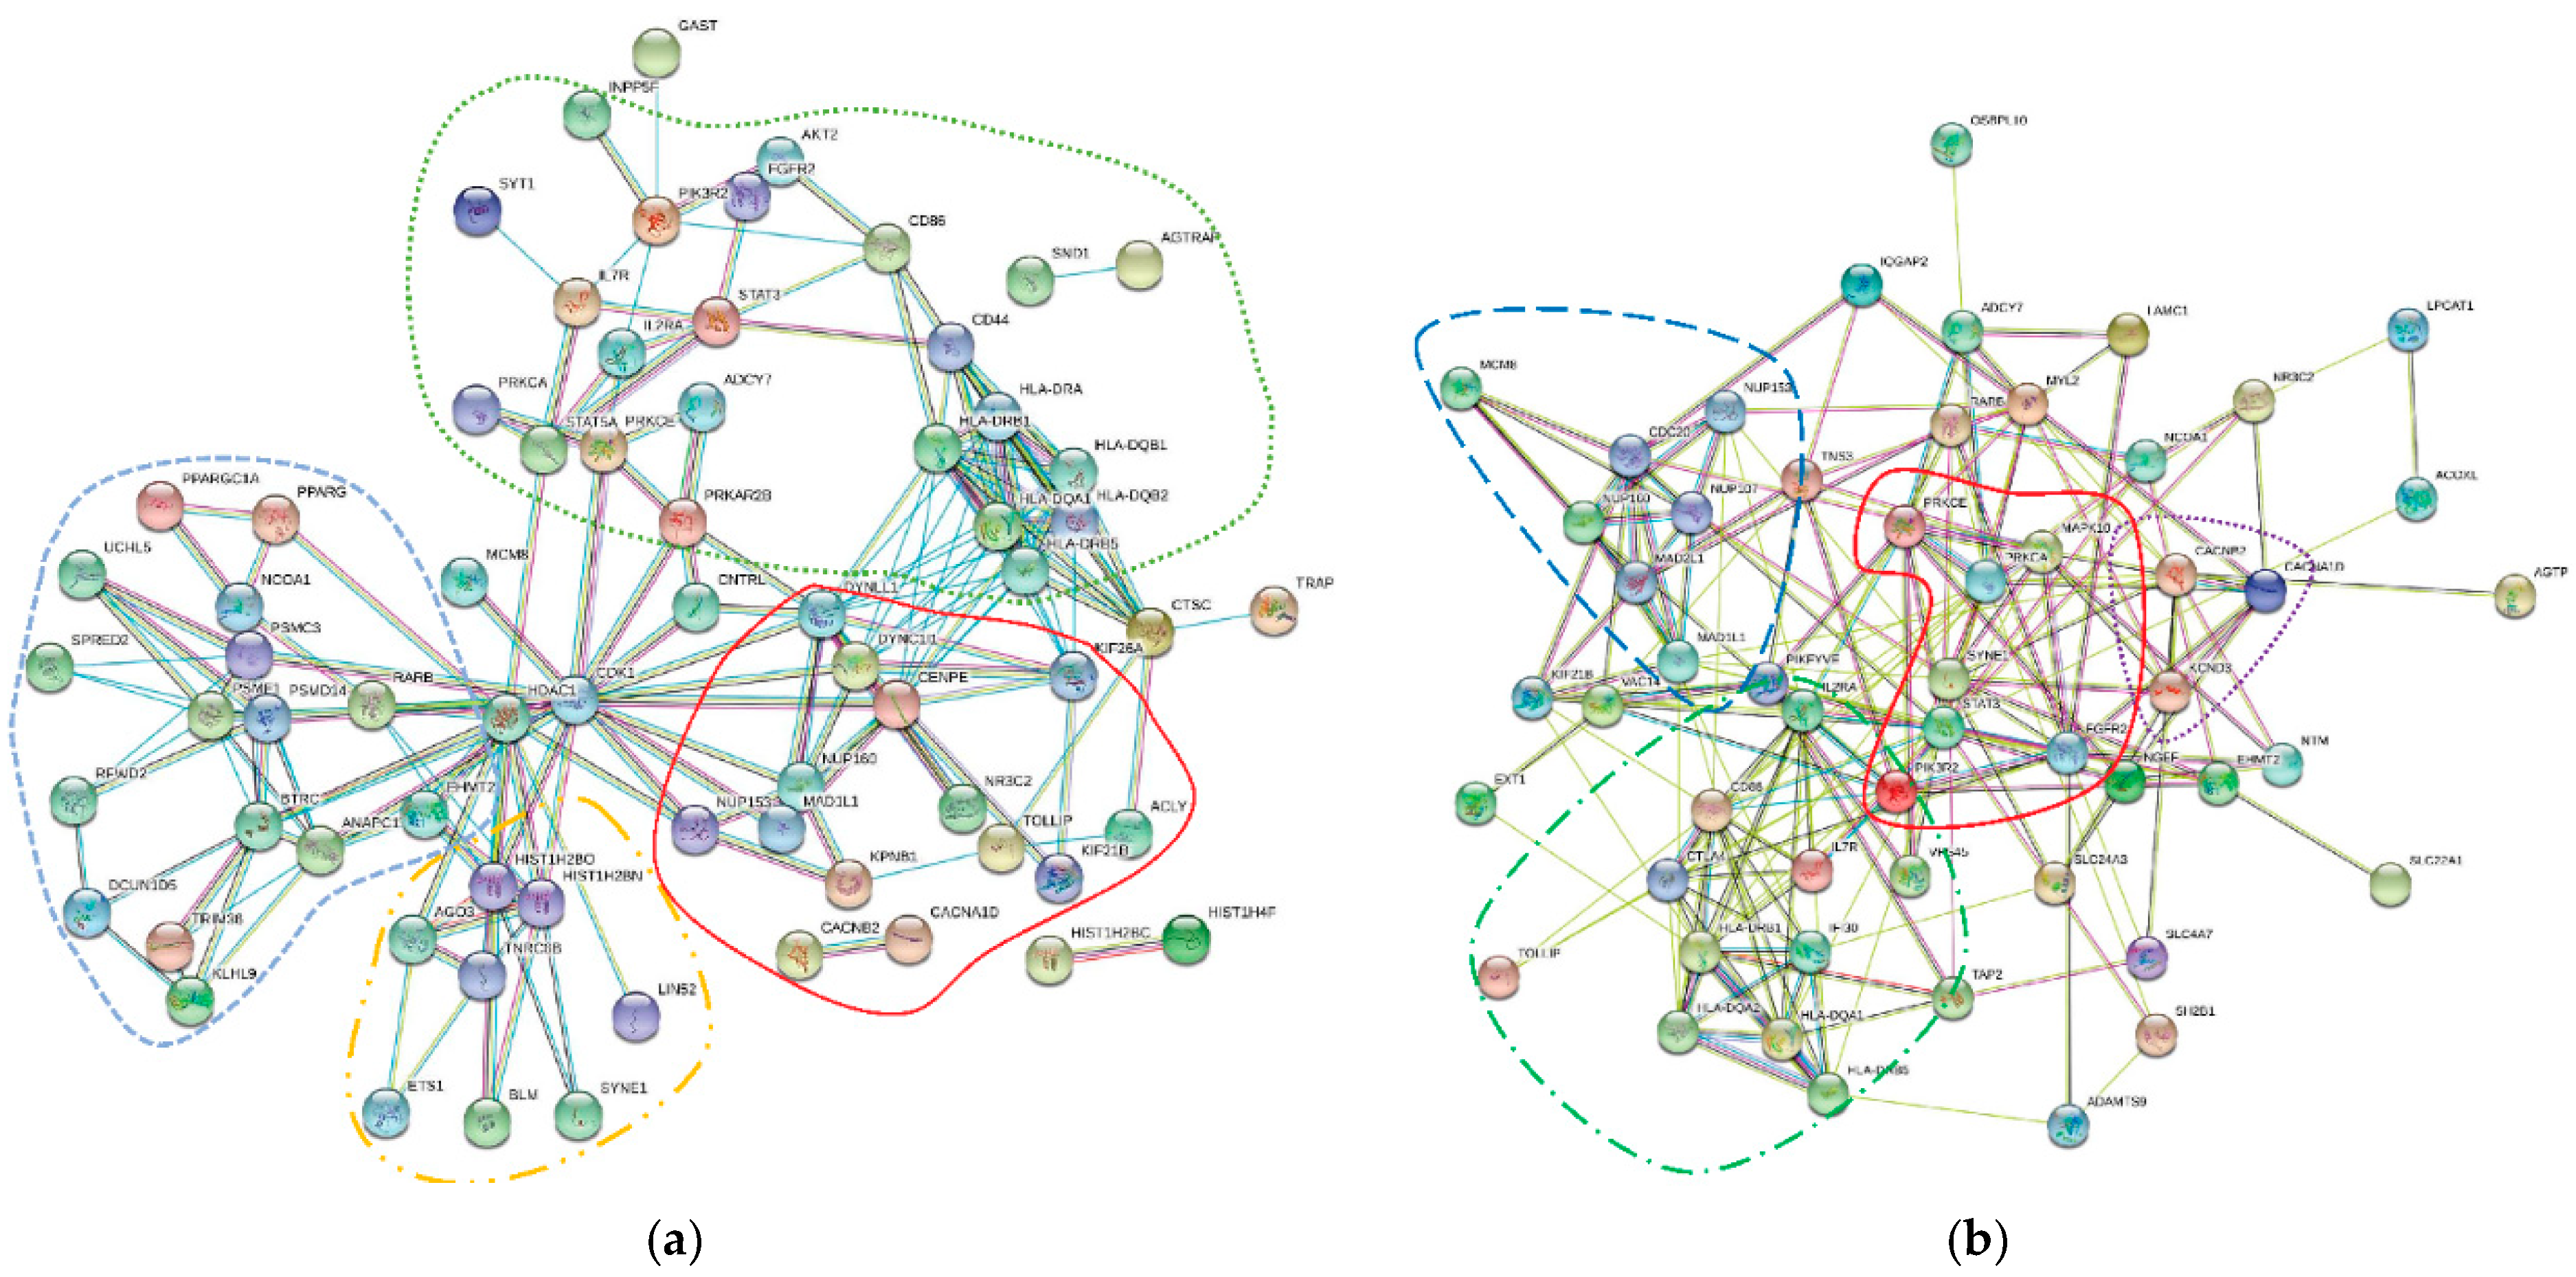
2.2.2. Interaction Networks
2.2.3. Quality Control
2.3. Prediction of SNP Effects
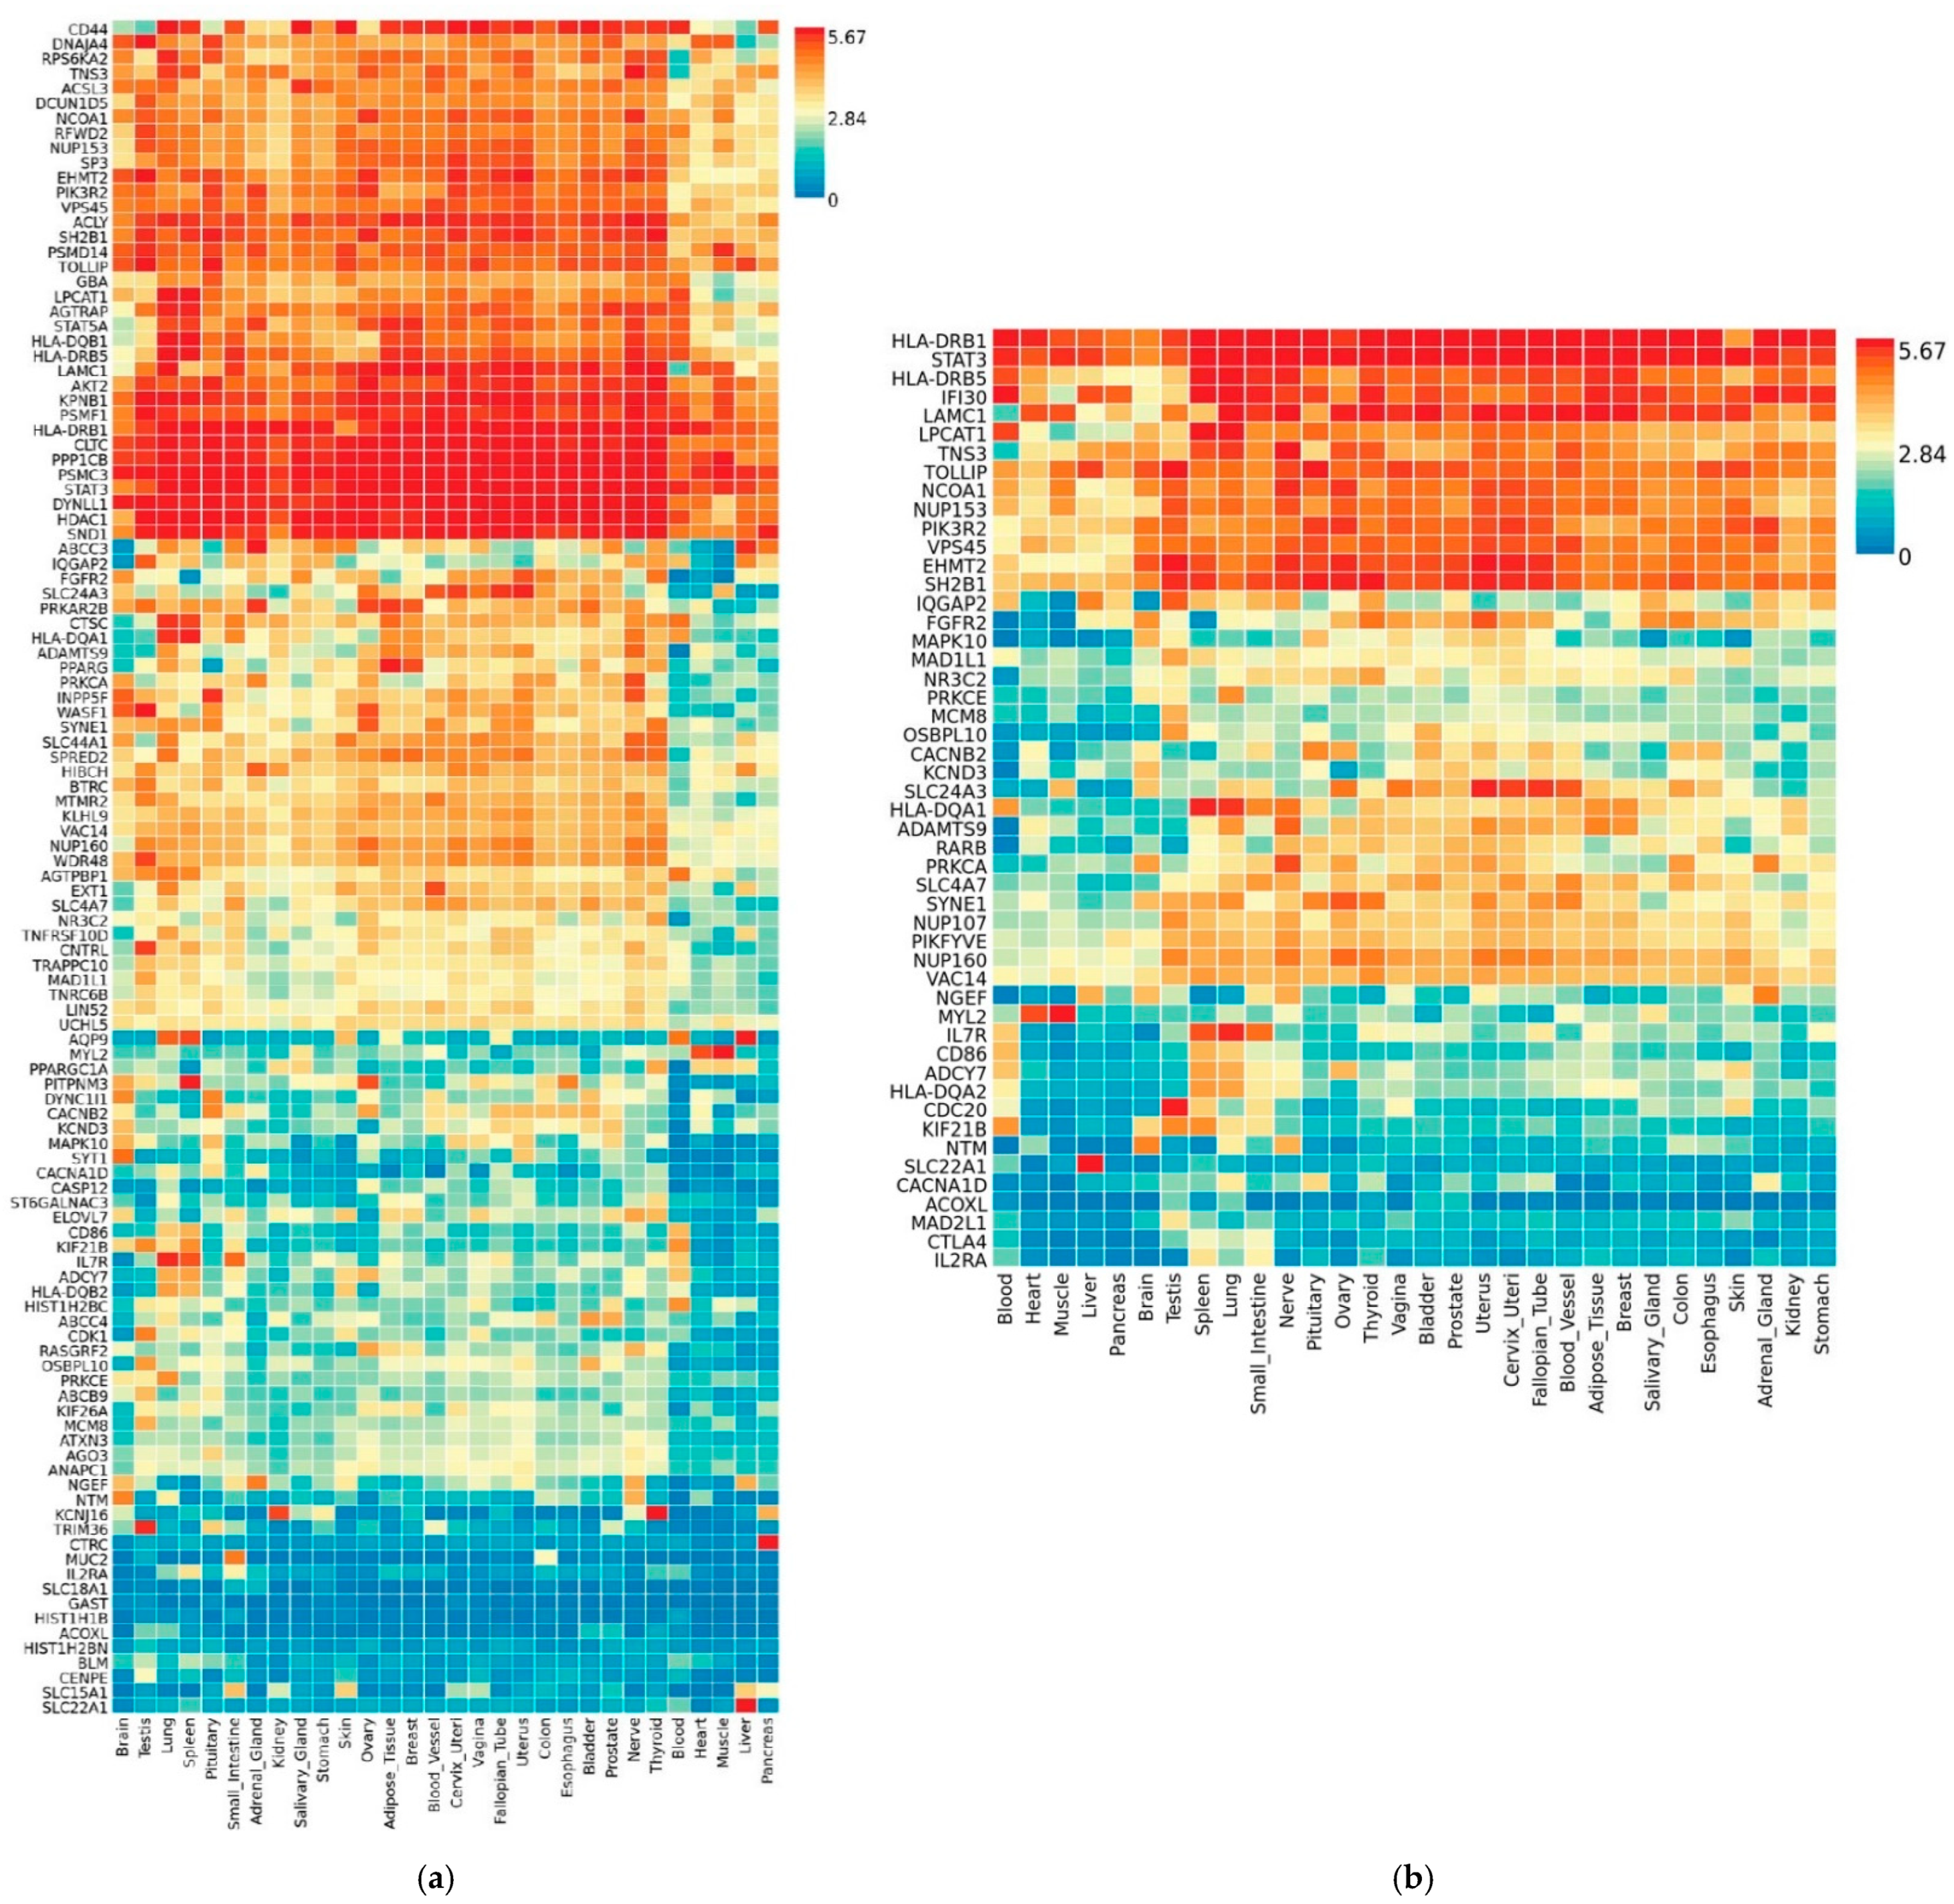
2.4. Transcriptional Gene Expression Analysis
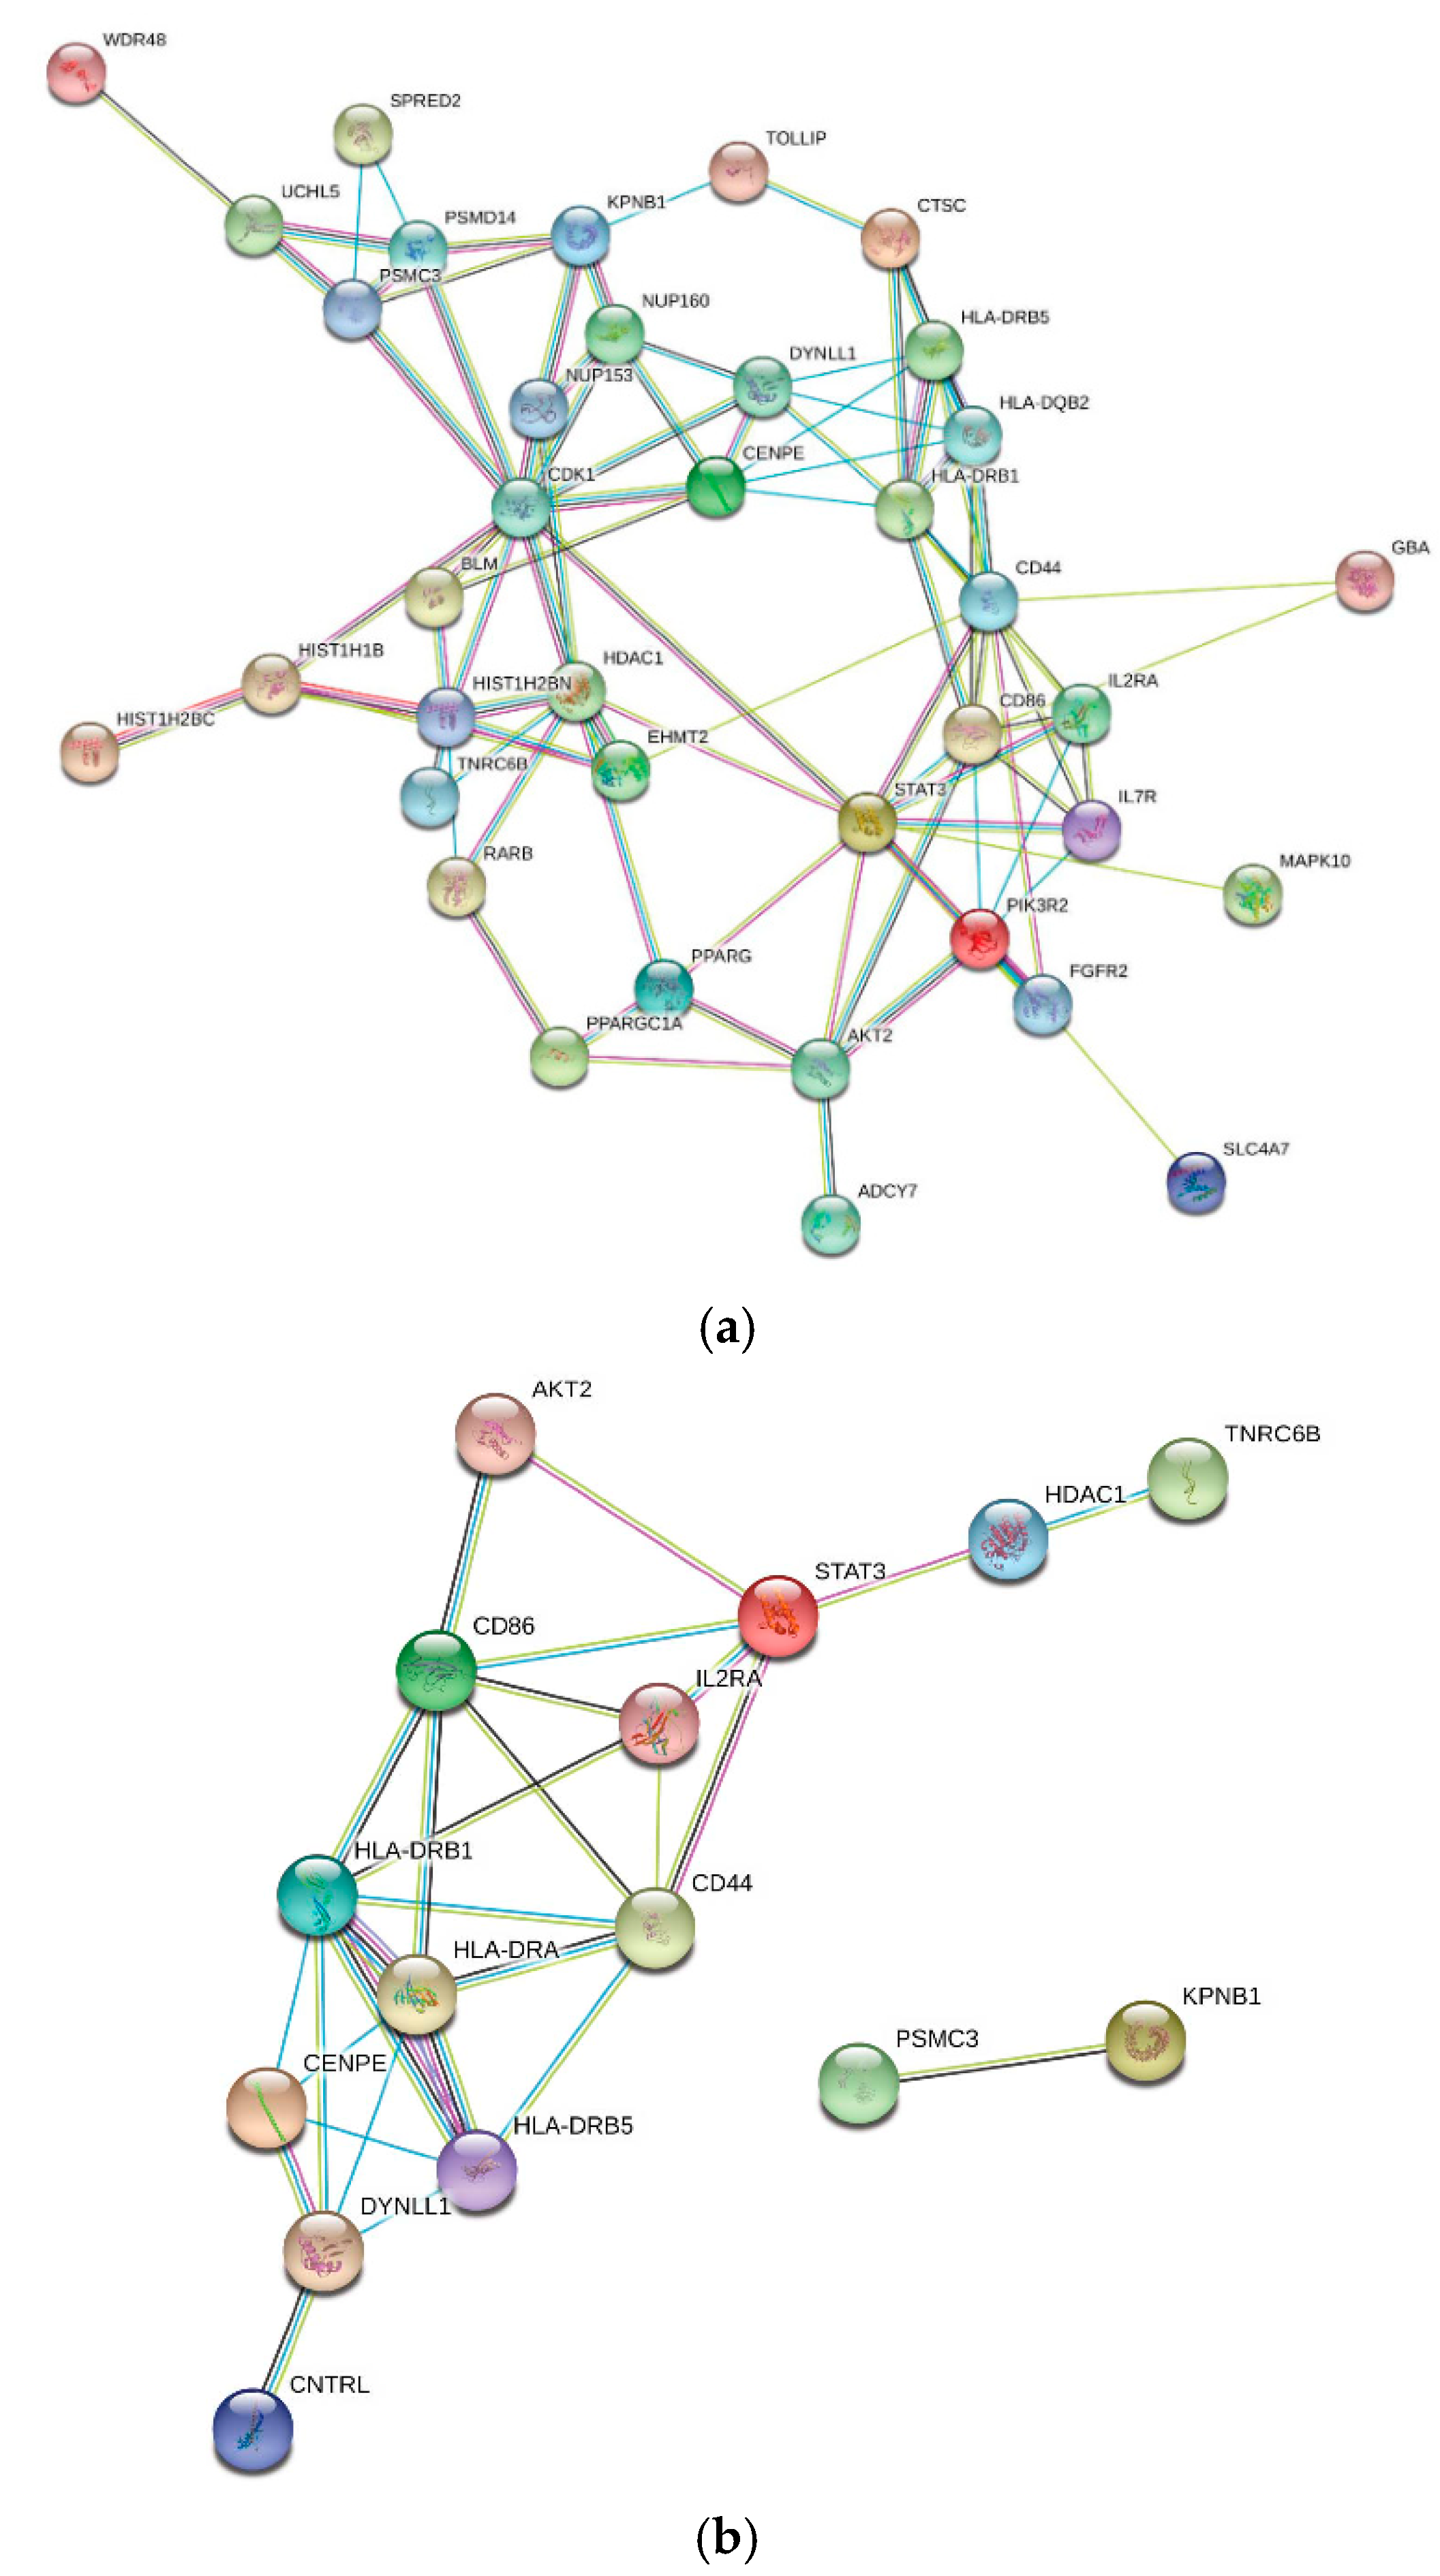
2.5. Gene Involvement in Influenza and/or SARS
3. Results
3.1. MAGMA Analysis of Multiple SNPs Associated with Candidate COVID-19 Comorbidities
3.2. VEP Analysis of MAGMA-Identified COVID-19 Comorbidity-Associated Genes
3.3. Transcriptional Gene Expression Analysis of MAGMA- and VEP-Identified Genes
4. Discussion
5. Limitations
6. Conclusions
Supplementary Materials
Author Contributions
Funding
Institutional Review Board Statement
Informed Consent Statement
Data Availability Statement
Acknowledgments
Conflicts of Interest
References
- Guan, W.J.; Ni, Z.Y.; Hu, Y.; Liang, W.H.; Ou, C.Q.; He, J.X.; Liu, L.; Shan, H.; Lei, C.L.; Hui, D.S.C.; et al. Clinical Characteristics of Coronavirus Disease 2019 in China. N. Engl. J. Med. 2020, 382, 1708–1720. [Google Scholar] [CrossRef] [PubMed]
- World Health Organization. WHO Coronavirus Disease (COVID-19) Dashboard. Available online: https://covid19.who.int/table (accessed on 4 February 2021).
- Ioannidis, J.P. Infection Fatality Rate of COVID-19 Inferred from Seroprevalence Data. WHO Bulletin. 2020. Available online: https://www.who.int/bulletin/online_first/BLT.20.265892.pdf (accessed on 26 August 2020).
- Lauer, S.A.; Grantz, K.H.; Bi, Q.; Jones, F.K.; Zheng, Q.; Meredith, H.R.; Azman, A.S.; Reich, N.G.; Lessler, J. The Incubation Period of Coronavirus Disease 2019 (COVID-19) from Publicly Reported Confirmed Cases: Estimation and Application. Ann. Intern. Med. 2020, 172, 577–582. [Google Scholar] [CrossRef] [PubMed]
- Wang, L.; Wang, Y.; Ye, D.; Liu, Q. Review of the 2019 novel coronavirus (SARS-CoV-2) based on current evidence. Int. J. Antimicrob. Agents 2020, 55, 105948. [Google Scholar] [CrossRef]
- Rawat, K.; Kumari, P.; Saha, L. COVID-19 vaccine: A recent update in pipeline vaccines, their design and development strategies. Eur. J. Pharmacol. 2021, 892, 173751. [Google Scholar] [CrossRef] [PubMed]
- Cascella, M.; Rajnik, M.; Cuomo, A.; Dulebohn, S.C.; Di Napoli, R. Features, Evaluation, and Treatment of Coronavirus (COVID-19); StatPearls: Treasure Island, FL, USA, 2020. [Google Scholar]
- Asselah, T.; Durantel, D.; Pasmant, E.; Lau, G.; Schinazi, R.F. COVID-19: Discovery, diagnostics and drug development. J. Hepatol. 2021, 74, 168–184. [Google Scholar] [CrossRef]
- Diaz, E.; Rodriguez, A.; Martin-Loeches, I.; Lorente, L.; Del Mar Martin, M.; Pozo, J.C.; Montejo, J.C.; Estella, A.; Arenzana, A.; Rello, J.; et al. Impact of obesity in patients infected with 2009 influenza A(H1N1). Chest 2011, 139, 382–386. [Google Scholar] [CrossRef] [PubMed]
- Renu, K.; Prasanna, P.L.; Valsala Gopalakrishnan, A. Coronaviruses pathogenesis, comorbidities and multi-organ damage—A review. Life Sci. 2020, 255, 117839. [Google Scholar] [CrossRef] [PubMed]
- Yang, J.; Zheng, Y.; Gou, X.; Pu, K.; Chen, Z.; Guo, Q.; Ji, R.; Wang, H.; Wang, Y.; Zhou, Y.; et al. Prevalence of comorbidities and its effects in patients infected with SARS-CoV-2: A systematic review and meta-analysis. Int. J. Infect. Dis. 2020, 94, 91–95. [Google Scholar] [CrossRef]
- Robilotti, E.V.; Babady, N.E.; Mead, P.A.; Rolling, T.; Perez-Johnston, R.; Bernardes, M.; Bogler, Y.; Caldararo, M.; Figueroa-Ortiz, C.; Glickman, M.; et al. Determinants of Severity in Cancer Patients with COVID-19 Illness. medRxiv 2020. [Google Scholar] [CrossRef]
- Ji, W.; Huh, K.; Kang, M.; Hong, J.; Bae, G.H.; Lee, R.; Na, Y.; Choi, H.; Gong, S.Y.; Choi, Y.H.; et al. Effect of Underlying Comorbidities on the Infection and Severity of COVID-19 in Korea: A Nationwide Case-Control Study. J. Korean Med. Sci. 2020, 35, e237. [Google Scholar] [CrossRef] [PubMed]
- Vetter, V.; Denizer, G.; Friedland, L.R.; Krishnan, J.; Shapiro, M. Understanding modern-day vaccines: What you need to know. Ann. Med. 2018, 50, 110–120. [Google Scholar] [CrossRef] [PubMed]
- Centers for Disease Control and Prevention. Vaccine Effectiveness: How Well Do the Flu Vaccines Work? 2020. Available online: https://www.cdc.gov/flu/vaccines-work/vaccineeffect.htm (accessed on 1 July 2020).
- Ohmit, S.E.; Victor, J.C.; Teich, E.R.; Truscon, R.K.; Rotthoff, J.R.; Newton, D.W.; Campbell, S.A.; Boulton, M.L.; Monto, A.S. Prevention of symptomatic seasonal influenza in 2005-2006 by inactivated and live attenuated vaccines. J. Infect. Dis. 2008, 198, 312–317. [Google Scholar] [CrossRef] [PubMed]
- Massey, K.L.; Hendeles, L.; Alexander, M.R.; Conner, C.S. Calcium antagonists in the management of asthma: Breakthrough or ballyhoo? Drug Intell. Clin. Pharm. 1987, 21, 505–509. [Google Scholar] [CrossRef]
- Baden, L.R.; El Sahly, H.M.; Essink, B.; Kotloff, K.; Frey, S.; Novak, R.; Diemert, D.; Spector, S.A.; Rouphael, N.; Creech, C.B.; et al. Efficacy and Safety of the mRNA-1273 SARS-CoV-2 Vaccine. N. Engl. J. Med. 2021, 384, 403–416. [Google Scholar] [CrossRef]
- Emerging Sars-Cov-2 Variants. Available online: www.cdc.gov/coronavirus/2019-ncov/more/science-and-research/scientific-brief-emerging-variants.html (accessed on 4 February 2021).
- Villaveces, J.M.; Koti, P.; Habermann, B.H. Tools for visualization and analysis of molecular networks, pathways, and -omics data. Adv. Appl. Bioinform. Chem. 2015, 8, 11–22. [Google Scholar]
- Hwang, W.C.; Zhang, A.; Ramanathan, M. Identification of information flow-modulating drug targets: A novel bridging paradigm for drug discovery. Clin. Pharmacol. Ther. 2008, 84, 563–572. [Google Scholar] [CrossRef]
- Zhao, S.; Li, S. Network-based relating pharmacological and genomic spaces for drug target identification. PLoS ONE 2010, 5, e11764. [Google Scholar] [CrossRef]
- Kim, J.; Manivannan, A.; Kim, D.S.; Lee, E.S.; Lee, H.E. Transcriptome sequencing assisted discovery and computational analysis of novel SNPs associated with flowering in Raphanus sativus in-bred lines for marker-assisted backcross breeding. Hortic. Res. 2019, 6, 1–12. [Google Scholar] [CrossRef] [PubMed]
- Lamb, J.; Crawford, E.D.; Peck, D.; Modell, J.W.; Blat, I.C.; Wrobel, M.J.; Lerner, J.; Brunet, J.P.; Subramanian, A.; Ross, K.N.; et al. The Connectivity Map: Using gene-expression signatures to connect small molecules, genes, and disease. Science 2006, 313, 1929–1935. [Google Scholar] [CrossRef] [PubMed]
- Dai, Y.F.; Zhao, X.M. A survey on the computational approaches to identify drug targets in the postgenomic era. BioMed Res. Int. 2015, 2015, 239654. [Google Scholar] [CrossRef] [PubMed]
- Jia, P.; Wang, L.; Fanous, A.H.; Pato, C.N.; Edwards, T.L.; International Schizophrenia Consortium; Zhao, Z. Network-assisted investigation of combined causal signals from genome-wide association studies in schizophrenia. PLoS Comput. Biol. 2012, 8, e1002587. [Google Scholar] [CrossRef]
- Durmus, S.; Cakir, T.; Ozgur, A.; Guthke, R. A review on computational systems biology of pathogen-host interactions. Front. Microbiol. 2015, 6, 235. [Google Scholar] [PubMed]
- Brusic, V.; Petrovsky, N. Immunoinformatics—The new kid in town. Novartis Found Symp. 2003, 254, 3–13. [Google Scholar] [PubMed]
- Petrovsky, N.; Silva, D.; Brusic, V. The future for computational modelling and prediction systems in clinical immunology. Novartis Found. Symp. 2003, 254, 23–32. [Google Scholar] [PubMed]
- Qiu, X.; Duvvuri, V.R.; Bahl, J. Computational Approaches and Challenges to Developing Universal Influenza Vaccines. Vaccines 2019, 7, 2. [Google Scholar] [CrossRef]
- de Leeuw, C.A.; Mooij, J.M.; Heskes, T.; Posthuma, D. MAGMA: Generalized gene-set analysis of GWAS data. PLoS Comput. Biol. 2015, 11, e1004219. [Google Scholar] [CrossRef]
- Gianfranco, P.; Benso, A. IL6-mediated HCoV-host interactome regulatory network and GO/Pathway enrichment analysis. PLoS Comput. Biol. 2020, 16, e1008238. [Google Scholar]
- Centers for Disease Control and Prevention. Certain Medical Conditions and Risk for Severe COVID-19 Illness. CDC. 2020. Available online: https://www.cdc.gov/coronavirus/2019-ncov/need-extra-precautions/people-with-medical-conditions.html (accessed on 1 May 2020).
- GWAS Catalog Database. Available online: https://www.ebi.ac.uk/gwas/ (accessed on 11 May 2020).
- Reactome Database. Available online: https://reactome.org (accessed on 22 July 2020).
- Enrichment Map Program. Available online: http://baderlab.org/Software/EnrichmentMap (accessed on 22 July 2020).
- Entrez Gene IDs. Available online: http://www.ncbi.nlm.nih.gov/gene (accessed on 20 June 2020).
- Merico, D.; Isserlin, R.; Stueker, O.; Emili, A.; Bader, G.D. Enrichment map: A network-based method for gene-set enrichment visualization and interpretation. PLoS ONE 2010, 5, e13984. [Google Scholar] [CrossRef]
- Jassal, B.; Matthews, L.; Viteri, G.; Gong, C.; Lorente, P.; Fabregat, A.; Sidiropoulos, K.; Cook, J.; Gillespie, M.; Haw, R.; et al. The reactome pathway knowledgebase. Nucleic Acids Res. 2020, 48, D498–D503. [Google Scholar] [CrossRef]
- Szklarczyk, D.; Gable, A.L.; Lyon, D.; Junge, A.; Wyder, S.; Huerta-Cepas, J.; Simonovic, M.; Doncheva, N.T.; Morris, J.H.; Bork, P.; et al. STRING v11: Protein-protein association networks with increased coverage, supporting functional discovery in genome-wide experimental datasets. Nucleic Acids Res. 2019, 47, D607–D613. [Google Scholar] [CrossRef]
- Multi-Marker Analysis of Genomic Annotation. Available online: https://ctg.cncr.nl/software/magma (accessed on 20 March 2020).
- de Leeuw, C.A.; Stringer, S.; Dekkers, I.A.; Heskes, T.; Posthuma, D. Conditional and interaction gene-set analysis reveals novel functional pathways for blood pressure. Nat. Commun. 2018, 9, 3768. [Google Scholar] [CrossRef]
- Ensembl’s Variant Effect Predictor, Ensembl’s Variant Effect Predictor. Available online: https://useast.ensembl.org/Tools/VEP (accessed on 1 August 2020).
- McLaren, W.; Gil, L.; Hunt, S.E.; Riat, H.S.; Ritchie, G.R.; Thormann, A.; Flicek, P.; Cunningham, F. The Ensembl Variant Effect Predictor. Genome Biol. 2016, 17, 122. [Google Scholar] [CrossRef]
- Affymetrix HG-U133A Human Genome. Available online: http://www.affymetrix.com/Auth/analysis/downloads/na35/ivt/HG-U133A.na35.annot.csv.zip (accessed on 20 July 2020).
- Affymetrix HG-U133B Human Genome. Available online: http://www.affymetrix.com/Auth/analysis/downloads/na35/ivt/HG-U133B.na35.annot.csv.zip (accessed on 20 July 2020).
- Huang, R.S.; Chen, P.; Wisel, S.; Duan, S.; Zhang, W.; Cook, E.H.; Das, S.; Cox, N.J.; Dolan, M.E. Population-specific GSTM1 copy number variation. Hum. Mol. Genet. 2009, 18, 366–372. [Google Scholar] [CrossRef]
- Watanabe, K.; Taskesen, E.; van Bochoven, A.; Posthuma, D. Functional mapping and annotation of genetic associations with FUMA. Nat. Commun. 2017, 8, 1826. [Google Scholar] [CrossRef]
- GEO2R. Available online: https://www.ncbi.nlm.nih.gov/geo/geo2r (accessed on 7 May 2020).
- Pubmed. Available online: https://pubmed.ncbi.nlm.nih.gov/ (accessed on 1 August 2020).
- DisGeNETv6. Available online: https://www.disgenet.org (accessed on 1 August 2020).
- Influenza Research Database. Available online: https://www.fludb.org/brc/home.spg?decorator=influenza (accessed on 1 August 2020).
- Carmona-Saez, P.; Chagoyen, M.; Tirado, F.; Carazo, J.M.; Pascual-Montano, A. GENECODIS: A web-based tool for finding significant concurrent annotations in gene lists. Genome Biol. 2007, 8, R3. [Google Scholar] [CrossRef] [PubMed]
- Pinero, J.; Ramirez-Anguita, J.M.; Sauch-Pitarch, J.; Ronzano, F.; Centeno, E.; Sanz, F.; Furlong, L.I. The DisGeNET knowledge platform for disease genomics: 2019 update. Nucleic Acids Res. 2020, 48, D845–D855. [Google Scholar] [PubMed]
- Zhang, Y.; Aevermann, B.D.; Anderson, T.K.; Burke, D.F.; Dauphin, G.; Gu, Z.; He, S.; Kumar, S.; Larsen, C.N.; Lee, A.J.; et al. Influenza Research Database: An integrated bioinformatics resource for influenza virus research. Nucleic Acids Res. 2017, 45, D466–D474. [Google Scholar] [CrossRef] [PubMed]
- Higgins, J.P.T.; Thomas, J.; Chandler, J.; Cumpston, M.; Li, T.; Page, M.J.; Welch, V.A. (Eds.) Cochrane Handbook for Systematic Reviews of Interventions Version 6.0; (Updated July 2019); 2019; Available online: www.training.cochrane.org/handbook (accessed on 5 November 2020).
- Ensembl Expression Atlas. Available online: https://www.ebi.ac.uk/gxa/home (accessed on 1 August 2020).
- Papatheodorou, I.; Fonseca, N.A.; Keays, M.; Tang, Y.A.; Barrera, E.; Bazant, W.; Burke, M.; Fullgrabe, A.; Fuentes, A.M.-P.; George, N.; et al. Expression Atlas: Gene and protein expression across multiple studies and organisms. Nucleic Acids Res. 2018, 46, D246–D251. [Google Scholar] [CrossRef]
- Dorry, S.J.; Ansbro, B.O.; Ornitz, D.M.; Mutlu, G.M.; Guzy, R.D. FGFR2 Is Required for AEC2 Homeostasis and Survival after Bleomycin-induced Lung Injury. Am. J. Respir. Cell Mol. Biol. 2020, 62, 608–621. [Google Scholar] [CrossRef]
- Konig, R.; Stertz, S.; Zhou, Y.; Inoue, A.; Hoffmann, H.H.; Bhattacharyya, S.; Alamares, J.G.; Tscherne, D.M.; Ortigoza, M.B.; Liang, Y.; et al. Human host factors required for influenza virus replication. Nature 2010, 463, 813–817. [Google Scholar] [CrossRef] [PubMed]
- Mehle, A.; Doudna, J.A. A host of factors regulating influenza virus replication. Viruses 2010, 2, 566–573. [Google Scholar] [CrossRef]
- Muhlbauer, D.; Dzieciolowski, J.; Hardt, M.; Hocke, A.; Schierhorn, K.L.; Mostafa, A.; Muller, C.; Wisskirchen, C.; Herold, S.; Wolff, T.; et al. Influenza virus-induced caspase-dependent enlargement of nuclear pores promotes nuclear export of viral ribonucleoprotein complexes. J. Virol. 2015, 89, 6009–6021. [Google Scholar] [CrossRef]
- Frieman, M.; Yount, B.; Heise, M.; Kopecky-Bromberg, S.A.; Palese, P.; Baric, R.S. Severe acute respiratory syndrome coronavirus ORF6 antagonizes STAT1 function by sequestering nuclear import factors on the rough endoplasmic reticulum/Golgi membrane. J. Virol. 2007, 81, 9812–9824. [Google Scholar] [CrossRef] [PubMed]
- Mizutani, T.; Fukushi, S.; Murakami, M.; Hirano, T.; Saijo, M.; Kurane, I.; Morikawa, S. Tyrosine dephosphorylation of STAT3 in SARS coronavirus-infected Vero E6 cells. FEBS Lett. 2004, 577, 187–192. [Google Scholar] [CrossRef] [PubMed]
- Jiang, W.; Wragg, K.M.; Tan, H.X.; Kelly, H.G.; Wheatley, A.K.; Kent, S.J.; Juno, J.A. Identification of murine antigen-specific T follicular helper cells using an activation-induced marker assay. J. Immunol. Methods. 2019, 467, 48–57. [Google Scholar] [CrossRef]
- Wu, D.; Huang, W.; Wang, Y.; Guan, W.; Li, R.; Yang, Z.; Zhong, N. Gene silencing of beta-galactosamide alpha-2,6-sialyltransferase 1 inhibits human influenza virus infection of airway epithelial cells. BMC Microbiol. 2014, 14, 78. [Google Scholar] [CrossRef] [PubMed]
- Senda, M.; Ito, A.; Tsuchida, A.; Hagiwara, T.; Kaneda, T.; Nakamura, Y.; Kasama, K.; Kiso, M.; Yoshikawa, K.; Katagiri, Y.; et al. Identification and expression of a sialyltransferase responsible for the synthesis of disialylgalactosylgloboside in normal and malignant kidney cells: Downregulation of ST6GalNAc VI in renal cancers. Biochem. J. 2007, 402, 459–470. [Google Scholar] [CrossRef] [PubMed]
- Litan, A.; Langhans, S.A. Cancer as a channelopathy: Ion channels and pumps in tumor development and progression. Front. Cell Neurosci. 2015, 9, 86. [Google Scholar] [CrossRef]
- Merkling, S.H.; van Rij, R.P. Analysis of resistance and tolerance to virus infection in Drosophila. Nat. Protoc. 2015, 10, 1084–1097. [Google Scholar] [CrossRef]
- Stefanowicz, D.; Ullah, J.; Lee, K.; Shaheen, F.; Olumese, E.; Fishbane, N.; Koo, H.-K.; Hallstrand, T.S.; Knight, D.A.; Hackett, T.-L. Epigenetic modifying enzyme expression in asthmatic airway epithelial cells and fibroblasts. BMC Pulm. Med. 2017, 17, 24. [Google Scholar] [CrossRef]
- Çağatay, T.; Chook, Y.M. Karyopherins in Cancer. Curr. Opin. Cell Biol. 2018, 52, 30–42. [Google Scholar] [CrossRef]
- Zhang, Y.; Li, K.-F. Karyopherin β1 deletion suppresses tumor growth and metastasis in colorectal cancer (CRC) by reducing MET expression. Biomed. Pharmacother. 2019, 120, 109127. [Google Scholar] [CrossRef]
- Sekimoto, N.; Suzuki, Y.; Sugano, S. Decreased KPNB1 Expression is Induced by PLK1 Inhibition and Leads to Apoptosis in Lung Adenocarcinoma. J. Cancer 2017, 8, 4125–4140. [Google Scholar] [CrossRef]
- Kodama, M.; Kodama, T.; Newberg, J.Y.; Katayama, H.; Kobayaski, M.; Hanash, S.M.; Yoshihara, K.; Wei, Z.; Tein, J.C.; Rangel, R.; et al. In vivo loss-of-function screens identify KPNB1 as a new druggable oncogene in epithelial ovarian cancer. Proc. Natl. Acad. Sci. USA 2017, 114, E7301–E7310. [Google Scholar] [CrossRef] [PubMed]
- Yang, J.; Guo, Y.; Lu, C.; Zhang, R.; Wang, Y.; Luo, L.; Zhang, Y.; Chu, C.H.; Wang, K.J.; Obbad, S.; et al. Inhibition of Karyopherin beta 1 suppresses prostate cancer growth. Oncogene 2019, 38, 4700–4714. [Google Scholar] [CrossRef]
- Ando, Y.; Tomaru, Y.; Morinaga, A.; Burroughs, M.A.; Kawaji, H.; Kubosaki, A.; Kimura, R.; Tagata, M.; Ino, Y.; Hirano, H.; et al. Nuclear pore complex protein mediated nuclear localization of dicer protein in human cells. PLoS ONE 2011, 6, e23385. [Google Scholar] [CrossRef] [PubMed]
- Vasu, S.; Shah, S.; Orjalo, A.; Park, M.; Fischer, W.H.; Forbes, D.J. Novel vertebrate nucleoporins Nup133 and Nup160 play a role in mRNA export. J. Cell Biol. 2001, 155, 339–354. [Google Scholar] [CrossRef]
- Le Sage, V.; Mouland, A.J. Viral subversion of the nuclear pore complex. Viruses 2013, 5, 2019–2042. [Google Scholar] [CrossRef]
- Centers for Disease Control and Prevention, Centers for Disease Control and Prevention. Long-Term Effects of COVID-19. Available online: www.cdc.gov/coronavirus/2019-ncov/long-term-effects.html (accessed on 5 December 2020).
- Nih. LPCAT1 Is Essential for Perinatal Lung Function and Survival. Grantome, NIH. Available online: Grantome.com/grant/NIH/R01-HL098319-03 (accessed on 1 July 2012).
- Lin, S.; Ikegami, M.; Moon, C.; Naren, A.P.; Shannon, J.M. Lysophosphatidylcholine Acyltransferase 1 (LPCAT1) Specifically Interacts with Phospholipid Transfer Protein StarD10 to Facilitate Surfactant Phospholipid Trafficking in Alveolar Type II Cells. J. Biol. Chem. 2015, 290, 18559–18574. [Google Scholar] [CrossRef] [PubMed]
- Yeung, M.L.; Houzet, L.; Yedavalli, V.S.R.K.; Jeang, K.-T. A genome-wide short hairpin RNA screening of jurkat T-cells for human proteins contributing to productive HIV-1 replication. J. Biol. Chem. 2009, 284, 19463–19473. [Google Scholar] [CrossRef] [PubMed]
- Kim, S.; Chen, J.; Cheng, T.; Gindulyte, A.; He, J.; He, S.; Li, Q.; Shoemaker, B.A.; Thiessen, P.A.; Yu, B.; et al. PubChem in 2021: New data content and improved web interfaces. Nucleic Acids Res. 2021, 49, D1388–D1395. [Google Scholar] [CrossRef] [PubMed]
- Cui, G.; Staron, M.M.; Gray, S.M.; Ho, P.-C.; Amezquita, R.A.; Wu, J.; Kaech, S.M. IL-7-Induced Glycerol Transport and TAG Synthesis Promotes Memory CD8+ T Cell Longevity. Cell 2015, 161, 750–761. [Google Scholar] [CrossRef] [PubMed]


| Comorbidity a | Entrez Gene ID/s b | Gene Symbol c | p-Value Min; Max d | p-Value Median e |
|---|---|---|---|---|
| Acute myeloid leukemia f | 3065; 256435; 51377; 6670; 5468; 57599; 56999; 10891; 4306; 9972; 1780; 55958; 23287; 1075; 84259; 50863; 4287; 123624; 641; 9491; 7109 | HDAC1; ST6GALNAC3; UCHL5; SP3; PPARG; WDR48; PPARGC1A; NR3C2; NUP153; KLHL9; AGTPBP1; CTSC; DCUN1D5; NTM; ATXN3; AGBL1; BLM; PSMF1; TRAPPC10 | 1.53 × 10⁻²²; 3 × 10⁻⁶ | 1.70 × 10⁻¹⁰ |
| Asthma g | 55289; 2181; 79993; 47 | ACOXL; ACSL3; ELOVL7; ACLY | 6.26 × 10−41; 4 × 10⁻⁷ | 3.94 × 10⁻²⁴ |
| 2181; 79993; 47 | ACSL3; ELOVL7; ACLY | 1 × 10−50; 6.41 × 10⁻⁹ | 1.69 × 10⁻¹⁰ | |
| 2520; 5578; 6196 | GAST; PRKCA; RPS6KA2 | 1 × 10−50; 6.41 × 10⁻⁹ | 3.21 × 10⁻⁹ | |
| 3122; 3127; 3117; 3119; 3120 | HLA-DRA; HLA-DRB5; HLA-DQA1; HLA-DQB1; HLA-DQB2 | 1 × 10−50; 6.41 × 10⁻⁹ | 4.72 × 10⁻²⁴ | |
| 2181; 79993 | ACSL3; ELOVL7 | 1.72 × 10⁻²³; 5.85 × 10⁻⁸ | 1 × 10⁻⁸ | |
| Atherosclerosis h | 6580; 6857 | SLC22A1; SYT1 | 2 × 10−43; 1 × 10⁻⁹ | 5 × 10⁻¹⁰ |
| 6580; 6564; 23446 | SLC22A1; SLC15A1; SLC44A1 | 2 × 10−43; 2.67 × 10⁻⁶ | 7 × 10⁻⁷ | |
| 3773; 5577; 6580; 6857 | KCNJ16; PRKAR2B; SLC22A1; SYT1 | 2 × 10−43; 1 × 10⁻⁹ | 1.2 × 10⁻¹⁰ | |
| 6580; 23446 | SLC44A1; SLC22A1 | 2 × 10−43; 2.67 × 10⁻⁶ | 1.33 × 10⁻⁶ | |
| 6580; 23446; 23457; 5577; 6564 | SLC44A1; SLC22A1; ABCB9; PRKAR2B; SLC15A1 | 2 × 10−43; 2.67 × 10⁻⁶ | 4 × 10⁻⁷ | |
| Bipolar disorder i | 11311; 23046; 26153; 25970 | VPS45; KIF21B; KIF26A; SH2B1 | 1 × 10⁻²⁴; 2 × 10⁻⁶ | 1 × 10⁻⁶ |
| Breast cancer f | 64682; 983 | ANAPC1; CDK1 | 1 × 10−50; 3 × 10⁻⁸ | 1.5 × 10⁻⁸ |
| 983; 23112 | CDK1; TNRC6B | 1 × 10−50; 9.99 × 10⁻³⁵ | 5 × 10⁻³⁵ | |
| 64682; 983 | ANAPC1; CDK1 | 1 × 10−50; 2 × 10⁻⁹ | 1 × 10⁻⁹ | |
| 23446; 57419; 9497 | SLC44A1; SLC24A3; SLC4A7 | 9.58 × 10−51; 9 × 10⁻⁶ | 3 × 10−45 | |
| 57419; 9497 | SLC24A3; SLC4A7 | 3 × 10−45; 9 × 10⁻⁶ | 4.5 × 10⁻⁶ | |
| Colorectal cancer f | 3915; 64759 | LAMC1; TNS3 | 6.36 × 10⁻¹⁴; 2 × 10⁻¹¹ | 1 × 10⁻¹¹ |
| 3915; 8936; 64759 | LAMC1; WASF1; TNS3 | 6.36 × 10⁻¹⁴; 1 × 10⁻⁶ | 2 × 10⁻¹¹ | |
| Heart failure h | 6570; 366 | SLC18A1; AQP9 | 2 × 10−44; 2 × 10⁻³⁵ | 1 × 10⁻³⁵ |
| Hypertension h | 57085; 27044 | AGTRAP; SND1 | 4 × 10⁻³⁴; 5 × 10⁻⁷ | 2.5 × 10⁻⁷ |
| 3752; 776; 783; 4633 | KCND3; CACNA1D; CACNB2; MYL2 | 1 × 10⁻²¹; 7 × 10⁻¹² | 6.59 × 10⁻¹⁶ | |
| 3752; 776; 783 | KCND3; CACNA1D; CACNB2 | 1 × 10⁻²¹; 1.31 × 10⁻¹⁵ | 1.08 × 10⁻¹⁷ | |
| 57085; 200734; 27044 | AGTRAP; SPRED2; SND1 | 4 × 10⁻³⁴; 5 × 10⁻⁷ | 2 × 10⁻⁷ | |
| Hypothyroidism j | 10213; 26275; 2131; 960; 8898; 113; 5296 | PSMD14; HIBCH; EXT1; CD44; MTMR2; ADCY7; PIK3R2 | 3 × 10−39; 3 × 10⁻¹⁰ | 2 × 10⁻¹⁷ |
| Interstitial lung disease g | 4583; 54472 | MUC2; TOLLIP | 7 × 10⁻³⁴; 4.45 × 10⁻¹³ | 2.23 × 10⁻¹³ |
| Kawasaki’s disease h | 55521; 6891; 208 | TRIM36; TAP2; AKT2 | 5 × 10⁻¹¹; 2 × 10⁻⁸ | 4 × 10⁻¹⁰ |
| 55521; 6981 | TRIM36; TAP2 | 5 × 10⁻¹¹; 2 × 10⁻⁸ | 1 × 10⁻⁸ | |
| Lung cancer f | 374986; 79888; 22876 | MIGA1; LPCAT1; INPP5F | 8 × 10⁻³⁵; 9 × 10⁻⁶ | 4 × 10⁻⁷ |
| Multiple sclerosis k | 942; 5602; 3575; 3123; 3119 | CD86; MAPK10; IL7R; HLA-DRB1; HLA-DQB1 | 6.08 × 10⁻²⁴; 1 × 10⁻¹¹ | 5 × 10⁻²⁰ |
| Obesity j | 25791; 5924 | NGEF; RASGRF2 | 1 × 10−50; 5 × 10⁻⁶ | 2.5 × 10⁻⁶ |
| 8648; 25791; 5915; 57698 | NCOA1; NGEF; RARB; SHTN1 | 1 × 10−50; 8 × 10⁻⁶ | 2 × 10⁻⁶ | |
| 25791; 57698 | NGEF; SHTN1 | 1 × 10−50; 8 × 10⁻⁶ | 4 × 10⁻⁶ | |
| 25791; 1062; 10788; 5924 | NGET; CENPE; IQGAP2; RASGRF2 | 1 × 10−50; 8 × 10⁻⁶ | 2.5 × 10⁻⁶ | |
| Ovarian cancer f | 114884; 22876 | OSBPL10; INPP5F | 8 × 10⁻³⁵; 2 × 10⁻⁶ | 1 × 10⁻⁶ |
| Pancreatic cancer f | 2263; 6776; 6774 | FGFR2; STAT5A; STAT3 | 1 × 10−50; 7 × 10⁻⁶ | 1 × 10⁻⁶ |
| Prostate cancer f | 22876; 55697 | INPP5F; VAC14 | 8 × 10⁻³⁵; 2 × 10⁻⁸ | 1 × 10⁻⁸ |
| 2629; 22876; 55697; 83394; 8714 | GBA; INPP5F; VAC14; PITPNM3; ABCC3 | 1 × 10−50; 2 × 10⁻⁶ | 2 × 10⁻⁸ | |
| Renal cell cancer f | 5581; 8793 | PRKCE; TNFRSF10D | 1.5 × 10⁻²⁵; 6 × 10⁻⁹ | 3 × 10⁻⁹ |
| Schizophrenia i | 8294; 8341; 3009 | HIST1H4I; HIST1H2BN; HIST1HIB | 5 × 10⁻²⁷; 2 × 10⁻²¹ | 9 × 10⁻²⁷ |
| 192669; 8294; 8341; 3009; 10919 | AGO3; HIST1H4I; HIST1H2BN; HIST1H1B; EHMT2 | 5 × 10⁻²⁷; 2 × 10⁻⁶ | 3.51 × 10⁻¹⁹ | |
| Small cell lung cancer f | 10919; 55466 | EHMT2; DNAJA4 | 5 × 10⁻²¹; 5 × 10⁻⁶ | 2.5 × 10⁻⁶ |
| Type 1 diabetes mellitus j | 10213; 3559 | PSMD14; IL2RA | 3.71 × 10⁻³¹; 4 × 10⁻¹⁸ | 2 × 10⁻¹⁸ |
| Unipolar depression i | 64326; 5500; 8347; 8294; 8348; 23345; 8379; 11064; 8945; 5702; 23279; 8655; 91750; 3837 | RFWD2; PPP1CB; HIST1H2BC; HIST1H4I; HIST1H2BO; SYNE1; MAD1L1; CNTRL; BTRC; PSMC3; NUP160; DYNLL1; LIN52; KPNB1 | 4 × 10⁻²⁵; 7 × 10⁻⁶ | 6.75 × 10⁻¹¹ |
| Comorbidity a | R-HSA Pathway ID b | Reactome Pathways c | p-Value Min; Max d | p-Value Median e | GENE2FUNC Overlapping Genes f |
|---|---|---|---|---|---|
| Acute myeloid leukemia g | 597592 | Post-translational protein modification | 1.2 × 10⁻⁴ | 1.2 × 10⁻⁴ | HDAC1, RFWD2, NCOA1, PSMD14, DYNC1I1 |
| Asthma h | 1222499; 75105; 881907; 202433; 389948; 75876; 202430 | Fatty acid metabolism; Fatty acyl-CoA biosynthesis and synthesis of very long-chain fatty acyl-CoAs; Gastrin-CREB signaling pathway via PKC and MAPK; Generation of second messenger molecules; PD-1 signaling; Translocation of ZAP-70 to immunological synapse | 2.72 × 10⁻¹⁰; 6.93 × 10⁻⁶ | 2.27 × 10⁻⁷ | HLA-DRA, HLA-DRB1; |
| Atherosclerosis i | 112310; 181430; 425407; 112315; 425366; 382551 | Neurotransmitter release cycle & Norepinephrine neurotransmitter release cycle; SLC-mediated transmembrane transport; Transmission across chemical synapses; transport of bile salts and organic acids, metal ions and amine compounds, transport of small molecules | 6.32 × 10⁻⁹; 4.18 × 10⁻⁴ | 4.36 × 10⁻⁶ | ND |
| Bipolar disorder j | 983231 | Factors involved in megakaryocyte development and platelet production | 1.8 × 10⁻⁶ | 1.8 × 10⁻⁶ | HDAC1, AGO3 |
| Breast cancer g | 176814; 174048; 176409; 174143; 179419; 174048; 113507; 5687128; 176412; 176408; 453276; 425407; 425393 | Activation of APC C and APC C: Cdc20 mediated degradation of mitotic proteins; Cyclin B; mitotic proteins; cell cycle proteins; cell cycle protein prior to satisfaction of cell cycle checkpoint; Phospho-APC C mediated degradation of Cyclin A; Phosphorylation and regulation of APC C between G1 S and early anaphase; E2F enabled inhibition of pre-replication complex formation; MAPK MAPK4 signaling; Regulation of mitotic cell cycle; SLC-mediated transmembrane transport; Transport of inorganic cations anions and amino acids oligopeptides | 3.57 × 10⁻¹¹; 3.32 × 10⁻⁵ | 1.34 × 10⁻⁵ | ANAPC1, PSMD14, AGO3 |
| Colorectal cancer g | 8875878; 6806834; 9006934 | MET promotes cell motility; Signaling by MET and receptor tyrosine kinases | 1.52 × 10⁻⁴; 5.67 × 10⁻⁴ | 3.6 × 10⁻⁴ | ND |
| Heart failure i | 382551 | Transport of small molecules | 4.77 × 10⁻⁵ | 4.77 × 10⁻⁵ | ND |
| Hypertension i | 5576891; 397014; 6802957; 6802952 | Cardiac conduction; Muscle contraction; Oncogenic MAPK signaling | 1.67 × 10⁻⁶; 3.03 × 10⁻⁴ | 3.70 × 10⁻⁵ | ND |
| Hypothyroidism k | 1430728 | Metabolism | 3.08 × 10⁻⁴ | 3.08 × 10⁻⁴ | HDAC1, NCOA1, PSMD14 |
| Interstitial lung disease h | 168249 | Innate immune system | 6.06 × 10⁻⁶ | 6.06 × 10⁻⁶ | CD44, PRKCE, PSMD14, HLA-DRA, HLA-DRB1 |
| Kawasaki’s disease i | 1280218; 983169; 168256 | Adaptive immune system & immune system; Class I MHC mediated antigen processing & presentation | 8.02 × 10⁻⁵; 5.06 × 10⁻⁴ | 2.93 × 10⁻⁴ | ANAPC1, PSMD14, CD86, TRIM36, HLA-DRA, HLA-DRB1, DYNC1I1 |
| Lung cancer g | 1483257 | Phospholipid metabolism | 1.06 × 10⁻⁴ | 1.06 × 10⁻⁴ | |
| Multiple sclerosis l | 1280215 | Cytokine signaling in immune system | 4.86 × 10⁻⁵ | 4.86 × 10⁻⁵ | FGFR2, CD44, PSMD14, CD86, HLA-DRA, HLA-DRB1 |
| Obesity k | 422475; 204998; 73887; 1266738; 416482; 9675108; 193648; 193704; 194840; 194315 | Axon guidance; Cell death signaling via NRAGE, NRIF, and NADE; Death receptor signaling; Developmental biology; G alpha (12/13) signaling events; Nervous system development; NRAGE signals death through JNK; P75 NTR receptor-mediated signaling; Rho GTPase cycle; Signaling by Rho GTPases | 5.78 × 10⁻⁷; 1.42 × 10⁻⁴ | 6.44 × 10⁻⁷ | ND |
| Ovarian cancer g | 1483257 | Phospholipid metabolism | 9.76 × 10⁻⁷ | 9.76 × 10⁻⁷ | ND |
| Pancreatic cancer g | 1226099 | Signaling by FGFR in disease | 2.4 × 10⁻⁴ | 2.4 × 10⁻⁴ | ND |
| Prostate cancer g | 556833; 1483255; 1660516 | Metabolism of lipids, PI; Synthesis of PIPs at the early endosome membrane | 1.78 × 10⁻⁵; 8.64 × 10⁻⁵ | 5.21 × 10⁻⁵ | ND |
| Renal cell cancer g | 109582 | Hemostasis | 1.71 × 10⁻³ | 1.71 × 10⁻³ | ND |
| Schizophrenia j | 2559583; 2559586 | Cellular senescence; DNA damage telomere stress induced senescence | 1.16 × 10⁻⁶; 2.07 × 10⁻⁶ | 1.61 × 10⁻⁶ | AGO3, ETS1, ANAPC1, EHMT2 |
| Small cell lung cancer g | 8953897; 2262752 | Cellular responses to external stimuli & stress | 1.05 × 10⁻³ | 1.05 × 10⁻³ | AGO3, ETS1, ANAPC1, PSMD14, EHMT2, DYNC1I1 |
| Type 1 diabetes mellitus k | 4086398; 9607240; 5683057; 5673001; 8878171 | ERK1 ERK2 pathway; FLT3 signaling, MAPK family signaling cascades; RAF MAP kinase cascade; Transcriptional regulation by RUNX1 | 2.77 × 10⁻⁴ | 2.77 × 10⁻⁴ | HDAC1, AGO3, PSMD14 |
| Unipolar depression j | 1640170 | Cell cycle | 9.12 × 10⁻⁵ | 9.12 × 10⁻⁵ | HDAC1, RFWD2, ANAPC1, PSMD14, MCM8, DYNC1I1 |
| Comorbidity a | Entrez Gene ID b | Gene Symbol c | Variant ID (rs#) d | Consequence e |
|---|---|---|---|---|
| Acute myeloid leukemia | 2263; 5602; 55289; 56999; 9972; 50863 | FGFR2; MAPK10; ACOXL; ADAMTS9; NUP153; NTM | 7090018, 2912759; 6838659; 4640633; 17524344; 4849120; 4849121; 13395354; 9868005; 13095235; 4371513; 4605539; 11714364; 9851598; 4716165; 4716167; 10949435; 2274136; 9383307; 6906499; 9350055; 9396787; 10949436; 1006066; 11753865; 16879902; 12199222; 11222631; 11222631; 11222647; 12278021; 7107326; 11222652; 11222653; 992564; 12419920; 12575010; 4937627 | IV; NMD; NC-TDGV; NC-TV; 3prime; MS |
| Asthma | 5581; 3575; 3117; 3123; 6891; 3118; 10919; 56999 | PRKCE; IL7R; HLA-DQA1; HLA-DRB1; TAP2; HLA-DQA2; EHMT2; ADAMTS9 | 12622534; 281508; 7717955; 6881270; 114798579; 146668528; 9272105; 3104369; 3104367; 9272346; 9270911; 2760995; 7760841; 4713555; 3997868; 151027268; 3104369; 3104367; 9272346; 41267086; 9866261 | IV; IV, NC-TV; DGV; UGV; IV, NMD; 3prime; NC-EV |
| Atherosclerosis | 114884; 50863 | OSBPL10; NTM | 1902341; 11827555 | IV; IV, NC-TV |
| Bipolar disorder | 25791; 783; 25970; 23345; 8379; 5578; 23046 | NGEF; CACNB2; SH2B1; SYNE1; MAD1L1; PRKCA; KIF21B | 778353; 2592118; 7071123; 3888190; 1203233; 17082664; 9371601; 7747960; 4523096; 4236274; 10275045; 4332037; 12668848; 3931398; 4721295; 1107592; 9895770; 2297909 | IV; IV, NC-TV; IV, NMD; DGV; UGV |
| Breast cancer | 9497; 57419; 23287 | SLC4A7; SLC24A3; AGTPBP1 | 4973768; 7619833; 113118767; 77674461 | 3prime; DGV; IV, NC-TV; IV; IV, NMD |
| Colorectal cancer | 4633; 3915; 64759; 57419; 2263 | MYL2; LAMC1; TNS3; SLC24A3; FGFR2 | 17550549; 6678517; 4546885; 10911251; 3801081; 113118767; 11200014 | IV; IV, NC-TV; DGV; IV, NMD |
| Heart failure | 64759 | TNS3 | 192154334 | IV; DGV |
| Hypertension | 776; 783; 84515 | CACNA1D; CACNB2; MCM8 | 3774427; 12715461; 9814480; 12258967; 4815879 | IV; IV, NC-TV; IV, NMD |
| Hypothyroidism | 113 | ADCY7 | 78534766 | IV; DGV; MS, NMD; NC-EV; UGV |
| Interstitial lung disease | 54472 | TOLLIP | 5743894; 5743890 | IV; IV, NC-TV; UGV; IV, NMD |
| Lung cancer | 79888; 8648 | LPCAT1; NCOA1 | 4406174; 62140840; 11902506; 6710503 | IV; IV, NMD; IV, NC-TV |
| Multiple sclerosis | 5296; 6774; 3575; 942; 3117; 5602; 3118; 3559 | PIK3R2; STAT3; IL7R; CD86; HLA-DQA1; MAPK10; HLA-DQA2; IL2RA | 11554159; 2293152; 6897932; 10063294; 6881706; 2681424; 3104373; 2040406; 72665771; 3104373; 2040406; 2104286; 3118470; 12722489 | DGV; IV; UGV; MS; NC-EV; IV, NMD; 3prime; IV, NC-TV |
| Obesity | 5296; 10437; 25970; 5915 | PIK3R2; IFI30; SH2B1; RARB | 11554159; 7498665; 1435703 | DGV; MS; NC-EV IV, NC-TV; UGV; IV, NC-TV; IV |
| Ovarian cancer | 114884 | OSBPL10 | 28568660 | IV; IV, NC-TV; DGV |
| Pancreatic cancer | 64759 | TNS3 | 73328514 | IV |
| Prostate cancer | 55697; 64759; 3752; 6580; 8379; 23112; 2263 | VAC14; TNS3; KCND3; SLC22A1; MAD1L1; TNRC6B; FGFR2 | 875858; 56232506; 2788612651164; 4646284; 527510716; 11704416; 9623117; 58133635; 12628051; 4821941; 11200014 | IV; IV, NC-TV; IV, NMD; DGV; UGV |
| Schizophrenia | 25791 | NGEF | 778371; 778353; 2944591 | DGV; IV; UGV |
| Type 1 diabetes mellitus | 3575; 3117; 3118; 3559 | IL7R; HLA-DQA1; HLA-DQA2; IL2RA | 6897932; 9272346; 927234661839660; 12722495; 706778; 10795791 | MS; IV; UGV; NC-EV; NMD; NC-TV |
| Unipolar depression | 25791; 783; 3123; 23345; 2131; 23279; 8379; 23046 | NGEF; CACNB2; HLA-DRB1; SYNE1; EXT1; NUP160; MAD1L1; KIF21B | 778353; 2799573; 7071123; 535777; 17082664; 9371601; 17506336; 11039409; 12668848; 1107592; 11514731; 2056477; 56072378; 3823624; 2297909 | IV; NMD; NC-TV; UGV; DGV |
Publisher’s Note: MDPI stays neutral with regard to jurisdictional claims in published maps and institutional affiliations. |
© 2021 by the authors. Licensee MDPI, Basel, Switzerland. This article is an open access article distributed under the terms and conditions of the Creative Commons Attribution (CC BY) license (https://creativecommons.org/licenses/by/4.0/).
Share and Cite
Beckman, M.F.; Mougeot, F.B.; Mougeot, J.-L.C. Comorbidities and Susceptibility to COVID-19: A Generalized Gene Set Data Mining Approach. J. Clin. Med. 2021, 10, 1666. https://doi.org/10.3390/jcm10081666
Beckman MF, Mougeot FB, Mougeot J-LC. Comorbidities and Susceptibility to COVID-19: A Generalized Gene Set Data Mining Approach. Journal of Clinical Medicine. 2021; 10(8):1666. https://doi.org/10.3390/jcm10081666
Chicago/Turabian StyleBeckman, Micaela F., Farah Bahrani Mougeot, and Jean-Luc C. Mougeot. 2021. "Comorbidities and Susceptibility to COVID-19: A Generalized Gene Set Data Mining Approach" Journal of Clinical Medicine 10, no. 8: 1666. https://doi.org/10.3390/jcm10081666
APA StyleBeckman, M. F., Mougeot, F. B., & Mougeot, J.-L. C. (2021). Comorbidities and Susceptibility to COVID-19: A Generalized Gene Set Data Mining Approach. Journal of Clinical Medicine, 10(8), 1666. https://doi.org/10.3390/jcm10081666