1. Introduction
One of the primary indications for dynamic renal scintigraphy (DRS) is the diagnosis of obstructive uro/nephropathy. Typically, this examination is assessed qualitatively (visually) and quantitatively, using parameters such as differential renal function (split function—SF), time of the peak of renographic curve (T
MAX), and time of renographic curve reaching to half the peak value (T
1/2) [
1]. However, SF only assesses relative function of each kidney, while the reliability of time parameters is limited and depends, for example, on the method and speed of radiopharmaceutical administration or on the patient’s hydration level.
For this reason, it is necessary to study additional, reliable, and reproducible quantitative parameters that would allow the assessment and monitoring of renal function in absolute values.
Processing units of modern gamma cameras usually have software allowing determination of
99mTc-diethylenetriaminepentaacetic acid (
99mTc-DTPA) clearance for the determination of glomerular filtration rate (GFR) or
99mTc-mercaptoacetyltriglycine (
99mTc-MAG
3) clearance for the determination of tubular extraction rate (TER) based on DRS study (camera-based clearance). These procedures were developed by Schlegel et al. for
131I-orthoidohippurate (
131I-OIH) [
2] and by Gates for
99mTc-DTPA [
3] and were later adapted also for
99mTc-MAG
3. These methods are more accessible than the most accurate and precise radioisotope technique for determining GFR based on a multisample clearance of
99mTc-DTPA. However, their accuracy is being questioned and they require taking into account additional information, such as precise measurement of the activity of radiopharmaceutical administered to the patient or measuring depth of kidneys in order to correct the attenuation of radiation by tissues located between the camera detector and the kidney [
4]. Perhaps this is why camera-based clearance methods have not yet found wider application in routine diagnostics. Protocol for the calculation of
99mTc-ethylenedicysteine (
99mTc-EC) camera-based clearance was not developed yet.
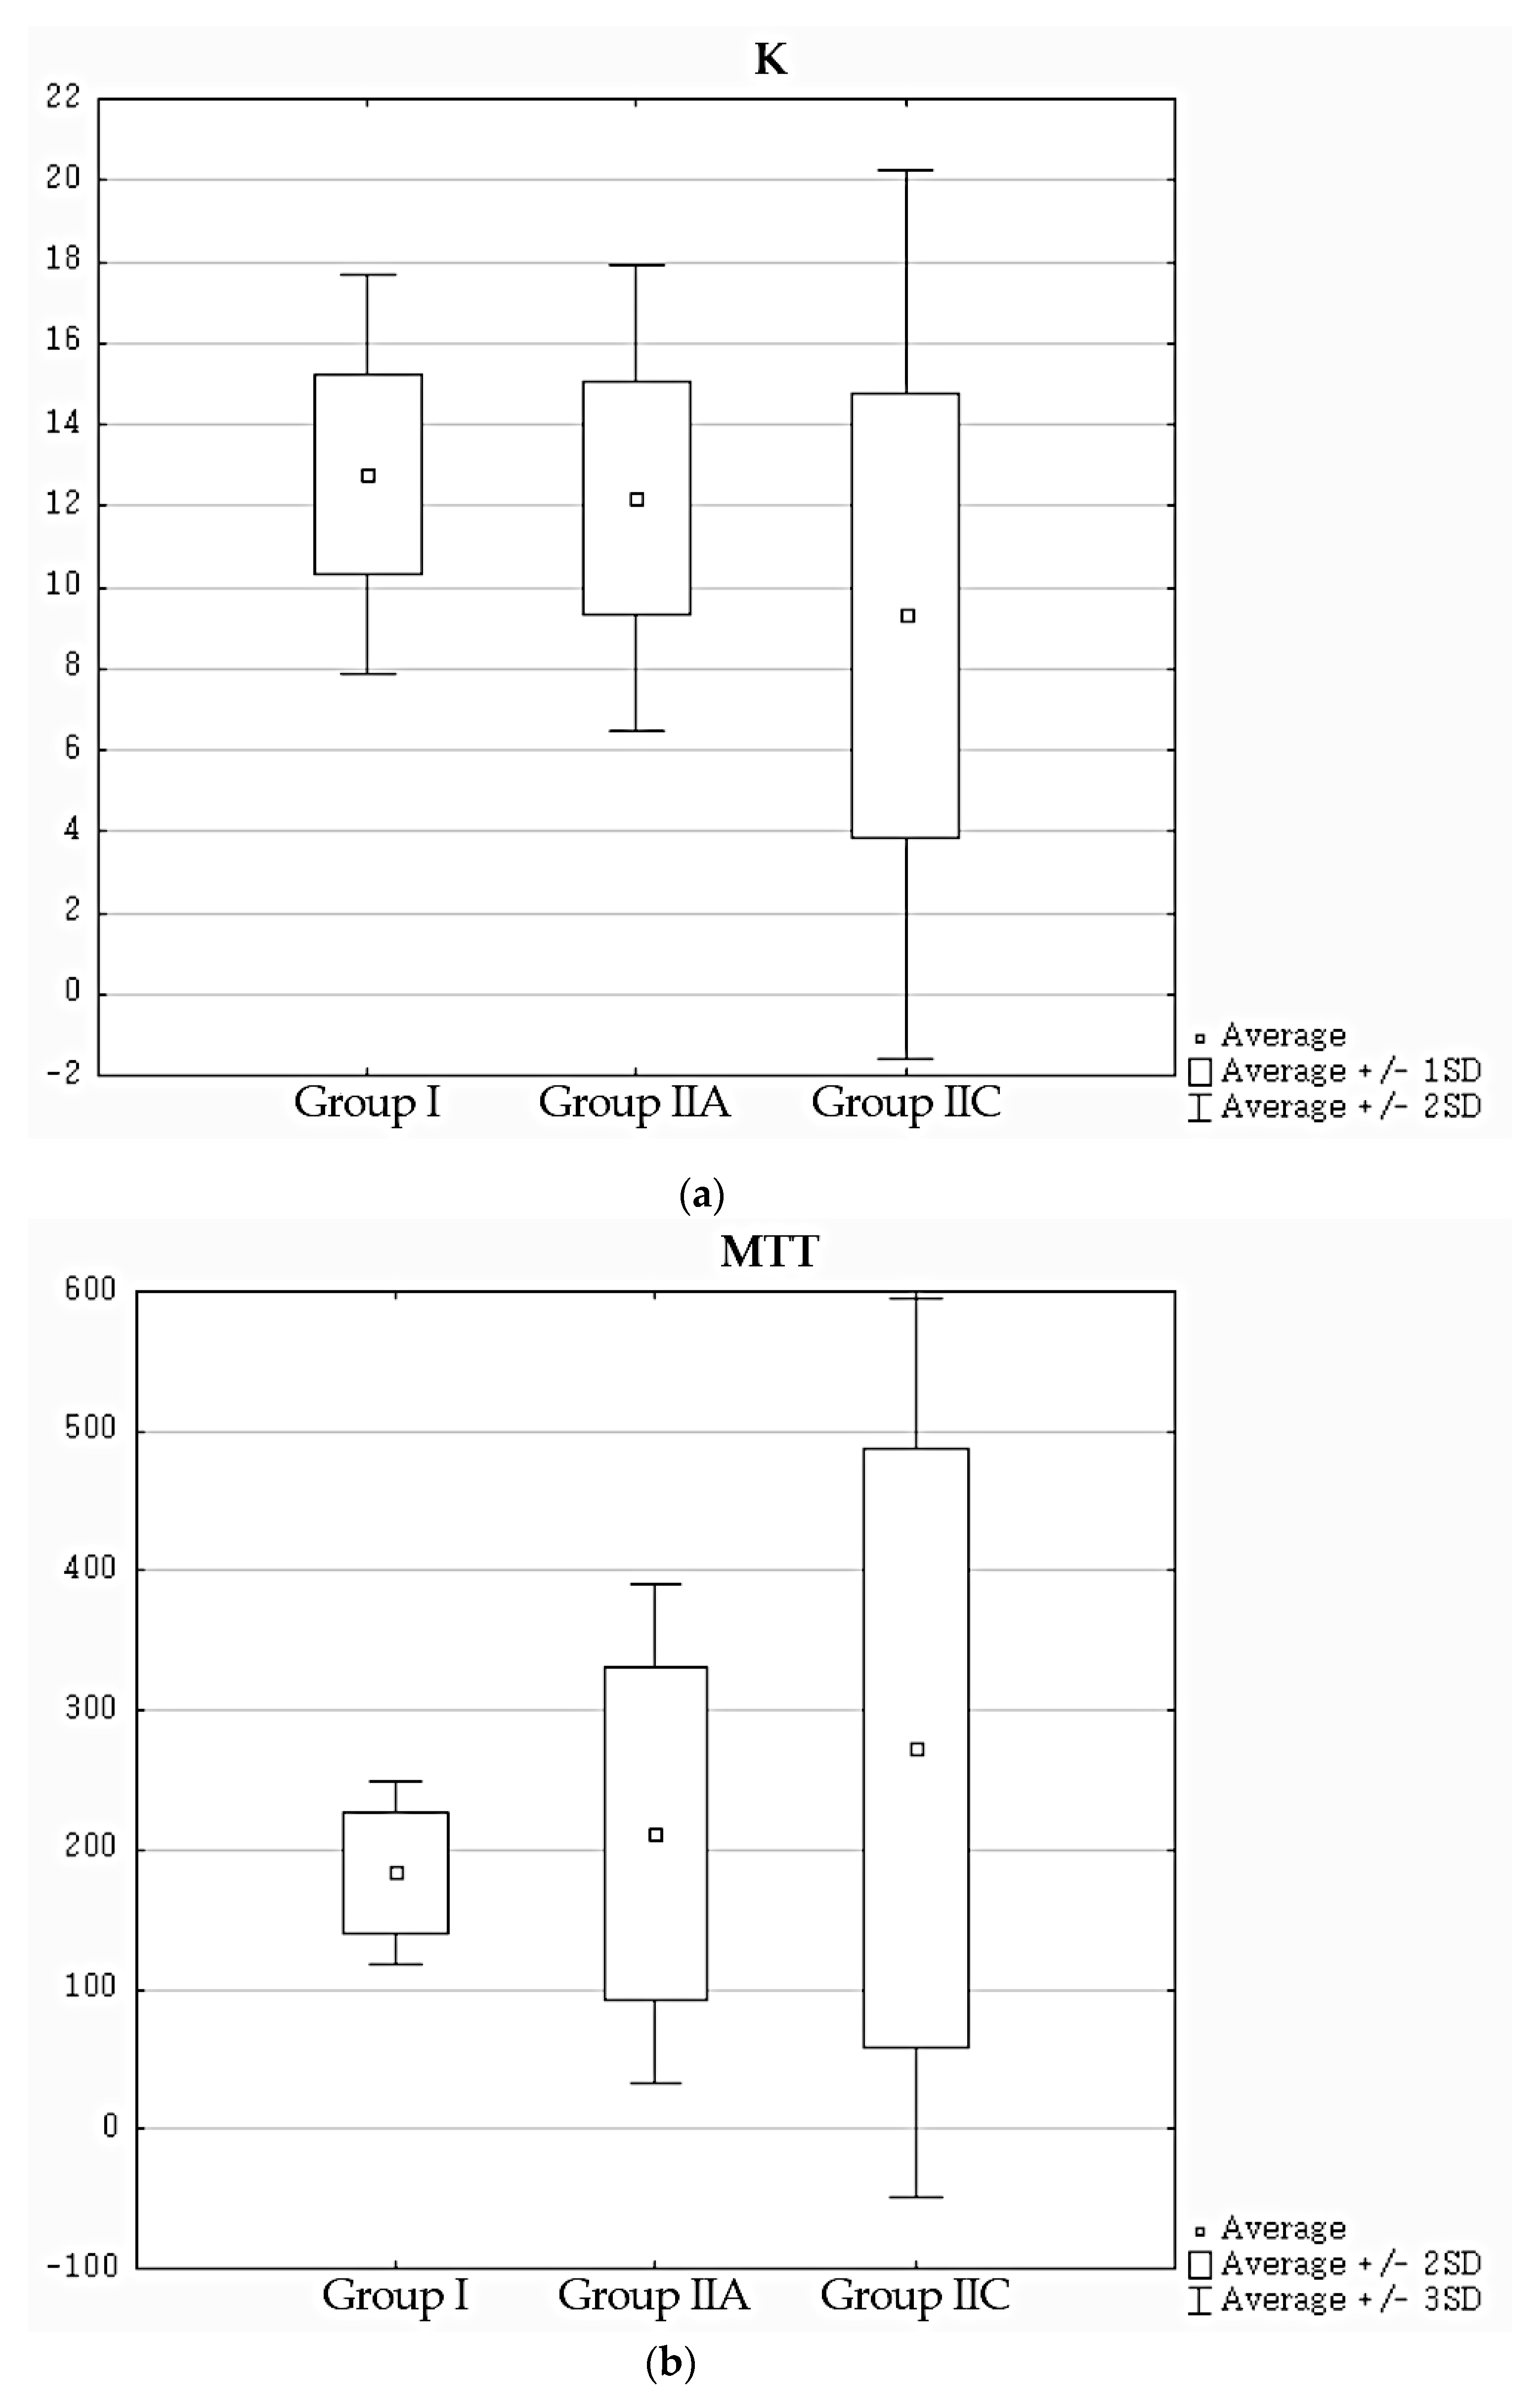
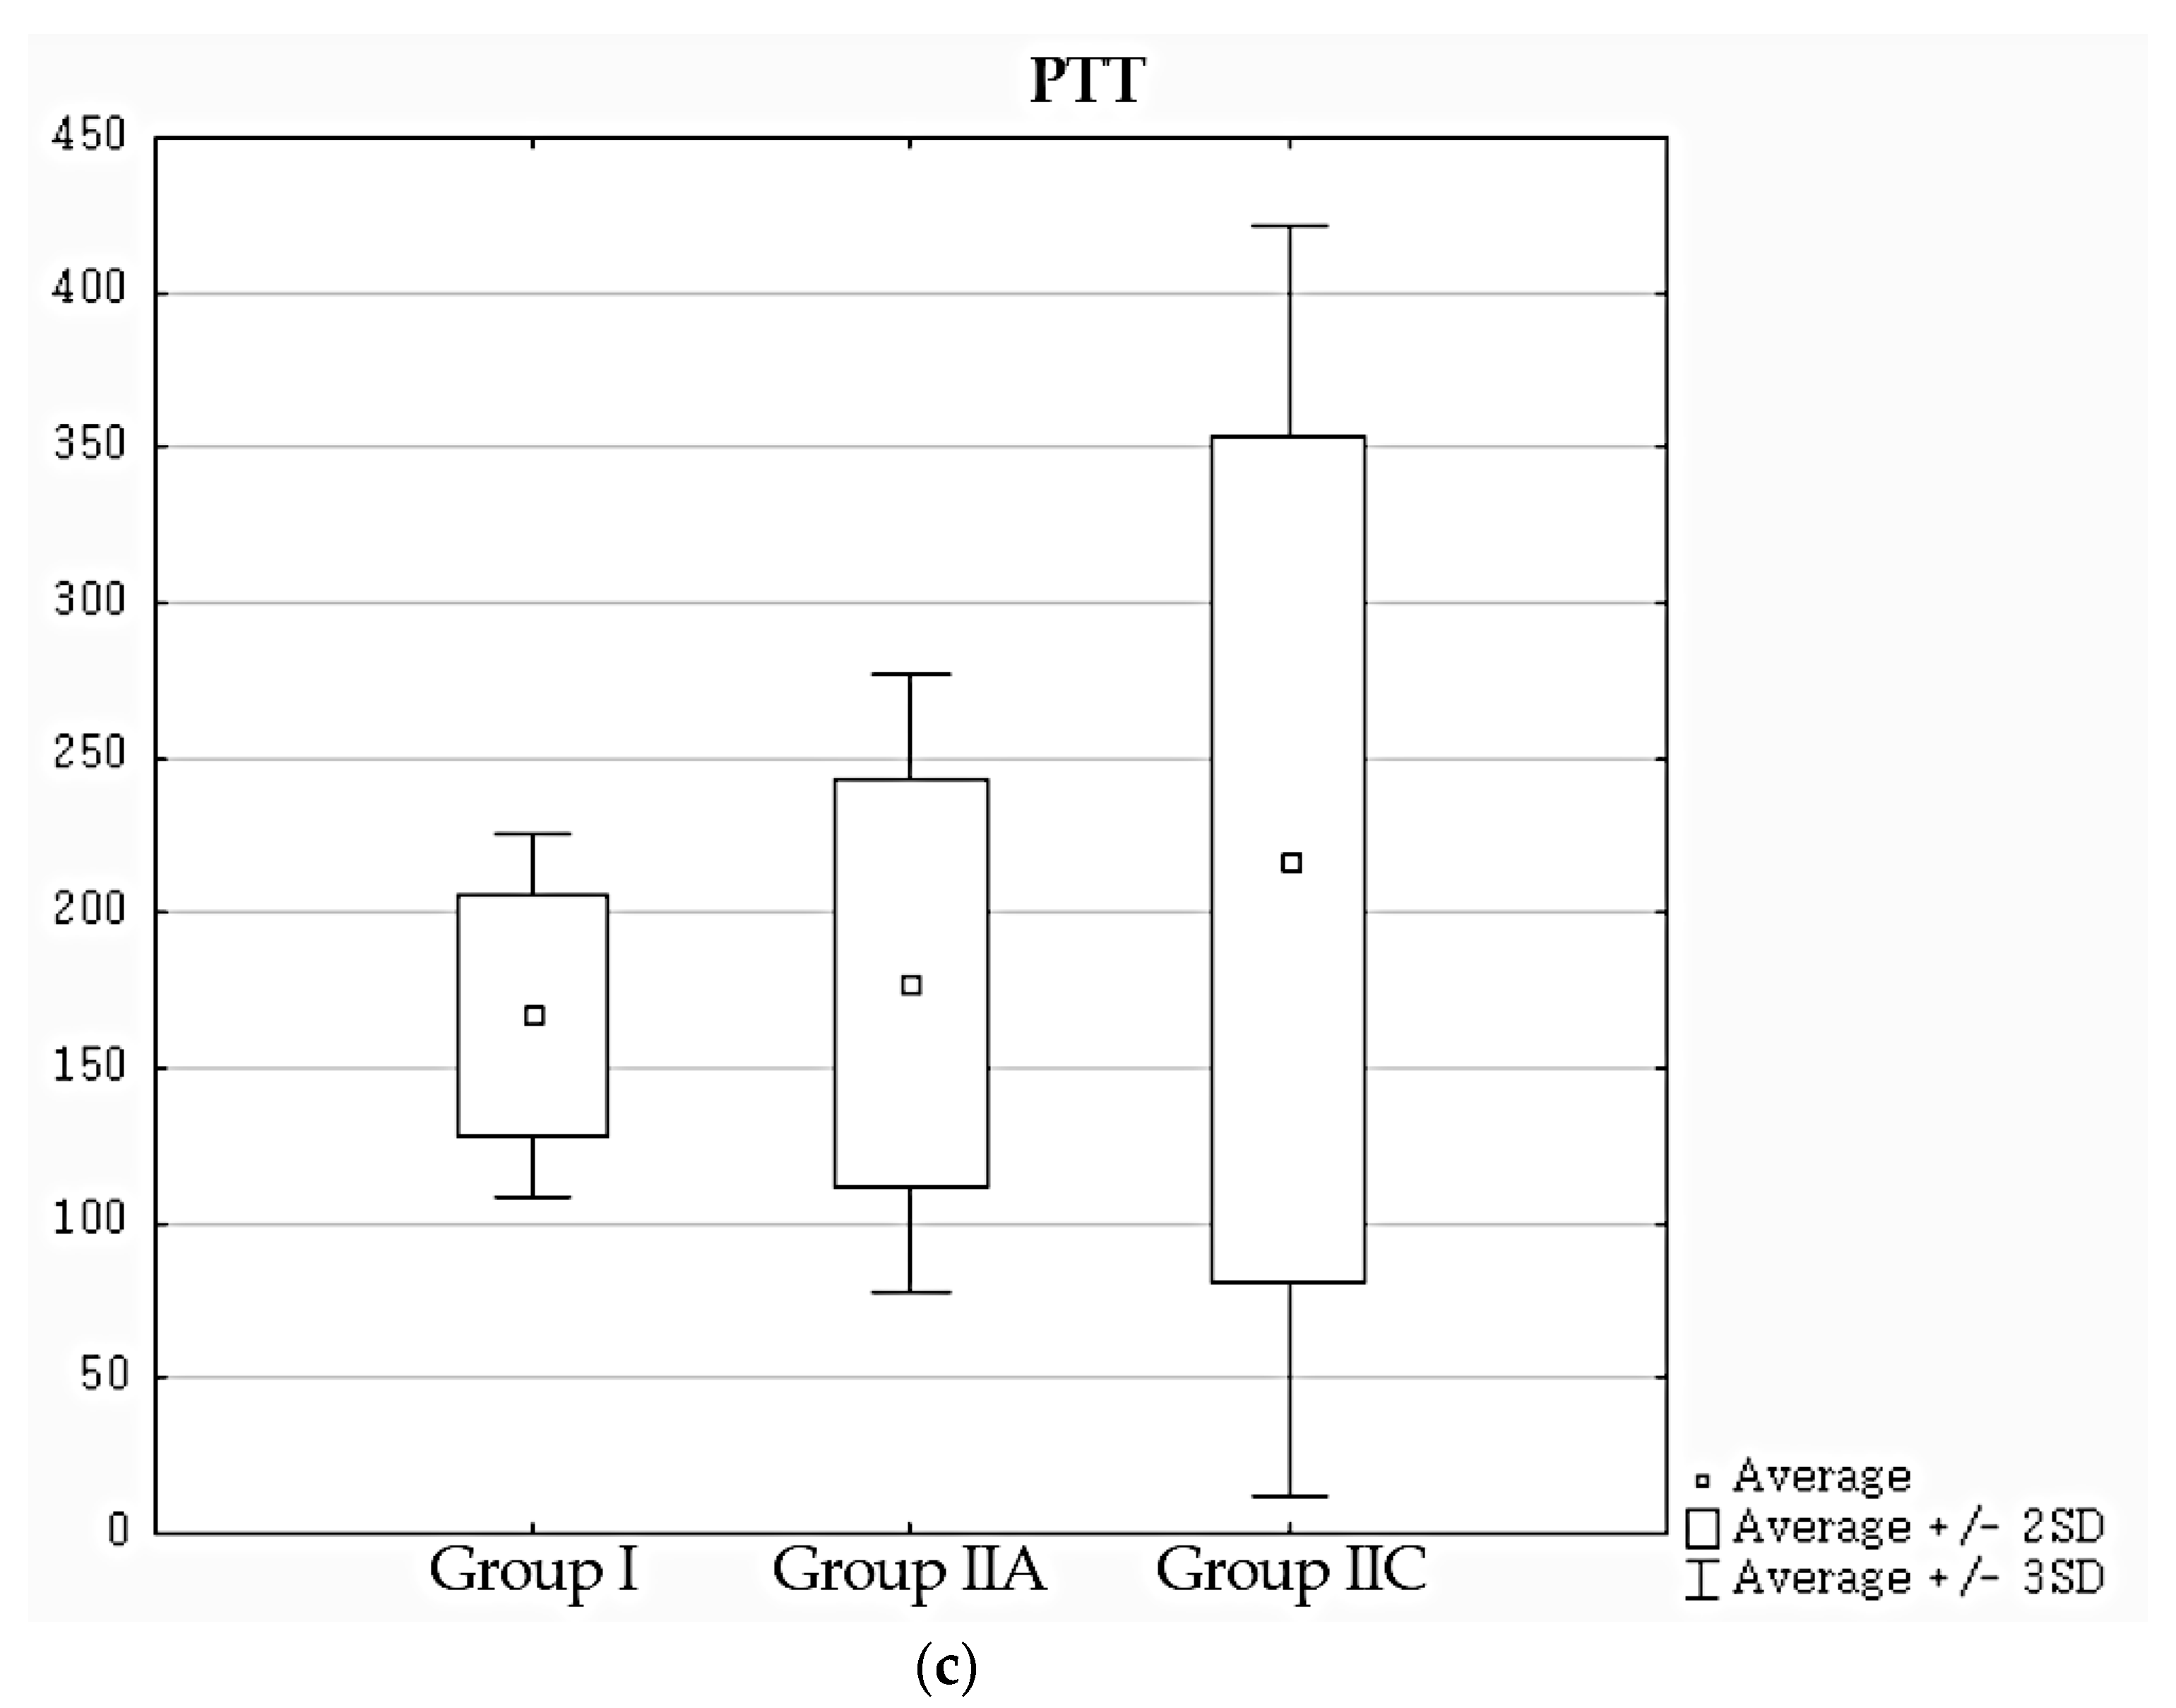
The aim of this study was to assess diagnostic potential of three different parameters allowing the assessment of renal function in DRS in absolute values, generated using an original software developed in our Department. These are as follows: an original parameter-uptake constant (K), proportional to the clearance function of a kidney, as well as transit time of radiopharmaceutical through the whole kidney (mean transit time—MTT) and its cortex (parenchymal transit time—PTT).
2. Experimental Section
2.1. Material
The study included a total of 226 people aged 18–84 years (mean: 53), divided into two groups.
Group I—normative, consisted of 20 healthy volunteers (40 kidneys). In this group, ultrasound of the urinary system was performed and serum levels of urea and creatinine were determined on the same day as the DRS study. The criteria for inclusion into group I were as follows: no history of previous or ongoing urinary system diseases or other diseases that could lead to impaired renal function (such as systemic lupus, diabetes, or uncontrolled hypertension); the ultrasound examination of the kidneys showed no features of congenital anomalies, urolithiasis, hydronephrosis, scars or other focal lesions (including cysts), and the results of biochemical tests (serum urea and creatinine levels as well as estimated GFR (eGFR) calculated from Chronic Kidney Disease Epidemiology Collaboration (CKD-EPI) formula) were within normal range.
Group II consisted of 206 adult patients, who were routinely examined at our Department in years 2015–2019, selected retrospectively based on archived scintigraphic data. Patients with uncontrolled diabetes or hypertension and patients with suspicion of renovascular hypertension referred for DRS with Captopril test were excluded from the study. This group included 3 subgroups:
IIA—62 patients (124 kidneys) with low probability of obstructive uro/nephropathy, whose renal function was assessed as normal based on routine DRS evaluation
IIB—92 patients (173 kidneys; some patients had only one functioning kidney), whose medical records had up-to-date serum creatinine results (measured no more than 2 weeks before DRS)
IIC—61 patients (79 kidneys) with no or only trace function of one of the kidneys (SF < 5%) or bilateral obstructive uropathy, where SF values are unreliable (
Table 1).
2.2. DRS Protocol
All volunteers and patients underwent DRS performed according to the routine protocol used in our Department. All subjects drank 0.5 L of water approximately 30 min before the examination and urinated just before radiopharmaceutical injection [
1]. DRS was performed in supine position with GE Healthcare scintillation cameras: Infinia Hawkeye 1, Infinia Hawkeye 4 or Optima NM/CT 640, equipped with low-energy general purpose collimators (LEGP), after administration of standard activity of 111 MBq
99mTc-EC. Field of view covered both the kidneys and the heart. Image acquisition was performed in posterior view, using 128 × 128 matrix. In patients whose renographic curves in the base study remained above 30% of the peak value up to the 20th minute of the study, DRS was extended by a diuretic test performed according to the “F + 20” protocol and image acquisition was continued for additional 10 min [
5].
Initial evaluation of all studies, performed by the same nuclear medicine specialist, consisted of visual assessment of sequential, 2 min scintigraphic images and analysis of standard quantitative parameters—SF, TMAX, and T1/2. In group II, archived medical records were also analyzed, and patients with current serum creatinine level results were qualified to subgroup IIB.
Due to the retrospective character of the study and sometimes incomplete clinical data in archived documentation, further classification of kidneys was based only on the standard evaluation of scintigraphic data. Kidneys with features of obstructive uropathy or nephropathy were distinguished based on the following criteria. No decrease of the renographic curve (“cumulative curve”) or its decrease by less than 50% of the peak value after the diuretic test, in the absence of the features of obstructive nephropathy described below, was classified as a feature of obstructive uropathy. Kidneys meeting at least two of the following three criteria were classified as nephropathic: SF < 42%, TMAX > 6 min, and presence of uptake defects in the peripheral part of the kidney in the visual assessment of sequential images of uptake phase (between 2nd and 3rd minute of the study), performed by two experienced physicians (determined by consensus). At least two criteria are required, because one criterion can be present in normal kidneys (e.g., a small, but properly functioning kidney can have SF < 42%). On the basis of these criteria, patients were classified into subgroups IIA and IIC (independent from subgroup IIB).
2.3. Additional Post-Processing
Further analysis of scintigraphic data (post-processing) of each volunteer and patient was carried out by the same nuclear medicine specialist with an open-source program—ImageJ—using an original plug-in developed in our Department. The program automatically summed scintigraphic images in the posterior view from the base DRS study (without the diuretic test) to 60 20 s images. Each of the images was then smoothed twice with a 3 × 3 mask linear filter [
6].
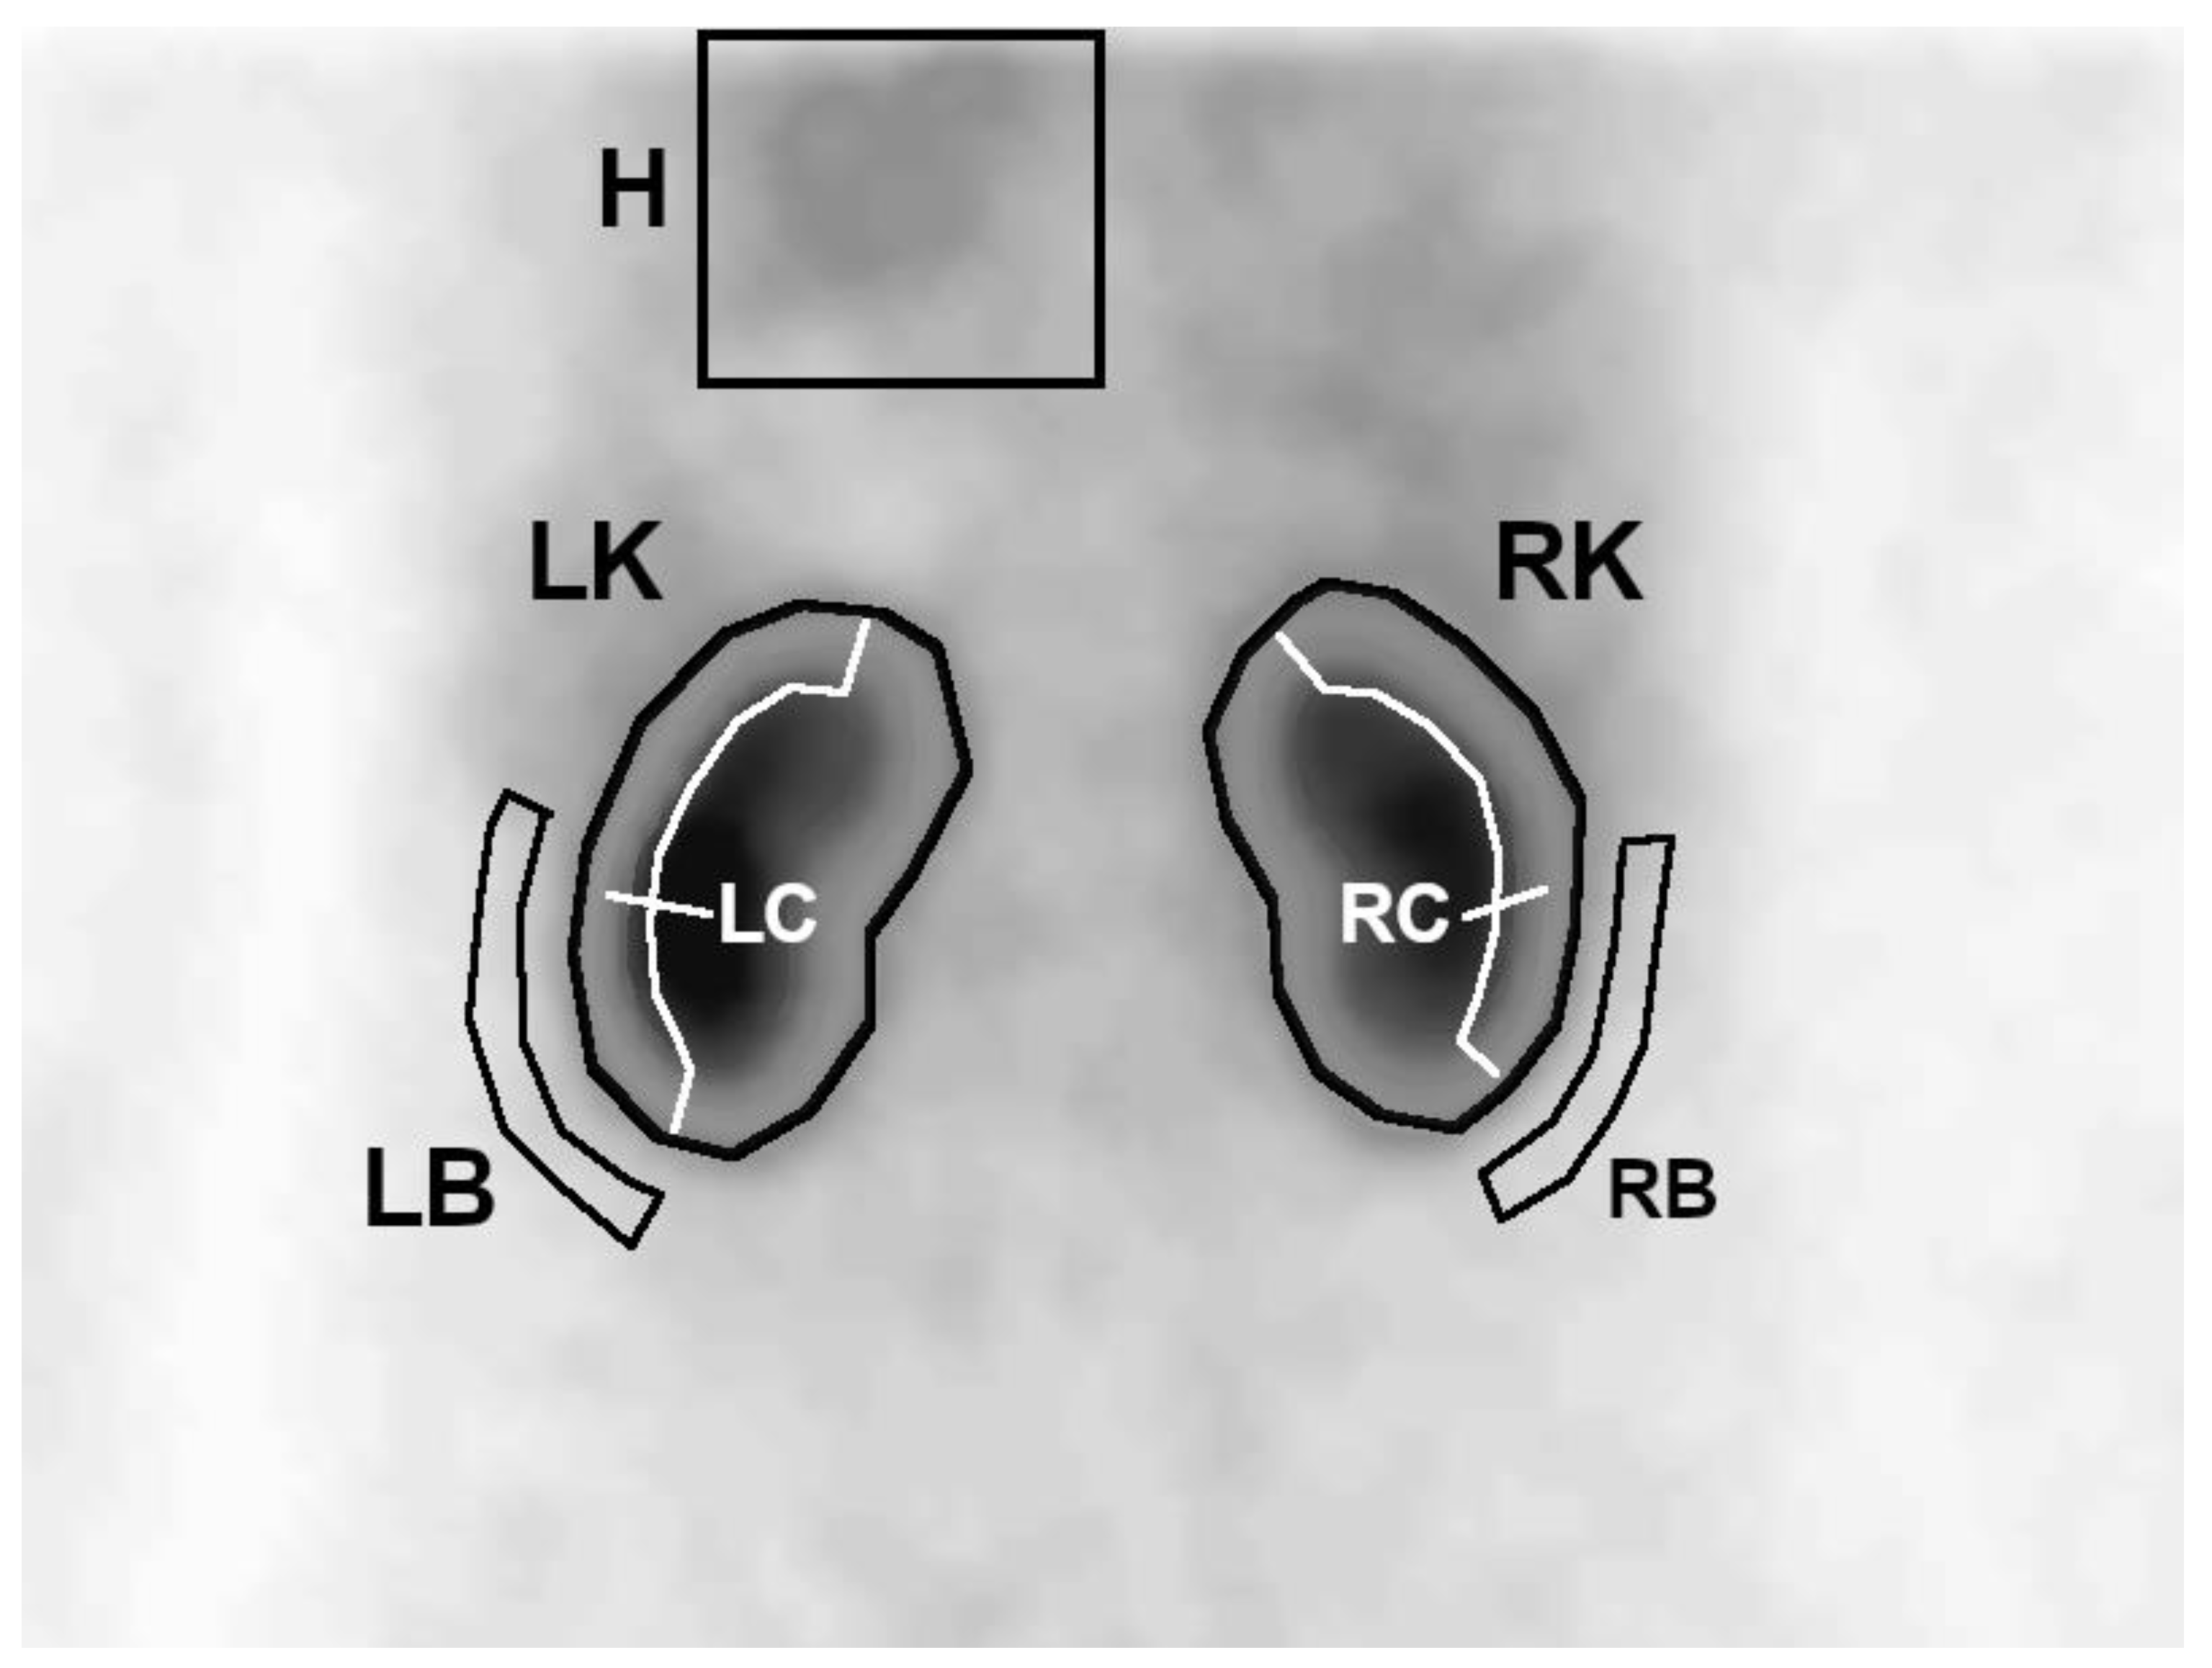
On the first summed image, a region of interest (ROI) covering the left ventricle with a large margin of background was determined. Then, on summed images from the uptake phase, whole kidney ROIs were generated semiautomatically—the program plotted an area with activity higher than the threshold value, which was set manually so that the contoured area covered the whole kidney. In the next step, 3-pixel-wide ROIs of the cortical layer (parenchyma) and background were automatically generated for each of the kidneys, based on the previously plotted whole kidney ROIs (
Figure 1).
Due to poor visibility of some small and/or nephropathic kidneys on 20 s images, in some cases it was necessary to plot the whole kidney ROI by hand and manually correct automatically determined parenchymal and background ROIs.
These ROIs were then used to generate time–activity curves showing the concentration of the radiopharmaceutical in the heart H(t), kidneys R(t), and their parenchyma Rc(t). The cardiac curve was generated from 20 pixels, with the highest activity selected automatically from the large heart ROI. Remaining curves were determined as a sum of counts in a given ROI to time.
This post-processing was performed again, using the same procedure, by another, independent specialist for patients from subgroup IIB.
Uptake constant K was determined based on the Rutland space [
6,
7]. It is a space described by the ratio of variables forming the renal and cardiac curves. In the first phase of DRS examination (uptake phase—between 2nd and 3rd minutes), the distribution of points in this space is approximated by a straight line described by the following equation:
where
R(
t)—background-corrected renographic curve,
H(
t)—background-corrected cardiac curve,
F—blood background subtraction factor, and
K—uptake constant (fraction of blood activity taken up by the kidney per time unit).
According to Rutland’s theory, K represents clearance function of the kidney, although only in proportional values, hence it is a unitless parameter.
Renal R(t), parenchymal Rc(t), and cardiac H(t) curves were used for deconvolution analysis. Each of the R(t) and Rc(t) curves were corrected by subtracting the background activity (calculated as mean counts in the background ROI multiplied by the size of kidney ROI). MTT and PTT were determined from the curves plotted in this way, using matrix deconvolution technique.
2.4. Statistical Analysis
The data were described by means of simple descriptive statistics of location and dispersion (mean, median, percentage, range, and standard deviation). Normality of distributions was verified by Shapiro–Wilk’s test. Normative values for analyzed parameters with confirmed normal distributions were assessed as mean ± 2 or 3 standard deviations in the group of healthy adults. Distributions of selected quantitative parameters, some of which were not normally distributed, were compared between different groups by nonparametric Mann–Whitney U test.
Diagnostic performance of parameters of interest was evaluated by sensitivity, specificity, and inter-observer reproducibility. Relations between parameters of interest were assessed using nonparametric Spearman’s rank correlation coefficient and coefficient of determination r2. Agreement of results was analyzed using Cohen’s kappa coefficient.
In all analyses, statistical significance was considered achieved for a value of p ≤ 0.05.
Calculations were performed by means of Statistica v13.1 and LibreOffice v6.3 software.
2.5. Analysis of Generated DRS Parameters
Parameters K, MTT, and PTT in subgroup IIB (n = 173 kidneys) were determined by two independent operators. Correlation of results obtained by both operators was used as a measure of reproducibility of determination of each parameter. The agreement of results obtained by two independent operators (values within normal limit vs. values below or above norm) was also assessed.
In order to assess reliability of normative values of assessed parameters, determined in the group of healthy volunteers, their specificity was determined in a group of patients without features of obstructive uro/nephropathy in routinely evaluated DRS (IIA). Differences between mean values of assessed parameters in the above-mentioned groups were also analyzed.
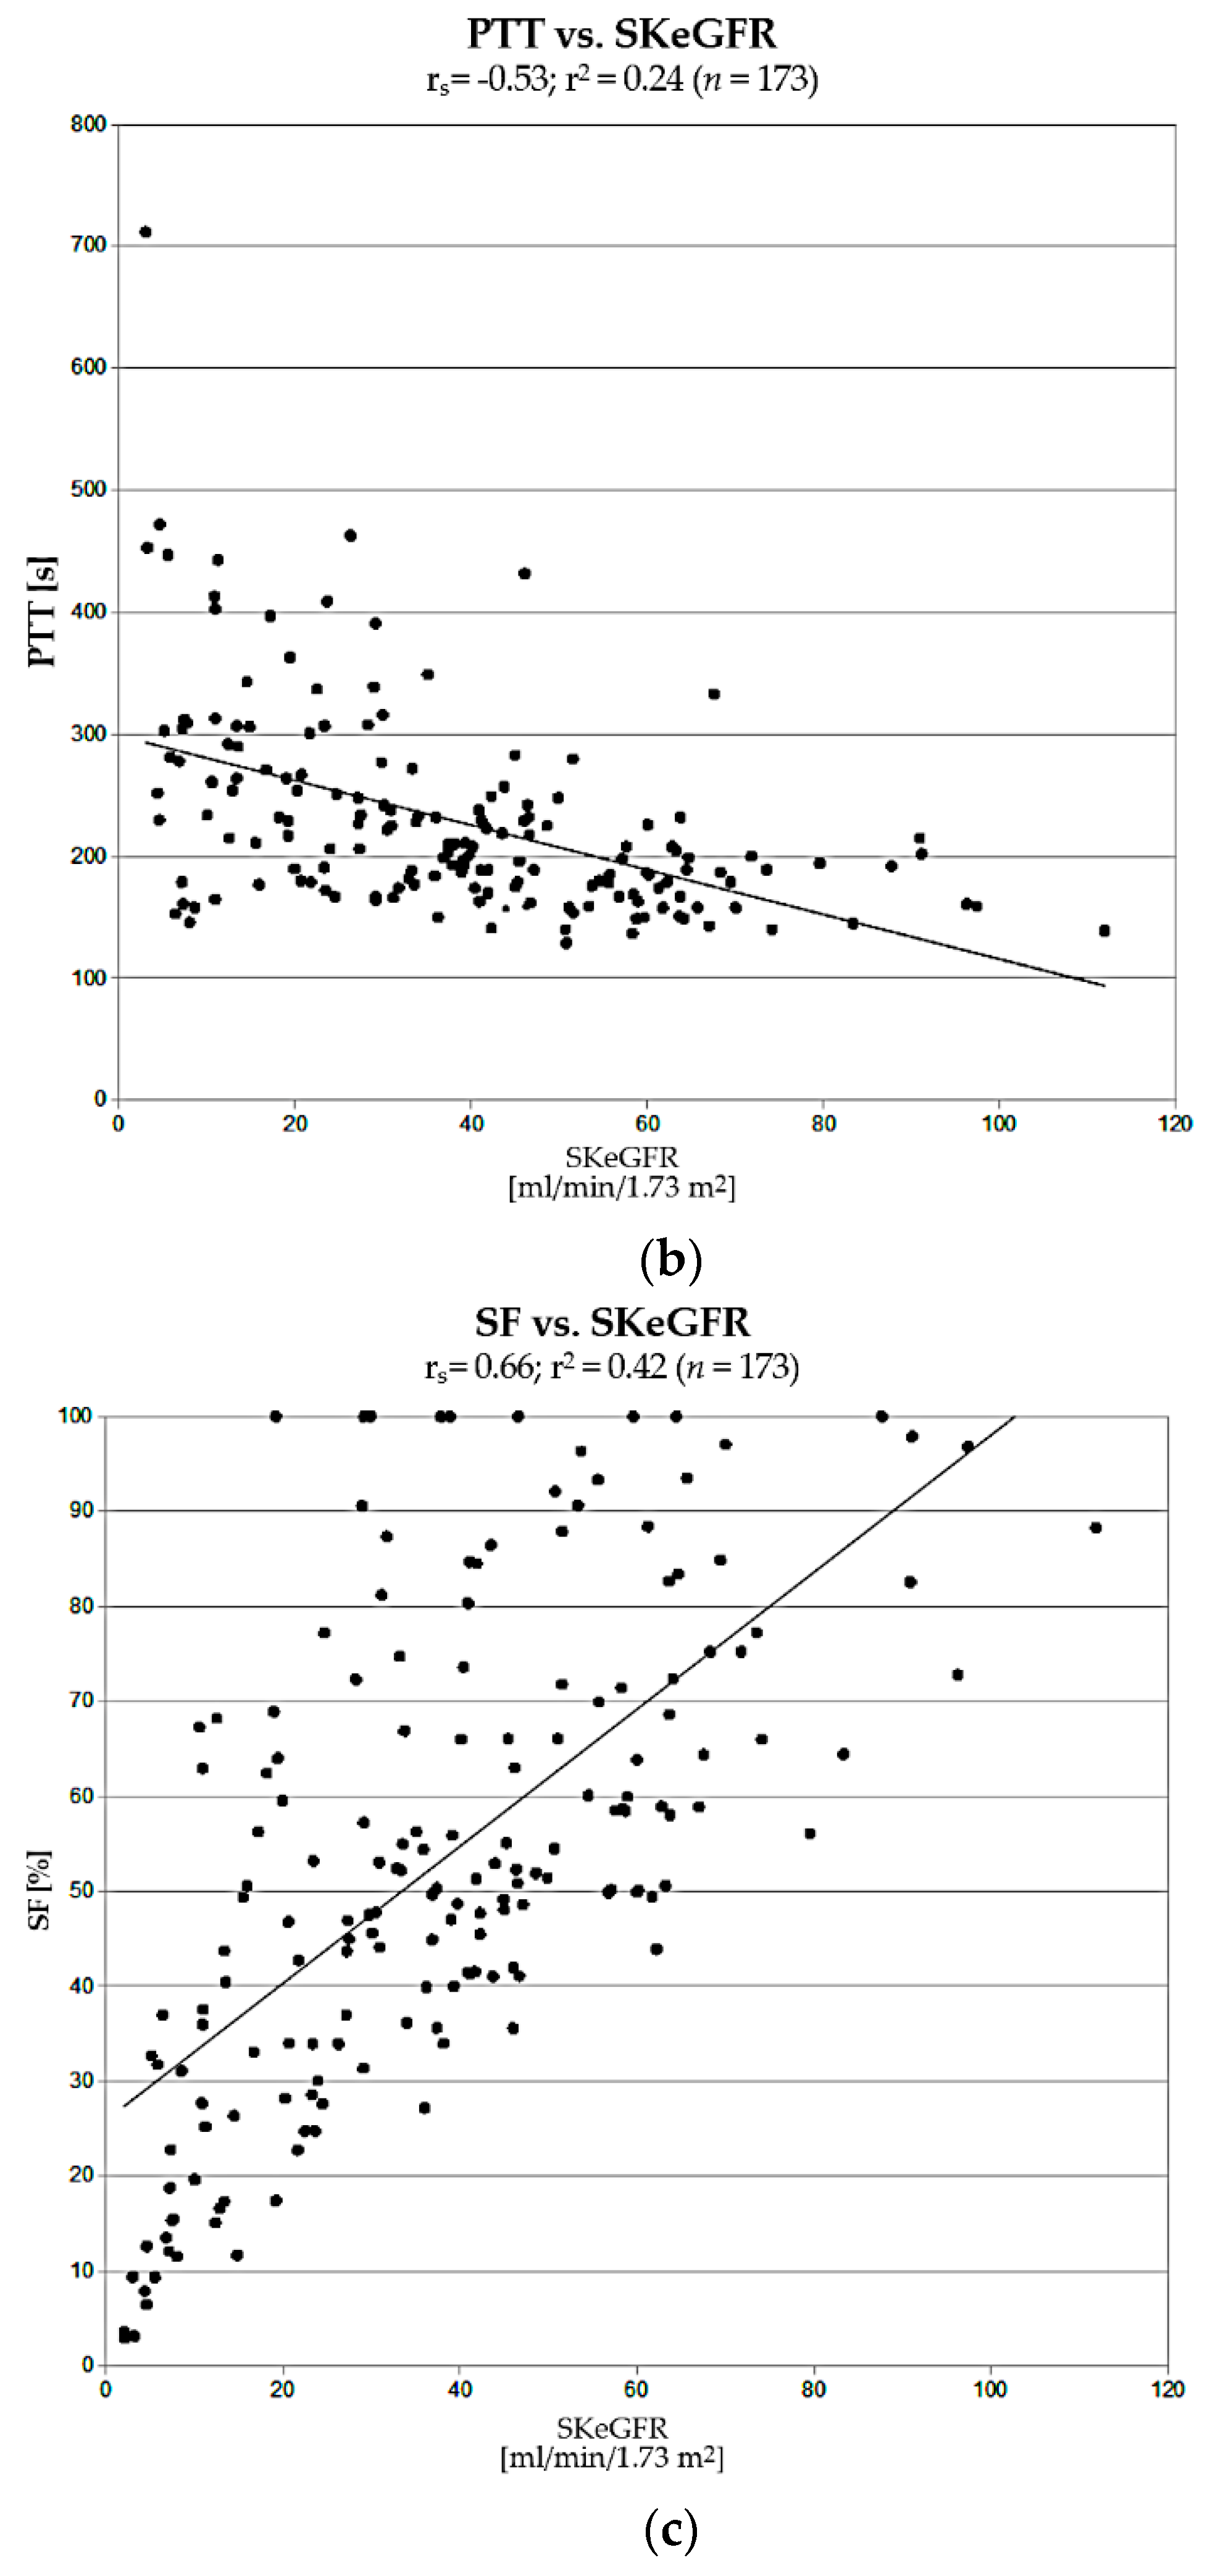
Next, in group IIB, correlation of K, PTT, and SF with estimated GFR of each kidney (single-kidney eGFR—SKeGFR) was assessed. eGFR was calculated based on the current serum creatinine level using CKD-EPI formula, recommended by the guidelines of the international work group—Kidney Disease: Improving Global Outcomes (KDIGO) [
8]. Then, its value was multiplied by the differential renal function of each kidney in DRS.
MTT was not compared with SKeGFR, because its value is influenced by both renal uptake function and the efficiency of urine outflow to the bladder. Instead, diagnostic efficacy of MTT in the diagnosis of obstructive uropathy was characterized by basic parameters of the diagnostic test—sensitivity and specificity, with diuretic test used as a reference method.
In a group of patients with single functioning kidney or features of bilateral uropathy (IIC), a comparative differential analysis of obstructive uro/nephropathy was performed based on standard and assessed DRS parameters.
4. Discussion
In clinical practice, DRS is the most commonly used radioisotope technique in the diagnosis of urinary system. Despite numerous advantages, however, it has some limitations that can be eliminated by supplementing the standard evaluation of the study with additional parameters that enable an assessment of renal function in absolute values. Techniques that allow such evaluation using only scintigraphic data obtained in DRS, without the need to collect blood or urine samples or perform other additional tests, are especially valuable. Several protocols have been developed to determine renal clearance of radiopharmaceuticals in this way, and some of them have been integrated into software of modern gamma cameras. However, these camera-based techniques require acquisition of additional—nonstandard—data, such as the exact activity of the injected radiopharmaceutical (taking into account activity remaining in the syringe after administration) or measurement of the depth of the kidneys. This requires modifications of the routine DRS protocol and extends and complicates the course of the entire study. Moreover, these protocols have not yet been adapted for DRS performed with 99mTc-EC—the latest radiopharmaceutical introduced to the diagnostics of the urinary system.
Software developed in our Department allows determination of additional quantitative parameters describing kidney function in absolute values—original parameter, uptake constant (K), mean transit time (MTT), and parenchymal transit time (PTT)—without the need of any modifications to the routine DRS protocol.
Our method of calculating K in DRS performed with
99mTc-EC was based on Rutland’s theory [
7]. According to its assumptions, the parameter K is proportional to the clearance of
99mTc-EC and thus to the effective renal plasma flow (ERPF) of a given kidney. In 1985 Rehling et al. proposed a method, similar to ours, of determining iptake index (UI)—a parameter proportional to
99mTcDTPA clearance (thus GFR of a given kidney). Rehling et al. proved that UI correlates very closely with GFR value (determined with the radioisotope method based on the multisample clearance of
99mTcDTPA)—r
s = 0.97 [
9].
It should be emphasized that in the Equation (1), which is the basis of this method, cardiac curve—H(t)—appears three times, so it has a decisive influence on the value of K (which is the slope of the function described by this equation). In his work, Rehilng also emphasizes the important role of the vascular background chosen to generate the cardiac curve, necessary to calculate the UI. Therefore, susceptibility of the method of generating this curve to errors resulting from the subjective factor should be minimized. For this purpose, in our work cardiac curve was generated from the sum of counts in 20 pixels, with the highest values in the large ROI covering the area of the heart. Additionally, background-correction of renographic curves was applied in this study, using automatically generated background ROIs.
This study also assessed the diagnostic value of MTT and PTT, other parameters supplementing routine DRS examination, after optimization of the methodology of their determination. These parameters are assumed to quantitatively represent the transport function of the kidney, based on the transit times of the radiopharmaceutical through the whole kidney and its parenchyma. However, methods of their determination are prone to errors [
10,
11,
12]. In this study, MTT and PTT were determined with matrix deconvolution technique. There are several alternative methods for determining these parameters described in literature [
13,
14,
15,
16,
17], but there is no clear consensus in regards to their diagnostic usefulness. Apart from positive assessments of the importance of these parameters, there are a number of reports questioning their usefulness [
12,
18,
19,
20].
Results of our earlier research showed that methodology of MTT and PTT determination, based on the matrix deconvolution technique, used previously in our Department, already generated reproducible results of MTT. However, reproducibility of PTT determination by different operators (inter-observer reproducibility) was significantly lower [
21].
Automation of ROI plotting and automatic selection of pixels used to generate the cardiac curve, used in the current study, limited the influence of the subjective factor on the determination of both PTT and MTT as well as K practically exclusively to the manual selection of the threshold for semiautomatic plotting of whole kidney ROIs. As a result of such automation, we achieved very high reproducibility of determination of assessed parameters, which was for K, rs = 0.99, for MTT, rs = 0.98, and for PTT, rs = 0.95. Agreement of results (both values within normal range or below/above norm) obtained by independent operators was also almost perfect for K (κ = 0.89) and MTT (κ = 0.88), and strong for PTT (κ = 0.77).
Due to high variability of MTT and PTT, some authors recommend setting the limits of their normative values as mean + 3 standard deviations (considering values between 2 and 3 SD as unequivocal) [
10]. Following this approach, mean + 3 SD values were chosen as normative values of these parameters in our work, while mean − 2 SD was used for K.
Specificity, assessed in an independent group of patients with no abnormalities in standard DRS evaluation, was used as a measure of reliability of normative values of assessed parameters. K achieved the highest specificity (100%). A slightly lower specificity of PTT (91%) may result from cases where an automatically determined cortical ROI covered fragments of calices. K is determined from the first minutes of the study, before the radiopharmaceutical reaches the pelvicalyceal system, so the above limitation does not apply to it. MTT showed a clear tendency to generate false-positive results (specificity 81%).
Moreover, it should be noted that mean values of K in the normative group I and in the group of patients with normal DRS results (IIA) did not show statistically significant differences. However, in cases of MTT and PTT, the differences between mean values in these groups were at the edge of statistical significance.
The next step in the assessment of usefulness of K and PTT was a comparison of correlations of their values with single-kidney estimated GFR (SKeGFR), which describes renal efficiency, determined for each kidney using CKD-EPI formula (taking into account the percentage of differential renal function). Obtained values of K strongly correlated with SKeGFR (rs = 0.89; r2 = 0.79). This correlation was significantly stronger than in cases of PTT vs. SKeGFR and SF vs. SKeGFR.
The fact that the correlation of K vs. SKeGFR is not as close as in the case of UI determined by Rehling (rs = 0.97) is most likely the result of the limitations of our reference method, chosen due to the retrospective nature of our research (only estimated values of GFR were calculated) and slightly different renal biokinetics of 99mTc-EC compared to 99mTc-DTPA. Despite the above limitations, the correlation we obtained was satisfactorily strong, which confirms the validity of the main assumptions of this method.
Measuring the depth of kidneys, for the purpose of attenuation correction, is recommended only in exceptional situations [
4,
22]. For this reason, in our studies, similarly to Rehling et. al., we did not take these factors into account. Omission of this stage enables determination of K in DRS carried out according to a routine protocol (without any additional measurements or modifications, provided that the heart is in the field of view of the camera), so it is possible to calculate its value a posteriori, only in selected cases, for example, when evaluation of standard DRS parameters results in an unequivocal diagnosis. It also makes it possible to determine this parameter in retrospective studies. This is not possible, for example, in case of camera-based clearance methods according to Gates’ and Schlegel’s protocols.
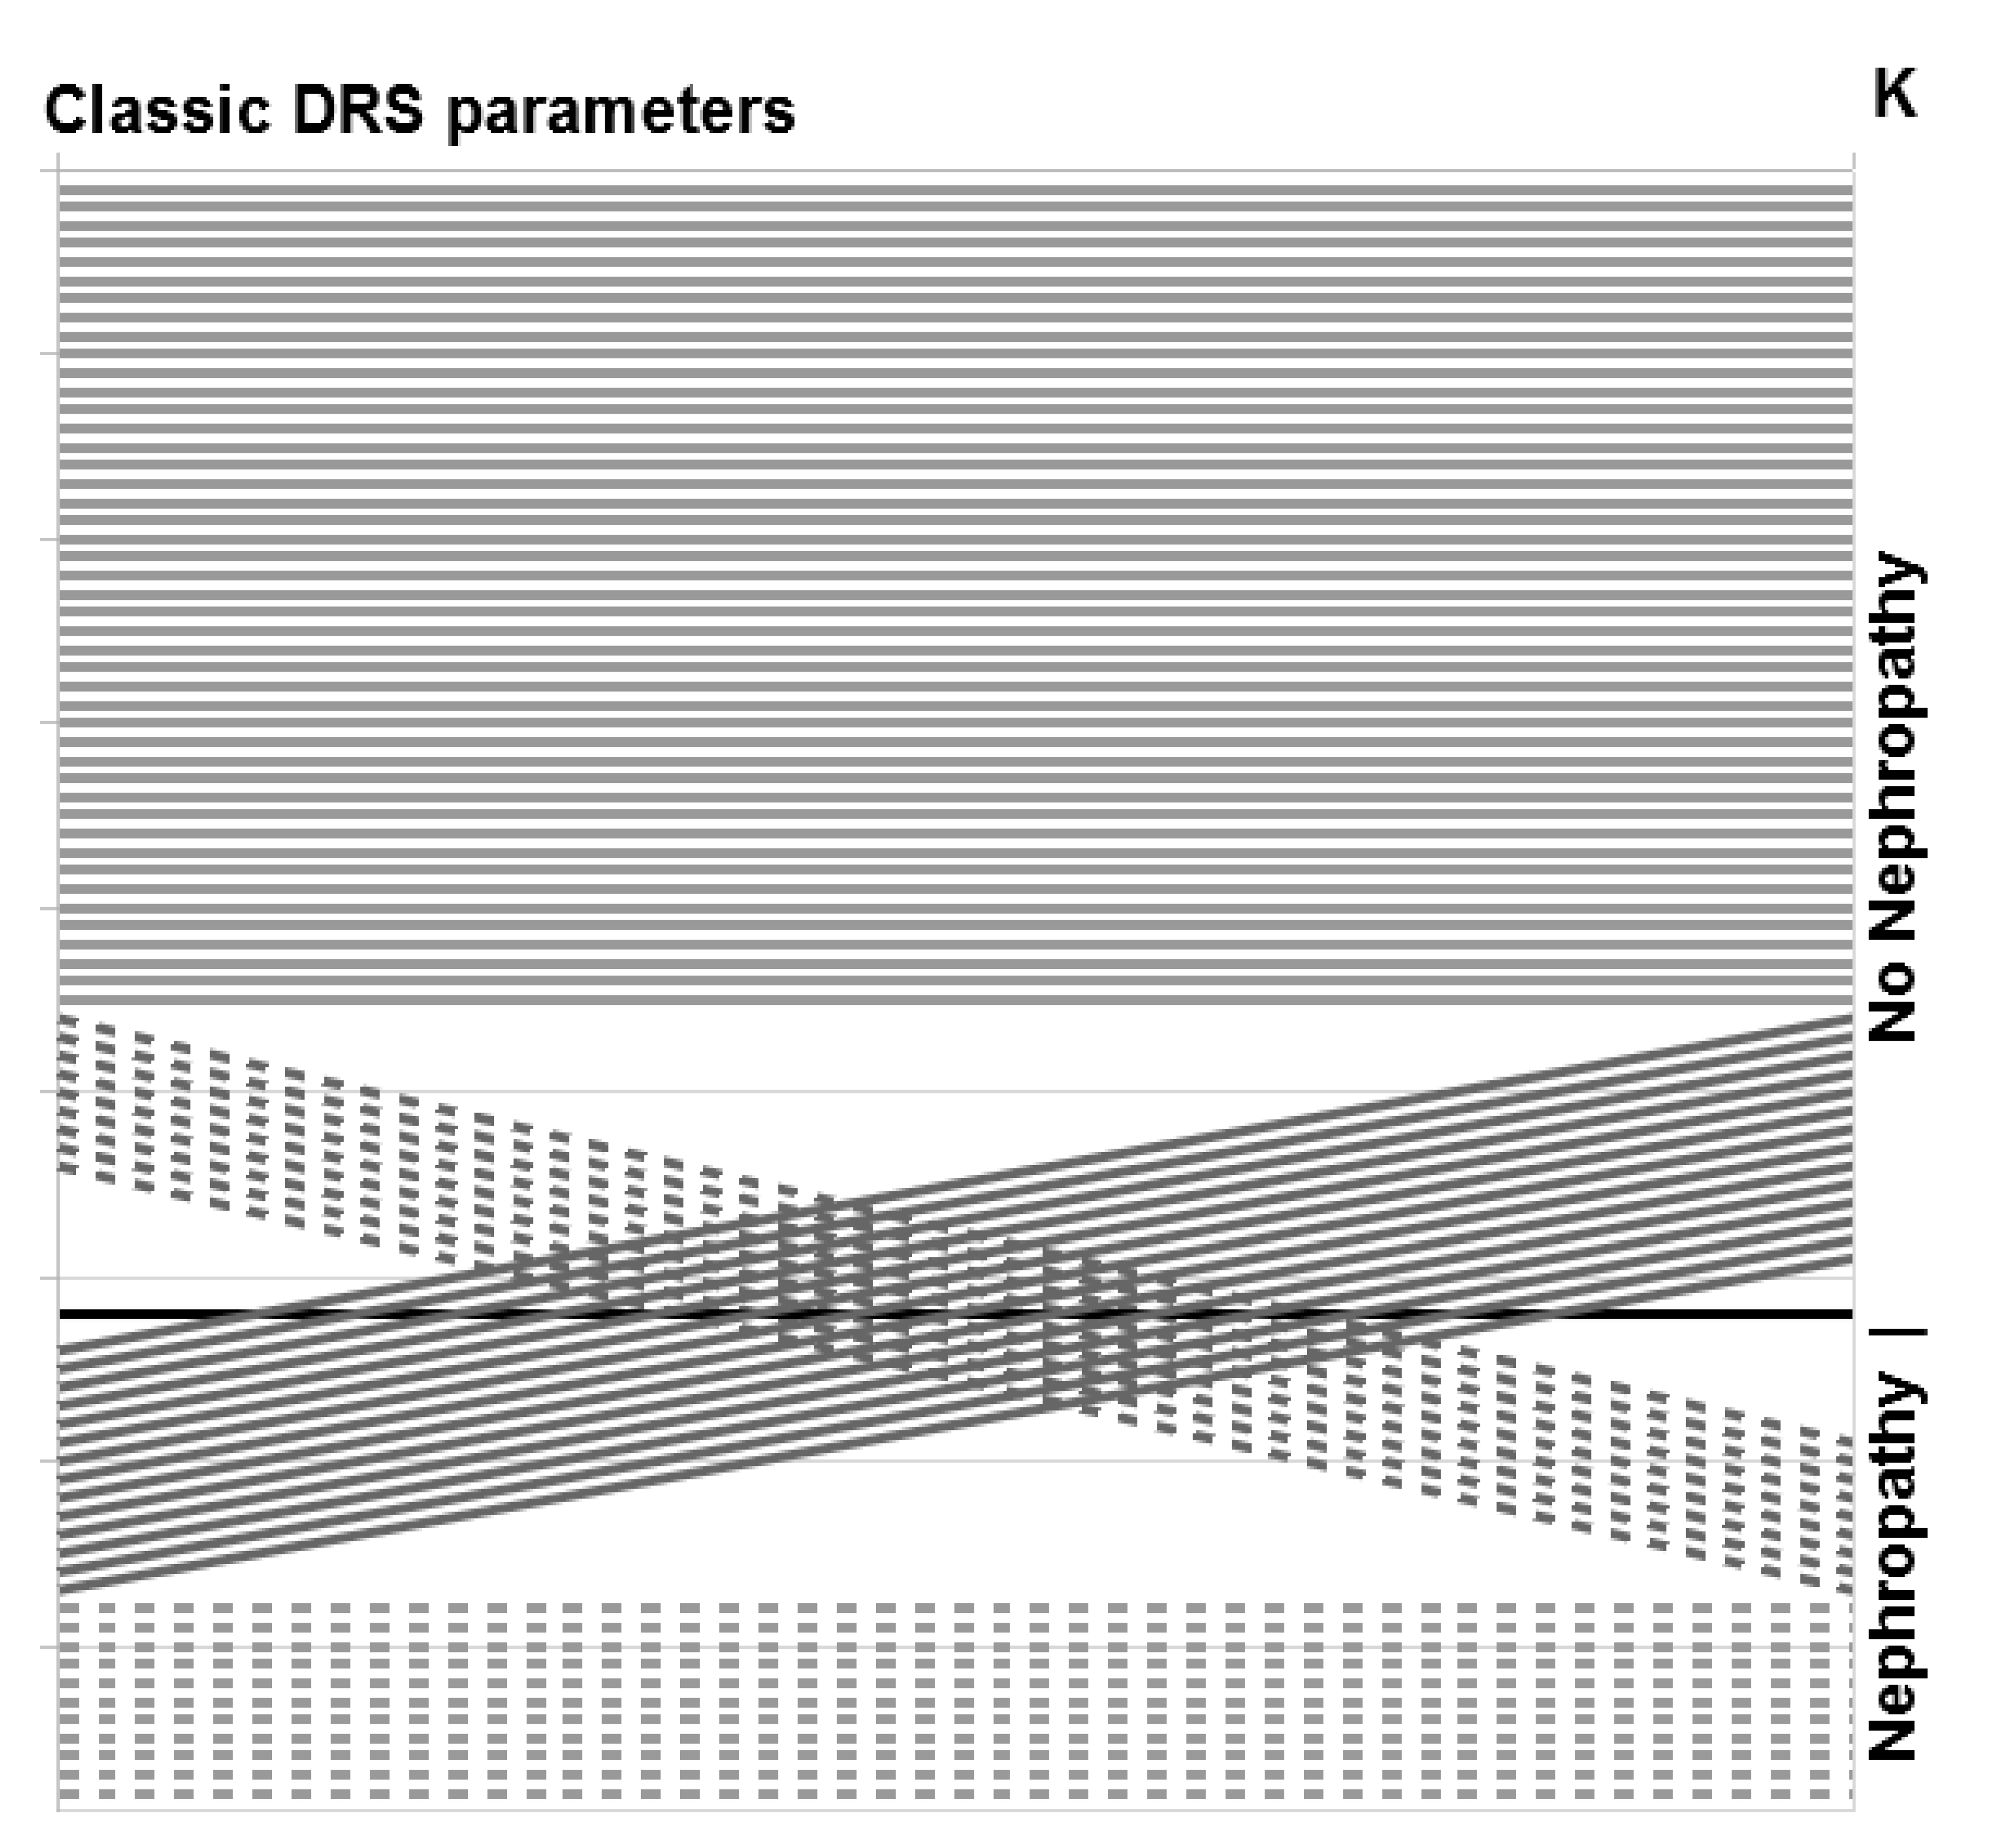
Considering good correlation of K with SKeGFR, there are theoretical premises supporting its validity for diagnosis of nephropathy. Due to its absolute character, it can be particularly useful in the diagnosis of nephropathy in patients with bilateral impairment of renal function or with a single functioning kidney, in whom standard DRS parameters, SF in particular, may be unreliable. The significant number of cases where application of K changed the classification of a kidney—over 1/4 of the assessed kidneys in our material, shows its considerable potential utility in routine clinical practice, although whether this new classification is correct needs to be further evaluated, due to limitations of the current study.
In our material, there were statistically significant differences between distributions of age in control group I and retrospectively selected group II. This difference can be explained by the fact that the incidence of diseases potentially affecting renal function, that excluded candidates from group I, increases with age. However, there was no statistically significant difference between group I and patients from subgroup IIA, where specificity of assessed parameters was evaluated.
This preliminary assessment gives grounds for undertaking further long-term, thorough, prospective clinical studies, also taking into account all comorbidities potentially affecting kidney function. This will allow to finish validation of this parameter for use in differential diagnosis of obstructive uro/nephropathy.
PTT achieved lower specificity, and its correlation with renal efficiency measured by SKeGFR was significantly weaker than in case of K. Moreover, its determination requires generation of additional ROIs of renal parenchyma (cortical layer), which may be a source of potential errors. Hence, the reproducibility of its determination by two independent operators and agreement between obtained results, although high, were nevertheless lower than in cases of K and MTT, even despite almost complete automation of the ROI plotting process. The results of the research carried out in this study clearly indicate that the original uptake constant K is a better and more practical parameter for the assessment of renal function in DRS.
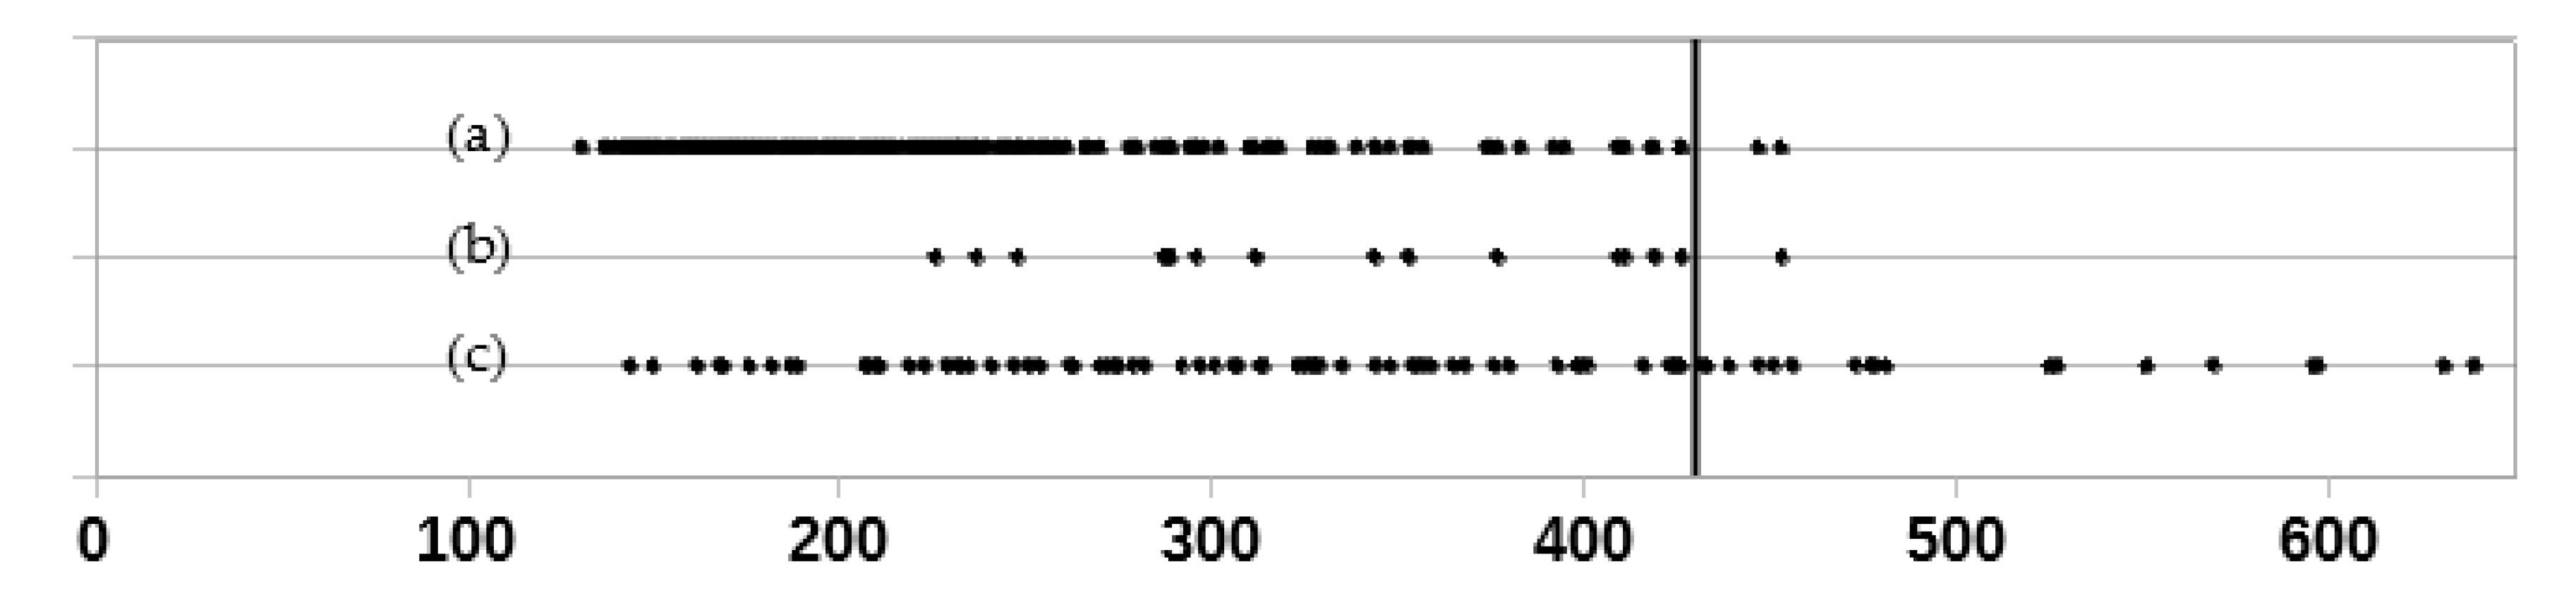
Relatively low specificity of MTT in addition to the long-established and well-documented high diagnostic efficacy of base DRS study with diuretic test in the diagnosis of obstructive uropathy undermines the usefulness of this parameter. In this study, however, it was observed that obstructive uropathy is practically always present when MTT values are exceeding 430 s. This can provide useful information in situations where a diuretic test is risky (e.g., furosemide allergy or low blood pressure), or the test was nondiagnostic (e.g., study interrupted too early due to patient’s need to urinate). In such cases, a cumulative renographic curve in base DRS study combined with MTT value above 430 s allows for the diagnosis of obstructive uropathy with about 95% probability, even without the diuretic test.
It is worth noting that all studies carried out in this paper concern adults. The topic to be considered in future research is the application of K parameter in children, after determining appropriate normative values. The developed method may also be adapted for DRS performed with 99mTc-MAG3 (to calculate a similar parameter to K, proportional to its clearance).

 ,
, 


