
Clinical Significance of Serum Lactate in Acute Myocardial Infarction: A Cardiac Magnetic Resonance Imaging Study

 , ,
, , 
Abstract
:1. Introduction
2. Materials and Methods
3. Results
3.1. Baseline Clinical, Angiographic, and Procedural Characteristics
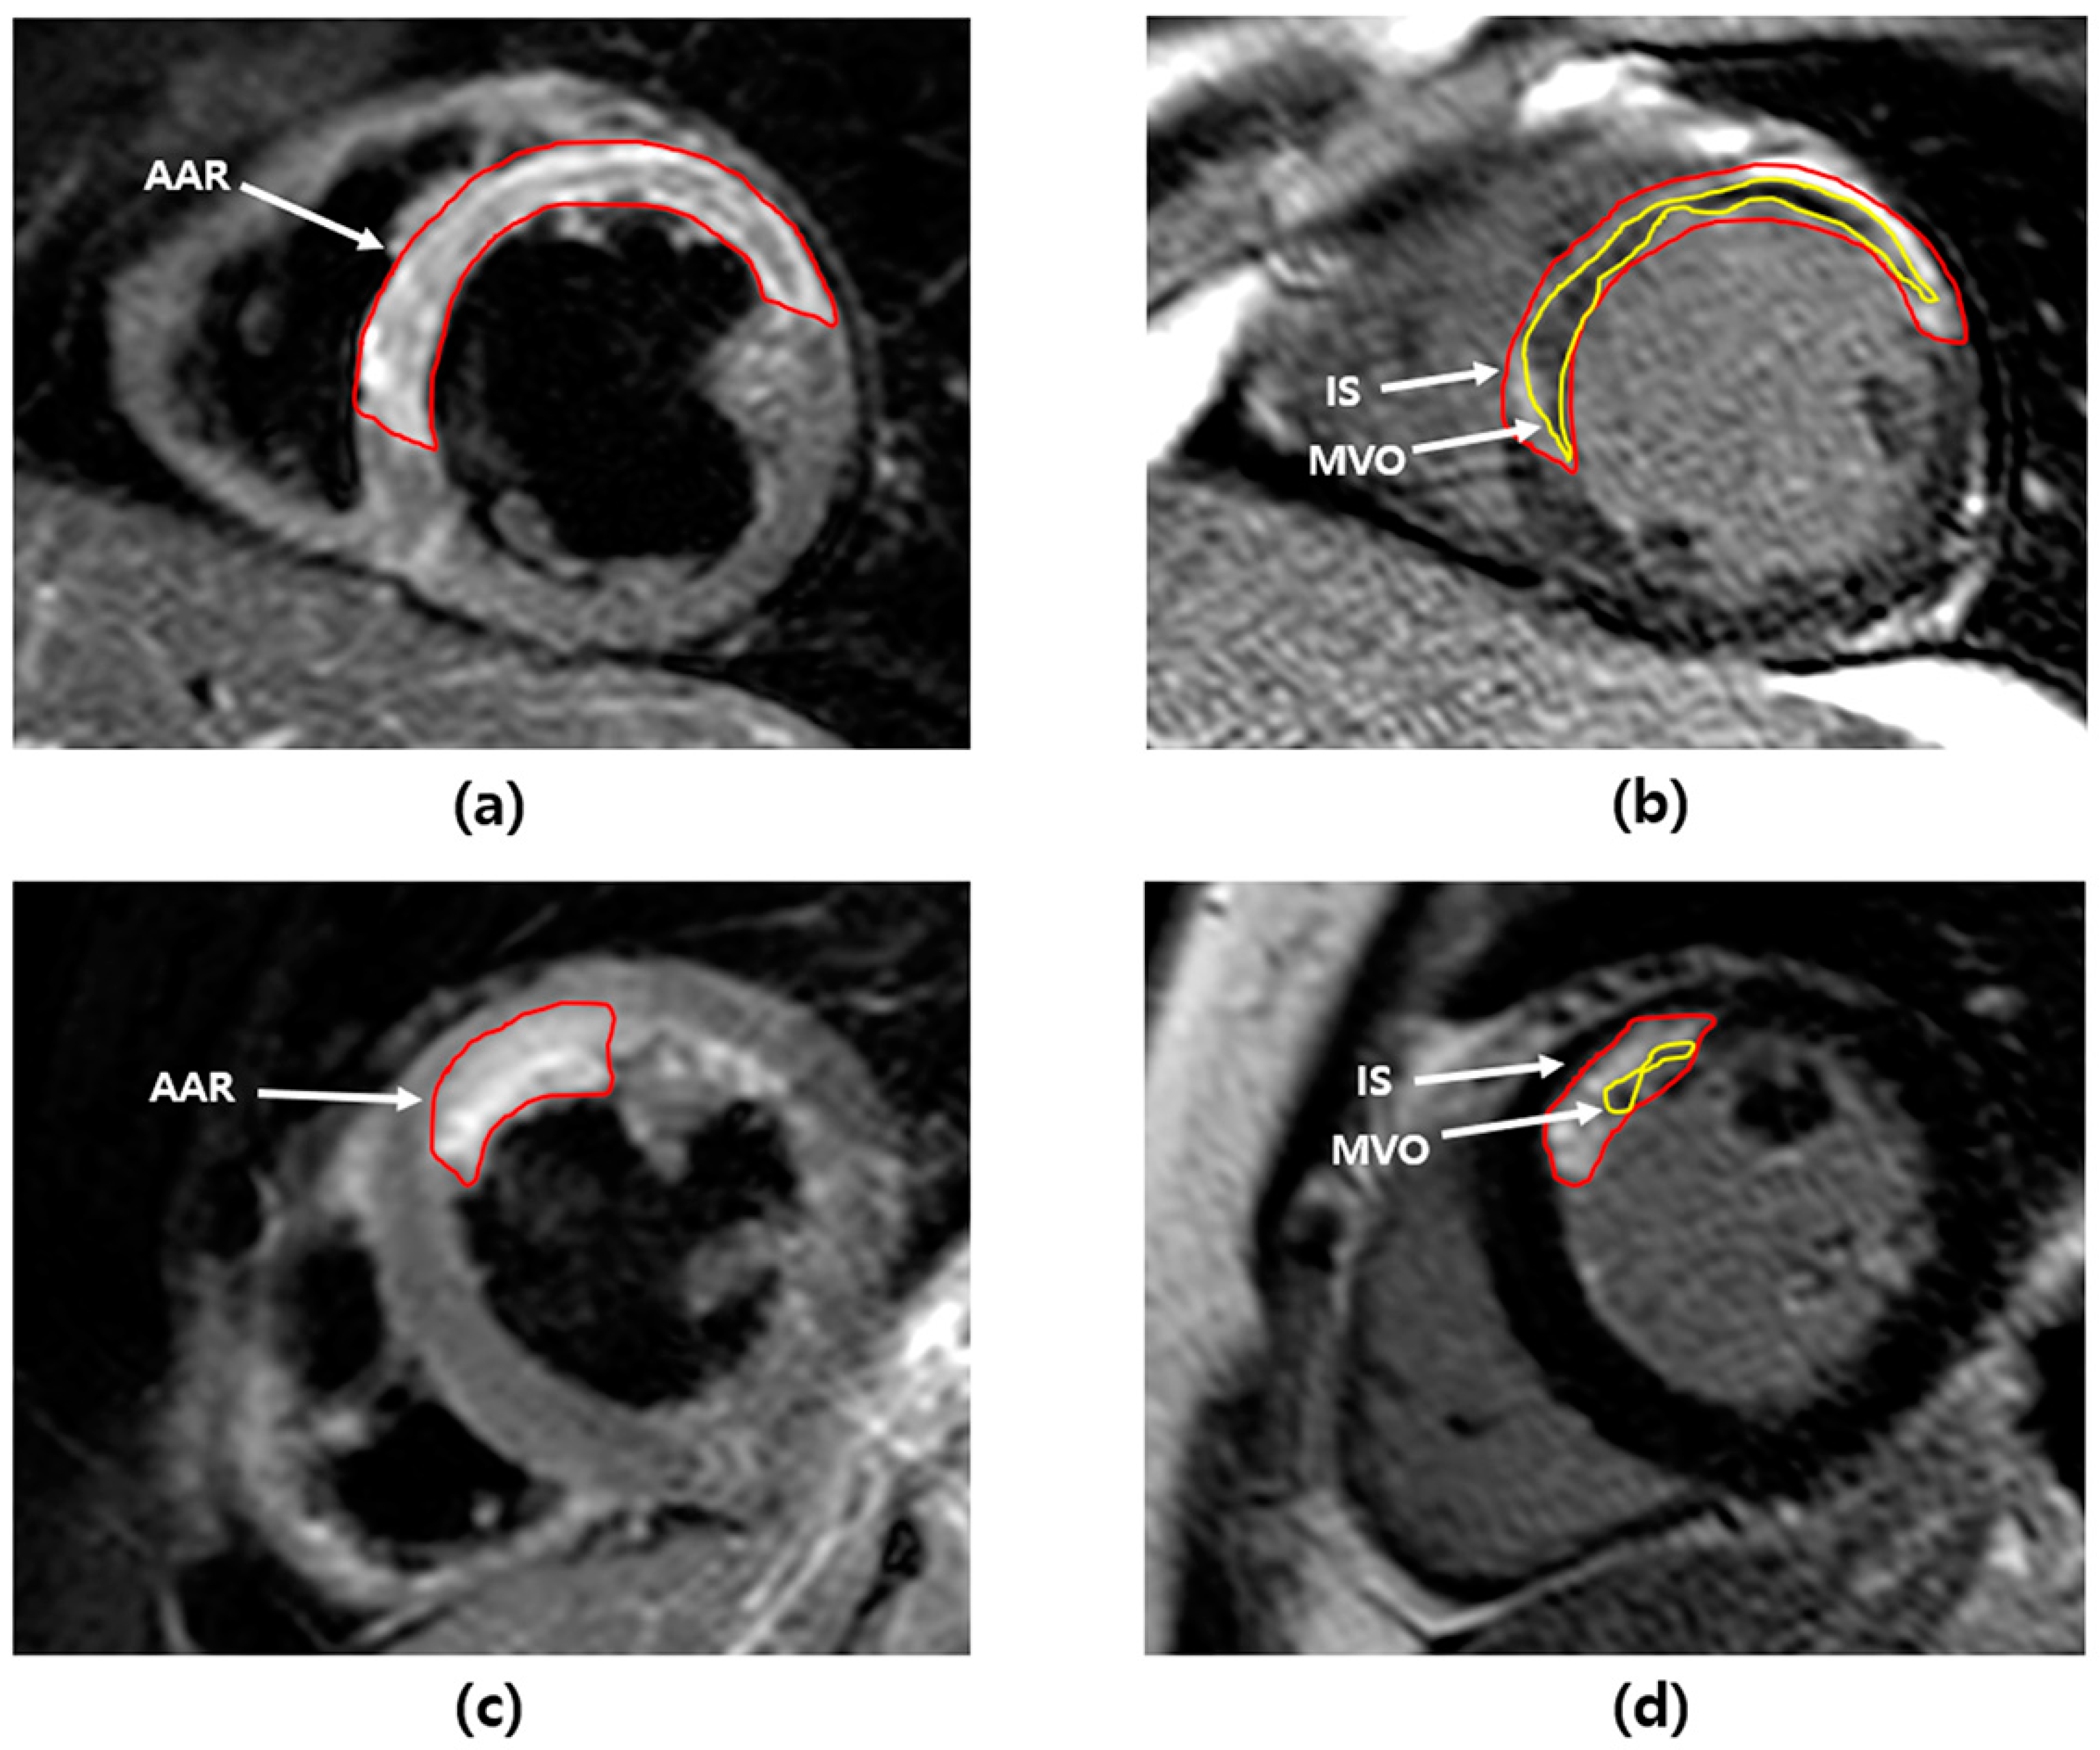
3.2. Analysis of CMR Findings
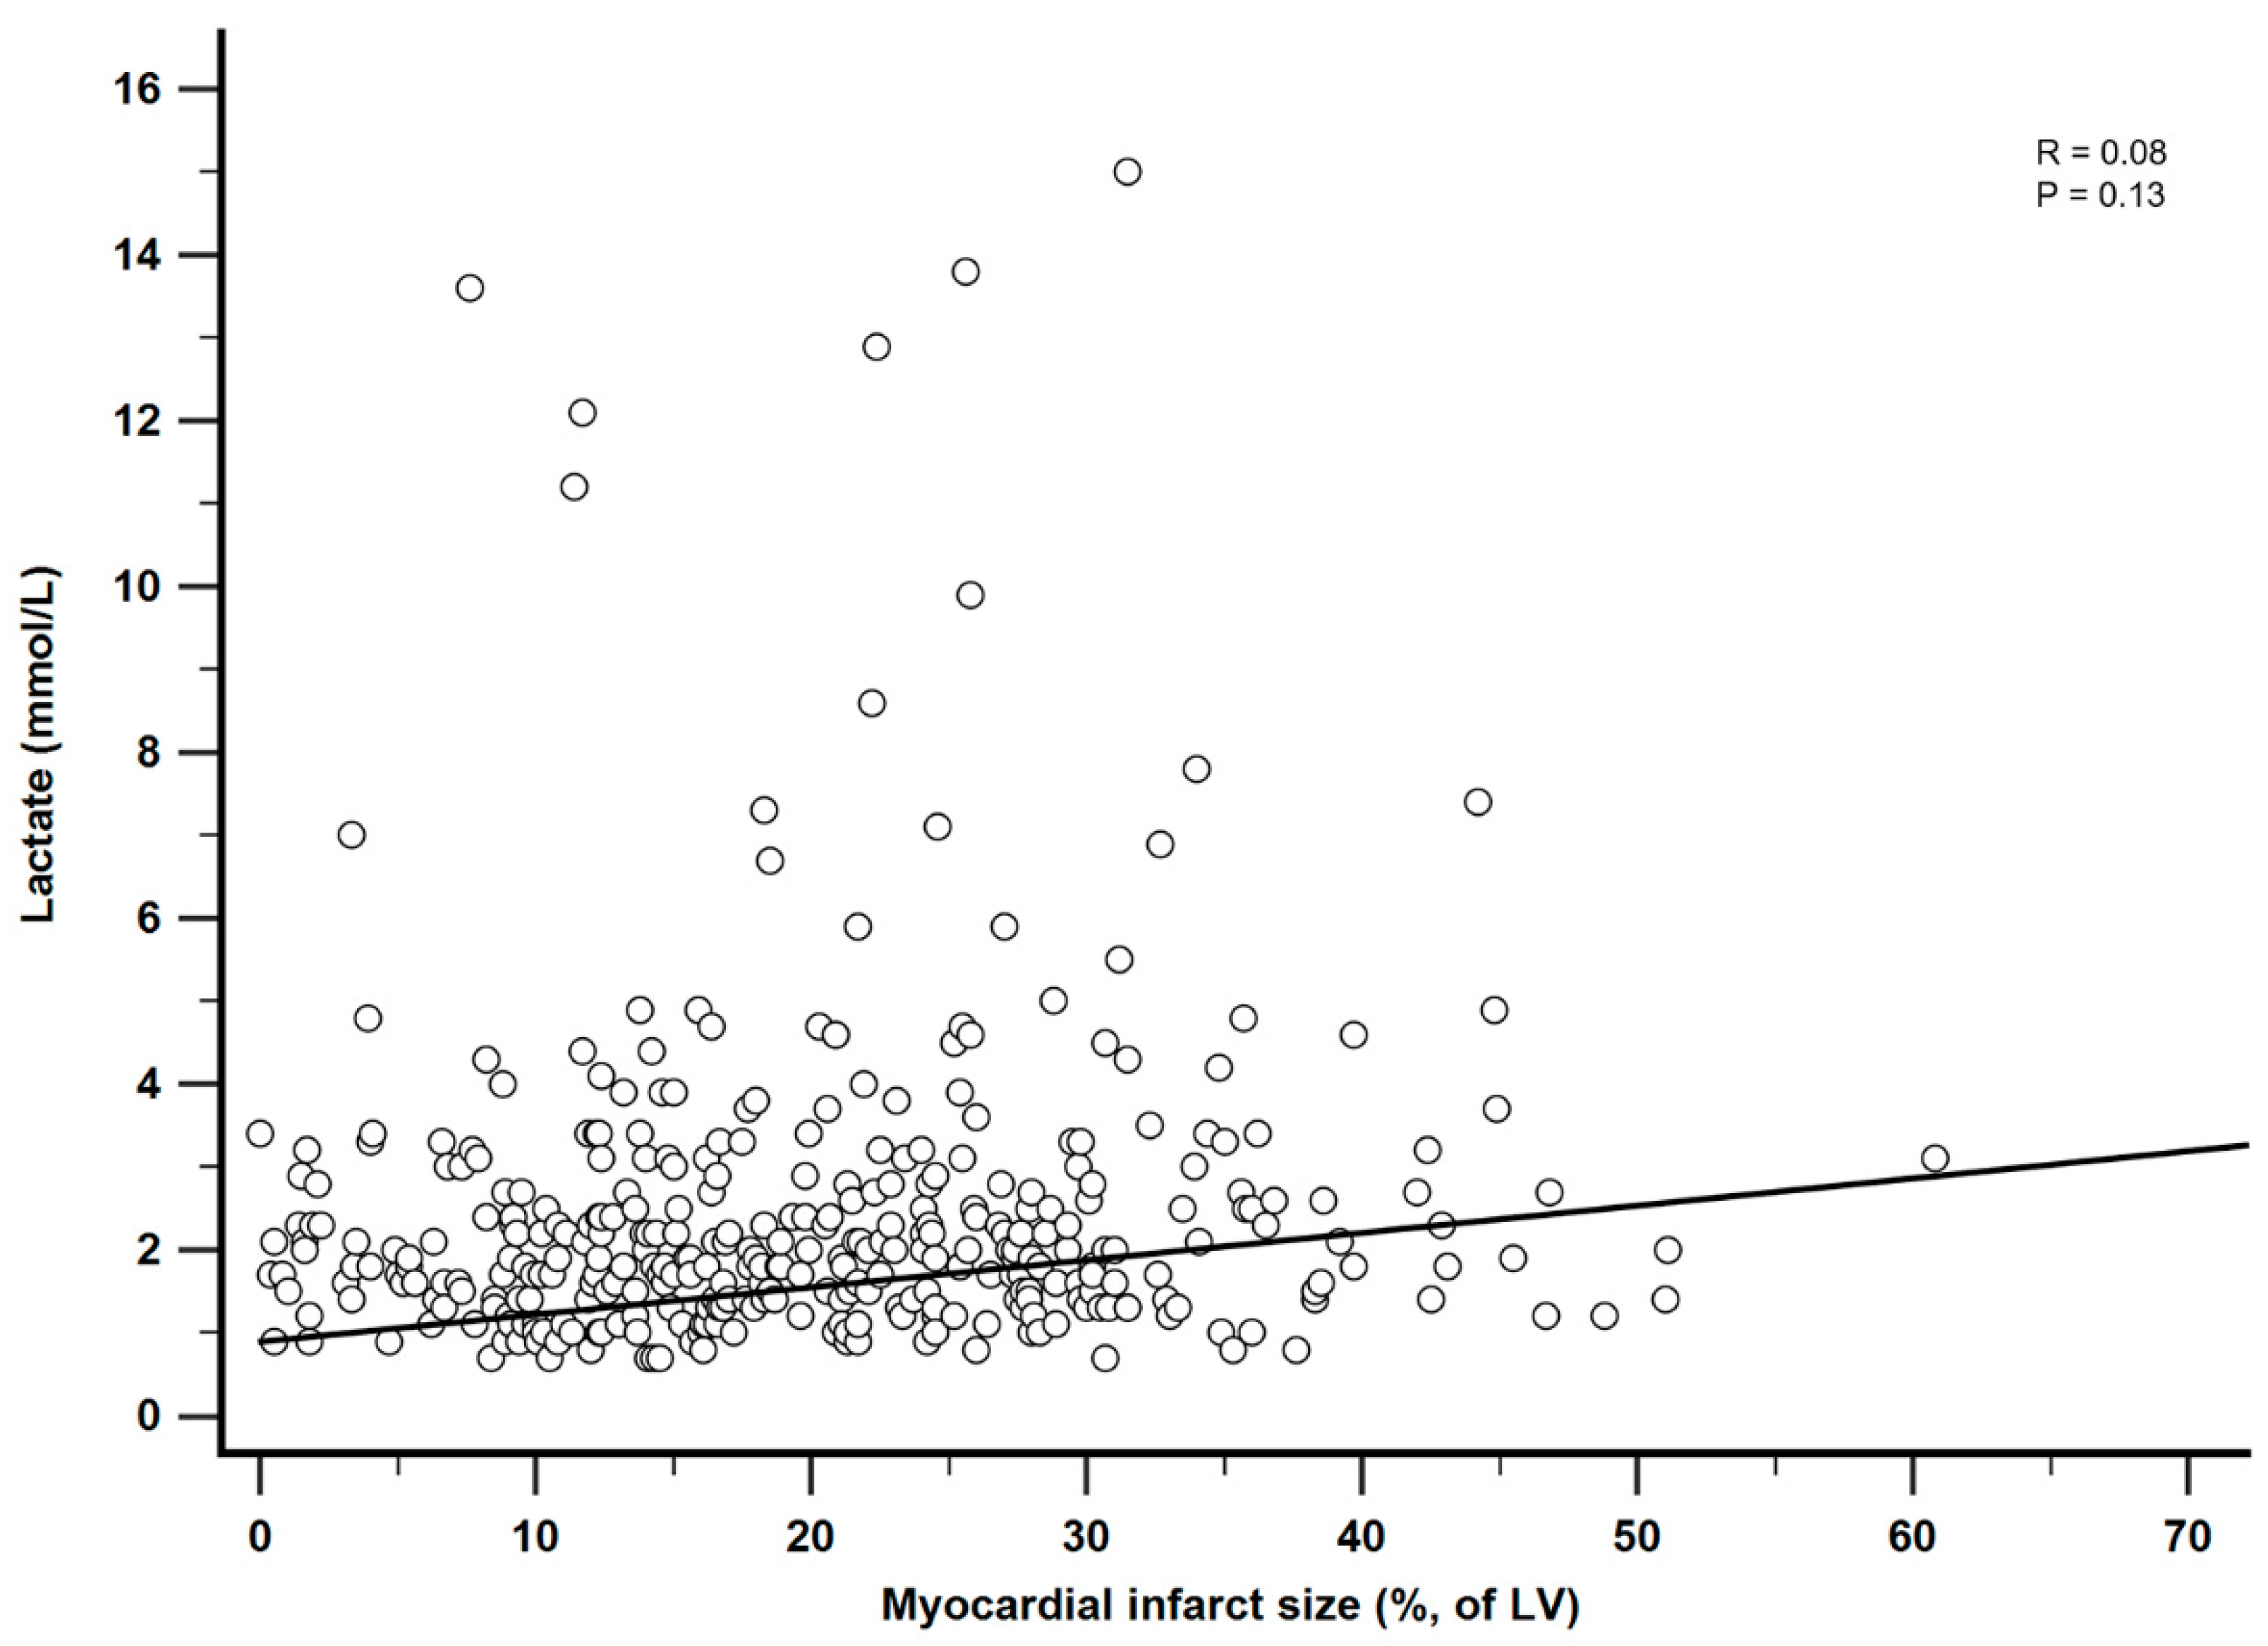
3.3. Correlation between Serum Lactate and Myocardial Infarct Size
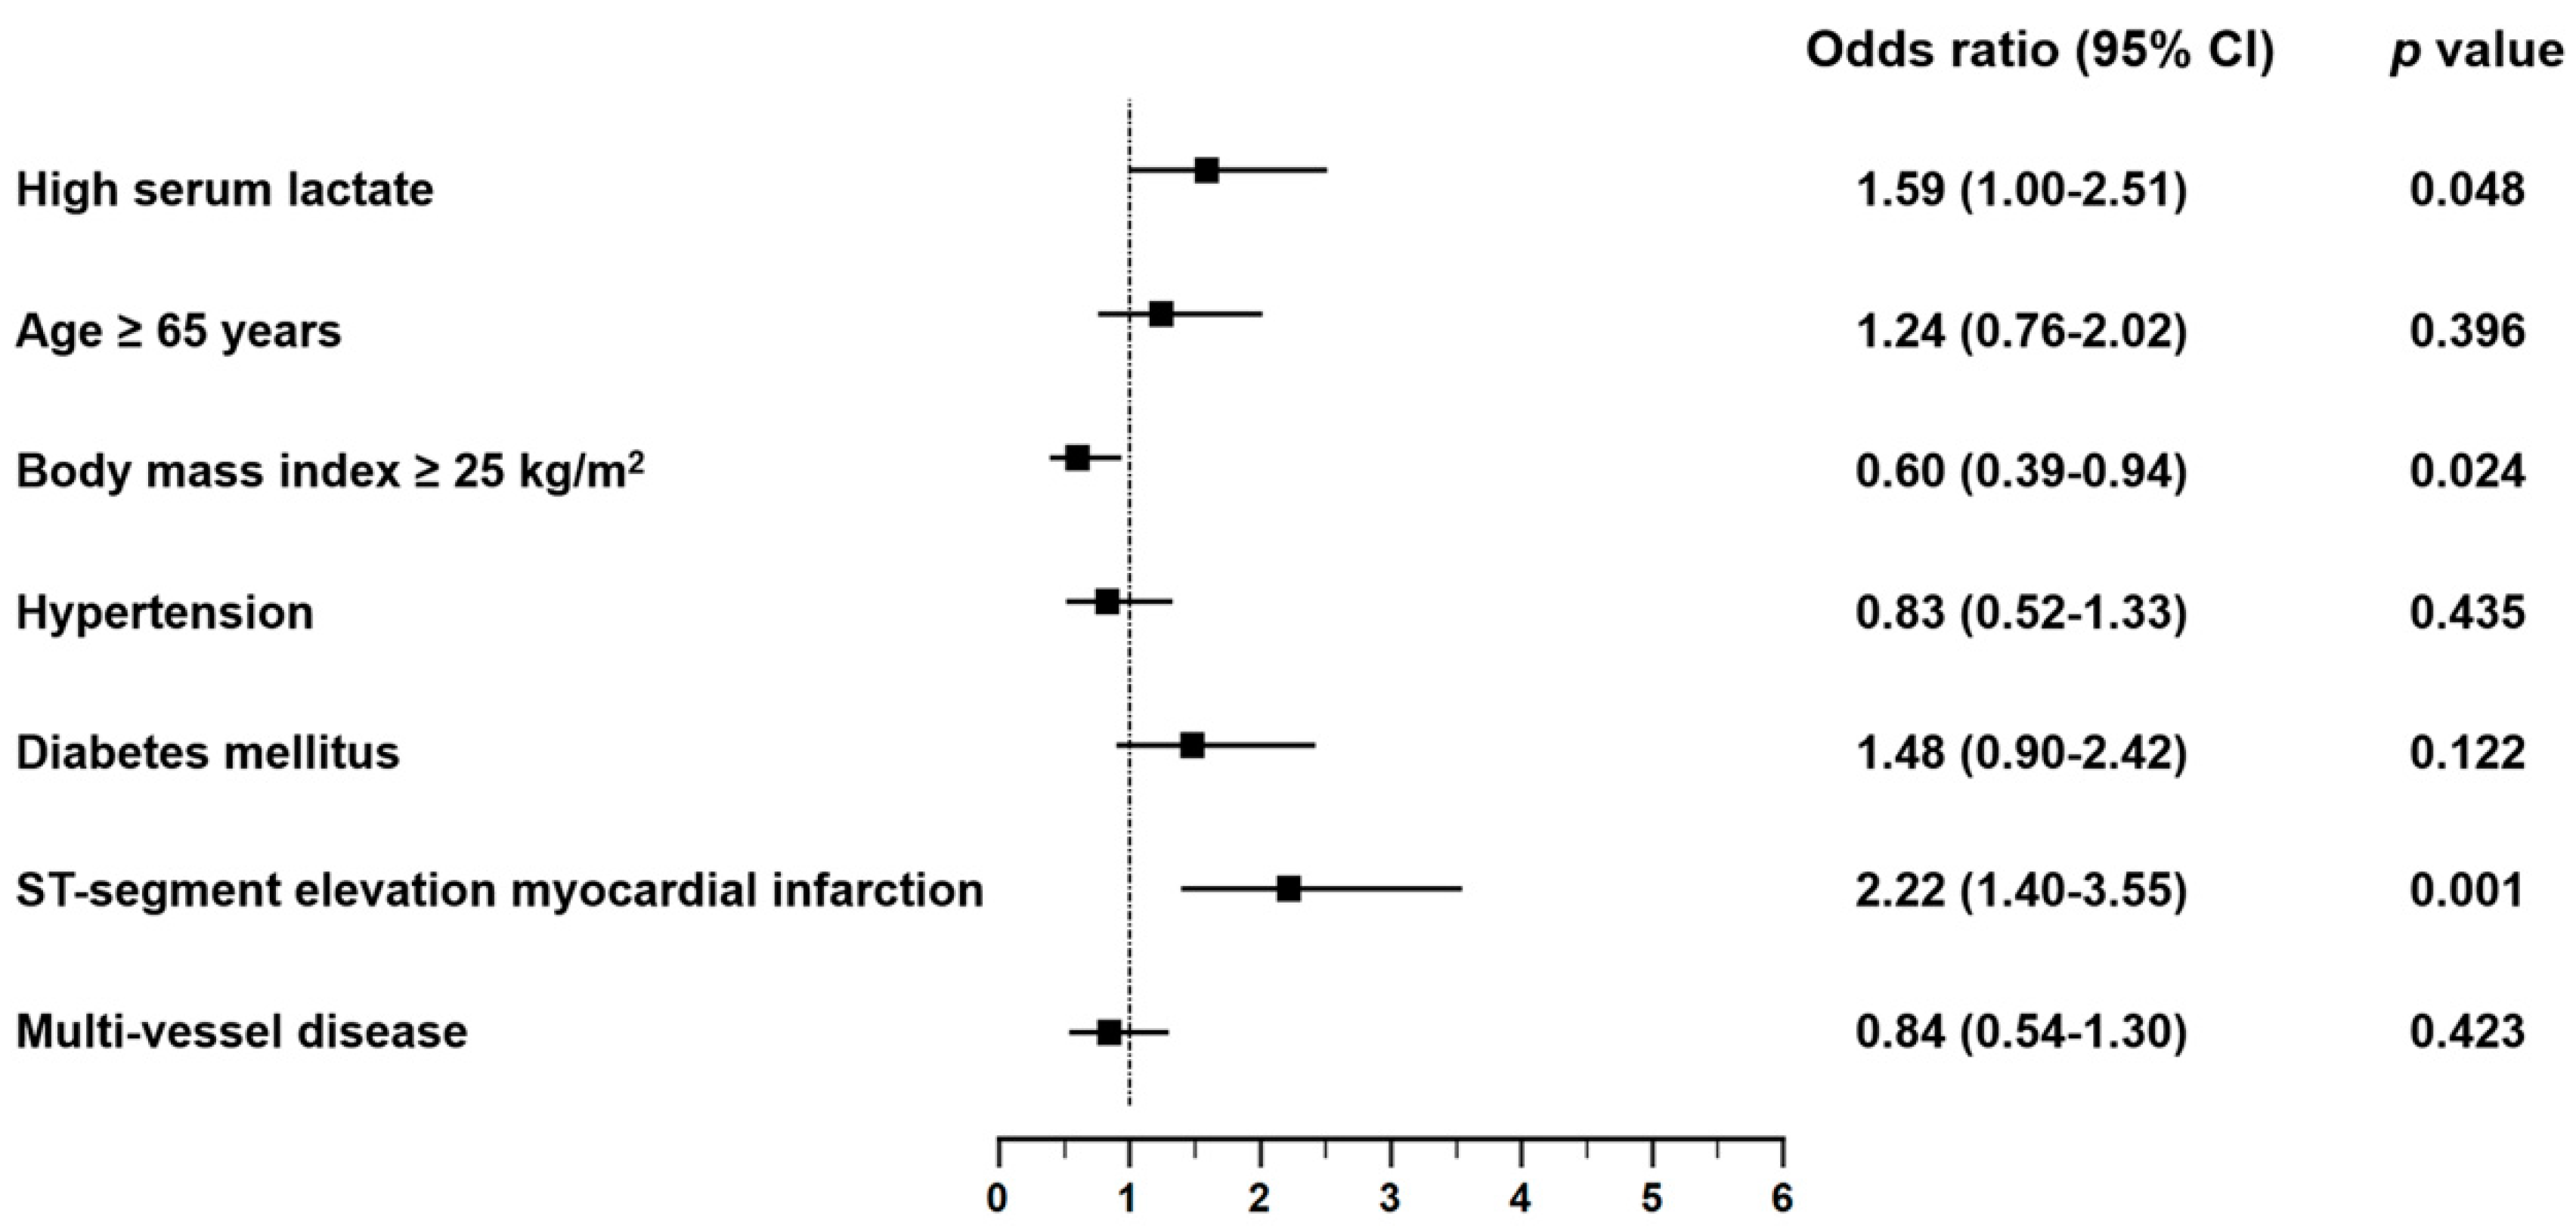
3.4. Predictors of Large Myocardial Infarct
4. Discussion
5. Conclusions
Author Contributions
Funding
Institutional Review Board Statement
Informed Consent Statement
Data Availability Statement
Conflicts of Interest
Appendix A

| Overall Population (n = 360) | IPTW Population (n = 1083) | |||||||
|---|---|---|---|---|---|---|---|---|
| Lactate ≤ 2.5 | 2.5 ≤ Lactate < 4.0 | Lactate > 4.0 | p Value | Lactate ≤ 2.5 | 2.5 ≤ Lactate < 4.0 | Lactate > 4.0 | p Value | |
| (n = 241) | (n = 80) | (n = 39) | (n = 359) | (n = 361) | (n = 363) | |||
| Age | 59.6 ± 11.4 | 61.5 ± 13.4 | 61.4 ± 12.5 | 0.373 | 60.1 ± 11.4 | 59.5 ± 13.5 | 60.1 ± 13.6 | 0.967 |
| Male | 205 (85.1) | 63 (78.8) | 26 (66.7) | 0.017 | 293 (81.6) | 297 (82.5) | 301 (82.9) | 0.968 |
| Body mass index, kg/m² | 24.8 ± 3.3 | 24.4 ± 3.6 | 23.7 ± 4.6 | 0.183 | 24.6 ± 3.3 | 24.8 ± 3.7 | 25.0 ± 5.8 | 0.215 |
| Current smoker | 106 (44.0) | 30 (37.5) | 15 (38.5) | 0.534 | 150 (41.6) | 152 (42.0) | 160 (44.1) | 0.916 |
| Hypertension | 104 (43.2) | 40 (50.0) | 21 (53.9) | 0.322 | 166 (46.1) | 165 (45.8) | 175 (48.3) | 0.915 |
| Diabetes mellitus | 51 (21.2) | 27 (33.8) | 17 (43.6) | 0.003 | 96 (26.8) | 97 (26.9) | 106 (29.1) | 0.900 |
| Dyslipidemia | 51 (21.2) | 16 (20.0) | 3 (7.7) | 0.142 | 80 (22.2) | 66 (18.4) | 21 (5.8) | 0.001 |
| History of percutaneous coronary intervention | 17 (7.1) | 11 (13.8) | 2 (5.1) | 0.128 | 32 (8.9) | 30 (8.3) | 31 (8.5) | 0.987 |
| History of cerebrovascular accident | 6 (2.5) | 6 (7.5) | 2 (5.1) | 0.122 | 10 (2.7) | 31 (8.5) | 21 (5.8) | 0.150 |
| Clinical presentation | ||||||||
| NSTEMI | 85 (35.3) | 25 (31.3) | 10 (25.6) | 0.449 | 120 (33.5) | 122 (33.8) | 108 (29.8) | 0.765 |
| STEMI | 156 (64.7) | 55 (68.8) | 29 (74.4) | 0.449 | 239 (66.5) | 239 (66.2) | 255 (70.2) | 0.765 |
| Laboratory findings | ||||||||
| NT-proBNP, pg/mL | 186.4 (51.8–846.8) | 243.4 (72.7–1062.0) | 196.7 (45.7–1360.0) | 0.106 | 196.9 (53.6–926.3) | 219.8 (70.3–849.4) | 137.4 (40.5–1022.0) | 0.381 |
| White blood cell, ×103/μL | 11.1 (8.9–13.4) | 13.5 (10.6–16.9) | 17.7 (12.9–23.2) | <0.001 | 11.2 (8.9–13.4) | 13.5 (10.9–17.1) | 17.7 (14.0–21.9) | <0.001 |
| Hemoglobin, g/dL | 14.6 (13.2–15.6) | 14.3 (13.1–15.7) | 13.8 (12.3–15.0) | 0.034 | 14.4 (13.0–15.5) | 14.7 (13.4–15.9) | 13.9 (13.0–15.4) | 0.188 |
| Platelet ×103/μL | 225.0 (194.0–263.0) | 218.0 (191.0–250.0) | 254.0 (19.0–273.0) | 0.115 | 227.0 (195.0–269.0) | 216.0 (190.0–249.0) | 262.0 (210.0–284.0) | 0.010 |
| Peak CK-MB, ng/mL | 92.0 (29.7-214.7) | 126.2 (39.0-256.1) | 288.7 (86.3-500.0) | <0.001 | 91.0 (28.5-214.1) | 126.1 (47.0-257.6) | 264.0 (69.0-495.7) | <0.001 |
| Concomitant medications | ||||||||
| Aspirin | 239 (99.2) | 78 (97.5) | 39 (100.0) | 0.365 | 356 (99.0) | 352 (97.5) | 363 (100.0) | 0.194 |
| P2Y12 inhibitor | 237 (98.3) | 78 (97.5) | 39 (100.0) | 0.607 | 353 (98.4) | 351 (97.4) | 363 (100.0) | 0.225 |
| Beta blocker | 216 (89.6) | 71 (88.8) | 33 (84.6) | 0.652 | 324 (90.3) | 321 (89.0) | 314 (86.5) | 0.643 |
| ACE inhibitor or ARB | 193 (80.1) | 63 (78.8) | 30 (76.9) | 0.889 | 287 (80.0) | 288 (79.9) | 272 (74.9) | 0.545 |
| Statin | 228 (94.6) | 76 (95.0) | 36 (92.3) | 0.819 | 341 (95.0) | 346 (95.9) | 338 (93.0) | 0.607 |
| Overall Population (n = 360) | IPTW Population (n = 1083) | |||||||
|---|---|---|---|---|---|---|---|---|
| Lactate ≤ 2.5 | 2.5 ≤ Lactate < 4.0 | Lactate > 4.0 | p Value | Lactate ≤ 2.5 | 2.5 ≤ Lactate < 4.0 | Lactate > 4.0 | p Value | |
| (n = 241) | (n = 80) | (n = 39) | (n = 359) | (n = 361) | (n = 363) | |||
| Infarct-related artery | 0.866 | 0.141 | ||||||
| Left anterior descending artery | 113 (46.9) | 41 (51.3) | 17 (43.6) | 165 (45.9) | 173 (48.0) | 138 (38.0) | ||
| Left circumflex artery | 36 (14.9) | 10 (12.5) | 8 (20.5) | 55 (15.2) | 44 (12.3) | 90 (24.7) | ||
| Right coronary artery | 90 (37.3) | 29 (36.3) | 14 (35.9) | 137 (38.0) | 143 (39.8) | 136 (37.3) | ||
| Left main artery | 2 (0.8) | 0 (0.0) | 0 (0.0) | 3 (0.9) | 0 (0.0) | 0 (0.0) | ||
| Multi-vessel disease | 121 (50.4) | 36 (45.0) | 20 (51.3) | 0.679 | 176 (49.1) | 182 (50.4) | 156 (42.9) | 0.464 |
| TIMI flow grade before PCI | 0.605 | 0.701 | ||||||
| 0 | 161 (66.8) | 55 (68.8) | 26 (66.7) | 243 (67.7) | 252 (69.9) | 239 (65.9) | ||
| 1 | 14 (5.8) | 2 (2.5) | 4 (10.3) | 23 (6.5) | 10 (2.7) | 29 (8.0) | ||
| 2 | 34 (14.1) | 13 (16.3) | 3 (7.7) | 49 (13.5) | 56 (15.6) | 46 (12.7) | ||
| 3 | 32 (13.3) | 10 (12.5) | 6 (15.4) | 44 (12.3) | 43 (11.9) | 49 (13.4) | ||
| Final TIMI flow grade 3 after PCI | 214 (92.6) | 72 (90.0) | 35 (92.1) | 0.755 | 322 (89.5) | 323 (89.5) | 327 (90.1) | 0.688 |
| Angiographic no reflow phenomenon | 14 (6.1) | 5 (6.3) | 2 (5.3) | 0.977 | 22 (6.1) | 19 (5.4) | 18 (5.0) | 0.903 |
| Presence of collateral flow | 127 (58.0) | 36 (46.8) | 15 (39.5) | 0.045 | 190 (52.8) | 173 (47.9) | 116 (31.9) | <0.001 |
| Myocardial blush grade | 0.166 | <0.001 | ||||||
| 0 | 1 (0.5) | 2 (2.6) | 0 (0.0) | 1 (0.4) | 11 (3.1) | 0 (0.0) | ||
| 1 | 3 (1.4) | 1 (1.3) | 0 (0.0) | 5 (1.3) | 5 (1.5) | 0 (0.0) | ||
| 2 | 18 (8.6) | 7 (9.1) | 8 (21.1) | 30 (8.2) | 28 (7.9) | 107 (29.4) | ||
| 3 | 188 (89.5) | 67 (87.0) | 30 (79.0) | 281 (78.2) | 297 (82.3) | 254 (70.0) | ||
| Aspiration thrombectomy | 115 (47.7) | 41 (51.3) | 24 (61.5) | 0.269 | 172 (47.8) | 181 (50.2) | 197 (54.3) | 0.587 |
| Use of GPIIb/IIIa inhibitor | 36 (17.1) | 11 (14.3) | 3 (7.9) | 0.332 | 55 (15.2) | 47 (13.1) | 20 (5.4) | 0.018 |
| Number of implanted stents | 1.3 ± 0.7 | 1.3 ± 0.6 | 1.1 ± 0.3 | 0.370 | 1.3 ± 0.7 | 1.2 ± 0.6 | 1.1 ± 0.2 | 0.004 |
| Stent diameter (mm) | 3.1 ± 0.4 | 3.1 ± 0.5 | 3.1 ± 0.5 | 0.876 | 3.1 ± 0.4 | 3.1 ± 0.5 | 3.2 ± 0.6 | 0.510 |
| Stent length (mm) | 32.8 ± 17.6 | 32.4 ± 17.9 | 26.0 ± 8.9 | 0.086 | 33.3 ± 18.1 | 32.4 ± 16.3 | 24.1 ± 7.1 | <0.001 |
References
- Slottosch, I.; Liakopoulos, O.; Kuhn, E.; Scherner, M.; Deppe, A.C.; Sabashnikov, A.; Mader, N.; Choi, Y.H.; Wippermann, J.; Wahlers, T. Lactate and lactate clearance as valuable tool to evaluate ECMO therapy in cardiogenic shock. J. Crit. Care 2017, 42, 35–41. [Google Scholar] [CrossRef]
- Bakker, J.; Postelnicu, R.; Mukherjee, V. Lactate: Where Are We Now? Crit. Care Clin. 2020, 36, 115–124. [Google Scholar] [CrossRef]
- Vermeulen, R.P.; Hoekstra, M.; Nijsten, M.W.; van der Horst, I.C.; van Pelt, L.J.; Jessurun, G.A.; Jaarsma, T.; Zijlstra, F.; van den Heuvel, A.F. Clinical correlates of arterial lactate levels in patients with ST-segment elevation myocardial infarction at admission: A descriptive study. Crit. Care 2010, 14, R164. [Google Scholar] [CrossRef] [Green Version]
- Mungan, İ.; Kazancı, D.; Bektaş, Ş.; Ademoglu, D.; Turan, S. Does lactate clearance prognosticates outcomes in ECMO therapy: A retrospective observational study. BMC Anesthesiol. 2018, 18, 152. [Google Scholar] [CrossRef]
- Chebl, R.B.; Tamim, H.; Dagher, G.A.; Sadat, M.; Enezi, F.A.; Arabi, Y.M. Serum Lactate as an Independent Predictor of In-Hospital Mortality in Intensive Care Patients. J. Intensive Care Med. 2020, 35, 1257–1264. [Google Scholar] [CrossRef] [PubMed]
- Dall’Armellina, E.; Karamitsos, T.D.; Neubauer, S.; Choudhury, R.P. CMR for characterization of the myocardium in acute coronary syndromes. Nat. Rev. Cardiol. 2010, 7, 624–636. [Google Scholar] [CrossRef] [PubMed]
- Eitel, I.; de Waha, S.; Wöhrle, J.; Fuernau, G.; Lurz, P.; Pauschinger, M.; Desch, S.; Schuler, G.; Thiele, H. Comprehensive prognosis assessment by CMR imaging after ST-segment elevation myocardial infarction. J. Am. Coll. Cardiol. 2014, 64, 1217–1226. [Google Scholar] [CrossRef] [PubMed]
- Lazzeri, C.; Valente, S.; Chiostri, M.; Picariello, C.; Gensini, G.F. Lactate in the acute phase of ST-elevation myocardial infarction treated with mechanical revascularization: A single-center experience. Am. J. Emerg. Med. 2012, 30, 92–96. [Google Scholar] [CrossRef]
- Valente, S.; Lazzeri, C.; Vecchio, S.; Giglioli, C.; Margheri, M.; Bernardo, P.; Comeglio, M.; Chiocchini, S.; Gensini, G.F. Predictors of in-hospital mortality after percutaneous coronary intervention for cardiogenic shock. Int. J. Cardiol. 2007, 114, 176–182. [Google Scholar] [CrossRef]
- Howell, M.D.; Donnino, M.; Clardy, P.; Talmor, D.; Shapiro, N.I. Occult hypoperfusion and mortality in patients with suspected infection. Intensive Care Med. 2007, 33, 1892–1899. [Google Scholar] [CrossRef]
- Ibanez, B.; James, S.; Agewall, S.; Antunes, M.J.; Bucciarelli-Ducci, C.; Bueno, H.; Caforio, A.L.; Crea, F.; Goudevenos, J.A.; Halvorsen, S.; et al. 2017 ESC Guidelines for the management of acute myocardial infarction in patients presenting with ST-segment elevation: The Task Force for the management of acute myocardial infarction in patients presenting with ST-segment elevation of the European Society of Cardiology (ESC). Eur. Heart J. 2018, 39, 119–177. [Google Scholar]
- Van ‘t Hof, A.W.; Liem, A.; Suryapranata, H.; Hoorntje, J.C.; de Boer, M.J.; Zijlstra, F. Angiographic assessment of myocardial reperfusion in patients treated with primary angioplasty for acute myocardial infarction: Myocardial blush grade. Zwolle Myocardial Infarction Study Group. Circulation 1998, 97, 2302–2306. [Google Scholar] [CrossRef] [Green Version]
- Perazzolo Marra, M.; Lima, J.A.; Iliceto, S. MRI in acute myocardial infarction. Eur. Heart J. 2011, 32, 284–293. [Google Scholar] [CrossRef] [PubMed]
- Ganame, J.; Messalli, G.; Dymarkowski, S.; Rademakers, F.E.; Desmet, W.; Van de Werf, F.; Bogaert, J. Impact of myocardial haemorrhage on left ventricular function and remodelling in patients with reperfused acute myocardial infarction. Eur. Heart J. 2009, 30, 1440–1449. [Google Scholar] [CrossRef] [PubMed] [Green Version]
- Eitel, I.; Desch, S.; Fuernau, G.; Hildebrand, L.; Gutberlet, M.; Schuler, G.; Thiele, H. Prognostic significance and determinants of myocardial salvage assessed by cardiovascular magnetic resonance in acute reperfused myocardial infarction. J. Am. Coll. Cardiol. 2010, 55, 2470–2479. [Google Scholar] [CrossRef] [PubMed]
- Rishu, A.H.; Khan, R.; Al-Dorzi, H.M.; Tamim, H.M.; Al-Qahtani, S.; Al-Ghamdi, G.; Arabi, Y.M. Even mild hyperlactatemia is associated with increased mortality in critically ill patients. Crit. Care 2013, 17, R197. [Google Scholar] [CrossRef] [PubMed] [Green Version]
- Walker, C.A.; Griffith, D.M.; Gray, A.J.; Datta, D.; Hay, A.W. Early lactate clearance in septic patients with elevated lactate levels admitted from the emergency department to intensive care: Time to aim higher? J. Crit. Care 2013, 28, 832–837. [Google Scholar] [CrossRef]
- Fuernau, G.; Desch, S.; de Waha-Thiele, S.; Eitel, I.; Neumann, F.J.; Hennersdorf, M.; Felix, S.B.; Fach, A.; Böhm, M.; Pöss, J.; et al. Arterial Lactate in Cardiogenic Shock: Prognostic Value of Clearance Versus Single Values. JACC Cardiovasc. Interv. 2020, 13, 2208–2216. [Google Scholar] [CrossRef]
- Jentzer, J.C.; van Diepen, S.; Barsness, G.W.; Henry, T.D.; Menon, V.; Rihal, C.S.; Naidu, S.S.; Baran, D.A. Cardiogenic Shock Classification to Predict Mortality in the Cardiac Intensive Care Unit. J. Am. Coll. Cardiol. 2019, 74, 2117–2128. [Google Scholar] [CrossRef]
- Baran, D.A.; Grines, C.L.; Bailey, S.; Burkhoff, D.; Hall, S.A.; Henry, T.D.; Hollenberg, S.M.; Kapur, N.K.; O’Neill, W.; Ornato, J.P.; et al. SCAI clinical expert consensus statement on the classification of cardiogenic shock: This document was endorsed by the American College of Cardiology (ACC), the American Heart Association (AHA), the Society of Critical Care Medicine (SCCM), and the Society of Thoracic Surgeons (STS) in April 2019. Catheter. Cardiovasc. Interv. 2019, 94, 29–37. [Google Scholar]
- Hansson, G.K. Inflammation and Atherosclerosis: The End of a Controversy. Circulation 2017, 136, 1875–1877. [Google Scholar] [CrossRef] [PubMed]
- Chatterjee, K.; Gupta, T.; Goyal, A.; Kolte, D.; Khera, S.; Shanbhag, A.; Patel, K.; Villablanca, P.; Agarwal, N.; Aronow, W.S.; et al. Association of Obesity With In-Hospital Mortality of Cardiogenic Shock Complicating Acute Myocardial Infarction. Am. J. Cardiol. 2017, 119, 1548–1554. [Google Scholar] [CrossRef]
- Bucholz, E.M.; Beckman, A.L.; Krumholz, H.A.; Krumholz, H.M. Excess weight and life expectancy after acute myocardial infarction: The obesity paradox reexamined. Am. Heart J. 2016, 172, 173–181. [Google Scholar] [CrossRef] [PubMed] [Green Version]
- Fukuoka, S.; Kurita, T.; Dohi, K.; Masuda, J.; Seko, T.; Tanigawa, T.; Saito, Y.; Kakimoto, H.; Makino, K.; Ito, M. Untangling the obesity paradox in patients with acute myocardial infarction after primary percutaneous coronary intervention (detail analysis by age). Int. J. Cardiol. 2019, 289, 12–18. [Google Scholar] [CrossRef]
- Kim, H.T.; Jung, S.Y.; Nam, J.H.; Lee, J.H.; Lee, C.H.; Son, J.W.; Kim, U.; Park, J.S.; Shin, D.G.; Her, S.H.; et al. Clinical Implication of ‘Obesity Paradox’ in Elderly Patients With Acute Myocardial Infarction. Heart Lung Circ. 2021, 30, 481–488. [Google Scholar] [CrossRef] [PubMed]

| Overall Population (n = 360) | IPTW Population (n = 718) | |||||
|---|---|---|---|---|---|---|
| High Serum Lactate | Low Serum Lactate | p Value | High Serum Lactate | Low Serum Lactate | p Value | |
| (n = 119) | (n = 241) | (n = 358) | (n =360) | |||
| Age | 61.5 ± 13.0 | 59.6 ± 11.4 | 0.180 | 59.8 ± 13.4 | 60.1 ± 11.4 | 0.763 |
| Male | 89 (74.8) | 205 (85.1) | 0.018 | 292 (81.4) | 394 (81.6) | 0.973 |
| Body mass index, kg/m² | 24.2 ± 4.0 | 24.8 ± 3.3 | 0.124 | 24.8 ± 4.3 | 24.6 ± 3.3 | 0.574 |
| Current smoker | 45 (37.8) | 106 (44.0) | 0.265 | 153 (42.8) | 150 (41.7) | 0.832 |
| Hypertension | 61 (51.3) | 104 (43.2) | 0.146 | 165 (46.1) | 166 (46.1) | >0.999 |
| Diabetes mellitus | 44 (37.0) | 51 (21.2) | 0.001 | 98 (27.3) | 97 (27.0) | 0.942 |
| Dyslipidemia | 19 (16.0) | 51 (21.2) | 0.241 | 55 (15.2) | 80 (22.1) | 0.096 |
| History of percutaneous coronary intervention | 13 (10.9) | 17 (7.1) | 0.211 | 30 (8.3) | 33 (9.1) | 0.793 |
| History of cerebrovascular accident | 8 (6.7) | 6 (2.5) | 0.078 | 27 (7.4) | 10 (2.7) | 0.040 |
| Clinical presentation | ||||||
| NSTEMI | 35 (29.4) | 85 (35.3) | 0.267 | 120 (33.5) | 121 (33.5) | >0.999 |
| STEMI | 84 (70.6) | 156 (64.7) | 0.267 | 238 (66.5) | 239 (66.5) | >0.999 |
| Laboratory findings | ||||||
| NT-proBNP, pg/mL | 240.0 (66.4–1098.8) | 186.4 (51.4–862.9) | 0.126 | 198.7 (57.3–849.4) | 196.9 (53.6–926.3) | 0.618 |
| White blood cell, ×103/μL | 15.7 ± 6.5 | 11.5 ± 3.5 | <0.001 | 15.4 ± 6.0 | 11.5 ± 3.5 | <0.001 |
| Hemoglobin, g/dL | 14.0 ± 1.9 | 14.4 ± 1.9 | 0.062 | 14.3 ± 1.9 | 14.3 ± 2.0 | 0.876 |
| Platelet ×103/μL | 237.6 ± 65.6 | 229.4 ± 60.1 | 0.240 | 236.2 ± 60.2 | 231.6 ± 61.3 | 0.472 |
| Peak CK-MB, ng/mL | 143.1 (40.6–293.2) | 88.6 (29.2–214.2) | 0.002 | 148.6 (56.2–287.4) | 90.7 (28.5–214.1) | <0.001 |
| Concomitant medications | ||||||
| Aspirin | 117 (98.3) | 239 (99.2) | 0.602 | 353 (98.6) | 356 (99.0) | 0.729 |
| P2Y12 inhibitor | 117 (98.3) | 237 (98.3) | 1.000 | 352 (98.3) | 354 (98.4) | 0.943 |
| Beta blocker | 104 (87.4) | 216 (89.6) | 0.526 | 313 (87.4) | 325 (90.3) | 0.385 |
| ACE inhibitor or ARB | 93 (78.2) | 193 (80.1) | 0.670 | 283 (79.0) | 287 (79.7) | 0.867 |
| Statin | 112 (94.1) | 228 (94.6) | 0.849 | 339 (94.6) | 342 (95.0) | 0.853 |
| Overall Population (n = 360) | IPTW Population (n = 718) | |||||
|---|---|---|---|---|---|---|
| High Serum Lactate | Low Serum Lactate | p Value | High Serum Lactate | Low Serum Lactate | p Value | |
| (n = 119) | (n = 241) | (n = 358) | (n =360) | |||
| Infarct-related artery | 0.782 | 0.635 | ||||
| Left anterior descending artery | 58 (48.7) | 113 (46.9) | 161 (44.8) | 165 (45.8) | ||
| Left circumflex artery | 18 (15.1) | 36 (14.9) | 55 (15.4) | 54 (15.1) | ||
| Right coronary artery | 43 (36.1) | 90 (37.3) | 142 (39.8) | 137 (38.2) | ||
| Left main artery | 0 (0.00) | 2 (0.8) | 0 (0.00) | 3 (0.9) | ||
| Multi-vessel disease | 56 (47.1) | 121 (50.4) | 0.549 | 175 (48.9) | 177 (49.1) | 0.976 |
| TIMI flow grade before PCI | 0.988 | 0.921 | ||||
| 0 | 81 (68.1) | 161 (66.8) | 249 (69.5) | 244 (67.9) | ||
| 1 | 6 (5.0) | 14 (5.8) | 17 (4.8) | 23 (6.4) | ||
| 2 | 16 (13.4) | 34 (14.1) | 48 (13.5) | 49 (13.5) | ||
| 3 | 16 (13.4) | 32 (13.3) | 44 (12.3) | 44 (12.2) | ||
| Final TIMI flow grade 3 after PCI | 107 (90.7) | 214 (92.6) | 0.523 | 320 (89.4) | 322 (89.5) | 0.346 |
| Angiographic no reflow phenomenon | 7 (5.9) | 14 (6.1) | 0.962 | 20 (5.5) | 22 (6.2) | 0.746 |
| Presence of collateral flow | 51 (44.3) | 127 (58.0) | 0.018 | 164 (45.9) | 191 (52.9) | 0.063 |
| Myocardial blush grade | 0.367 | 0.450 | ||||
| 0 | 2 (1.7) | 1 (0.5) | 7 (1.9) | 1 (0.4) | ||
| 1 | 1 (0.9) | 3 (1.4) | 4 (1.2) | 5 (1.3) | ||
| 2 | 15 (13.0) | 18 (8.6) | 43 (12.0) | 30 (8.3) | ||
| 3 | 97 (84.3) | 188 (89.5) | 290 (81.0) | 281 (78.1) | ||
| Aspiration thrombectomy | 65 (54.6) | 115 (47.7) | 0.218 | 191 (53.4) | 172 (47.8) | 0.291 |
| Use of GPIIb/IIIa inhibitor | 14 (12.2) | 36 (17.1) | 0.235 | 41 (11.4) | 55 (15.2) | 0.157 |
| Number of implanted stents | 1.21 ± 0.58 | 1.15 ± 0.36 | 0.591 | 1.2 ± 0.5 | 1.3 ± 0.7 | 0.126 |
| Stent diameter (mm) | 1.2 ± 0.5 | 1.3 ± 0.7 | 0.288 | 3.1 ± 0.5 | 3.1 ± 0.4 | 0.929 |
| Stent length (mm) | 30.2 ± 15.7 | 32.9 ± 17.6 | 0.193 | 30.3 ± 15.2 | 33.3 ± 18.1 | 0.113 |
| Overall Population (n = 360) | IPTW Population (n = 718) | |||||
|---|---|---|---|---|---|---|
| High Serum Lactate | Low Serum Lactate | p Value | High Serum Lactate | Low Serum Lactate | p Value | |
| (n = 119) | (n = 241) | (n = 358) | (n = 360) | |||
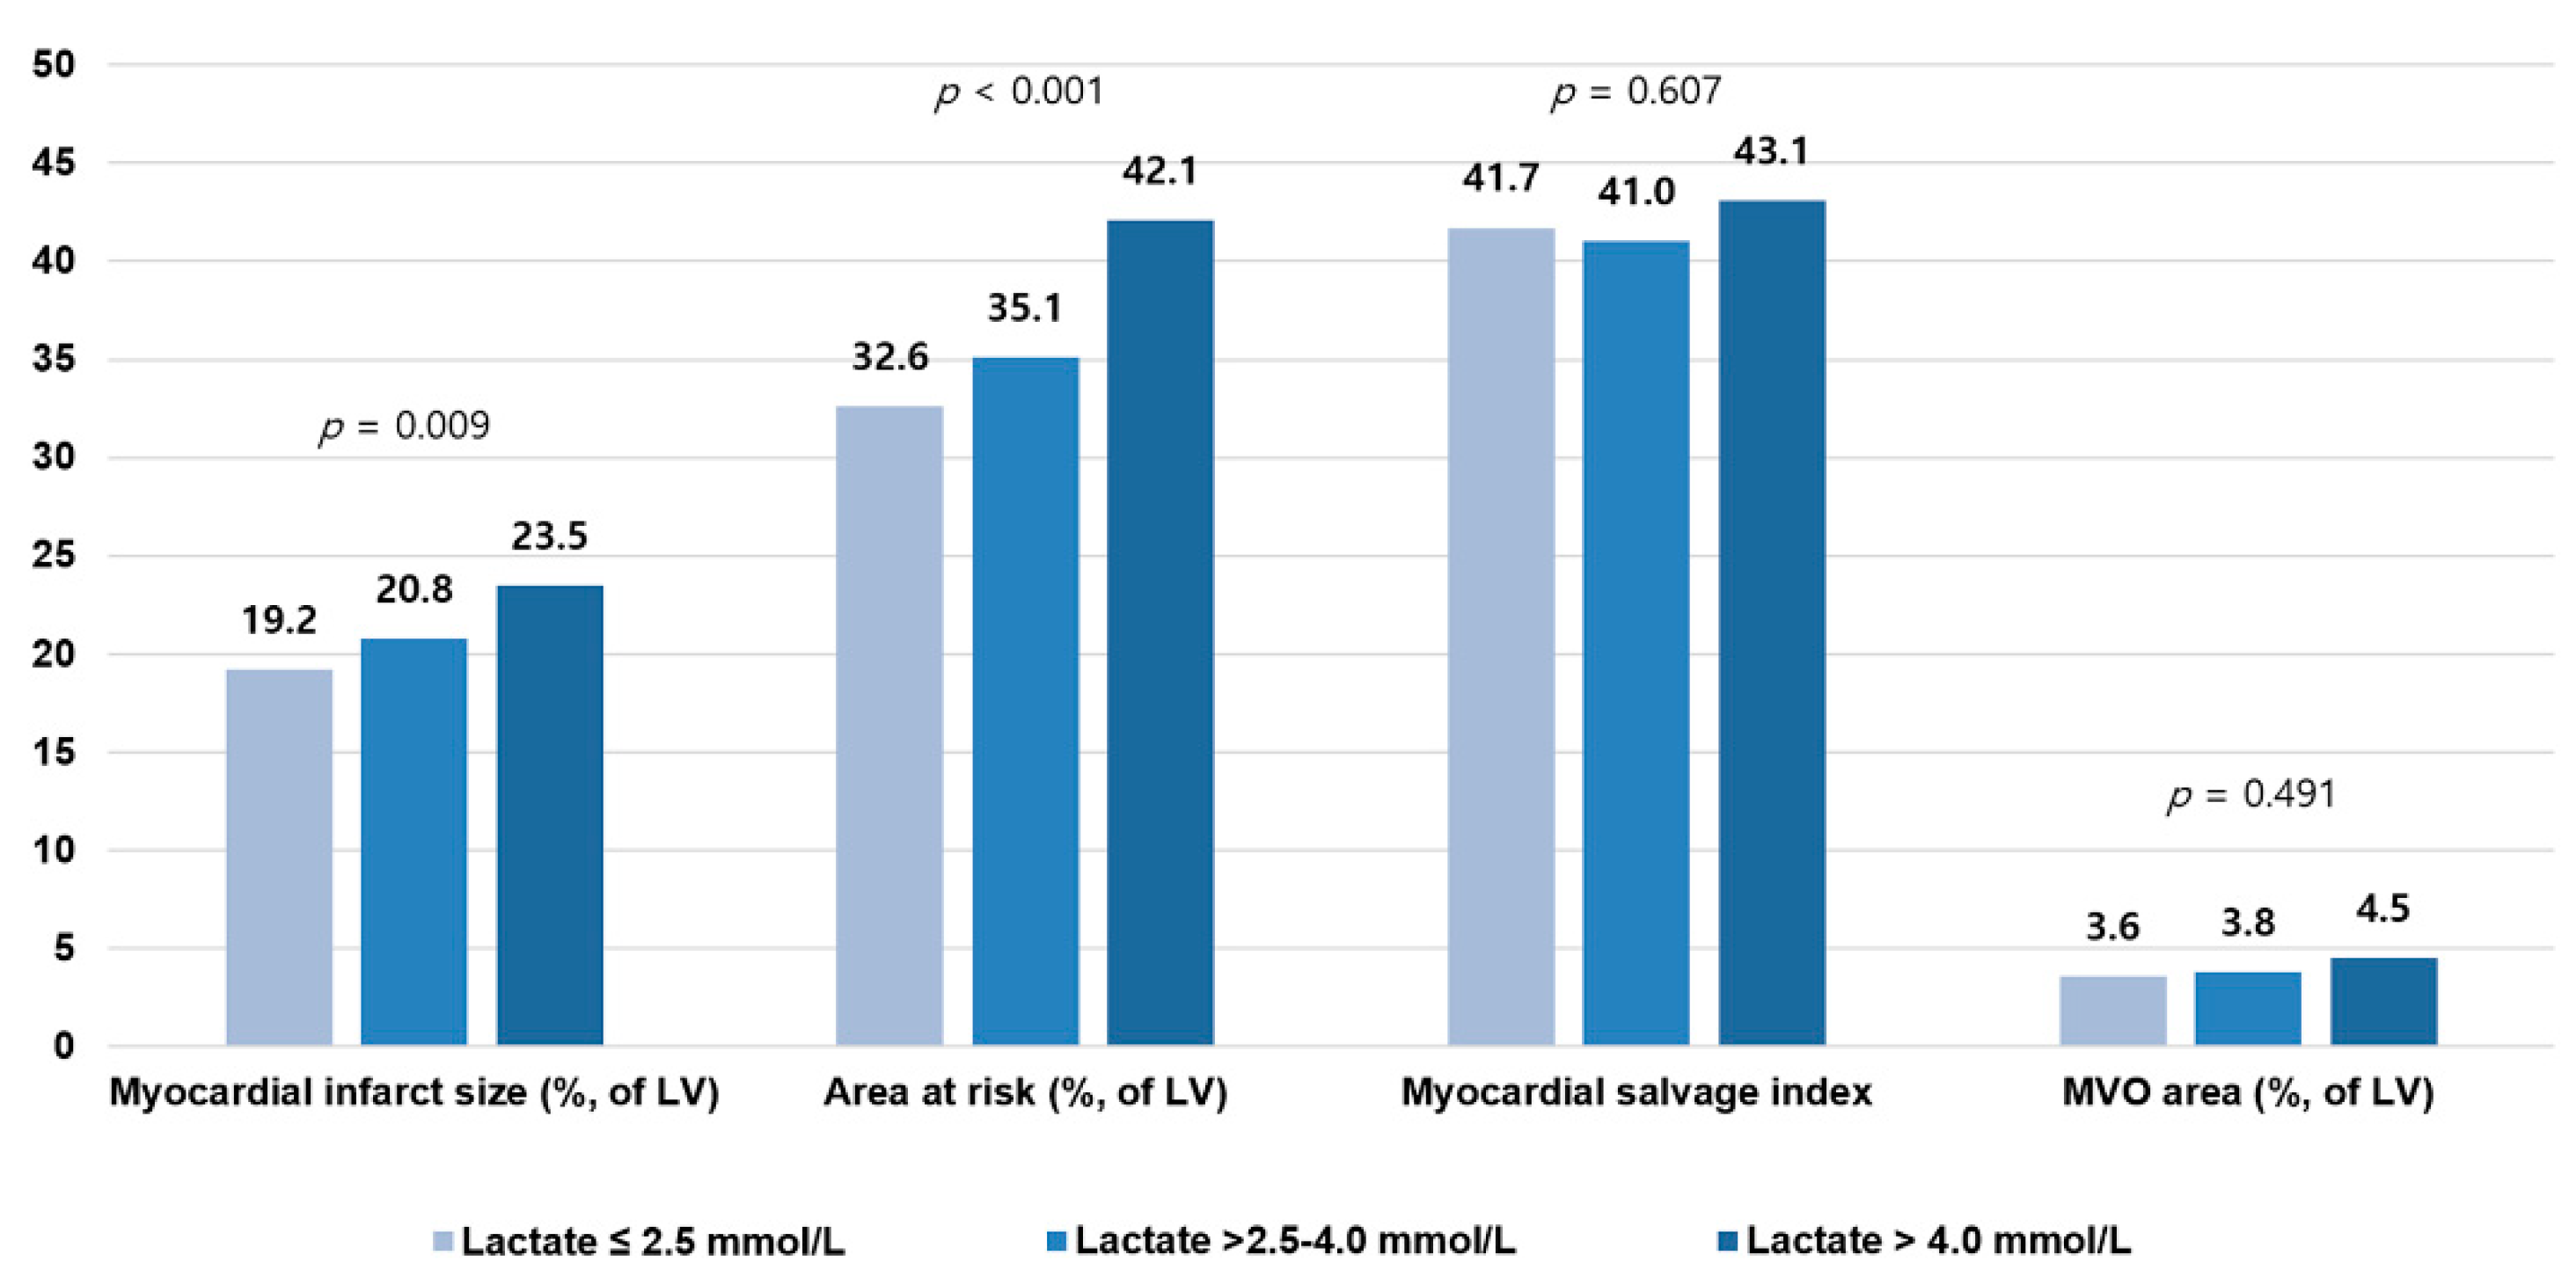
| Myocardial infarct size (%, of LV) | 22.0 ± 11.4 | 18.9 ± 10.5 | 0.011 | 21.5 ± 11.1 | 19.2 ± 10.4 | 0.044 |
| Area at risk (%, of LV) | 37.4 ± 17.7 | 32.1 ± 15.1 | 0.003 | 37.0 ± 17.2 | 32.7 ± 15.0 | 0.013 |
| Myocardial salvage index | 41.1 ± 16.6 | 41.6 ± 16.8 | 0.780 | 41.5 ± 16.8 | 41.8 ± 16.8 | 0.865 |
| MVO area (%, of LV) | 3.9 ± 5.7 | 3.6 ± 5.4 | 0.597 | 3.7 ± 5.5 | 3.6 ± 5.4 | 0.680 |
| Hemorrhagic infarction | 53 (44.9) | 96 (39.8) | 0.359 | 166 (46.3) | 143 (39.8) | 0.194 |
| LV end diastolic volume (mL) | 149.4 ± 42.3 | 151.7 ± 40.9 | 0.623 | 151.2 ± 40.2 | 150.8 ± 41.2 | 0.915 |
| LV end systolic volume (mL) | 77.6 ± 39.6 | 75.1 ± 36.8 | 0.557 | 77.0 ± 36.1 | 75.3 ± 36.9 | 0.663 |
| LV ejection fraction (%) | 50.1 ± 11.8 | 52.3 ± 11.2 | 0.090 | 50.7 ± 11.0 | 51.8 ± 11.3 | 0.354 |
| LV stroke volume (mL) | 71.8 ± 17.3 | 76.6 ± 16.7 | 0.011 | 74.2 ± 17.7 | 75.5 ± 16.8 | 0.489 |
| LV cardiac output (L/min) | 5.1 ± 1.1 | 5.2 ± 1.1 | 0.669 | 5.2 ± 1.1 | 5.1 ± 1.1 | 0.573 |
Publisher’s Note: MDPI stays neutral with regard to jurisdictional claims in published maps and institutional affiliations. |
© 2021 by the authors. Licensee MDPI, Basel, Switzerland. This article is an open access article distributed under the terms and conditions of the Creative Commons Attribution (CC BY) license (https://creativecommons.org/licenses/by/4.0/).
Share and Cite
Park, I.H.; Cho, H.K.; Oh, J.H.; Chun, W.J.; Park, Y.H.; Lee, M.; Kim, M.S.; Choi, K.H.; Kim, J.; Song, Y.B.; et al. Clinical Significance of Serum Lactate in Acute Myocardial Infarction: A Cardiac Magnetic Resonance Imaging Study. J. Clin. Med. 2021, 10, 5278. https://doi.org/10.3390/jcm10225278
Park IH, Cho HK, Oh JH, Chun WJ, Park YH, Lee M, Kim MS, Choi KH, Kim J, Song YB, et al. Clinical Significance of Serum Lactate in Acute Myocardial Infarction: A Cardiac Magnetic Resonance Imaging Study. Journal of Clinical Medicine. 2021; 10(22):5278. https://doi.org/10.3390/jcm10225278
Chicago/Turabian StylePark, Ik Hyun, Hyun Kyu Cho, Ju Hyeon Oh, Woo Jung Chun, Yong Hwan Park, Mirae Lee, Min Sun Kim, Ki Hong Choi, Jihoon Kim, Young Bin Song, and et al. 2021. "Clinical Significance of Serum Lactate in Acute Myocardial Infarction: A Cardiac Magnetic Resonance Imaging Study" Journal of Clinical Medicine 10, no. 22: 5278. https://doi.org/10.3390/jcm10225278
APA StylePark, I. H., Cho, H. K., Oh, J. H., Chun, W. J., Park, Y. H., Lee, M., Kim, M. S., Choi, K. H., Kim, J., Song, Y. B., Hahn, J.-Y., Choi, S.-H., Lee, S.-C., Gwon, H.-C., Choe, Y. H., & Jang, W. J. (2021). Clinical Significance of Serum Lactate in Acute Myocardial Infarction: A Cardiac Magnetic Resonance Imaging Study. Journal of Clinical Medicine, 10(22), 5278. https://doi.org/10.3390/jcm10225278