Next Article in Journal
Clinical Features of LMNA-Related Cardiomyopathy in 18 Patients and Characterization of Two Novel Variants
Next Article in Special Issue
Effect of the Renin-Angiotensin-Aldosterone System Reactivity on Endothelial Function and Modulative Role of Valsartan in Male Subjects with Essential Hypertension
Previous Article in Journal
Cardiopulmonary Exercise Test Parameters in Athletic Population: A Review
Previous Article in Special Issue
A Review of the Molecular Mechanisms Underlying Cardiac Fibrosis and Atrial Fibrillation
 
 
jcm-logo
Article Menu

Article Menu

Article

Gut Microbiome in Chronic Coronary Syndrome Patients

by
Emilia Sawicka-Smiarowska
1,2,
Kinga Bondarczuk
3,
Witold Bauer
4,
Magdalena Niemira
4,
Anna Szalkowska
4,
Justyna Raczkowska
4,
Miroslaw Kwasniewski
3,
Ewa Tarasiuk
2,
Marlena Dubatowka
1,
Magda Lapinska
1,
Malgorzata Szpakowicz
1,
Zofia Stachurska
1,
Anna Szpakowicz
2,
Pawel Sowa
1,
Andrzej Raczkowski
1,
Marcin Kondraciuk
1,
Magdalena Gierej
1,
Joanna Motyka
1,
Jacek Jamiolkowski
1,
Mateusz Bondarczuk
3,
Malgorzata Chlabicz
1,5,
Jolanta Bucko
6,
Marcin Kozuch
5,
Slawomir Dobrzycki
5,
Jerzy Bychowski
6,
Wlodzimierz Jerzy Musial
2,
Adrian Godlewski
4,
Michal Ciborowski
4,
Attila Gyenesei
4,
Adam Kretowski
4 and
Karol Adam Kaminski
1,*
add Show full author list remove Hide full author list
1
Department of Population Medicine and Lifestyle Diseases Prevention, Medical University of Bialystok, 15-269 Bialystok, Poland
2
Department of Cardiology, Medical University of Bialystok, 15-269 Bialystok, Poland
3
Centre for Bioinformatics and Data Analysis, Medical University of Bialystok, 15-269 Bialystok, Poland
4
Clinical Research Centre, Medical University of Bialystok, 15-269 Bialystok, Poland
5
Department of Invasive Cardiology, Medical University of Bialystok, 15-269 Bialystok, Poland
6
Department of Cardiology, Bialystok Regional Hospital, 15-950 Bialystok, Poland
*
Author to whom correspondence should be addressed.
J. Clin. Med. 2021, 10(21), 5074; https://doi.org/10.3390/jcm10215074
Submission received: 2 September 2021 / Revised: 26 October 2021 / Accepted: 27 October 2021 / Published: 29 October 2021
(This article belongs to the Special Issue The Risk Factors of Cardiovascular Diseases)

Abstract

:
Despite knowledge of classical coronary artery disease (CAD) risk factors, the morbidity and mortality associated with this disease remain high. Therefore, new factors that may affect the development of CAD, such as the gut microbiome, are extensively investigated. This study aimed to evaluate gut microbiome composition in CAD patients in relation to the control group. We examined 169 CAD patients and 166 people in the control group, without CAD, matched in terms of age and sex to the study group. Both populations underwent a detailed health assessment. The microbiome analysis was based on the V3–V4 region of the 16S rRNA gene (NGS method). Among 4074 identified taxonomic units in the whole population, 1070 differed between study groups. The most common bacterial types were Firmicutes, Bacteroidetes, Proteobacteria, and Actinobacteria. Furthermore, a higher Firmicutes/Bacteroidetes ratio in the CAD group compared with the control was demonstrated. Firmicutes/Bacteroidetes ratio, independent of age, sex, CAD status, LDL cholesterol concentration, and statins treatment, was related to altered phosphatidylcholine concentrations obtained in targeted metabolomics. Altered alpha-biodiversity (Kruskal–Wallis test, p = 0.001) and beta-biodiversity (Bray–Curtis metric, p < 0.001) in the CAD group were observed. Moreover, a predicted functional analysis revealed some taxonomic units, metabolic pathways, and proteins that might be characteristic of the CAD patients’ microbiome, such as increased expressions of 6-phospho-β-glucosidase and protein-N(pi)-phosphohistidine-sugar phosphotransferase and decreased expressions of DNA topoisomerase, oxaloacetate decarboxylase, and 6-beta-glucosidase. In summary, CAD is associated with altered gut microbiome composition and function.

1. Introduction

Among the non-infectious diseases, cardiovascular pathologies are significant causes of mortality (49% of all deaths) [1]. Among them, coronary artery disease (CAD) is one of the most common causes of hospitalization (more than 20% of all hospitalizations), death, and disability in Poland and Europe [2]. Furthermore, CAD causes a decrease in quality of life and leads to very high social and economic costs, affecting both individuals and all of society.
It is well-known that the most common cause of CAD is atherosclerosis, which is tightly associated with a wide number of modifiable and non-modifiable risk factors [3]. Classical CAD risk factors were reliably described based on a Framingham cohort study [4]. Despite knowledge of these risk factors, morbidity and mortality associated with CAD remain high. As a consequence, it is necessary to seek new factors that may play a role in the development of CAD and influence the prognosis in this group of patients.
Recently, particular attention has been drawn to the endogenous microflora of the human body (microbiota), which inhabit various sites of the human body (with the largest amount in the intestines) and remains relatively unexplored. It should be emphasized that many bacterial species fail to grow in vitro. Therefore, new, innovative identification techniques (for instance, Next Generation Sequencing method—NGS—based on the V3–V4 region of the 16S rRNA) and new bioinformatics techniques are utilized. The 16S rRNA included in the smaller subunit (30S) of the prokaryotic ribosome, used in the mentioned method, is considered the best phylogenetic tool due to conserved fragments that are characteristic of certain taxonomic groups and enable the groups’ identification. The data from the literature showed that bacteria, with their host cells, form an interactive ecosystem of interdependencies and relationships. This influences both the metabolic (including, among others, metabolisms of phosphatidylcholine, lysophosphatidylcholine, and lysophosphatidylethanolamine [5]) and immune processes of the host [6,7]. Additional factors are gut permeability, bacteria translocation, and endotoxemia. All of the above-mentioned processes could contribute to CAD development as an important part of the pathogenetic process.
The gut microbiota of adults mostly consists of Firmicutes and Bacteroidetes that, together with Actinobacteria and Proteobacteria, account for nearly 99% of the intestinal microbiome [8]. Data from the literature indicate a significant change in the profile of the gut microbiome in various pathological conditions such as gastrointestinal diseases (inflammatory bowel diseases, irritable bowel syndrome) [9,10,11], autoimmune and inflammatory diseases (asthma, allergies, type 1 diabetes) [12,13], metabolic syndrome, type 2 diabetes, obesity [14,15], abnormal lipid profile [16], and hypertension [17].
Furthermore, a link between the intestinal microbiome and atherosclerosis of coronary arteries was also suggested [18,19,20]. A scientific report analyzing the microbial composition showed an increase in Lactobacillales and a decrease in Bacteroidetes (Bacteroides + Prevotella) in CAD patients compared with control and healthy groups [9,18]. The study of Zhu Q. et al. described an increase in Escherichia-Shigella and Enterococcus and a decrease in Faecalibacterium, Subdoligranulum, Roseburia, and Eubacterium rectale in the CAD group [20]. Furthermore, a study by Liu H. et al., showed that the abundance of several LPS-producing Gram-negative bacteria, such as Veillonella, Haemophilus, and Klebsiella, increased with CAD severity, while butyric-acid-producing bacteria such as Lachnospiraceae and Ruminococcaceae decreased with CAD development [21]. Another important study revealed that the taxa Ruminococcus torques in patients with stable CAD and type 2 diabetes mellitus have a predictive value in cardiac survival outcomes [22]. Moreover, it was shown that in altered CAD gut microbiome compositions [20], a higher Firmicutes/Bacteroidetes ratio plays an important role [18,23].
The study aims to assess the gut microbiome composition in the CAD patients in relation to a control group (without CAD, matched in terms of age and sex to the study group). Furthermore, we try to assess whether the marker of dysbiosis—Firmicutes/Bacteroidetes ratio—is related to biochemical and targeted metabolomics parameters.

2. Materials and Methods

2.1. Study Population

On the basis of the medical records, in the two-stage recruitment, 349 CAD patients aged 30–79 hospitalized 12–18 months prior to evaluation were identified. These CAD patients were hospitalized due to acute coronary syndrome (acute myocardial infarction with ST-segment elevation—STEMI, acute myocardial infarction with non-ST-segment elevation—NSTEMI, unstable angina/acute myocardial ischemia), or elective percutaneous coronary intervention (PCI) [24]. The inclusion and exclusion criteria used for recruitment are presented in Table 1.
The 349 consecutive CAD patients hospitalized in three Departments of Cardiology, who fulfilled all inclusion criteria, were invited to participate in the study. Ninety-two patients did not respond to our invitation, so we do not know why they did not agree to participate; it is likely that some of them died. Two hundred fifty-seven patients arrived for an initial visit. A few patients, despite providing consent for gut microbiome analysis, did not provide a stool sample. Furthermore, a few patients provided incorrectly collected stool samples.
The details of the participants’ medical history were collected from questionnaires at the time of the study entry. Starting in 2016, all patients underwent a detailed health assessment, with particular emphasis on the cardiovascular system. Furthermore, all of the participants were invited for a consultation visit, during which a physician discussed with them the obtained results. Patients were also asked to bring stool samples in the previously provided container (Stool Collection Tubes with Stool DNA stabilizer). From the stool sample, purified genomic DNA was isolated using the PSP-Spin Stool-DNA kit (Stratec), according to the manufacturer’s protocol. DNA was stored first at −20 °C, then −80 °C.
Finally, 169 CAD patients were included in the microbiome analysis. Further analyses were based on the V3–V4 region of the 16S rRNA gene (next generation sequencing) and bioinformatics analysis. Finally, the gut microbiome results were obtained for 169 CAD patients and 166 participants from the control group [25]. The control group consisted of 166 participants selected from inhabitants of the Bialystok. The goal of the selection algorithm was to maximize the p-value of the t-test for comparing age between patients and controls group and the p-value of Pearson’s chi-square test for comparing gender proportions. At the baseline visit, the control group received the same health assessment and stool sampling as the CAD group.

2.2. Quantitation of Metabolites Using an AbsoluteIDQ p180 Kit

Serum samples were stored at –80 °C until the day of analysis. On the day of analysis, samples were thawed on ice and then vortex-mixed for 1 min. Targeted analysis of serum samples was performed based on the procedure provided with the AbsoluteIDQ p180 kit (Biocrates Life Sciences AG, Innsbruck, Austria). Briefly, samples were prepared by adding 10 μL of the internal standards mixture supplied with the kit to each spot of a 96-well plate. Afterwards, 10 μL of calibration standard, QC samples, zero samples, and serum samples were added to the appropriate wells of the extraction plate. The plate was dried using the SpeedVac Concentrator (Savant SPD2010, Thermo Fisher Scientific, Waltham, MA, USA). After drying, derivatization with a mixture of ethanol, water, pyridine, and phenyl isothiocyanate was performed. Derivatization (25 min) was followed by drying the plate again. The analytes were extracted with 5 mM ammonium acetate in methanol. For LC-MS/MS analysis, sample extracts were diluted 1:1 with water, while for flow-injection MS/MS analysis (FIA-MS/MS), a 1:49 dilution with the Biocrates kit running solvent was performed.
Serum samples were quantified using ultrahigh performance liquid chromatography (1290 Infinity II, Agilent Technology, Santa Clara, CA, USA) coupled with a tandem mass spectrometer (6470 Triple Quad LC/MS, Agilent Technologies, Santa Clara, CA, USA) equipped with AJS-ESI ionization. The LC-MS/MS was operated in the multiple reaction monitoring (MRM) mode using positive (ESI+) ion mode. The specific MRM transitions for each analyte and internal standard were collected over the retention time window using the method provided with the kit. On the day of sample preparation, extracts from the LC part were injected for LC-MS measurements, while FIA-part analysis was performed the next day.
Raw spectral data were loaded into Biocrates’ MetIDQ (Version 8.7.1, Biocrates, Life Science AG, Innsbruck, Austria) software, where the peaks of biogenic amines and amino acids (LC-Part) were integrated. After, the concentration calculation was performed using an external seven-point calibration curve based on isotope-labeled internal standards. The quantification of acylcarnitines, glycerophospholipids, sphingolipids, and hexose sum (FIA-part) was carried out by a one-point internal standard calibration. Quality of analyses was controlled by the injection of quality control samples on three concentration levels, of which the medium level of the quality control sample (QC2) was injected in three replicates. Triplicate of zero samples (PBS) was used to calculate the limits of detection (LOD). The median values of all zero samples were used to calculate background noise per metabolite signal, whereas three times this value was calculated as the LOD.

2.3. Statistical Analysis

Descriptive statistics was performed using the Statistica 13.1 software (StatSoft Polska, Cracow, Poland). The distribution of all variables was verified with the Kolmogorov–Smirnov test. Accordingly, based on distribution, parametric and non-parametric tests were used, and data were presented as medians and interquartile ranges or means and standard deviations. Statistical hypotheses were verified at the 0.05 significance level.
The CLC Genomics Workbench program with the Microbial Genomics v21.0.1 module (QIAGEN, Aarhus A/S, http://www.clcbio.com accessed on 19 January 2021) was used to analyze the sequencing results of the gut microbiome. Identification of microorganisms to the genus level was conducted based on version 132 of the SILVA database, with the exclusion of the possibility to create operational taxonomic units (OTUs) de novo (“closed reference OTU picking” method). To infer functions from the taxonomic profiles, PICRUSt2 was used with default options [25]. The potential biomarkers were assessed with the use of the LEfSe method [26].

3. Results

3.1. Description of the Study Population

The final analysis included 169 CAD patients and 166 people from the control group, without CAD, matched in age and sex to the study group (Table 2).
As expected, the CAD group was characterized by more frequent atherosclerotic plaques in the carotid arteries, higher total and android fat mass, and lower heart rate during the electrocardiogram due to pharmacotherapy (Table 2). Additionally, in this group, NTproBNP concentration was two times higher compared to the control (Table 3). In the CAD group, lower red blood cells count, hemoglobin, total cholesterol, low- and high-density lipoprotein cholesterol, and iron were shown (Table 3). Furthermore, in the CAD group, higher creatinine and urea, fasting glucose, and HbA1c, gamma-glutamyl transpeptidase were revealed (Table 3). Among echocardiographic parameters, only ejection fraction and left atrium diameter differ between study groups. The lower value of ejection fraction and larger left atrium were observed in the CAD population (Table 2).

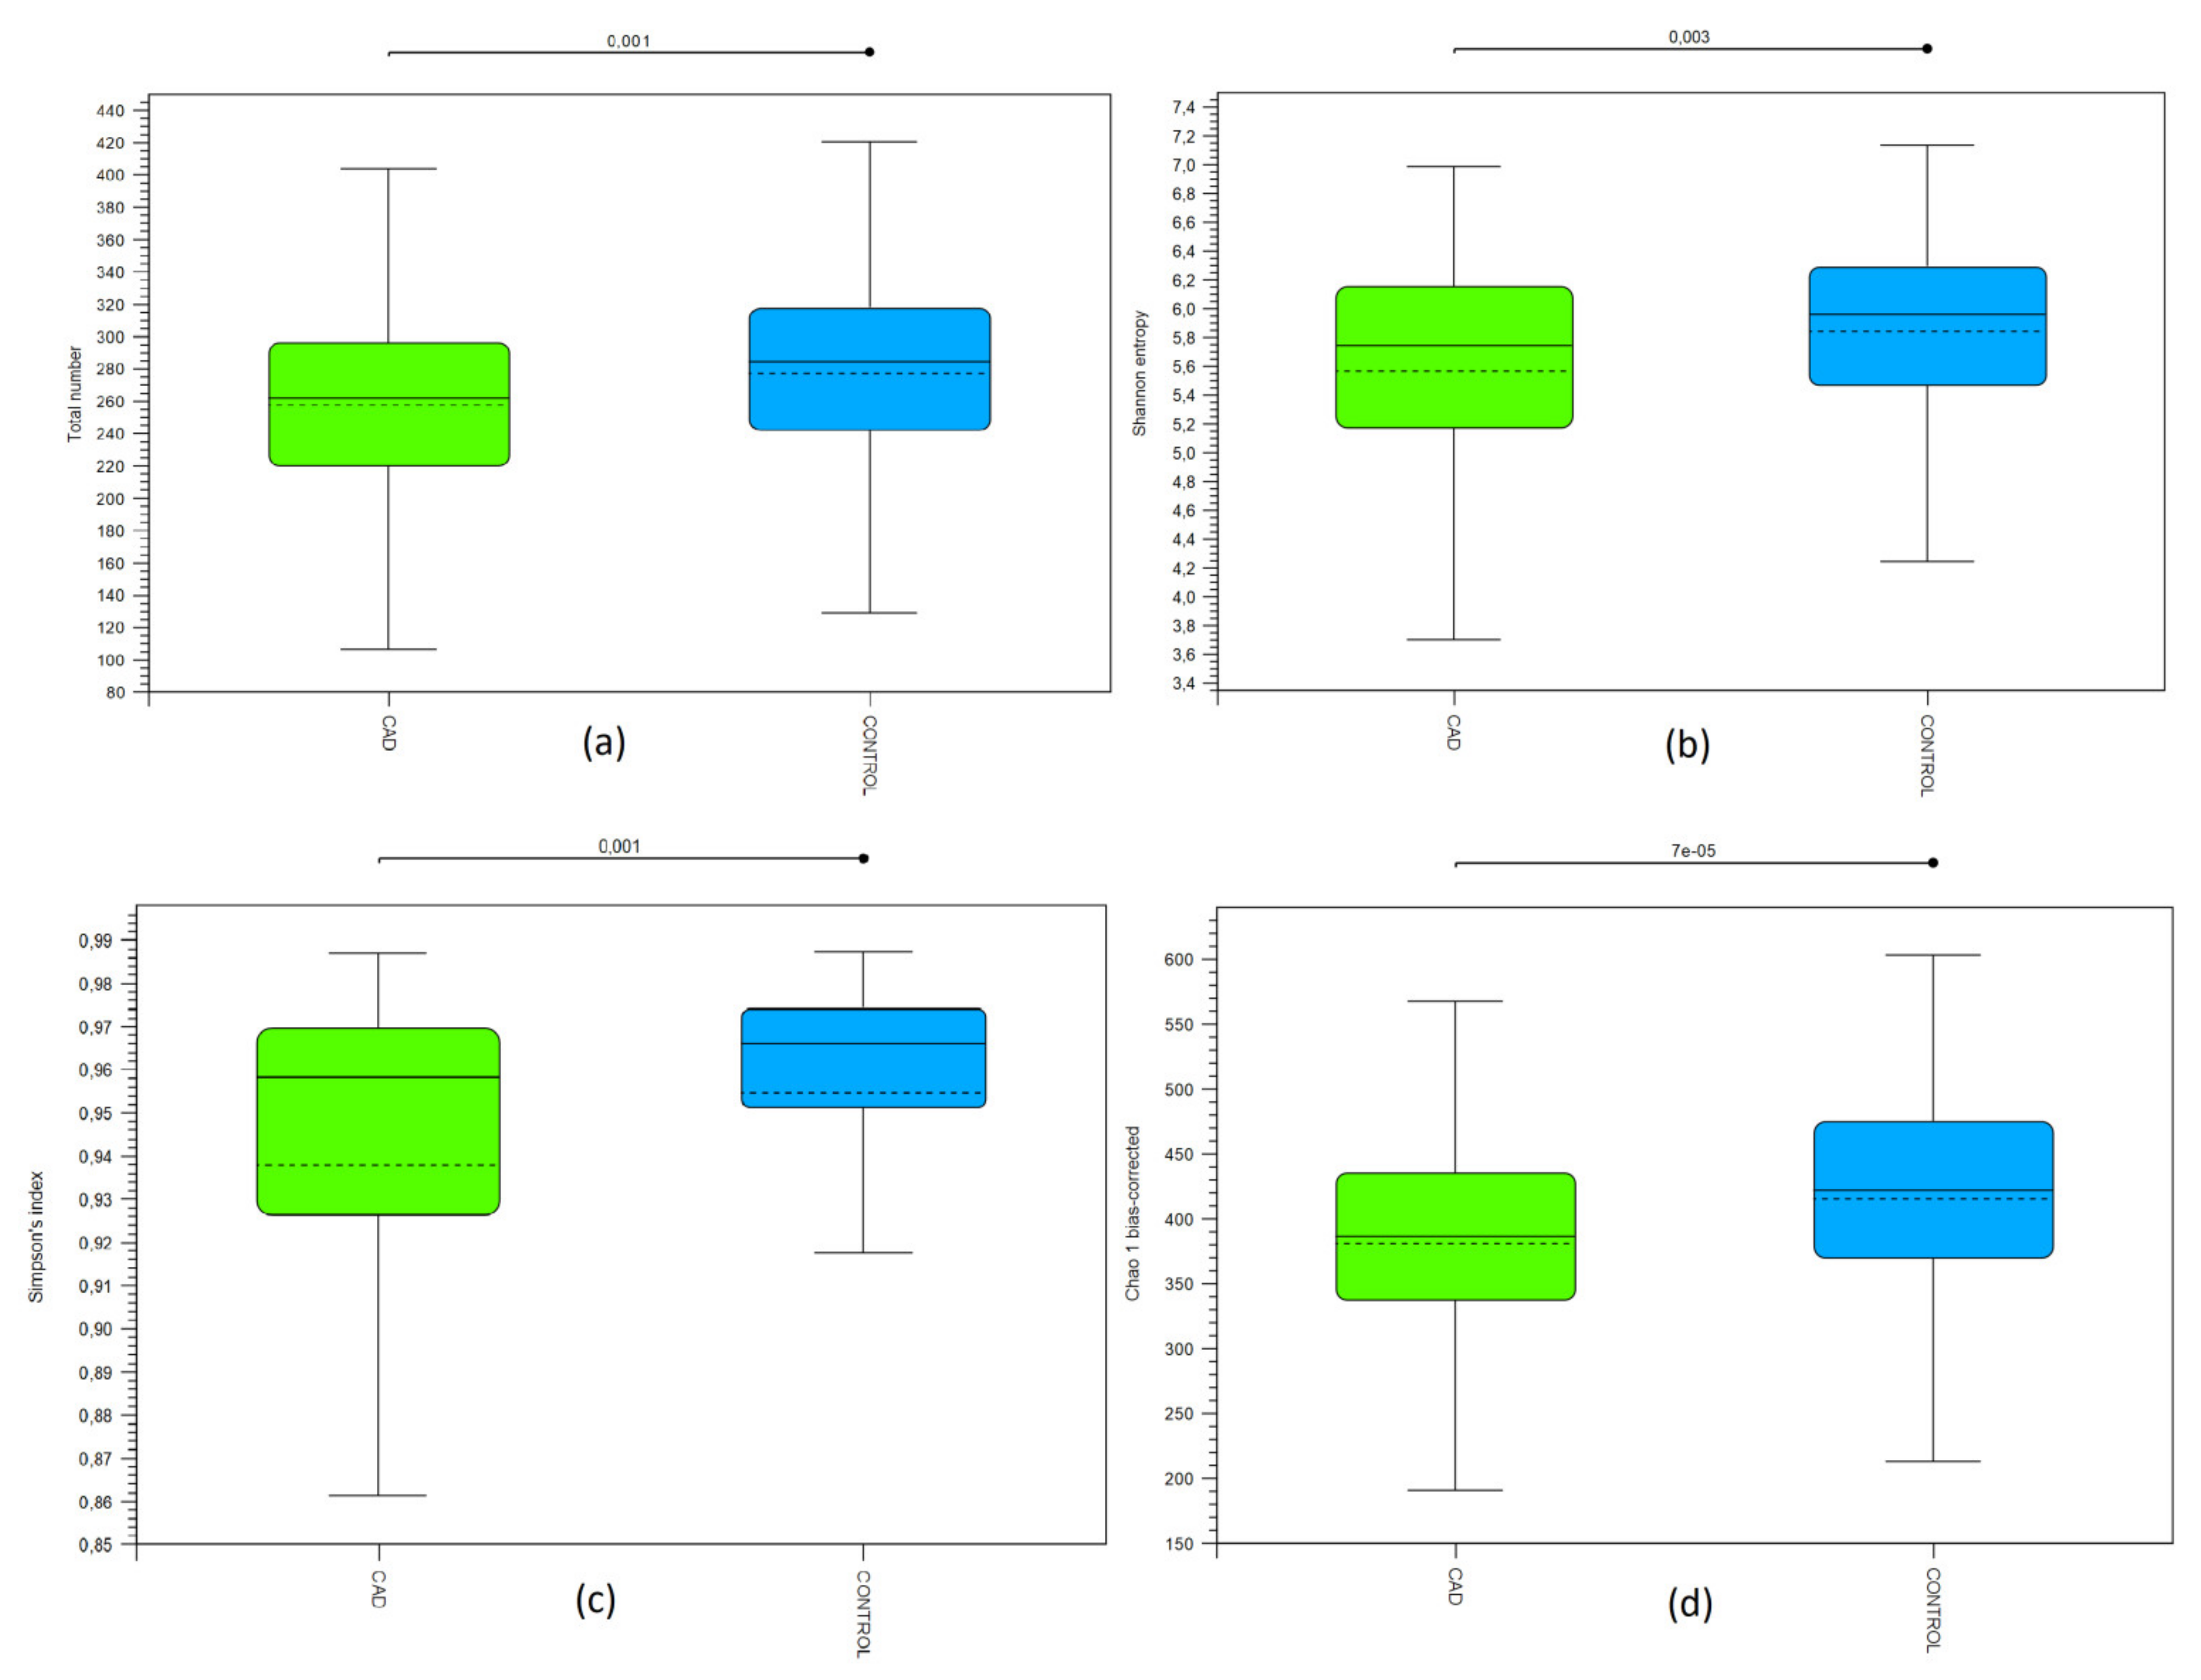
3.2. Bioinformatic Biodiversity Analysis

Bioinformatic analysis showed significant differences between the studied groups in terms of abundance (alpha-biodiversity). The CAD group was characterized by a lower amount of OTUs compared to the control (Figure 1a), lower Shannon entropy (Figure 1b), lower Simpson Index (Figure 1c), and Chao1bias-corrected estimator (Figure 1d).
Beta-biodiversity analysis showed significant differences between the studied groups (PERMANOVA based on the results of the Bray–Curtis metric; p < 0.001 using the Bonferroni correction).

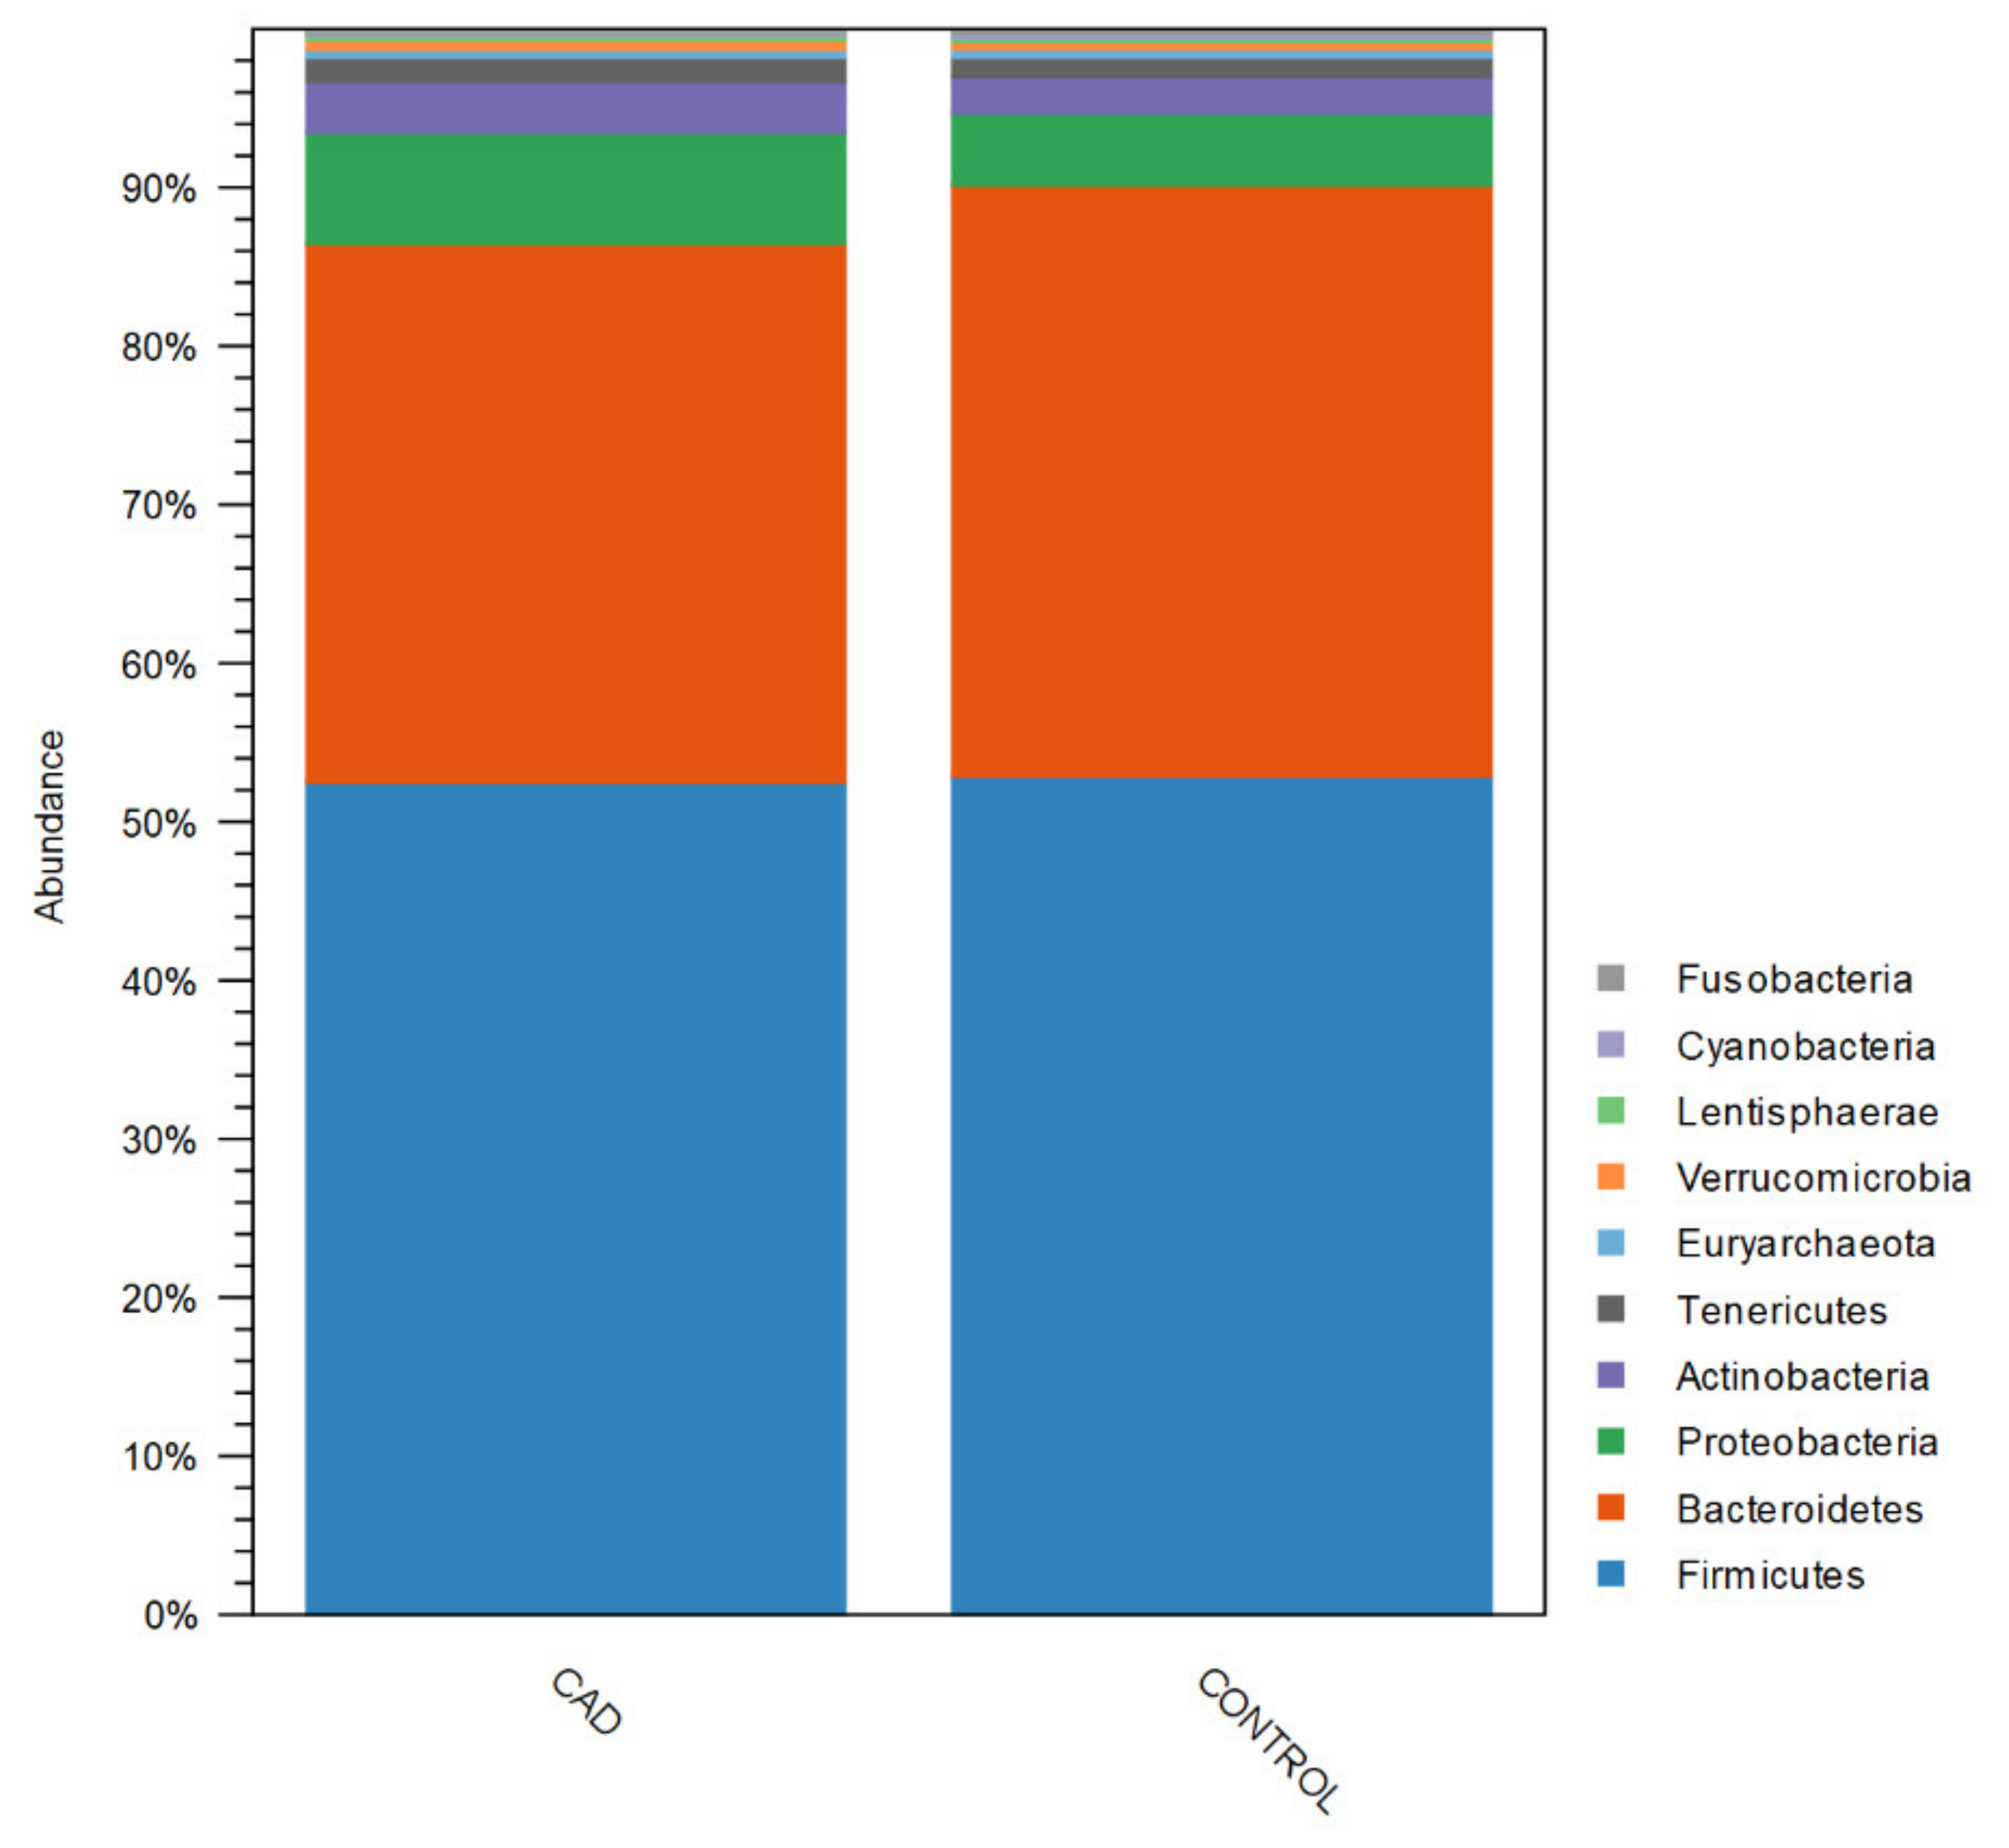
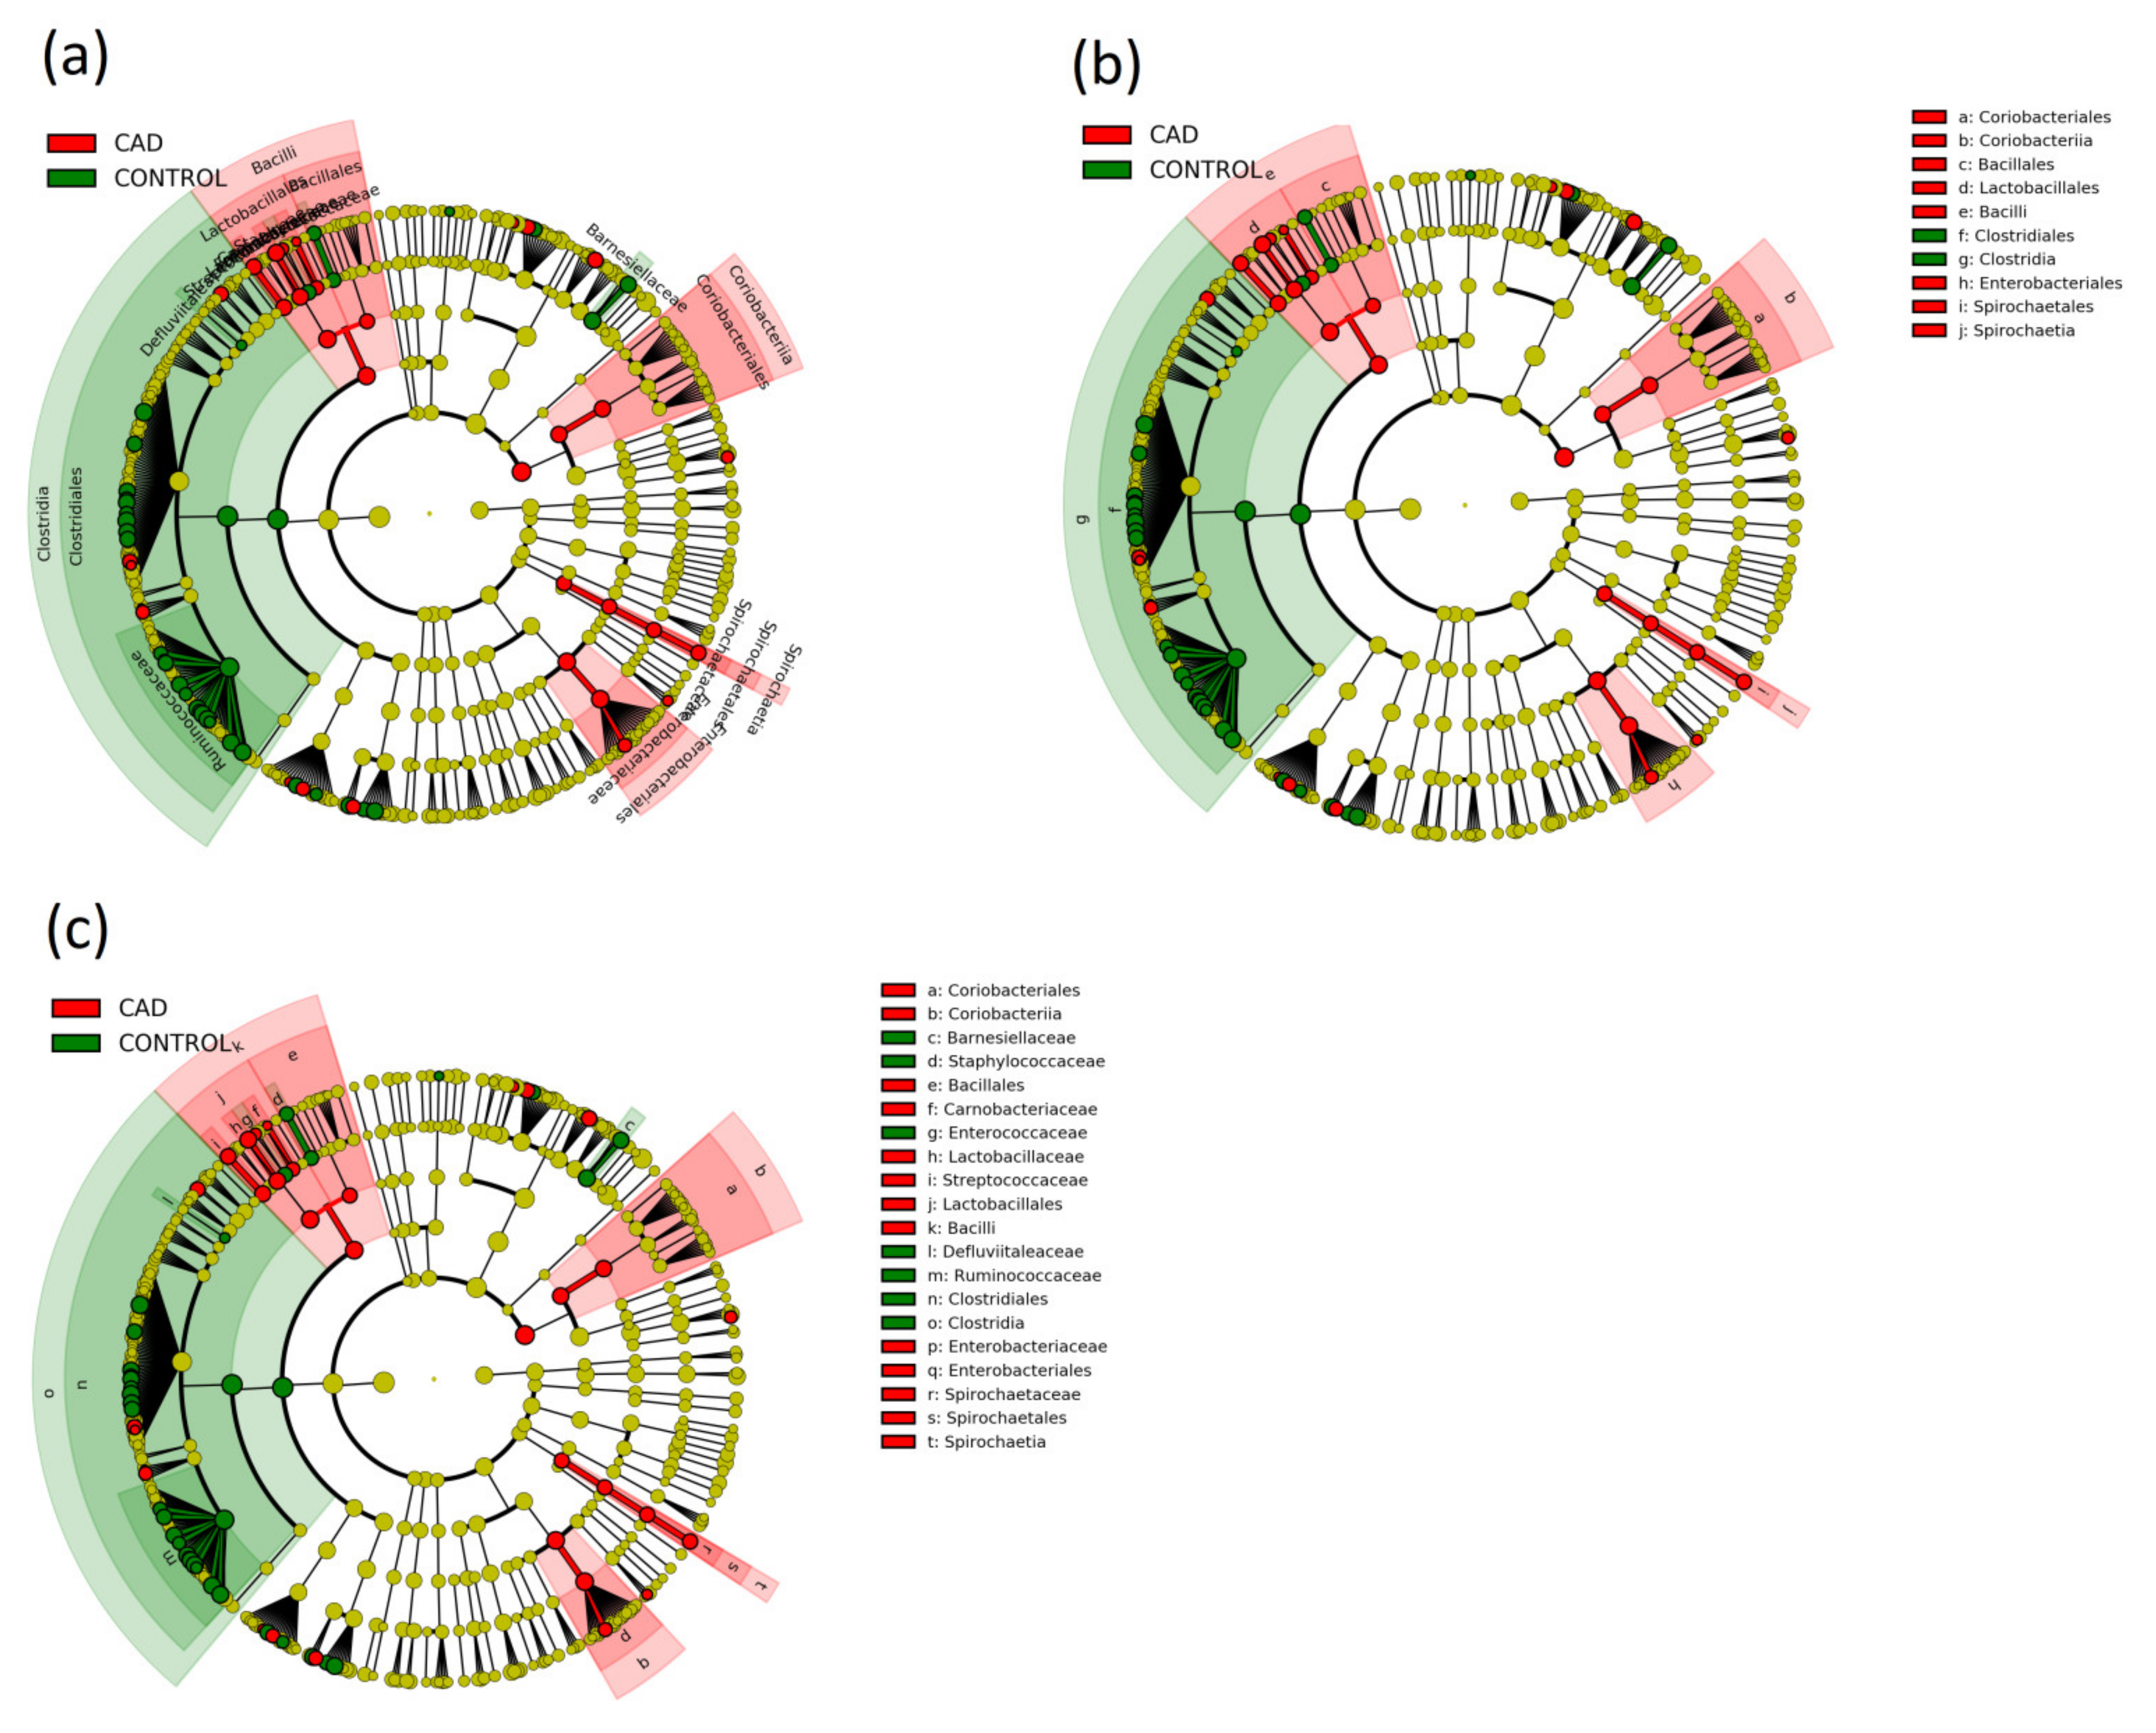
3.3. Gut Microbiome Composition Analysis

In total, 12,837,581 good-quality paired reads were obtained from both populations and grouped into 4074 OTUs. After removing the rare OTUs (less than 10 readings obtained for all samples in total), 2893 OTUs were used for further analysis.
Bioinformatics analysis showed that the most common bacterial phyla found in the gut microbiome of the studied populations were Firmicutes, Bacteroidetes, Proteobacteria, and Actinobacteria (Figure 2).
In the CAD group, a higher Firmicutes/Bacteroidetes ratio compared to the control was demonstrated (Figure 3; median 1.67 IQR: 0.95–3.0 vs. 1.42 IQR: 0.94–2.3, p = 0.03).
At the phylum level, we did not find any difference in Firmicutes between the studied groups (Supplementary Table S1). The relative abundance of Bacteroidetes was significantly decreased, while Proteobacteria increased in the CAD group (Table 4). We observed a trend for the increased relative abundance of Actinobacteria in CAD patients, but the difference was not significant (Supplementary Table S1). We did not find differences in terms of other phyla (Supplementary Table S1).
The most common classes in both groups were Clostridia and Bacteroidia (Supplementary Figure S1, Supplementary Table S1). We have found a statistically significant increase in Gammaproteobacteria and Bacilli and a decrease in Bacteroidia in the CAD group (Table 4).
The most common orders in both groups were Clostridiales and Bacteroidales (Supplementary Figure S2, Supplementary Table S1). Moreover, a statistically significant increase in Actinomycetales, Micrococcales, Lactobacillales, Enterobacteriales, and decrease in Bacteroidales in the CAD group were found (Table 4).
The most common families were Ruminococcsceae, Bacteroidaceae, Prevotellaceae, and Lachnospiraceae (Supplementary Figure S3). Among all bacteria families, we found a significant increase in the relative abundance of Actinomycetaceae, Micrococcaceae, Atopobiaceae, Lactobacillaceae, Streptococcaceae, Enterobacteriaceae, and a decrease in Barnesiellaceae in the CAD group (Supplementary Table S2).
It is worth underlining that 31 among 43 genera that differ between study groups were Clostridiales from Firmicutes (Supplementary Table S2).
Moreover, the most common microorganism in the entire (CAD and control) population, when considering the number of reads of the particular OTUs, was the genus Faecalibacterium of the Firmicutes (DQ808333.1.1386 SILVA, 359,139 reads). However, its abundance did not differ between study groups (p = 0.256).
Overall, we identified 1070 OTUs differentiating the studied groups, and 10 of them with the highest statistical significance are presented below (Table 5). Half of these microorganisms were in Firmicutes phylum. The most significant difference between studied populations was revealed for the Clostridiales vadin BB60 group from Firmicutes (Table 5). Its lower value was presented in the CAD group (Table 5).

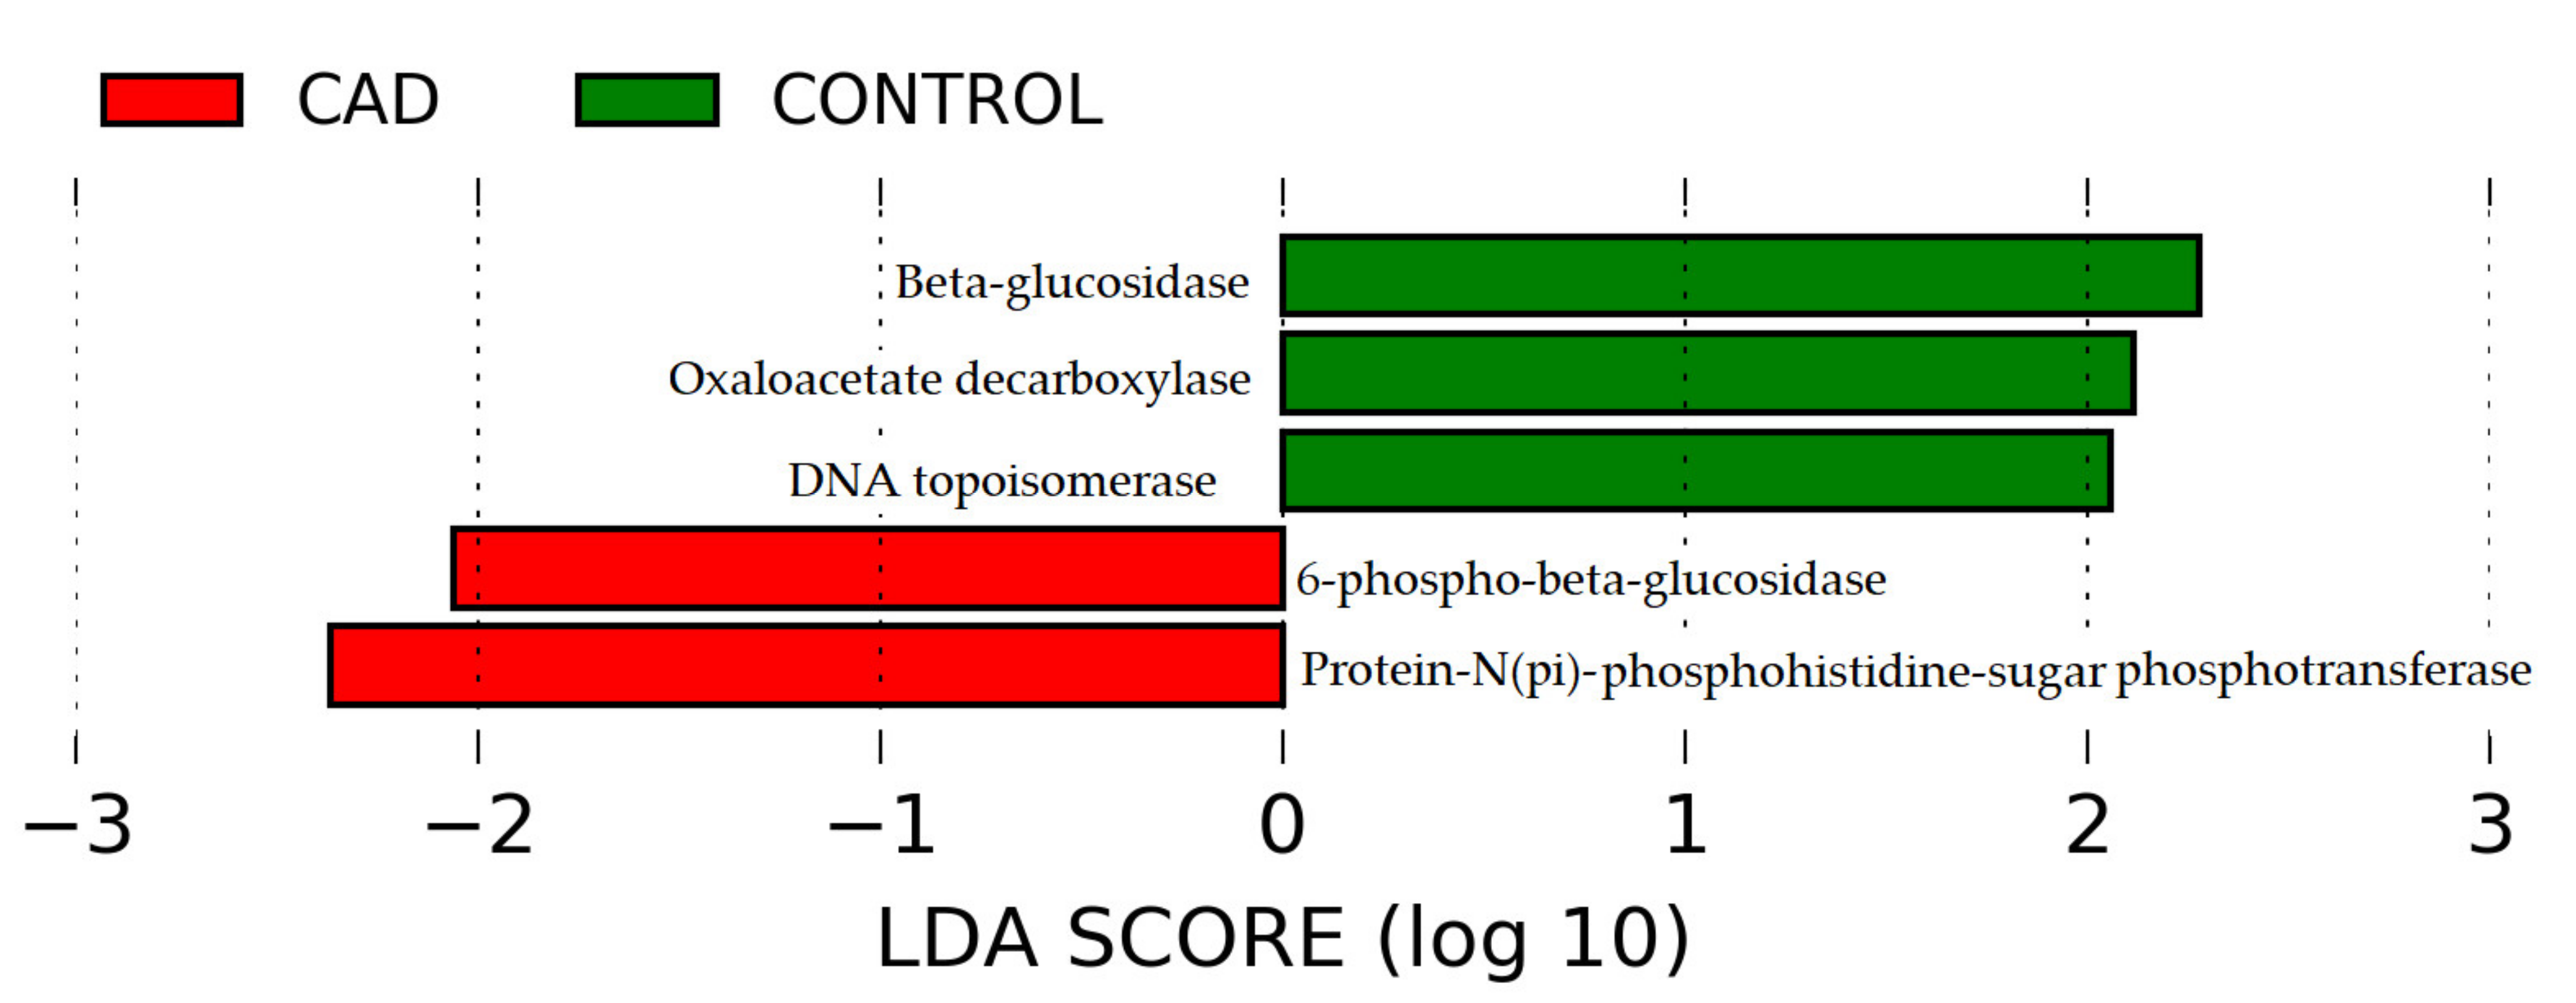
3.4. Prediction of the Functional Potential of the Intestinal Microbiome

Based on the obtained taxonomic profiles, with the use of PICRUSt2 (Phylogenetic Investigation of Communities by Reconstruction of Unobserved States) [26], the functional potential of the intestinal microbiome was predicted (Figure 4a–c).
Then, using the LEfSe method [27], potential alterations in CAD compared to healthy controls were determined: 136 at the taxonomic level (Supplementary Figure S5), 55 in metabolic pathways (Supplementary Figure S6), and 5 at the protein level (Figure 5). Further, LEfSe showed that, among others, Actinobacteria, Bacilli and Lactobacillales, Escherichia-Shigella, Streptococcus, Enterobacteriales, Coriobacteria, and Spirochateacea were more abundant in the CAD group. In contrast, Clostridia, Lachnospiraceae, Selenomonales, Ruminococcaceace, and Bacteroides were more abundant in the control group (Supplementary Figure S5).
Based on this indirect analysis, the microbiome of the control group is expected to participate more in vitamin (adenosylcobalamin, thiamin, riboflavin); amino acid (glutamine, arginine, asparagine, aspartate, serine, glycine); and saccharide (mannan, glycogen, gluconeogenesis, starch, fructuronate, galacturonate) pathways, whereas the CAD gut microbiome participates more in vitamin (menaquinol); hydroxy acid (mevalonate); amino acid (alanine, methionine, aspartate, threonine); polysaccharide (hexitol); and nucleoside (inosine, adenosine, guanosine) metabolism (Supplementary Figure S6).
In both groups, Clostridia and Bacterioidia potentially play a role in DNA topoisomerase, oxaloacetate decarboxylase, and 6-beta-glucosidase production (Supplementary Figures S7–S9), while Clostridia and Gammaproteobacteria might play a role in 6-phospho-beta-glucosidase and protein-N(pi)-phosphohistidine-sugar phosphotransferase production (Supplementary Figures S10 and S11).

3.5. Targeted Metabolomics and Biochemical Parameters

The median value of the Firmicutes/Bacteroidetes ratio in the whole study population (CAD and control groups) was defined at the level of 1.54. A higher Firmicutes/Bacteroidetes ratio after adjustment for age, sex, CAD status, LDL cholesterol concentration, and statins treatment was characterized by lower phosphatidylcholine with diacyl residue and sphingomyelin with acyl residue, whereas a higher concentration of hemoglobin, hematocrit, and two among three phosphatidylcholines with acyl-alkyl residue (Table 6). Furthermore, this group was characterized by lower total and LDL cholesterol after adjustment for age, sex, CAD status, and statins treatment (Table 6). There were no other statistically significant differences between the groups with a Firmicutes/Bacteroidetes ratio below and above the median in the context of other targeted metabolomes (Supplementary Table S3).

4. Discussion

The most important finding of the article is that the gut microbiome differs between CAD and control groups.
As expected, our results confirmed some of the findings from the literature in the aspect of microbiome composition. In our population, independent of the history of CAD, the most common bacterial phyla in the gut microbiome were Firmicutes, Bacteroidetes, Proteobacteria, and Actinobacteria [10,28]. At a phylum level, an increased relative abundance of Proteobacteria and Actinobacteria and a decreased abundance of Firmicutes and Bacteroidetes were revealed [20]. We confirmed the above-mentioned shifts of the microbiome with the exception of Firmicutes and only a trend for Actinobacteria.
Due to the numerous bacteria within each phylum, and their impact related to the health and individual features of the host, it is difficult to clearly define whether they are positive or negative. However, they seem to be related to different cardiovascular risk factors and diseases. Bacteroidetes are generally considered favorable, while Firmicutes’ role is ambiguous [29].
Most bacteria of the Firmicutes phylum have a Gram-positive cell wall structure. Its high abundance was connected to the indicators of unhealthy lifestyles, such as a high-fat diet [30], abnormal energy balance [31,32], and obesity [33]. On the other hand, some bacteria from this phylum are short-chain-fatty-acid (SCFA) producers, such as acetate, butyrate-producing species, that seems to have a beneficial impact on health by stimulating the host’s immune system, modulating metabolic health, and improving metrics of cardiovascular risk factors such as blood pressure, metabolism, and the integrity of the intestinal barrier [34]. Among butyrate producers, the most abundant species (in terms of reads, DQ808333.1.1386) in our population is Faecalibacterium from Ruminococcaceae. Although we did not reveal a decrease in Ruminococcaceae in CAD, it was revealed in both the article of Zhu Q. et al. [20] and Liu H. et al. [21]. According to the literature, Faecalibacterium prausnitzii was found to be the most abundant bacterium in the human intestinal microbiota of healthy adults, representing more than 5% of the total bacterial population [35]. Although this particular species did not differ between study groups, a higher relative abundance of the Faecalibacterium genus was found in the control group.
Another SCFAs-producing bacteria—Clostridiales vadin BB60, which was the most significantly different between study groups, was characterized by a higher abundance in the control population. Similarly, in the other work, this bacterium decreases with CAD development [20,21]. It has been shown that the Clostridiales vadin BB60 group [36,37] is inversely correlated with obesity, dyslipidemia, and insulin resistance in the mice model [38,39] and with BMI, weight, and waist in women [40]. Its reduction was also associated with high TMAO levels and thrombotic risk [41,42,43]. On the other hand, its increased abundance was shown in women with hyperglycemia in pregnancy [40].
Furthermore, in this study, similarly to other authors, we found an increase in the abundance of other protective taxa from Firmicutes-Lactobacillales from Bacilli in the CAD group [9,18,20]. These bacteria are characterized by lactic acid production as the main product of glucose and by growth inhibition substances such as bacteriocins, hydrogen peroxide, and diacyls [44]. These substances prevent the proliferation of food spoilage bacteria and pathogens [44].
Additionally, when we consider the genus level of Firmicutes, our results are consistent with the work of Zhu Q. et al., in which stool samples were collected from 70 patients with coronary artery disease and 98 healthy controls [20]. As in the mentioned study, we showed that Faecalibacterium, Roseburia dominated the control group compared to the CAD group, while Escherichia-Shigella were enriched bacteria in CAD patients [20].
The above-mentioned potentially pathological taxa from Proteobacteria such as Escherichia-Shigella were proven to increase in CAD patients [20]. It was demonstrated that the abundance of several Gram-negative bacteria, producing LPS, such as Haemophilus and Klebsiella, increased with CAD severity [21]. We did not observe any differences in the relative abundance of these genera; however, we confirmed an increase in Gammaproteobacteria and Enterobacteriales, Enterobacteriaceae in the CAD group. Moreover, we suspected a potential Gammaproteobacteria impact of bacterial 6-phospho-beta-glucosidase and protein-N(pi)-phosphohistidine-sugar phosphotransferase production.
Although the data concerning particular microbiota that alter in the CAD group mostly concern Firmicutes, there is some information on Bacteroidetes as well. The phylum Bacteroidetes is composed of Gram-negative bacteria, whose abundance increases with fiber consumption [45], a high-carbohydrate diet [46], and decreases with atherosclerosis progression [47]. This phylum includes bacteria producing SCFA such as acetate and propionate [34]. The scientific reports analyzing the microbial composition showed a decrease in Bacteroidetes (Bacteroides + Prevotella) in CAD patients compared to control [9,18,23]. Based on these findings, a preclinical study identified that oral gavage with live B. vulgatus and B. dorei attenuated the development of atherosclerosis in atherosclerosis-prone mice [48]. In our study, we confirm a significant decrease in Bacteroidetes, Bacteroidia, and Bacteroidales in CAD. However, we did not observe any differences in Prevotella, except for the genus Paraprevotella.
Prevotella was associated with a diet rich in non-digestible carbohydrates, such as fiber [49], and, despite its positive value, it seems to also have a negative influence on health. It played an important role in dysbiosis in pre- and hypertension patients [50]. This genus was also enriched among high lifetime cardiovascular disease risk profile Bogalusa Heart Study participants [51], and Prevotella copri was proven to be associated with cardiac valve calcification [52]. Moreover, in predicted functional analysis, Bacteroidia seems to play a role in DNA topoisomerase, oxaloacetate decarboxylase, and 6-beta-glucosidase production.
Although we only showed a trend in the increase in Actinobacteria phylum in the CAD group, we confirmed a statistically significant increase in the Actinomycetales and Micrococcaceae order.
Although findings regarding particular microorganisms profiles in CAD differ between studies, the most common result is an increase in Firmicutes/Bacteroidetes ratio and reduction in microbial diversity and richness [18,23,53,54]. This ratio is considered an indicator for gut dysbiosis. It was proven that the Firmicutes/Bacteroidetes ratio was significantly associated with many traditional cardiovascular risk factors such as diet [18,55], sex [56,57,58], age [59], and BMI [60]. Similarly, the Firmicutes/Bacteroidetes ratio value (not exceeding 2) was previously reported by Emoto T. et al. [18].
To verify the importance of the Firmicutes/Bacteroidetes ratio, we performed statistical analyses, including its value and targeted metabolome profile. We reveal that when we exclude the influence of age, sex, CAD status, LDL cholesterol concentration, and statins treatment, the Firmicutes/Bacteroidetes ratio is mostly related to phosphatidylcholine and sphingomyelin with its lower value in several phosphatidylcholines in a higher Firmicutes/Bacteroidetes ratio. To our knowledge, this is the first study that tries to reveal whether the Firmicutes/Bacteroidetes ratio, independent of main disease and other cofactors, might cause changes in metabolome. A previous study underlined that several phosphatidylcholines were lower in type 2 diabetic subjects with CAD [61] and in patients with silent myocardial ischemia as a consequence of coronary heart disease [62]. The authors suggest that lower serum phosphatidylcholine levels resulted from increased uptake, which is necessary for reconstructing damaged cardiomyocytes membrane due to the pathological process [61] and is a result of insufficient supply of ATP and CTP [62].
Interestingly, in our population, we identified more high-quality OTUs than in the literature (2893 vs. 1101 in the work of Zhu Q. et al. [20] and vs. 1308 OTUs in the article by Zheng Y.Y. et al. [28]). Due to the lack of influence of the number of OTUs by the NGS method, we suspected we only identified and included good-quality samples in the final analyses. According to the data concerning alpha-biodiversity presented in previous studies [20,55], in this study, in the CAD group, we showed a decreased number of OTUs as well as differences in alpha and beta-diversity.
Despite some differences in particular species and genera that we prove relevant in our study, generally, we found a similar gut microbiome pattern in the study that was presented in most of the previous articles, with the exception of the article by Zheng Y. et al. [28]. However, this article was based on the Chinese population with stable CAD, which might be the reason for different findings.
Interesting findings from our study are results from predicted functional microbiome analysis. In this study, we tried to not only identify particular potential alterations in CAD patients but also to provide some hypothetical relation between biomarker microorganisms, pathways, and their products. In the study, using the LEfSe method, we identified bacteria that differ between study groups. Our findings in terms of taxa identification are in line with the findings of Zhu Q. et al. and Toya T. et al. [20,54], and again are contrary to previously mentioned findings provided by Zheng Y.Y. et al. [28].
Importantly, in our article, all three potential product markers for the control group were connected to Clostridia and Bacterioidia, whereas those related to the CAD group were Clostridia and Gammaproteobacteria.
A beta-glucosidase (EC 3.2.1.21, cellobiase) was one of three potential control group markers. This enzyme degrades cellobiose units and oligodextrin to glucose [63]. Oxaloacetate decarboxylase (EC 4.1.1.3) is involved in the conversion of oxaloacetate into pyruvate [64]. The final product of glycolysis, pyruvate, is converted to acetyl-CoA and CO2 by the action of the pyruvate dehydrogenase complex. The product of the complex, acetyl-CoA, feeds into the TCA cycle I, a catabolic pathway that generates energy and reduces power as well as precursors for biosynthesis. In every turn, the TCA cycle converts one molecule of acetyl-CoA into two CO2 molecules, reduces a total of four molecules of either NAD+, NADP+, or quinone to NADH, NADPH, and quinol, respectively, and phosphorylates one molecule of GDP to GTP [65]. DNA topoisomerase (EC 5.99.1.2) relaxes supercoiled DNA without a divalent cation or ATP and might represent a potential mechanism for the action of the antibiotics [66].
The 6-phospho-β-glucosidase BglA-2 (EC 3.2.1.86, CAD group biomarker), identified from Streptococcus (CAD group biomarker) pneumoniae TIGR4 and pyogenes [67], is a member of glycoside hydrolase family 1 that catalyzes the hydrolysis of β-1,4-linked cellobiose 6-phosphate (cellobiose-6′P) to yield glucose and glucose 6-phosphate. Both reaction products are further metabolized by the energy-generating glycolysis pathway [68]. This taxonomic biomarker participates in the pathway of starch and gluconeogenesis [68,69].
Protein-N(pi)-phosphohistidine-sugar phosphotransferase (EC 2.7.1.69, CAD group biomarker) is an enzyme that catalyzes the chemical reaction where protein histidine and sugar-phosphate are produced from Npi-phospho-L-histidine and sugar. It is produced by various microorganisms [70], and some of them, such as E. coli, from Gammaproteobacteria, were identified in the CAD group. This enzyme participates in metabolic pathways, among which gluconeogenesis, fructose, mannose, and galactose metabolism were found in the control group [71].
Moreover, in our study, the CAD group is connected to many pathways (superpathway of menaquinol-8 biosynthesis I, of menaquinol-7, superpathway of demethylmenaquinol-8 biosynthesis, of demethylmenaquinol-9 biosynthesis, of menaquinol-11 biosynthesis, of menaquinol-12 biosynthesis, of menaquinol-13 biosynthesis, of demethylmenaquinol-6 biosynthesis II) of nitric oxide reduction to nitrous oxide in which menaquinone (vitamin K) and H2O are produced. Interestingly, in the literature, menaquinone was suggested to reduce the incidence of coronary heart disease [72,73].
Microorganisms from the CAD group also take part in the superpathway of geranylgeranyl diphosphate biosynthesis I (via mevalonate) and mevalonate pathway I. Mevalonate acid plays a role in the biosynthesis of sterols and isoprenoids. The mevalonate pathway produces isopentenyl diphosphate, a building block for polyisoprenoid synthesis, and is a crucial pathway for the growth of the human bacterial pathogen Enterococcus faecalis [74].

5. Limitation of the Study

The study’s main limitation was the limited number of patients and stool samples that were of sufficient quality for further microbiome analysis. The most common reason for the inadequate DNA quality that leads to an insufficient number of high-quality nucleotide sequences was the patient’s incorrect collection of a stool sample. Furthermore, some samples had to be resequenced due to technical problems during sequencing.
Another limitation is gut microbiome susceptibility to many environmental factors, such as diet and medication. On the other hand, this is also the reason for performing replication studies such as ours in different populations and environments. To our knowledge, this is one of the largest studies on the CAD gut microbiome concerning a population exceeding 330 patients (169 CAD patients and 166 controls). Our study confirmed previously reported gut microbiome changes in a pattern of environmental and genetic factors of Eastern and Central Europe. Other studies concerning similar topics were based on 152 CAD patients and 105 healthy controls [28] and on 161 CAD patients and 40 healthy controls [21]. Moreover, the latter study revealed that the gut microbiota composition changed significantly with CAD severity [21].
In this study, we were able to provide sex- and age-matched controls. Unfortunately, we were not able to select similar groups in terms of all clinical data, such as metabolic syndrome, diabetes, etc., that might influence the gut microbiome. Nevertheless, we excluded other diseases that might affect the microbiome, such as active cancer or history of intestinal acute or chronic disease. Furthermore, we want to underline that a lack of symptoms does not exclude the presence of atherosclerotic plaques. Hence, in such a control group (matched to the CAD group in terms of many cardiovascular risk factors), there could be a high proportion of silent CAD patients. This issue could be addressed only in a large, prospective study.
Furthermore, in this study, we performed hypothetical predicted functional analyses based on the gut microbiota’s potential to produce metabolites.
We were able to perform targeted metabolome experiments using Biocrates, not untargeted metabolomics fingerprinting. We did not perform Principal Coordinates Analysis and did not test described pathways in experimental mouse models. These might be interesting in further follow-ups to this project studies.

6. Conclusions

There are marked differences in the gut microbiome between the CAD and control groups that may translate into different metabolisms and hence may affect the development of atherosclerosis. Furthermore, the Firmicutes/Bacteroidetes ratio, independent of CAD status and several confounders, is related to altered targeted metabolome profiles. Thus, a gut microbiome composition assessment might become a useful tool in cardiovascular risk stratification in the future due to its relation to biochemical and metabolome parameters. In order to precisely determine gut microbiome impact in CAD pathogenic process, a functional analysis with advanced, novel “omics” methods should be conducted in a large, prospective study.

Supplementary Materials

The following are available online at https://www.mdpi.com/article/10.3390/jcm10215074/s1. Figure S1: Composition of bacteria class in studied populations. CAD—coronary artery disease group. Figure S2: Composition of bacteria order in studied populations. CAD—coronary artery disease group. Figure S3: Composition of bacteria family in studied populations. CAD—coronary artery disease group. Figure S4: Composition of bacteria genus in studied populations. CAD—coronary artery disease group. Figure S5: Potential biomarkers for coronary artery disease and control group at the taxonomic level. LEfSe identified the major bacteria at all taxonomic levels at the threshold of absolute LDA score 2. Figure S6: Potential biomarkers for coronary artery disease and control group at pathways level. LEfSe identified the major bacteria at all taxonomic levels at the threshold of absolute LDA score 2. Figure S7: Potential DNA topoisomerase producers in coronary artery disease patients (a) and control group (b). Figure S8: Potential oxaloacetate decarboxylase producers in coronary artery disease patients (a) and control group (b). Figure S9: Potential beta-glucosidase producers in coronary artery disease patients (a) and control group (b). Figure S10: Potential 6-phospho-beta-glucosidase producers in coronary artery disease patients (a) and control group (b). Figure S11: Potential protein-N(pi)-phosphohistidine-sugar phosphotransferase producers in coronary artery disease patients (a) and control group (b). Table S1: The differences in relative abundance of bacterial phyla, classes, and orders in studied populations. Table S2: Statistically significant differences in the relative abundance of bacterial families and genera in studied populations. Table S3: The influence of Firmicutes/Bacteroidetes ratio on targeted metabolomics (Biocrates) and biochemical test adjusted for age, sex, CAD status, statins treatment (and) LDL cholesterol concentration.

Author Contributions

Conceptualization, E.S.-S. and K.A.K.; data curation, K.B., M.N., A.S., J.R., M.K. (Miroslaw Kwasniewski), E.T., A.R., M.K. (Marcin Kondraciuk), M.G., J.J., M.B., J.M. and A.G. (Attila Gyenesei); formal analysis, E.S.-S., K.B., W.B., M.K. (Miroslaw Kwasniewski), J.J., M.B., J.M. and A.G. (Attila Gyenesei); funding acquisition, E.S.-S. and K.A.K.; investigation, E.S.-S., M.N., A.S., J.R., E.T., M.D., M.L., M.S., Z.S., A.S. (Anna Szpakowicz), P.S., M.K. (Marcin Kondraciuk), M.G., J.M. and M.C. (Malgorzata Chlabicz); methodology, E.S.-S., K.B., W.B., M.N., A.S., J.R., M.K. (Miroslaw Kwasniewski), E.T., A.S. (Anna Szpakowicz), A.R., M.K. (Marcin Kondraciuk), M.G., J.J., J.M., A.G. (Adrian Godlewski), M.C. (Michal Ciborowski), A.G. (Attila Gyenesei) and K.A.K.; project administration, K.A.K.; resources, E.S.-S., A.R., J.B. (Jolanta Bucko), M.K. (Marcin Kozuch), S.D., J.B. (Jerzy Bychowski), W.J.M., A.K. and K.A.K.; software, K.B., W.B., M.N., A.S., J.R., M.K. (Miroslaw Kwasniewski), A.G. (Attila Gyenesei) and A.K.; supervision, K.A.K.; validation, K.A.K.; visualization, E.S.-S., K.B., W.B., M.K. (Miroslaw Kwasniewski), A.G. (Attila Gyenesei) and K.A.K.; writing—original draft, E.S.-S.; writing—review and editing, E.S.-S., K.B., W.B., M.N., M.K. (Miroslaw Kwasniewski), A.S. (Anna Szpakowicz), J.J., M.K. (Marcin Kozuch), S.D., J.B. (Jerzy Bychowski), W.J.M., A.G. (Adrian Godlewski), M.C. (Michal Ciborowski), A.G. (Attila Gyenesei), A.K. and K.A.K. All authors have read and agreed to the published version of the manuscript.

Funding

This research was funded by National Science Centre, Poland project no.: 2017/25/N/NZ5/02765 and Statutory grants of the Medical University of Bialystok.

Institutional Review Board Statement

Ethical approvals for this study were provided by the Ethics Committee of the Medical University of Bialystok (Poland) (approval number: R-I-002/323/2016, R-I-002/324/2016, and R-I-002/108/2016). The study was conducted in accordance with the Declaration of Helsinki.

Informed Consent Statement

Informed consent was obtained from all subjects involved in the study.

Data Availability Statement

The data set we generated during and/or analyzed during the current study are not publicly available due to confidentiality issues but are available from the corresponding author on request.

Conflicts of Interest

The authors declare no conflict of interest.

References

  1. Wojtyniak, B.; Zdrojewski, T. Mortality due to cardiovascular diseases in Poland-analysis of changes in 1999–2013. In Epidemiology and Prevention of Cardiovascular Diseases, 1st ed.; Kopec, G., Jankowski, P., Pajak, A., Drygas, W., Eds.; Medycyna Praktyczna: Krakow, Poland, 2015; pp. 29–39. [Google Scholar]
  2. European Health Examination Survey. Available online: http://www.ehes.info/manuals/national_manuals/national_manual_Poland_EN.pdf (accessed on 25 August 2021).
  3. Jozwiak, J.J.; Studzinski, K.; Tomasik, T.; Windak, A.; Banach, M. LIPIDOGRAM 2015 Investigators. The prevalence of cardiovascular risk factors and cardiovascular disease among primary care patients in Poland: Results from the LIPIDOGRAM2015 study. Atheroscler. Suppl. 2020, 42, e15–e24. [Google Scholar] [CrossRef] [PubMed]
  4. Kannel, W.B.; Dawber, T.R.; Kagan, A.; Revotskie, N.; Stokes, J.O.S.E.P.H., III. Factors of risk in the development of coronary heart disease-six year follow-up experience: The Framingham Study. Ann. Intern. Med. 1961, 55, 33–50. [Google Scholar] [CrossRef] [PubMed]
  5. Marcinkiewicz-Siemion, M.; Ciborowski, M.; Kretowski, A.; Musial, W.J.; Kaminski, K.A. Metabolomics-A wide-open door to personalized treatment in chronic heart failure? Int. J. Cardiol. 2016, 219, 156–163. [Google Scholar] [CrossRef]
  6. Emoto, T.; Sasaki, N.; Yamashita, T.; Kasahara, K.; Yodoi, K.; Sasaki, Y.; Matsumoto, T.; Mizoguchi, T.; Hirata, K. Regulatory/effector T-cell ratio is reduced in coronary artery disease. Circ. J. 2014, 78, 2935–2941. [Google Scholar] [CrossRef] [Green Version]
  7. Atarashi, K.; Tanoue, T.; Oshima, K.; Suda, W.; Nagano, Y.; Nishikawa, H.; Fukuda, S.; Saito, T.; Narushima, S.; Hase, K.; et al. Treg induction by a rationally selected mixture of Clostridia strains from the human micro biota. Nature 2013, 500, 232–236. [Google Scholar] [CrossRef] [PubMed]
  8. Yamashita, T.; Emoto, T.; Sasaki, N.; Hirata, K.I. Gut microbiota and coronary artery disease. Int. Heart J. 2016, 57, 663–671. [Google Scholar] [CrossRef] [PubMed] [Green Version]
  9. Salamon, D.; Gosiewski, T.; Krawczyk, A.; Sroka-Oleksiak, A.; Duplaga, M.; Fyderek, K.; Kowalska-Duplaga, K. Quantitative changes in selected bacteria in the stool during the treatment of Crohn’s disease. Adv. Med. Sci. 2020, 65, 348–353. [Google Scholar] [CrossRef]
  10. Fukudo, S. Irritable bowel syndrome, emotion regulation, and gut microbiota. Brain Nerve 2016, 68, 607–615. [Google Scholar]
  11. Wozniak, D.; Cichy, W.; Przyslawski, J.; Drzymała-Czyz, S. The role of microbiota and enteroendocrine cells in maintaining homeostasis in the human digestive tract. Adv. Med. Sci. 2021, 66, 284–292. [Google Scholar] [CrossRef]
  12. Lynch, S.V. Gut microbiota and allergic disease. New Insights. Ann. Am. Thorac. Soc. 2016, 13, 51–54. [Google Scholar]
  13. Gülden, E.; Wong, F.S.; Wen, L. The gut microbiota and type 1 diabetes. Clin. Immunol. 2015, 159, 143–153. [Google Scholar] [CrossRef] [PubMed] [Green Version]
  14. Ussar, S.; Griffin, N.W.; Bezy, O.; Fujisaka, S.; Vienberg, S.; Softic, S.; Deng, L.; Bry, L.; Gordon, J.I.; Kahn, C.R. Interactions between gut microbiota, host genetics and diet modulate the predisposition to obesity and metabolic syndrome. Cell Metab. 2015, 22, 516–530. [Google Scholar] [CrossRef] [Green Version]
  15. Kootte, R.S.; Vrieze, A.; Holleman, F.; Dallinga-Thie, G.M.; Zoetendal, E.G.; de Vos, W.M.; Groen, A.K.; Hoekstra, J.B.; Stroes, E.S.; Nieuwdorp, M. The therapeutic potential of manipulating gut microbiota in obesity and type 2 diabetes mellitus. Diabetes Obes. Metab. 2012, 14, 112–120. [Google Scholar] [CrossRef] [PubMed]
  16. Fu, J.; Bonder, M.J.; Cenit, M.C.; Tigchelaar, E.F.; Maatman, A.; Dekens, J.A.; Brandsma, E.; Marczynska, J.; Imhann, F.; Weersma, R.K.; et al. The gut microbiome contributes to a substantial proportion of the variation in blood lipids. Circ. Res. 2015, 117, 817–824. [Google Scholar] [CrossRef]
  17. Yang, T.; Santisteban, M.M.; Rodriguez, V.; Li, E.; Ahmari, N.; Carvajal, J.M.; Zadeh, M.; Gong, M.; Qi, Y.; Zubcevic, J.; et al. Gut dysbiosis is linked to hypertension. Hypertension 2015, 65, 1331–1340. [Google Scholar] [CrossRef] [Green Version]
  18. Emoto, T.; Yamashita, T.; Sasaki, N.; Hirota, Y.; Hayashi, T.; So, A.; Kasahara, K.; Yodoi, K.; Matsumoto, T.; Mizoguchi, T.; et al. Analysis of gut microbiota in coronary artery disease patients: A possible link between gut microbiota and coronary artery disease. J. Atheroscler. Thromb. 2016, 23, 908–921. [Google Scholar] [CrossRef] [Green Version]
  19. Emoto, T.; Yamashita, T.; Kobayashi, T.; Sasaki, N.; Hirota, Y.; Hayashi, T.; So, A.; Kasahara, K.; Yodoi, K.; Matsumoto, T.; et al. Characterization of gut microbiota profiles in coronary artery disease patients using data mining analysis of terminal restriction fragment length polymorphism: Gut microbiota could be a diagnostic marker of coronary artery disease. Heart Vessel. 2017, 32, 39–46. [Google Scholar] [CrossRef] [PubMed]
  20. Zhu, Q.; Gao, R.; Zhang, Y.; Pan, D.; Zhu, Y.; Zhang, X.; Yang, R.; Jiang, R.; Xu, Y.; Qin, H. Dysbiosis signatures of gut microbiota in coronary artery disease. Physiol. Genom. 2018, 50, 893–903. [Google Scholar] [CrossRef]
  21. Liu, H.; Chen, X.; Hu, X.; Niu, H.; Tian, R.; Wang, H.; Pang, H.; Jiang, L.; Qiu, B.; Chen, X.; et al. Alterations in the gut microbiome and metabolism with coronary artery disease severity. Microbiome 2019, 7, 68. [Google Scholar] [CrossRef] [PubMed]
  22. Tian, R.; Liu, H.; Feng, S.; Wang, H.; Wang, Y.; Wang, Y.; Liang, L.; Xu, H.; Xing, H.; Zhang, S. Gut microbiota dysbiosis in stable coronary artery disease combined with type 2 diabetes mellitus influences cardiovascular prognosis. Nutr. Metab. Cardiovasc. Dis. 2021, 31, 1454–1466. [Google Scholar] [CrossRef]
  23. Cui, L.; Zhao, T.; Hu, H.; Zhang, W.; Hua, X. Association Study of Gut Flora in Coronary Heart Disease through High-Throughput Sequencing. Biomed Res. Int. 2017, 2017, 3796359. [Google Scholar] [CrossRef] [PubMed] [Green Version]
  24. Paniczko, M.; Chlabicz, M.; Jamiolkowski, J.; Sowa, P.; Szpakowicz, M.; Lapinska, M.; Kondraciuk, M.; Ptaszynska-Kopczynska, K.; Raczkowski, A.; Szpakowicz, A.; et al. Impact of Pulse Wave Velocity and Parameters Reflecting Android Type Fat Distribution on Left Ventricular Diastolic Dysfunction in Patients with Chronic Coronary Syndromes. J. Clin. Med. 2020, 9, 3924. [Google Scholar] [CrossRef] [PubMed]
  25. Chlabicz, M.; Jamiolkowski, J.; Paniczko, M.; Sowa, P.; Lapinska, M.; Szpakowicz, M.; Jurczuk, N.; Kondraciuk, M.; Raczkowski, A.; Sawicka, E.; et al. Independent Impact of Gynoid Fat Distribution and Free Testosterone on Circulating Levels of N-Terminal Pro-Brain Natriuretic Peptide (NT-proBNP) in Humans. J. Clin. Med. 2019, 9, 74. [Google Scholar] [CrossRef] [Green Version]
  26. Douglas, G.M.; Maffei, V.J.; Zaneveld, J.R.; Yurgel, S.N.; Brown, J.R.; Taylor, C.M.; Huttenhower, C.; Langille, M.G. PICRUSt2 for prediction of metagenome functions. Nat. Biotechnol. 2020, 38, 685–688. [Google Scholar] [CrossRef] [PubMed]
  27. Segata, N.; Izard, J.; Waldron, L.; Gevers, D.; Miropolsky, L.; Garrett, W.S.; Huttenhower, C. Metagenomic biomarker discovery and explanation. Genome Biol. 2011, 12, R60. [Google Scholar] [CrossRef] [Green Version]
  28. Zheng, Y.Y.; Wu, T.T.; Liu, Z.Q.; Li, A.; Guo, Q.Q.; Ma, Y.Y.; Zhang, Z.L.; Xun, Y.L.; Zhang, J.C.; Wang, W.R.; et al. Gut Microbiome-Based Diagnostic Model to Predict Coronary Artery Disease. J. Agric. Food Chem. 2020, 68, 3548–3557. [Google Scholar] [CrossRef]
  29. Wexler, H.M. Bacteroides: The good, the bad, and the nitty-gritty. Clin. Microbiol. Rev. 2007, 20, 593–621. [Google Scholar] [CrossRef] [PubMed] [Green Version]
  30. Bisanz, J.E.; Upadhyay, V.; Turnbaugh, J.A.; Ly, K.; Turnbaugh, P.J. Meta-Analysis Reveals Reproducible Gut Microbiome Alterations in Response to a High-Fat Diet. Cell Host Microbe 2019, 26, 265–272. [Google Scholar] [CrossRef] [PubMed]
  31. Ley, R.E.; Turnbaugh, P.J.; Klein, S.; Gordon, J.I. Microbial ecology: Human gut microbes associated with obesity. Nature 2006, 444, 1022–1023. [Google Scholar] [CrossRef] [PubMed]
  32. Schwiertz, A.; Taras, D.; Schafer, K.; Beijer, S.; Bos, N.A.; Donus, C.; Hardt, P.D. Microbiota and SCFA in lean and overweight healthy subjects. Obesity 2010, 18, 190–195. [Google Scholar] [CrossRef]
  33. Gomes, A.C.; Hoffmann, C.; Mota, J.F. The human gut microbiota: Metabolism and perspective in obesity. Gut Microbes 2018, 9, 308–325. [Google Scholar] [CrossRef] [Green Version]
  34. Chambers, E.S.; Preston, T.; Frost, G.; Morrison, D.J. Role of Gut Microbiota-Generated Short-Chain Fatty Acids in Metabolic and Cardiovascular Health. Curr. Nutr. Rep. 2018, 7, 198–206. [Google Scholar] [CrossRef] [Green Version]
  35. Miquel, S.; Martin, R.; Rossi, O.; Bermudez-Humaran, L.G.; Chatel, J.M.; Sokol, H.; Thomas, M.; Wells, J.M.; Langella, P. Faecalibacterium prausnitzii and human intestinal health. Curr. Opin. Microbiol. 2013, 16, 255–261. [Google Scholar] [CrossRef]
  36. Harrison, C.A.; Laubitz, D.; Ohland, C.L.; Midura-Kiela, M.T.; Patil, K.; Besselsen, D.G.; Jamwal, D.R.; Jobin, C.; Ghishan, F.K.; Kiela, P.R. Microbial Dysbiosis Associated with Impaired Intestinal Na+/H+ Exchange Accelerates and Exacerbates Colitis in Ex-germ Free Mice. Mucosal Immunol. 2018, 11, 1329–1341. [Google Scholar] [CrossRef] [PubMed] [Green Version]
  37. Hao, W.; Zhu, H.; Chen, J.; Kwek, E.; He, Z.; Liu, J.; Ma, N.; Ma, K.Y.; Chen, Z.Y. Wild Melon Seed Oil Reduces Plasma Cholesterol and Modulates Gut Microbiota in Hypercholesterolemic Hamsters. J. Agric. Food Chem. 2020, 68, 2071–2081. [Google Scholar] [CrossRef] [PubMed]
  38. Shang, Q.; Song, G.; Zhang, M.; Shi, J.; Xu, C.; Hao, J.; Li, G.; Yu, G. Dietary Fucoidan Improves Metabolic Syndrome in Association with Increased Akkermansia Population in the Gut Microbiota of High-fat Diet-fed Mice. J. Funct. Foods 2017, 28, 138–146. [Google Scholar] [CrossRef]
  39. Gao, Z.; Yin, J.; Zhang, J.; Ward, R.E.; Martin, R.J.; Lefevre, M.; Cefalu, W.T.; Ye, J. Butyrate improves insulin sensitivity and increases energy expenditure in mice. Diabetes 2009, 58, 1509–1517. [Google Scholar] [CrossRef] [Green Version]
  40. Gao, B.; Zhong, M.; Shen, Q.; Wu, Y.; Cao, M.; Ju, S.; Chen, L. Gut microbiota in early pregnancy among women with Hyperglycaemia vs. Normal blood glucose. BMC Pregnancy Childbirth 2020, 20, 284. [Google Scholar]
  41. Tang, W.H.; Wang, Z.; Levison, B.S.; Koeth, R.A.; Britt, E.B.; Fu, X.; Wu, Y.; Hazen, S.L. Intestinal microbial metabolism of phosphatidylcholine and cardiovascular risk. N. Engl. J. Med. 2013, 368, 1575–1584. [Google Scholar] [CrossRef] [Green Version]
  42. Zhu, W.; Gregory, J.C.; Org, E.; Buffa, J.A.; Gupta, N.; Wang, Z.; Li, L.; Fu, X.; Wu, Y.; Mehrabian, M.; et al. Gut Microbial Metabolite TMAO Enhances Platelet Hyperreactivity and Thrombosis Risk. Cell 2016, 165, 111–124. [Google Scholar] [CrossRef] [Green Version]
  43. Roberts, A.B.; Gu, X.; Buffa, J.A.; Hurd, A.G.; Wang, Z.; Zhu, W.; Gupta, N.; Skye, S.M.; Cody, D.B.; Levison, B.S.; et al. Development of a gut microbe-targeted nonlethal therapeutic to inhibit thrombosis potential. Nat. Med. 2018, 24, 1407–1417. [Google Scholar] [CrossRef]
  44. Alakomi, H.L.; Skytta, E.; Saarela, M.; Mattila-Sandholm, T.; Latva-Kala, K.; Helander, I.M. Lactic acid permeabilizes Gram-negative bacteria by disrupting the outer membrane. Appl. Environ. Microbiol. 2000, 66, 2001–2005. [Google Scholar] [CrossRef] [Green Version]
  45. Faith, J.J.; McNulty, N.P.; Rey, F.E.; Gordon, J.I. Predicting a human gut microbiota’s response to diet in gnotobiotic mice. Science 2011, 333, 101–104. [Google Scholar] [CrossRef] [PubMed] [Green Version]
  46. Lozupone, C.A.; Stombaugh, J.I.; Gordon, J.I.; Jansson, J.K.; Knight, R. Diversity, stability and resilience of the human gut microbiota. Nature 2012, 489, 220–230. [Google Scholar] [CrossRef] [Green Version]
  47. Jie, Z.; Xia, H.; Zhong, S.L.; Feng, Q.; Li, S.; Liang, S.; Zhong, H.; Liu, Z.; Gao, Y.; Zhao, H.; et al. The gut microbiome in atherosclerotic cardiovascular disease. Nat. Commun. 2017, 8, 845. [Google Scholar] [CrossRef] [PubMed] [Green Version]
  48. Yoshida, N.; Emoto, T.; Yamashita, T.; Watanabe, H.; Hayashi, T.; Tabata, T.; Hoshi, N.; Hatano, N.; Ozawa, G.; Sasaki, N.; et al. Bacteroides vulgatus and Bacteroides dorei Reduce Gut Microbial Lipopolysaccharide Production and Inhibit Atherosclerosis. Circulation 2018, 138, 2486–2498. [Google Scholar] [CrossRef]
  49. Wu, G.D.; Chen, J.; Hoffmann, C.; Bittinger, K.; Chen, Y.Y.; Keilbaugh, S.A.; Bewtra, M.; Knights, D.; Walters, W.A.; Knight, R.; et al. Linking long-term dietary patterns with gut microbial enterotypes. Science 2011, 334, 105–108. [Google Scholar] [CrossRef] [Green Version]
  50. Li, J.; Zhao, F.; Wang, Y.; Chen, J.; Tao, J.; Tian, G.; Wu, S.; Liu, W.; Cui, Q.; Geng, B.; et al. Gut microbiota dysbiosis contributes to the development of hypertension. Microbiome 2017, 5, 14. [Google Scholar] [CrossRef] [Green Version]
  51. Kelly, T.N.; Bazzano, L.A.; Ajami, N.J.; He, H.; Zhao, J.; Petrosino, J.F.; Correa, A.; He, J. Gut Microbiome Associates With Lifetime Cardiovascular Disease Risk Profile Among Bogalusa Heart Study Participants. Circ. Res. 2016, 119, 956–964. [Google Scholar] [CrossRef] [Green Version]
  52. Liu, Z.; Li, J.; Liu, H.; Tang, Y.; Zhan, Q.; Lai, W.; Ao, L.; Meng, X.; Ren, H.; Xu, D.; et al. The intestinal microbiota associated with cardiac valve calcification differs from that of coronary artery disease. Atherosclerosis 2019, 284, 121–128. [Google Scholar] [CrossRef] [PubMed] [Green Version]
  53. Hu, X.F.; Zhang, W.Y.; Wen, Q.; Chen, W.J.; Wang, Z.M.; Chen, J.; Zhu, F.; Liu, K.; Cheng, L.X.; Yang, J.; et al. Fecal microbiota transplantation alleviates myocardial damage in myocarditis by restoring the microbiota composition. Pharmacol. Res. 2019, 139, 412–421. [Google Scholar] [CrossRef] [PubMed]
  54. Toya, T.; Corban, M.T.; Marrietta, E.; Horwath, I.E.; Lerman, L.O.; Murray, J.A.; Lerman, A. Coronary artery disease is associated with an altered gut microbiome composition. PLoS ONE 2020, 15, e0227147. [Google Scholar]
  55. Holscher, H.D.; Caporaso, J.G.; Hooda, S.; Brulc, J.M.; Fahey, G.C.; Swanson, K.S. Fiber supplementation influences phylogenetic structure and functional capacity of the human intestinal microbiome: Follow-up of a randomized controlled trial. Am. J. Clin. Nutr. 2015, 101, 55–64. [Google Scholar] [CrossRef] [PubMed]
  56. Dominianni, C.; Sinha, R.; Goedert, J.J.; Pei, Z.; Yang, L.; Hayes, R.B.; Ahn, J. Sex, body mass index, and dietary fiber intake influence the human gut microbiome. PLoS ONE 2015, 10, e0124599. [Google Scholar] [CrossRef] [PubMed] [Green Version]
  57. Li, M.; Wang, B.; Zhang, M.; Rantalainen, M.; Wang, S.; Zhou, H.; Zhang, Y.; Shen, J.; Pang, X.; Zhang, M.; et al. Symbiotic gut microbes modulate human metabolic phenotypes. Proc. Natl. Acad. Sci. USA 2008, 105, 2117–2122. [Google Scholar] [CrossRef] [PubMed] [Green Version]
  58. Mueller, S.; Saunier, K.; Hanisch, C.; Norin, E.; Alm, L.; Midtvedt, T.; Cresci, A.; Silvi, S.; Orpianesi, C.; Verdenelli, M.C.; et al. Differences in fecal microbiota in different European study populations in relation to age, gender, and country: A cross-sectional study. Appl. Environ. Microbiol. 2006, 72, 1027–1033. [Google Scholar] [CrossRef] [Green Version]
  59. Mariat, D.; Firmesse, O.; Levenez, F.; Guimarăes, V.; Sokol, H.; Dore, J.; Corthier, G.; Furet, J.P. The Firmicutes/Bacteroidetes ratio of the human microbota changes with age. BMC Microbiol. 2009, 9, 123. [Google Scholar] [CrossRef]
  60. Canfora, E.E.; van der Beek, C.M.; Hermes, G.D.A.; Goossens, G.H.; Jocken, J.W.E.; Holst, J.J.; van Eijk, H.M.; Venema, K.; Smidt, H.; Zoetendal, E.G.; et al. Supplementation of Diet With Galacto-oligosaccharides Increases Bifidobacteria, but Not Insulin Sensitivity, in Obese Prediabetic Individuals. Gastroenterology 2017, 153, 87–97. [Google Scholar] [CrossRef] [PubMed]
  61. Stratmann, B.; Richter, K.; Wang, R.; Yu, Z.; Xu, T.; Prehn, C.; Adamski, J.; Illig, T.; Tschoepe, D.; Wang-Sattler, R. Metabolomic Signature of Coronary Artery Disease in Type 2 Diabetes Mellitus. Int. J. Endocrinol. 2017, 2017, 7938216. [Google Scholar] [CrossRef]
  62. Lin, H.; Zhang, J.; Gao, P. Silent myocardial ischemia is associated with altered plasma phospholipids. J. Clin. Lab. Anal. 2009, 23, 45–50. [Google Scholar] [CrossRef]
  63. Poszytek, K. Mikrobiologiczna utylizacja celulozy. Post. Mikrobiol. 2016, 55, 132. [Google Scholar]
  64. Sauer, U.; Eikmanns, B.J. The PEP-pyruvate-oxaloacetate node as the switch point for carbon flux distribution in bacteria. FEMS Microbiol. Rev. 2005, 29, 765–794. [Google Scholar] [CrossRef] [Green Version]
  65. Metacyc. Available online: https://biocyc.org/META/NEW-IMAGE?type=PATHWAY&object=GLYCOLYSIS-TCA-GLYOX-BYPASS (accessed on 28 August 2021).
  66. Szafran, M.; Zakrzewska-Czerwinska, J.; Jakimowicz, D. Bacterial type I topoisomerases-biological function and potential use as targets for antibiotic treatments. Postepy Hig. Med. Dosw. 2013, 67, 130–142. [Google Scholar] [CrossRef]
  67. Stepper, J.; Dabin, J.; Eklof, J.M.; Thongpoo, P.; Kongsaeree, P.; Taylor, E.J.; Turkenburg, J.P.; Brumer, H.; Davies, G.J. Structure and activity of the Streptococcus pyogenes family GH1 6-phospho-beta-glucosidase SPy1599. Acta Crystallogr. D Biol. Crystallogr. 2013, 69, 16–23. [Google Scholar] [CrossRef] [PubMed] [Green Version]
  68. Yu, W.L.; Jiang, Y.L.; Pikis, A.; Cheng, W.; Bai, X.H.; Ren, Y.M.; Thompson, J.; Zhou, C.Z.; Chen, Y. Structural insights into the substrate specificity of a 6-phospho-β-glucosidase BglA-2 from Streptococcus pneumoniae TIGR4. J. Biol. Chem. 2013, 288, 14949–14958. [Google Scholar] [CrossRef] [Green Version]
  69. Metacyc. Available online: https://www.genome.jp/dbget-bin/www_bget?ec:3.2.1.86 (accessed on 25 August 2021).
  70. Saier, M.H., Jr. The Bacterial Phosphotransferase System: New Frontiers 50 Years after Its Discovery. J. Mol. Microbiol. Biotechnol. 2015, 25, 73–78. [Google Scholar] [CrossRef] [PubMed] [Green Version]
  71. Metacyc. Available online: https://www.genome.jp/dbget-bin/www_bget?enzyme+2.7.1.69 (accessed on 25 August 2021).
  72. Gast, G.C.; de Roos, N.M.; Sluijs, I.; Bots, M.L.; Beulens, J.W.; Geleijnse, J.M.; Witteman, J.C.; Grobbee, D.E.; Peeters, P.H.; van der Schouw, Y.T. A high menaquinone intake reduces the incidence of coronary heart disease. Nutr. Metab. Cardiovasc. Dis. 2009, 19, 504–510. [Google Scholar] [CrossRef] [PubMed]
  73. Geleijnse, J.M.; Vermeer, C.; Grobbee, D.E.; Schurgers, L.J.; Knapen, M.H.; van der Meer, I.M.; Hofman, A.; Witteman, J.C. Dietary intake of menaquinone is associated with a reduced risk of coronary heart disease: The Rotterdam study. J. Nutr. 2004, 134, 3100–3105. [Google Scholar] [CrossRef]
  74. Chen, C.L.; Mermoud, J.C.; Paul, L.N.; Steussy, C.N.; Stauffacher, C.V. Mevalonate 5-diphosphate mediates ATP binding to the mevalonate diphosphate decarboxylase from the bacterial pathogen Enterococcus faecalis. J. Biol. Chem. 2017, 29, 21340–21351. [Google Scholar] [CrossRef] [Green Version]
Figure 1. Alpha-biodiversity in coronary artery and control groups. CAD—coronary artery disease group. (a) The total amount of OTUs; OTUs—operational taxonomy units, (b) Shannon entropy, (c) Simpson Index, (d) Chao1bias-corrected estimator.
Jcm 10 05074 g001
Figure 2. Composition of bacteria phyla in studied populations. CAD—coronary artery disease group.
Jcm 10 05074 g002
Figure 3. Firmicutes/Bacteroidetes ratio in CAD and control population. CAD—coronary artery disease.
Jcm 10 05074 g003
Figure 4. Cladogram showing various taxonomic changes in gut microbiota between the CAD and control groups: (a) general analysis; (b) in order level; (c) in order and class level.
Jcm 10 05074 g004
Figure 5. Potential changes in microbiome products in coronary artery disease and control groups at the protein level.
Jcm 10 05074 g005
Table 1. The inclusion and exclusion criteria.
CAD Group Control Group
Inclusion criteria
-
Signed informed consent
-
Aged 30–79 years
-
Hospitalization 12–18 months prior to the evaluation for:
-
Elective percutaneous coronary intervention
-
Acute coronary syndromes
-
ST-elevation myocardial infarction (STEMI)
-
Non-ST elevation myocardial infarction ST (NSTEMI)
-
Unstable angina (UA)/acute myocardial ischemia
-
Randomly selected from the Bialystok population
-
SEX and age matched to CAD group
-
Without CAD
-
Asymptomatic patients in terms of angina
-
Without history of coronary angiography, that revealed atherosclerotic plaques
Exclusion criteria
-
History of intestinal acute or chronic disease
-
Active cancer
-
Aged below 30 and over 80
-
Lack of informed consent
-
Angiographic confirmation of CAD
-
History of acute coronary syndrome
-
Typical angina
CAD—coronary artery disease.
Table 2. Characteristics of study groups.
CAD
Group (n = 169)
Control
Group (n = 166)
p Value
Age, years64.1 ± 7.762.4 ± 10.50.08
Sex, male, n (%)124 (73%)108 (65%)0.1
BMI, kg/m230.52 ± 5.328.46 ± 4.730.001
WHR0.96 ± 0.080.92 ± 0.090.001
Arterial hypertension, n (%)138 (83%)82 (56%)0.001
Diabetes, n (%)50 (30%)16 (15%)0.003
Current tobacco smoker, n (%)28 (22%)26 (27%)0.435
History of tobacco smoking, n (%)125 (74%)98 (60%)0.005
Lower limb atherosclerosis or intermittent claudication, n (%)12 (80%)3 (3%)0.001
Hypercholesterolemia, n (%)137 (82%)69 (50%)0.001
History of kidney disease, n (%)14 (9%)14 (11%)0.435
Family history of the acute coronary syndrome, n (%)44 (30%)10 (7%)0.001
Family history of stroke, n (%)33 (22%)17 (13%)0.037
Pharmacotherapy
Use of ACE-I/ARB, n (%)147 (88%)56 (44%)<0.001
Use of beta-blockers, n (%)53 (31%)23 (18%)0.012
Use of statins, n (%)150 (90%)38 (30%)<0.001
Use of diuretics, n (%)84 (50%)18 (14%)<0.001
Use of antiplatelet and anticoagulant treatment, n (%)164 (98%)30 (24%)<0.001
Assessments
Atherosclerotic plaques in the carotid arteries, n (%)163 (96%)123 (74%)0.001
Heart rate in electrocardiogram, beats/minute 62
IQR: 58–68.5
64.5
IQR: 58–72
0.044
Bone Densitometry
Total fat mass, g29667.93
IQR: 23652.98–35995.84
28604.12
IQR: 20777.52–33493.96
0.047
Android fat mass, g3220.41
IQR: 2510.92–4005.02
2849.09
IQR: 1991.26–3752.75
0.002
Echocardiography
Left ventricle ejection fraction, %52.3
IQR: 47.6–57.9
57
IQR: 53.8–60.4
<0.001
Left atrium diameter, mm39.8
IQR: 36–43.9
37.3
IQR: 33.2–39.7
<0.001
Mean ± standard deviation, median IQR—interquartile range, BMI—body mass index, and WHR—waist–hip ratio.
Table 3. Biochemical tests.
Biochemical Test
NTproBNP, pg/mL154.5
IQR: 78.1–329
65.2
IQR: 32.6–110.1
0.001
WBC, tys/μL6.4
IQR: 5.2–7.5
5.9
IQR: 5.1–6.9
0.119
RBC, mln/mm34.7
IQR: 4.4–5
4.9
IQR: 4.5–5.08
0.012
Hb, g/dL14.1
IQR: 13.1–14.6
14.7
IQR: 13.7–15.4
<0.001
PLT, tys/μL217
IQR: 185–256.5
214
IQR: 185–249
0.985
Creatinine, μmol/L85.4
IQR: 74.4–97.2
75.8
IQR: 64.9–83.7
<0.001
Urea, mg/dL34.4
IQR: 30–41
32.6
IQR: 28.4–38.7
0.011
Fasting glucose, mg/dL105
IQR: 97–119.5
102
IQR: 96–109
0.027
120 min glucose, mg/dL130.5
IQR: 102–161
134
IQR: 106–174
0.398
HbA1c, %5.9
IQR: 5.6–6.2
5.7
IQR: 5.3–5.9
<0.001
Total cholesterol, mg/dL 154
IQR: 129.5–179
195
IQR: 166–227
<0.001
Triglycerides, mg/dL 103
IQR: 73–157
113
IQR: 82–149
0.394
Low-density lipoprotein cholesterol, mg/dL85.8
IQR: 69.4–108.8
132.6
IQR: 99.9–160.8
<0.001
High-density lipoprotein cholesterol, mg/dL48
IQR: 41.5–61.5
58
IQR: 47.4–68.3
<0.001
hs-CRP, mg/L1.1
IQR: 0.5–2.1
0.9
IQR: 0.5–1.7
0.138
ALT, IU/L23
IQR: 18.3–32.3
21.1
IQR: 16.9–29.6
0.05
AST, IU/L23
IQR: 18.8–27.9
22.3
IQR: 19.4–26.9
0.167
GGT, IU/L23.9
IQR: 16.3–39.1
20.2
IQR: 13.6–34.7
0.033
Iron, μg/mL99.7
IQR: 82–119.7
113.8
IQR: 88.7–133.8
0.006
Mean ± standard deviation, median IQR—interquartile range. WBC—white blood cell, RBC—red blood cell, Hb—hemoglobin, PLT—platelets, CRP—C-reactive protein, ALT—alanine aminotransferase, AST—aspartate aminotransferase, and GGT—gamma-glutamyltranspeptidase.
Table 4. Statistically significant differences in relative abundance of bacterial phyla, classes, and orders in studied populations.
Taxonomic UnitRelative Abundance in CAD GroupRelative Abundance
in Control Group
p-Value
(Adjusted for Sex and Age)
Phyla
Proteobacteria7.4695 (5.1935–9.7455)4.6714 (3.4979–5.8449)0.032
Bacteroidetes33.5334 (30.8517–36.2151)37.1957 (35.1636–39.2278)0.032
Classes
Bacteroidetes, Bacteroidia33.5334 (30.8517–36.2151)37.1957 (35.1636–39.2278)0.032
Firmicutes, Bacilli4.1117 (2.9382–5.2852)1.2206 (0.7898–1.6514)<0.001
Proteobacteria, Gammaproteobacteria6.0816 (3.8101–8.3531)3.4073 (2.2397–4.5749)0.04
Order
Actinobacteria, Actinobacteria, Actinomycetales0.0281 (0.0164–0.0398)0.0135 (0.0095–0.0175)0.021
Actinobacteria, Actinobacteria, Micrococcales0.0152 (0.0108–0.0196)0.0083 (0.0043–0.0123)0.021
Bacteroidetes, Bacteroidia, Bacteroidales33.4714 (30.7887–36.1541)37.1229 (35.0883–39.1575)0.033
Firmicutes, Bacilli, Lactobacillales3.891 (2.7367–5.0453)1.1638 (0.745–1.5826)<0.001
Proteobacteria, Gammaproteobacteria, Enterobacteriales5.4589 (3.1754–7.7424)2.5555 (1.4063–3.7047)0.026
CAD—coronary artery disease group, CI—confidence interval. Mean values together with the 95% confidence intervals of the means are presented.
Table 5. OTUs with the highest statistical significance that differ between study groups.
PhylumOrderFamilyGenusCAD
Group (n = 169)
Control
Group (n = 166)
Adjusted p-Value (FDR) CAD
vs. Control
FirmicutesClostridialesClostridiales
vadinBB60 group
Uncultured organism0.3797
(0.1217–0.6377)
0.4296
(0.2595–0.5997)
<0.001
FusobacteriaFusobacterialesFusobacteriaceaeFusobacterium0.159
(0.0099–0.3081)
0.2248
(−0.0595–0.5091)
<0.001
FirmicutesLactobacillalesLactobacillaceaeLactobacillus sp., Gut metagenome0.1493
(−0.1451–0.4437)
0.0002
(0–0.0004)
<0.001
FirmicutesClostridialesChristensenellaceaeChristensenellaceae
R-7 group
1.3802
(1.0337–1.7267)
1.1589
(0.8781–1.4397)
<0.001
FirmicutesLactobacillalesLactobacillaceaeLactobacillus sp, Ambiguous taxa0.7075
(0.2925–1.1225)
0.0626
(0.0121–0.1131)
<0.001
SpirochaetesSpirochaetalesSpirochaetaceaeTreponema 20.0699
(−0.0293–0.1691)
0
(0–0)
<0.001
BacteroidetesBacteroidalesPrevotellaceaePrevotellaceae UCG-0030.0434
(−0.0297–0.1165)
0.0002
(−0.0002–0.0006)
<0.001
FirmicutesClostridialesRuminococcaceaeRuminococcaceae UCG-0144.6675
(3.6518–5.6832)
3.5864
(2.8496–4.3232)
<0.001
BacteroidetesBacteroidalesMuribaculaceaeUncultured bacterium0.108
(0.027–0.189)
0.1365
(0.0385–0.2345)
<0.001
ProteobacteriaEnterobacterialesEnterobacteriaceaeEscherichia-Shigella4.5528
(2.398–6.7076)
1.9492
(0.9105–2.9879)
<0.001
CAD—coronary artery disease group, OTUs—operational taxonomic units. Mean values together with the 95% confidence intervals of the means are presented.
Table 6. The influence of Firmicutes/Bacteroidetes ratio on targeted metabolomics (Biocrates) and biochemical test adjusted for age, sex, CAD status, statins treatment (and) LDL cholesterol concentration.
Metabolite or Biochemical TestGroup with F/B Ratio ≤ 1.54
(n = 167)
Group with F/B Ratio > 1.54
(n = 167)
p Value
Phosphatidylcholine with diacyl residue sum C36:4, μmol/L145,308.5375
(95% CI 136,165.244–154,451.831)
131,525.3521
(95% CI 122,485.2512–140,565.4529)
0.037 *
Phosphatidylcholine with diacyl residue sum C38:5, μmol/L46,853.2875
(95% CI 43,791.1361–49,915.4389)
41,838.3521
(95% CI 39,090.319–44,586.3852)
0.019 *
Phosphatidylcholine with diacyl residue sum C38:6, μmol/L68,122.05
(95% CI 62,784.975–73,459.125)
58,899.7887
(95% CI 54,099.1744–63,700.403)
0.013 *
Phosphatidylcholine with diacyl residue sum C40:6, μmol/L26,837.9747
(95% CI 24,778.9683–28,896.9811)
23,893.6056
(95% CI 21,873.7272–25,913.484)
0.047 *
Phosphatidylcholine with acyl-alkyl residue sum C30:0, μmol/L165.6974
(95% CI 153.7441–177.6507)
209.942
(95% CI 178.6529–241.2311)
0.008 *
Phosphatidylcholine with acyl-alkyl residue sum C34:0, μmol/L839.25
(95% CI 782.9649–895.5351)
958.2254
(95% CI 852.6987–1063.7521)
0.045 *
Phosphatidylcholine with acyl-alkyl residue sum C38:0, μmol/L1663.75
(95% CI 1520.5806–1806.9194)
1465.4225
(95% CI 1353.087–1577.758)
0.034 *
Sphingomyelin with acyl residue sum C24:1, μmol/L69,876.9375
(95% CI 65,633.3358–74,120.5392)
63,321.1268
(95% CI 59,226.511–67,415.7426)
0.028 *
Hematocrit, %41.3928
(95% CI 40.8434–41.9422)
41.8814
(95% CI 41.3236–42.4392)
0.047 *
Hemoglobin, g/dL14.1371
(95% CI 13.9429–14.3313)
14.3413
(95% CI 14.1502–14.5324)
0.023 *
Total cholesterol, mg/dL188.9341
(95% CI 181.2163–196.6519)
171.2455
(95% CI 164.3927–178.0983)
0.006 **
LDL cholesterol, mg/dL118.8796
(95% CI 112.3616–125.3976)
104.9257
(95% CI 98.4497–111.4017)
0.026 **
CI—confidence interval. Mean values together with the 95% confidence intervals of the means are presented. (* Adjusted for Age, Sex, CAD Status, LDL Cholesterol Concentration, Statins Treatment; ** Adjusted for Age, Sex, CAD Status, Statins Treatment).
Publisher’s Note: MDPI stays neutral with regard to jurisdictional claims in published maps and institutional affiliations.

