Abstract
Object: Although thrombin burst has attracted attention as a physiological coagulation mechanism, clinical evidence from a routine assay for it is scarce. This mechanism was therefore evaluated by a clot waveform analysis (CWA) to assess the thrombin time (TT). Material and Methods: The TT with a low concentration of thrombin was evaluated using a CWA. We evaluated the CWA-TT of plasma deficient in various clotting factors, calibration plasma, platelet-poor plasma (PPP), and platelet-rich plasma (PRP) obtained from healthy volunteers, patients with thrombocytopenia, and patients with malignant disease. Results: Although the TT-CWA of calibration plasma was able to be evaluated with 0.01 IU/mL of thrombin, that of FVIII-deficient plasma could not be evaluated. The peak time of CWA-TT was significantly longer, and the peak height significantly lower, in various deficient plasma, especially in FVIII-deficient plasma compared to calibration plasma. The second peak of the first derivative (1st DP-2) was detected in PPP from healthy volunteers, and was shorter and higher in PRP than in PPP. The 1st DP-2 was not detected in PPP from patients with thrombocytopenia, and the 1st DP-2 in PRP was significantly lower in patients with thrombocytopenia and significantly higher in patients with malignant disease than in healthy volunteers. Conclusion: The CWA-TT became abnormal in plasma deficient in various clotting factors, and was significantly affected by platelets, suggesting that the CWA-TT may be a useful test for hemostatic abnormalities.
1. Introduction
It is well known that thrombin directly activates fibrinogen to generate fibrin formation [1]. Furthermore, thrombin activates many coagulation factors in the upper stream, such as clotting factor XI (FXI), FVIII, Factor X, and Factor V, resulting in thrombin generation to enhance coagulation reaction, a process known as thrombin burst [2,3]. The thrombin time (TT) is generally used to detect abnormalities of fibrinogen, such as dysfibrinogenemia [4,5], disseminated intravascular coagulation (DIC) [6], and liver dysfunction [7]. Therefore, the TT is used to measure fibrinogen concentrations [8]. In addition, it is also used to monitor anti-thrombin reagents [9]. Thrombin burst has generally been evaluated by thromboelastography (TEG) [10] and the thrombin generation test (TGT) [11,12].
The activated partial thromboplastin time (APTT) and prothrombin time (PT), which are inexpensive to conduct and allow for the easy performance of multiple assays, are established as routine assays for the coagulation system. However, where the APTT and PT reflect only a single dimension, such as the clotting time, the TEG and TGT are able to present results in two dimensions, including the time, width, height, or area. Unfortunately, these tests are expensive and time-consuming to perform compared to routine assays, at present.
A clot waveform analysis (CWA)-APTT [13,14] and small-amount tissue factor (TF)-induced FIX activation (sTF/FIXa) assay [14,15] can show the peak time and peak height, allowing the evaluation of thrombin burst to be performed as easily as a routine assay. The CWA-APTT has been reported to detect very low levels of FVIII activity in patients with hemophilia A [16], and has proven useful for the differential diagnosis of hemophilia, acquired hemophilia A, lupus anticoagulant (LA), and DIC, as well as monitoring the results of anticoagulant therapy or bypass therapy in patients with FVIII inhibitors [17,18,19,20,21].
In the present study, a CWA using TT (CWA-TT) for physiological coagulation was used to investigate the mechanism underlying thrombin burst in calibration plasma and plasma deficient of various clotting factors. We also demonstrate the role of platelets in the coagulation system.
2. Materials and Methods
Platelet-rich plasma (PRP) and platelet-poor plasma (PPP) were collected from 12 patients with thrombocytopenia, 16 patients with malignant diseases, and 18 healthy volunteers (8 males and 12 females; 21 to 56 years old). The TT was measured using 0.5 IU thrombin (Thrombin 500 units, Mochida Pharmaceutical CO., LTD, Tokyo, Japan) with an ACL-TOP® system (Instrumentation Laboratory, Bedford, MA, USA). Three types of curves are shown on this system monitor [19]. One shows the changes in the absorbance observed while measuring the TT, corresponding to the fibrin formation curve (FFC). The second is the first derivative peak of the absorbance (1st DP), corresponding to the coagulation velocity. The third is the second derivative peak of the absorbance (2nd DP), corresponding to the coagulation acceleration. FII-deficient plasma, FV-deficient plasma, FVII-deficient plasma, FVIII-deficient plasma, FIX-deficient plasma, FX-deficient plasma, FXI-deficient plasma, FXII-deficient plasma (Instrumentation Laboratory), and FXIII-deficient plasma (George King Bio-Medical Inc, Overland Park, KS, USA) were used as clotting factor-deficient plasma, and calibration plasma (Instrumentation Laboratory) was used as normal plasma. The fibrinogen concentrations in various deficient and calibration plasma were measured using a Thrombocheck Fib (L) (Sysmex, Kobe, Japan) and CS-5100 (Sysmex).
PRP was prepared by centrifugation at 900 rpm for 15 min (platelet count, 40 × 1010/L in healthy volunteers), and PPP was prepared by centrifugation at 3000 rpm for 15 min (platelet count, <0.5 × 10¹⁰/L in healthy volunteers) [15].
Statistical Analyses
The data are expressed as the median (25th to 75th percentile). Differences between PRP and PPP were examined for significance using Student’s t-test, and differences between independent groups were examined using the Mann–Whitney U-test. p-values of ≤0.05 were considered to indicate statistical significance. All statistical analyses were performed using the Stat flex software program (version 6. Artec Co Ltd., Osaka, Japan).
3. Results
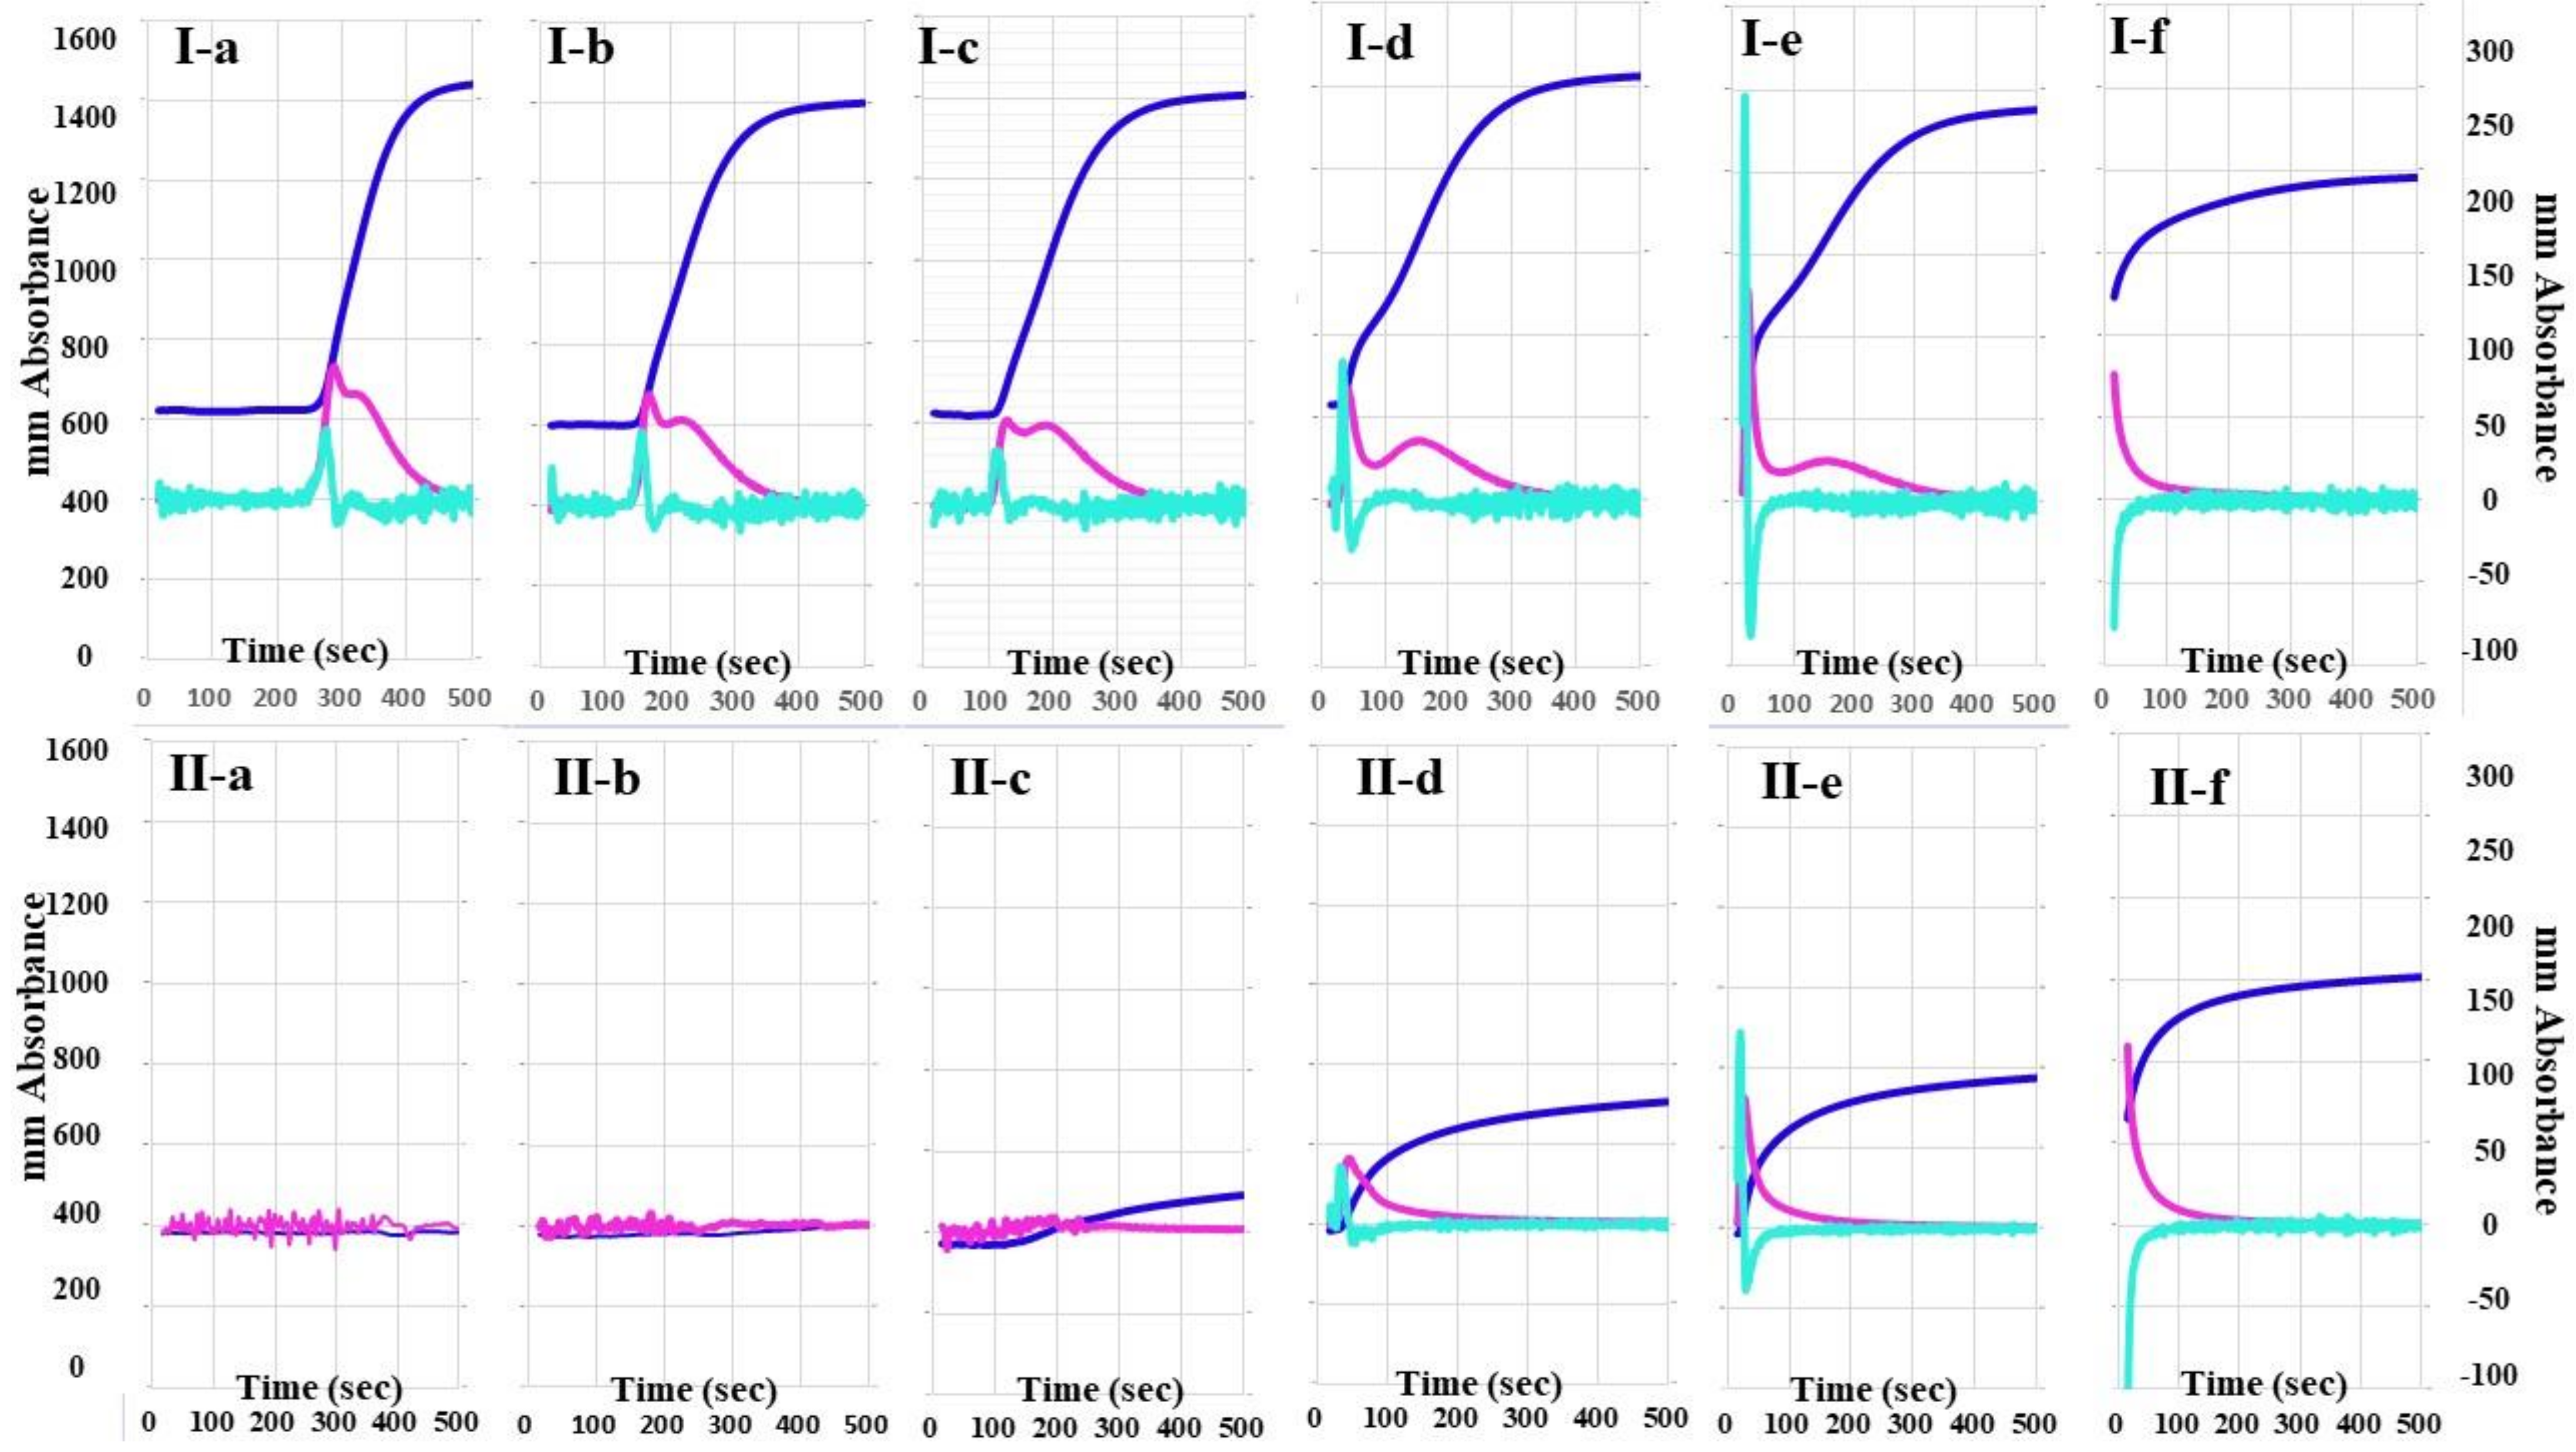
The 2nd DP and 1st DP of calibration plasma using the CWA-TT with 0.01 IU/mL of thrombin were detected at 270 s, and the peak times of CWA-TT gradually shortened, whereas the peak heights of CWA-TT gradually increased, as the concentrations of thrombin increased (Figure 1). The 2nd DP and 1st DP of FVIII-deficient plasma using the CWA-TT with 0.01 to 0.1 IU/m of thrombin were not detected within 500 s, and the heights of the 2nd DP, 1st DP, and FFC of FVIII-deficient plasma using the CWA-TT with 0.5 to 1.0 IU/mL of thrombin were significantly lower than those of calibration plasma using the CWA-TT with the same concentration of thrombin. A total of 5 IU/mL of thrombin showed similar CWA-TT between calibration and FVIII-deficient plasma samples.

Figure 1.
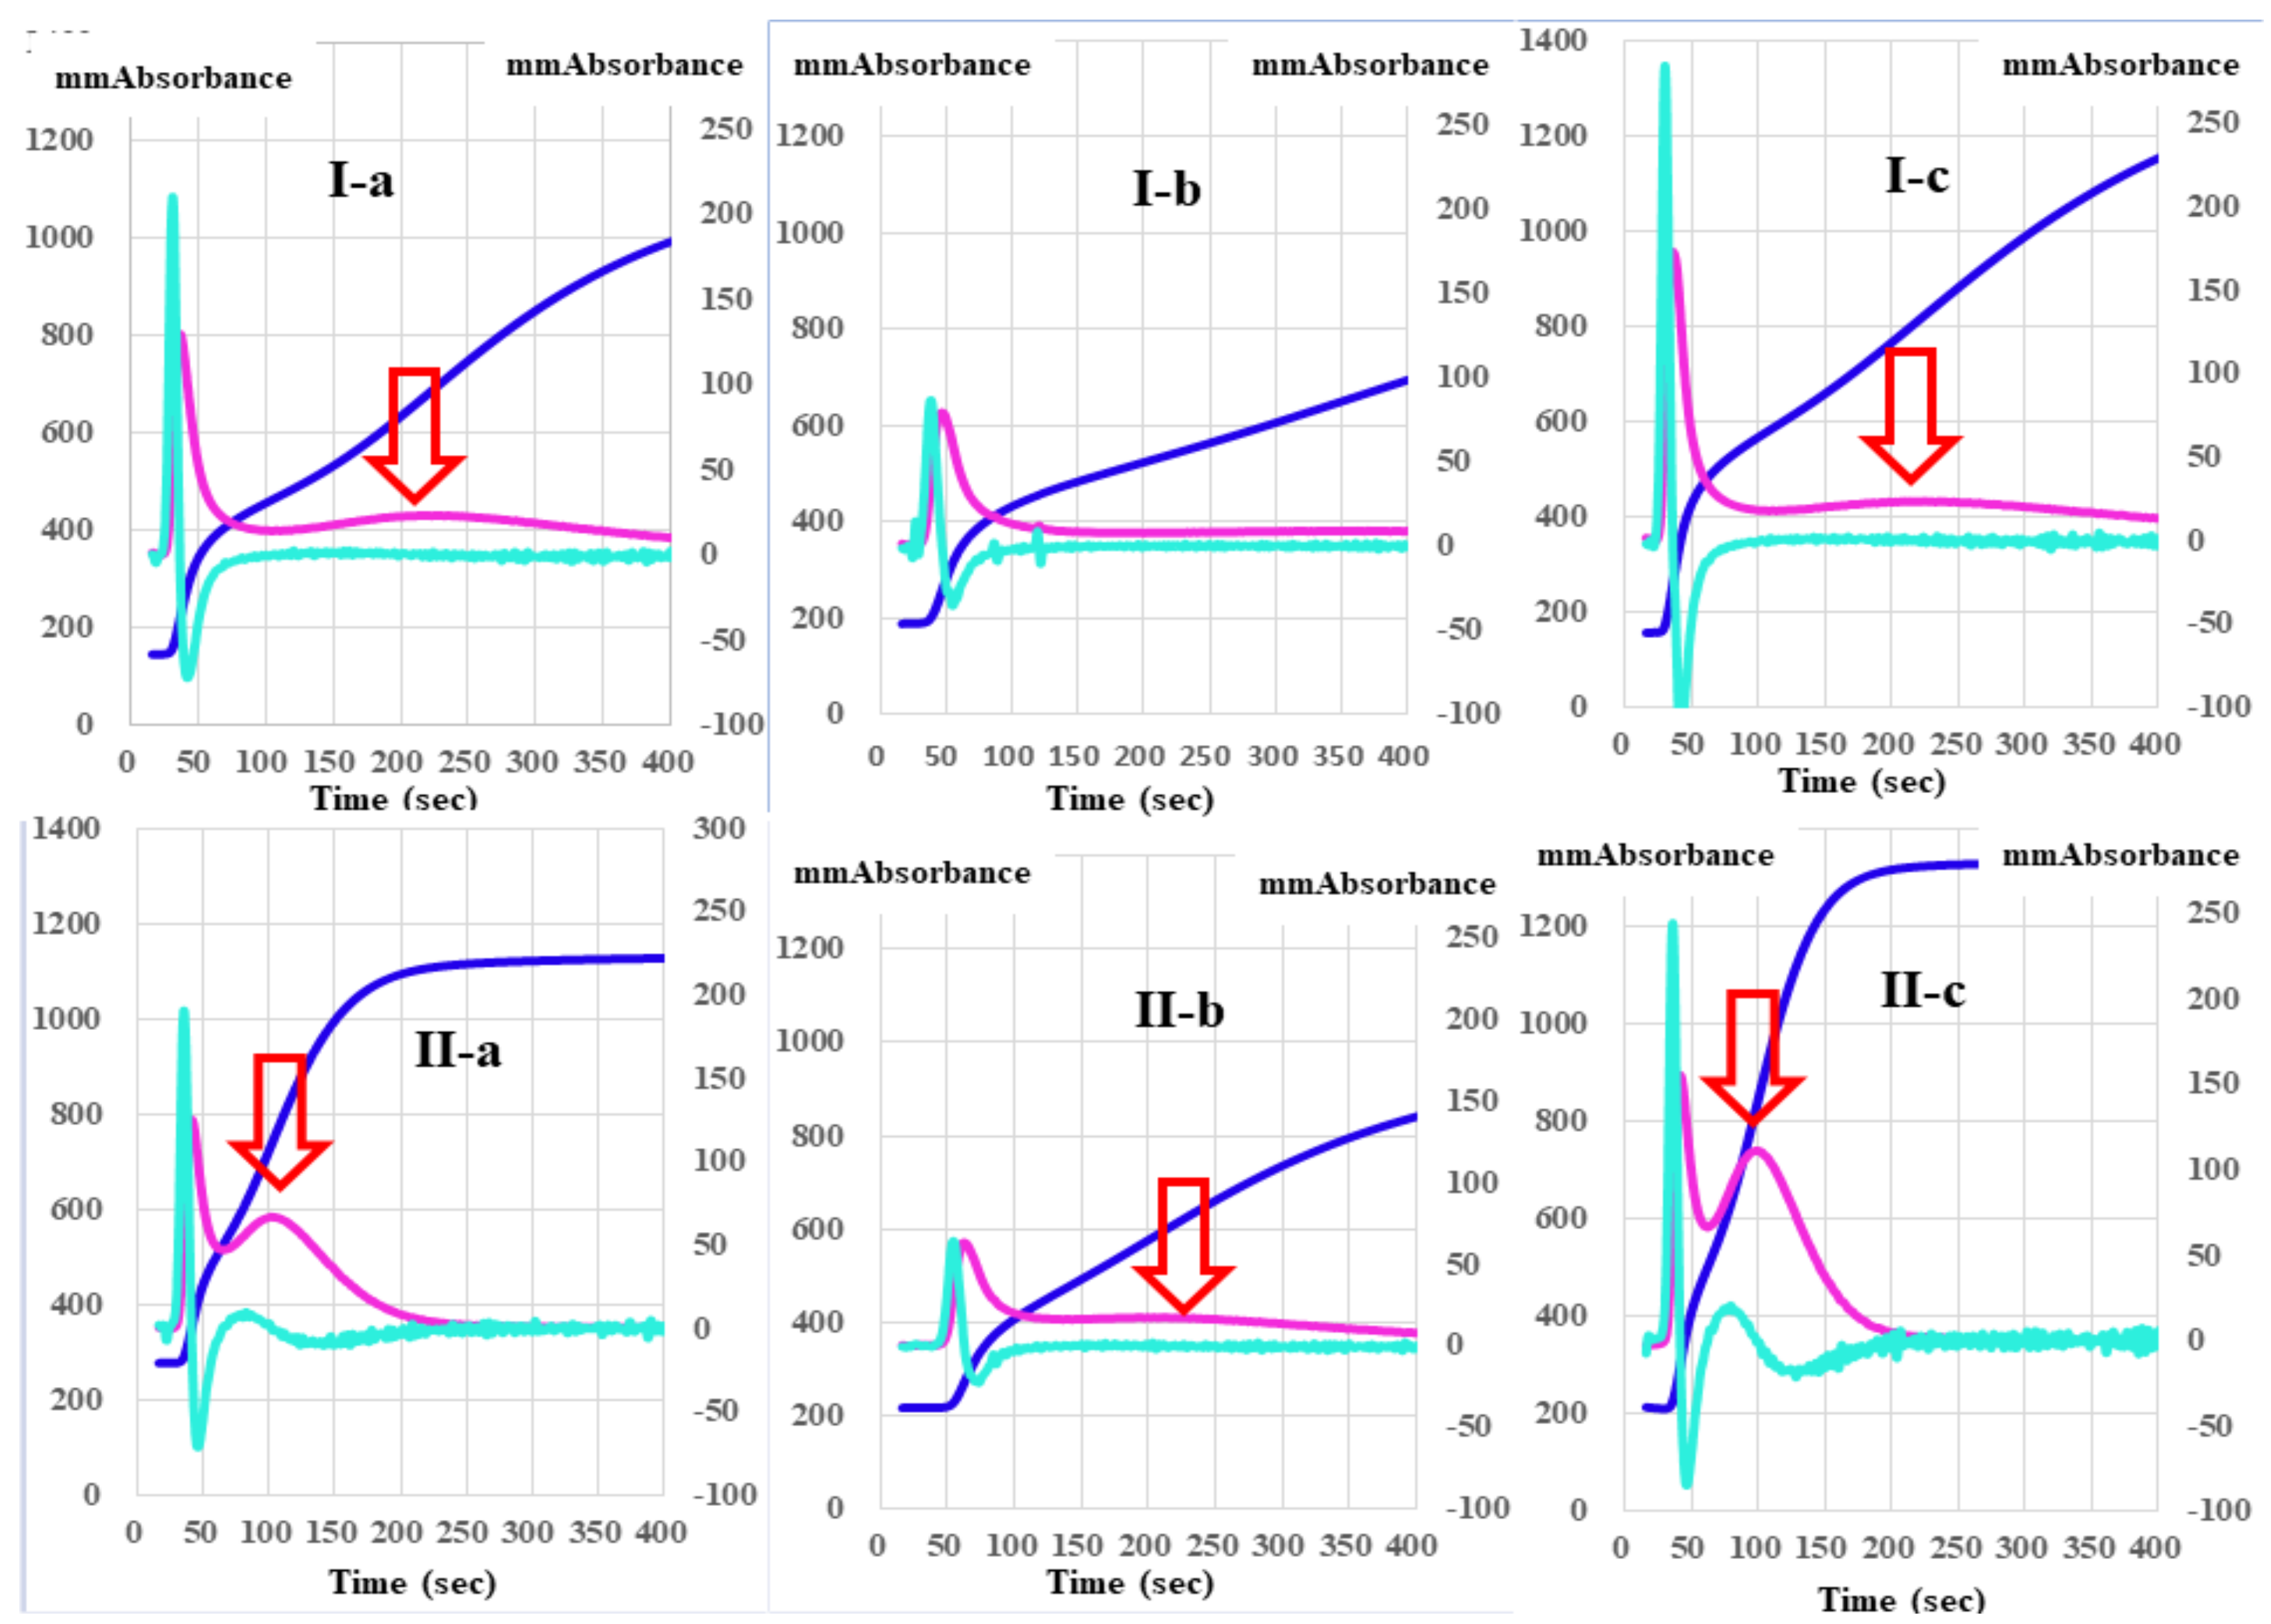
A clot waveform analysis for thrombin time. (I) Calibration plasma; (II) FVIII-deficient plasma; (a) thrombin 0.01 IU/mL; (b) thrombin 0.05 IU/mL; (c) thrombin 0.1 IU/mL; (d) thrombin 0.5 IU/mL; (e) thrombin 1.0 IU/mL; (f) thrombin 5.0 IU/mL. Navy line, fibrin formation curve; red line, 1st derivative curve (velocity); light blue, 2nd derivative curve (acceleration).
The heights of the 2nd DP, 1st DP, and FFC in FII-, FV-, FVII-, FVIII-, FIX-, FX-, FXI-, and FXII-deficient plasma using the CWA-TT with 0.5 IU thrombin were significantly lower than those in calibration plasma and FXIII-deficient plasma using the CWA-TT with 0.5 IU thrombin (Figure 2). In particular, the heights of the 2nd DP, 1st DP, and FFC in FVIII-deficient plasma were extremely low. The second peak of the 1st DP using the CWA-TT was observed only in calibration plasma, and FVII-, FXI-, FXII-, and FXIII-deficient plasma.
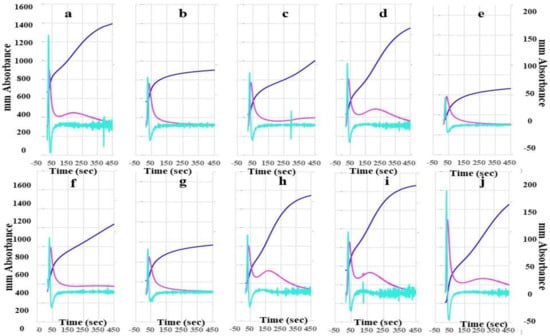
Figure 2.
A clot waveform analysis for thrombin time. (a) Calibration plasma; (b) FII-deficient plasma; (c) FV-deficient plasma; (d) FVII-deficient plasma; (e) FVIII-deficient plasma; (f) FIX-deficient plasma; (g) FX-deficient plasma; (h) FXI-deficient plasma; (i) FXII-deficient plasma; (j) FXIII-deficient plasma; thrombin 0.5 IU/mL. Navy line, fibrin formation curve; red line, 1st derivative curve (velocity); light blue, 2nd derivative curve (acceleration).
The mean concentration of fibrinogen was 280 mg/dL in calibration plasma, 298 mg/dL in FII-, 313 mg/dL in FV-, 311 mg/dL in FVII-, 276 mg/dL in FVIII-, 310 mg/dL in FIX-, 295 mg/dL in FX-, 306 mg/dL in FXI-, and 334 mg/dL in FXII-deficient plasma.
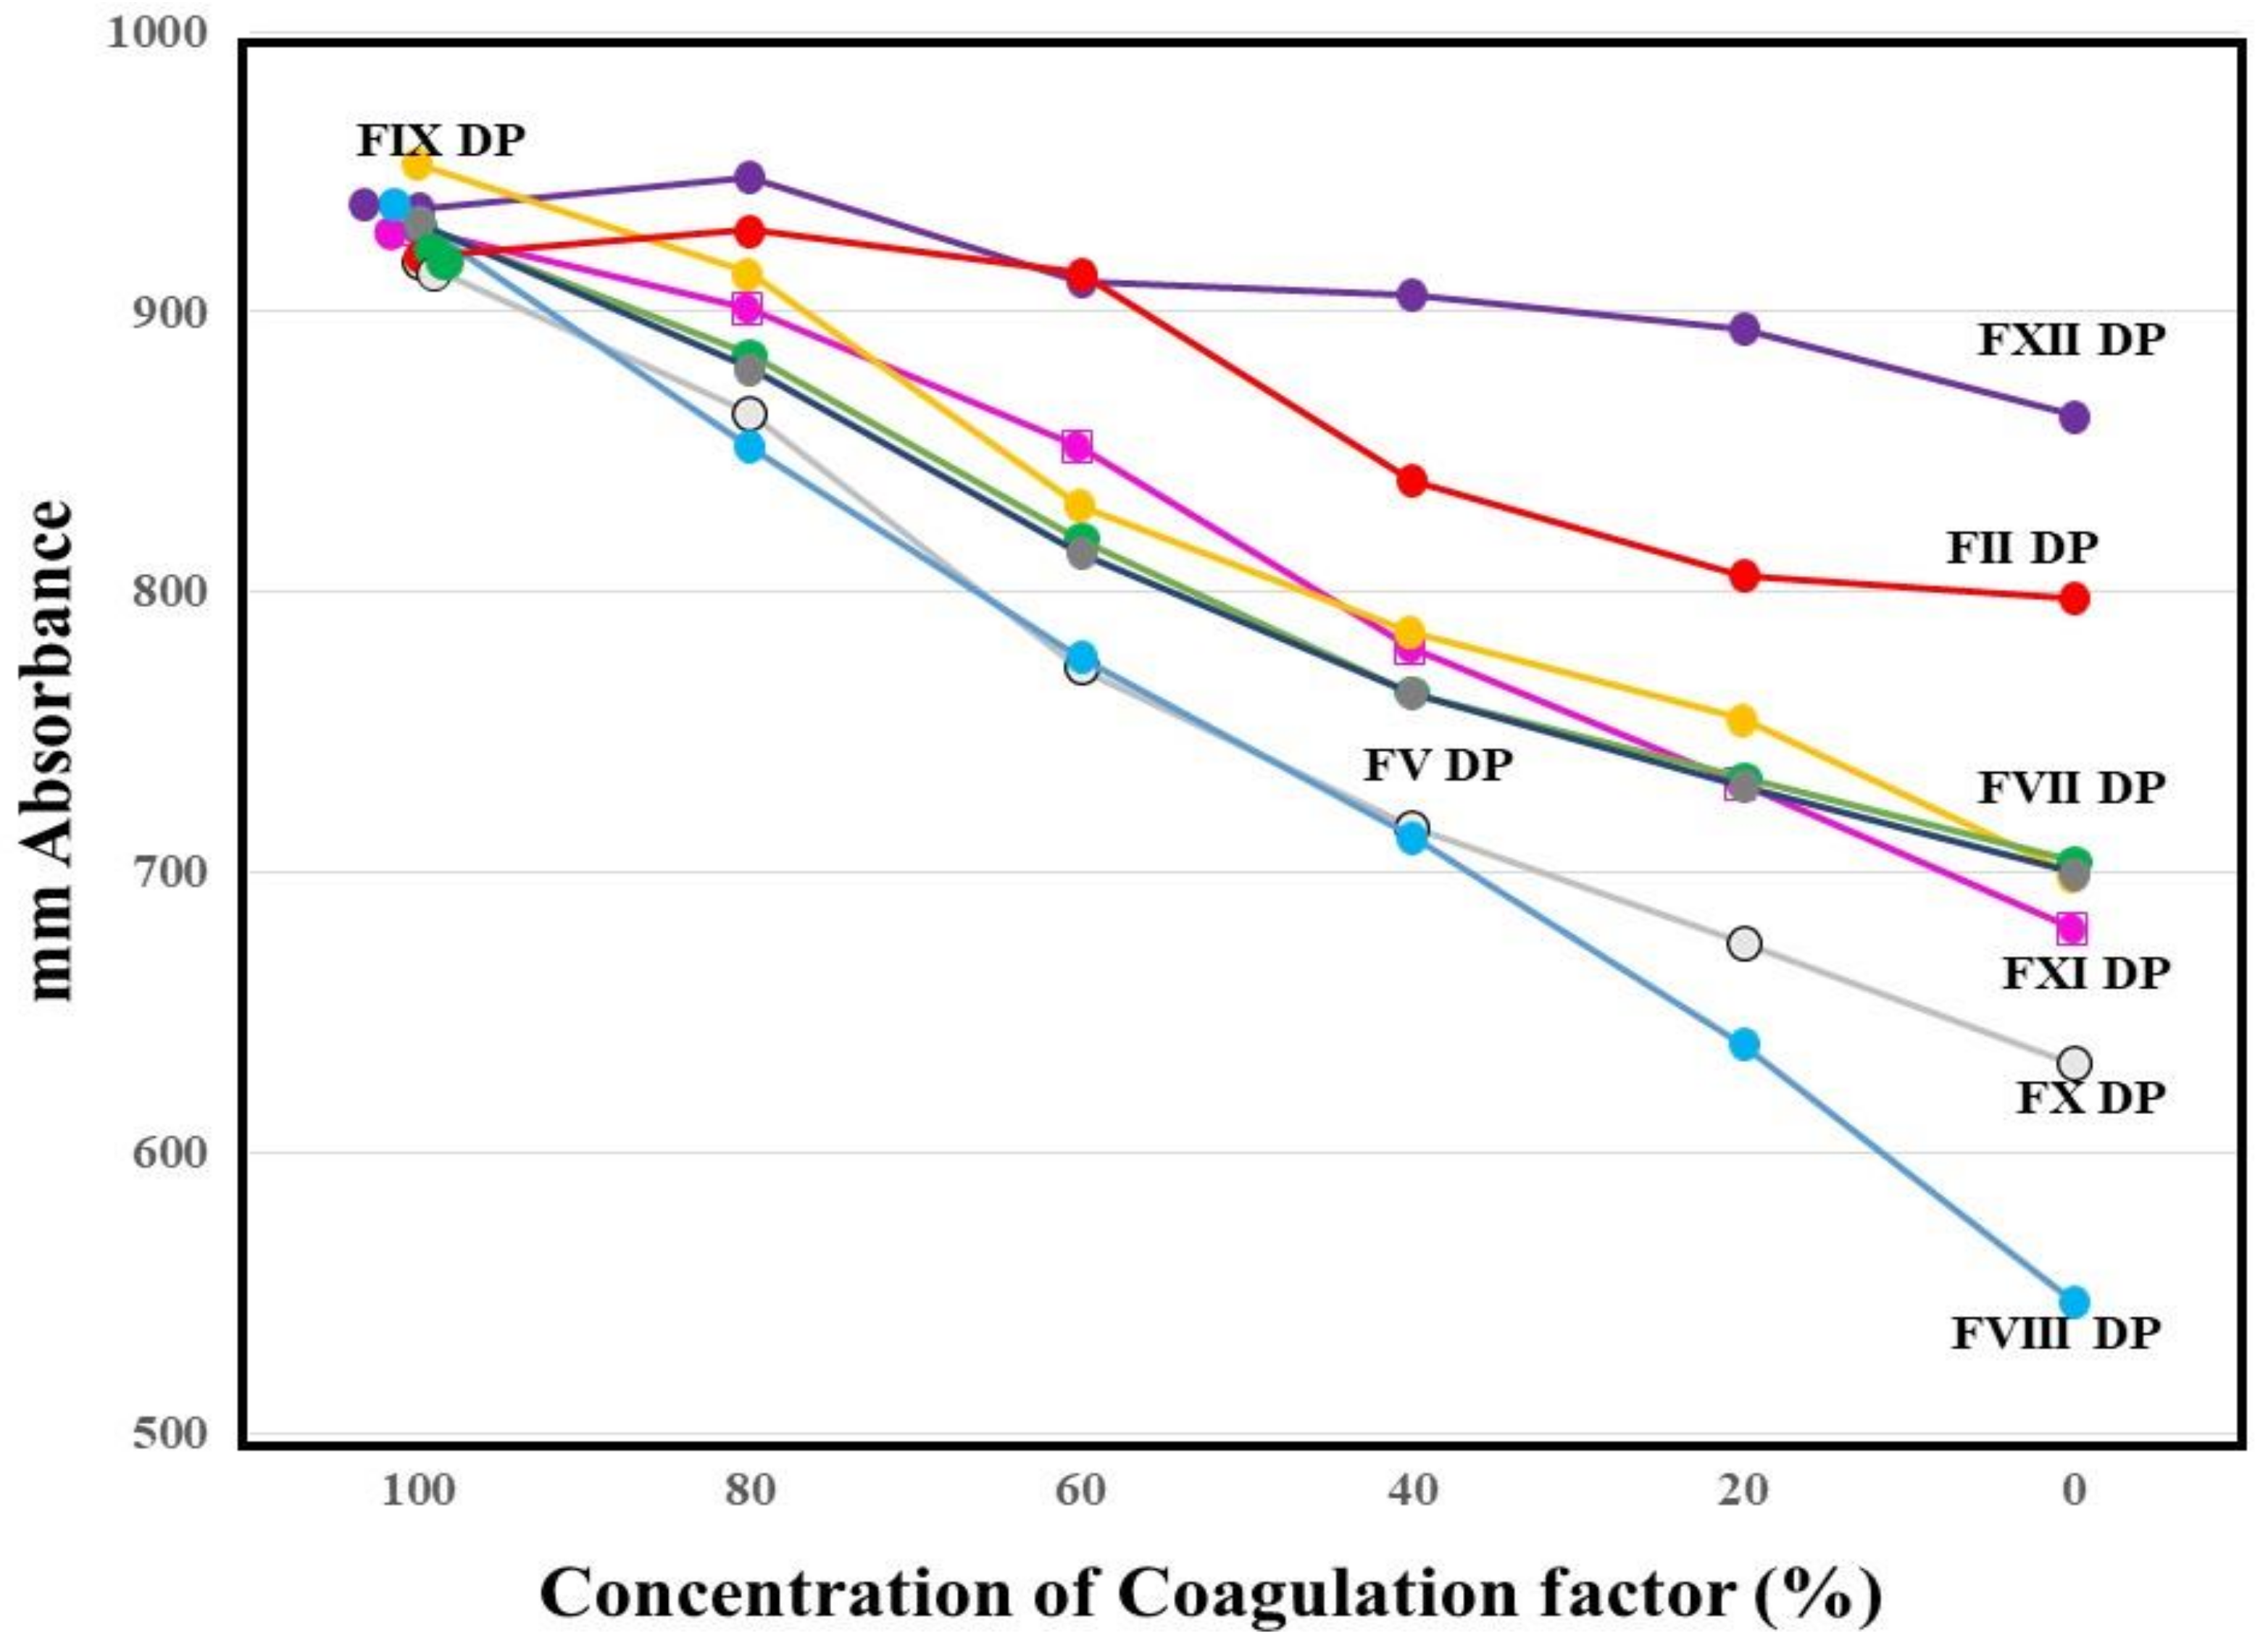
The absorbances of FFC at 100 s in the mixing tests (n = 3) between calibration plasma and factor-deficient plasma showed dose dependence (Figure 3). The steep slope of the dose-dependent curve was inclined toward larger values in FVIII-deficient plasma, and toward smaller values in FXII-deficient plasma. The second peak of the 1st DP in normal plasma from healthy volunteers was significantly shorter and higher in PRP than in PPP (Figure 4).
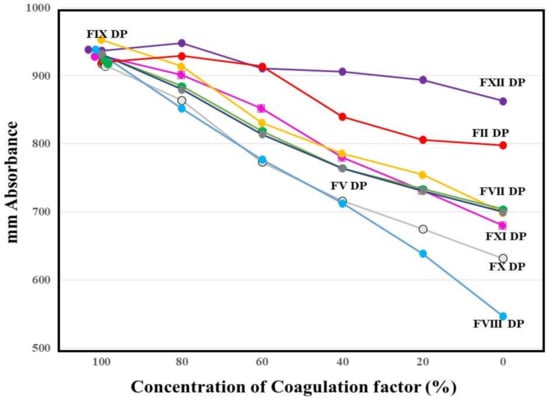
Figure 3.
Mixing test between calibration plasma and plasma deficient of each factor using a clot waveform analysis for thrombin time (0.5 IU/mL of thrombin). The height of fibrin formation at 100 s was plotted. The mean values of three assays are shown. The standard deviation in each assay was less than 45 mm absorbance. DP, deficient plasma.
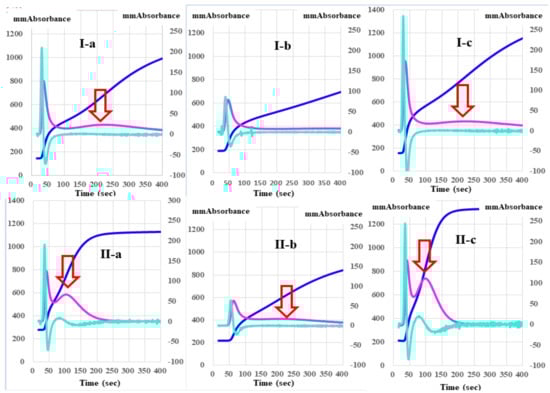
Figure 4.
A clot waveform analysis of thrombin time (0.5 IU/mL) in platelet-poor plasma (I) and platelet-rich plasma (II) from healthy volunteers (a), patients with thrombocytopenia (b), and patients with malignant disease (c). Navy line, fibrin formation curve; red line, 1st derivative curve (velocity); light blue, 2nd derivative curve (acceleration); red arrow shows 1st DPT-2.
Regarding the analysis of the CWA-TT between PPP and PRP from healthy volunteers, the 2nd DPT and 1st DPT were significantly longer in PRP than in PPP, but the 1st DPT-2 and FFCT were significantly shorter in PRP than in PPP (Table 1). Although the 1st DPH-1 was significantly lower in PRP than in PPP, the 1st DPH-2 and FFCH were significantly higher in PRP than in PPP. The CWA-TT using PPP did not show a second peak of the 1st-derivative in patients with thrombocytopenia, although the CWA-TT using PRP did show a second peak of the 1st derivative. Using PPP for the CWA-TT, the 2nd DPT and 1st DPT-1 were significantly longer, and the 1st DPH-1 was significantly lower in patients with thrombocytopenia than in healthy volunteers. The 2nd DPH, 1st DPH-1, 1st DPH-2, and FFCH were significantly higher in patients with malignant disease than in healthy volunteers (Table 2). Using PRP for the CWA-TT, the 1st DPT-2 and FFCT were significantly longer in patients with thrombocytopenia than in healthy volunteers, and the FFCT was significantly shorter in patients with malignant disease than in healthy volunteers. The 1st DPH-2 was significantly lower in patients with thrombocytopenia than in healthy volunteers, and the 2nd DPH, 1st DPH-1, and 1st DPH-2 were significantly higher in patients with malignant diseases than in healthy volunteers (Table 3).

Table 1.
Parameters of CWA-TT in PPP and PRP from healthy volunteers.
Table 2.
Parameters of CWA-TT in PRP from healthy volunteers, patients with solid cancer, and patients with malignancy.
Table 3.
Parameters of CWA-TT in PPP from healthy volunteers, patients with solid cancer, and patients with malignancy.
4. Discussion
The CWA-TT with FVIII-deficient plasma showed that a small amount of thrombin (≤0.1 IU/mL) failed to induce clot formation, suggesting that FVIII is required for physiological coagulation. As FVIII is reported to be markedly catalyzed and activated by thrombin [22], FVIII may play an important role in thrombin burst. Furthermore, the CWA-TT in plasma deficient of various clotting factors showed prolonged peak time, and decreased peak height. These findings suggest that various clotting factors are also required for the coagulation system involving thrombin burst induced by a small amount of thrombin [4,14]. However, CWA-TT reflects thrombin burst at thrombin concentrations ≤1.0 IU/mL, whereas at thrombin concentrations ≥5.0 IU/mL, CWA-TT strongly reflects the fibrinogen concentration [23]. In mixing texts to evaluate thrombin burst, a test with calibration plasma and FII-deficient plasma is useful as a control without thrombin burst, as FII-deficient plasma cannot cause a cycle of thrombin burst resulting in fibrin clot formation without thrombin burst. Therefore, a mixing test using CWA-TT proves that many coagulation factors, except for FXII, in which the millimeter absorbance was lower than that with FII-deficient plasma, may play an important role in thrombin burst.
In addition, the CWA-TT may be useful for evaluating the physiological and pathological coagulation induced by a small amount of thrombin. Physiological coagulation starts after small amounts of TF and FVIIa activate FIX, resulting in a small amount of thrombin. This thrombin activates not only fibrinogen, but also FV, FVIII, FIX, FX, and FXI, with the activation cycle from thrombin to FXI continuing for a short time thereafter [14]. The CWA-sTF/FIXa with a 2000-fold diluted PT reagent (recombinant TF) [24,25] was developed to evaluate physiological coagulation, and was shown to be capable of measuring the FVIII concentration. As a cross-mixing test of the CWA-TT between calibration plasma and FVIII-deficient plasma showed a good dose-response curve, the CWA-TT may be able to measure the FVIII concentration.
The physiological coagulation system includes enhancement of clotting activation by phospholipids of platelets. However, most APTT reagents have some contact activation substance, and cannot demonstrate physiological coagulation [15]. Therefore, an sTF/FIXa assay [15,24] uses PRP as a physiological phospholipid instead of commercial APTT reagents. The CWA-TT also showed that the peak height, especially the 1st DPH-2, was higher in PRP than in PPP. The 1st DPH-2 was absent in PPP, and low in PRP. Activated FVII has been reported to generate thrombin in hemophilia via both platelet-dependent and platelet-independent mechanisms [26]. These findings therefore suggest that the thrombin burst mechanism may depend, at least partially, on platelets. However, the peak heights of the CWA-TT were extremely high, suggesting that patients with malignant diseases are in a hypercoagulable state. Further studies of the CWA-TT will be required to investigate its utility for the differential diagnosis of thrombocytopenia and hypercoagulability.
5. Conclusions
The peak time and height of CWA-TT became abnormal in plasma deficient of various clotting factors, and the CWA-TT was markedly affected by platelet counts, suggesting that the CWA-TT may be useful in testing for hemostatic abnormalities, such as thrombocytopenia or hypercoagulability.
Author Contributions
Conceptualization, H.W.; methodology, Y.I., M.E.; validation, K.S., formal analysis, H.W.; investigation, T.M., Y.Y.; resources, Y.I.; data curation, M.E.; writing—original draft preparation, H.W.; writing—review and editing, M.S.; visualization, H.W.; supervision, H.S.; project administration, K.S.; funding acquisition, H.W. All authors have read and agreed to the published version of the manuscript.
Funding
This research was funded by a Grant-in-Aid from the Ministry of Health, Labour and Welfare of Japan (H30-015), and the Rare/Intractable Disease Project of Japan from Japan Agency for Medical Research and Development, AMED.
Institutional Review Board Statement
The study protocol (O-0057) was approved by the Human Ethics Review committees of Mie Prefectural General Medical Center, and informed consent was obtained from each patient.
Informed Consent Statement
Informed consent was obtained from all subjects involved in the study.
Data Availability Statement
The data presented in this study are available on request to the corresponding author. The data are not publicly available due to privacy restrictions.
Acknowledgments
The authors thank Nisii H and Sakano Y for their kind support in performing the assay for the CWA.
Conflicts of Interest
The measurements of CWA were partially supported by Instrumentation Laboratory Japan. In the other points, the authors declare no conflict of interest.
References
- Winter, W.E.; Greene, D.N.; Beal, S.G.; Isom, J.A.; Manning, H.; Wilkerson, G.; Harris, N. Clotting factors: Clinical biochemistry and their roles as plasma enzymes. Int. Rev. Cytol. 2020, 94, 31–84. [Google Scholar] [CrossRef]
- Berntorp, E.; Salvagno, G.L. Standardization and clinical utility of thrombin-generation assays. Semin. Thromb. Hemost. 2008, 34, 670–682. [Google Scholar] [CrossRef] [PubMed]
- Salvagno, G.L.; Berntorp, E. thrombin generation testing for monitoring hemophilia treatment: A clinical perspective. Semin. Thromb. Hemost. 2010, 36, 780–790. [Google Scholar] [CrossRef]
- Li, S.; Wang, M.; Li, X.; Xu, Q.; Liu, S.; Luo, S.; Chen, Y. Analysis of an Inherited dysfibrinogenemia pedigree associated with a heterozygous mutation in the FGA Gene. Hämostaseologie 2020, 40, 642–648. [Google Scholar] [CrossRef] [PubMed]
- Marchi, R.; Neerman-Arbez, M.; Gay, V.; Mourey, G.; Fiore, M.; Mouton, C.; Gautier, P.; De Moerloose, P.; Casini, A. Comparison of different activators of coagulation by turbidity analysis of hereditary dysfibrinogenemia and controls. Blood Coagul. Fibrinolysis 2021, 32, 108–114. [Google Scholar] [CrossRef]
- Haupt, L.; Vieira, M.; Brits, H.; de Beer, J.; Erasmus, E.; Esterhuyse, W.; Fraser, R.; Joubert, G. An audit of disseminated intravascular coagulation screen requests at an academic hospital laboratory in central South Africa. Int. J. Lab. Hematol. 2021, 43, 1174–1180. [Google Scholar] [CrossRef]
- Martinez, J.; Macdonald, K.A.; Palascak, J.E. The role of sialic acid in the dysfibrinogenemia associated with liver disease: Distribution of sialic acid on the constituent chains. Blood 1983, 61, 1196–1202. [Google Scholar] [CrossRef] [Green Version]
- Winter, W.E.; Flax, S.D.; Harris, N.S. Coagulation Testing in the Core Laboratory. Lab. Med. 2017, 48, 295–313. [Google Scholar] [CrossRef]
- Van Cott, E.M.; Roberts, A.J.; Dager, W.E. Laboratory monitoring of parenteral direct thrombin inhibitors. Semin. Thromb. Hemost. 2017, 43, 270–276. [Google Scholar]
- Konstantinidi, A.; Sokou, R.; Parastatidou, S.; Lampropoulou, K.; Katsaras, G.; Boutsikou, T.; Gounaris, A.K.; Tsantes, A.E.; Iacovidou, N. Clinical Application of Thromboelastography/Thromboelastometry (TEG/TEM) in the Neonatal Population: A Narrative Review. Semin. Thromb. Hemost. 2019, 45, 449–457. [Google Scholar] [CrossRef]
- Tripodi, A. Thrombin Generation Assay and Its Application in the Clinical Laboratory. Clin. Chem. 2016, 62, 699–707. [Google Scholar] [CrossRef] [PubMed] [Green Version]
- Bendetowicz, A.V.; Kai, H.; Knebel, R.; Caplain, H.; Hemker, H.C.; Lindhout, T.; Béguin, S. The effect of subcutaneous injection of unfractionated and low molecular weight heparin on thrombin generation in platelet rich plasma—A study in human volunteers. Thromb. Haemost. 1994, 72, 705–712. [Google Scholar] [CrossRef]
- Maeda, K.; Wada, H.; Shinkai, T.; Tanemura, A.; Matsumoto, T.; Mizuno, S. Evaluation of hemostatic abnormalities in patients who underwent major hepatobiliary pancreatic surgery using activated partial thromboplastin time-clot waveform analysis. Thromb. Res. 2021, 201, 154–160. [Google Scholar] [CrossRef] [PubMed]
- Wada, H.; Matsumoto, T.; Ohishi, K.; Shiraki, K.; Shimaoka, M. Update on the clot waveform analysis. Clin. Appl. Thromb. 2020, 26. [Google Scholar] [CrossRef] [PubMed]
- Wada, H.; Shiraki, K.; Matsumoto, T.; Ohishi, K.; Shimpo, H.; Shimaoka, M. Effects of platelet and phospholipids on clot formation activated by a small amount of tissue factor. Thromb. Res. 2020, 193, 146–153. [Google Scholar] [CrossRef]
- Matsumoto, T.; Fukuda, K.; Kubota, Y.; Tanaka, I.; Nishiya, K.; Giles, A.R.; Yoshioka, A.; Shima, M. The Utility of activated Partial Thromboplastin Time (aPTT) Clot Waveform Analysis in the Investigation of Hemophilia A Patients with very Low Levels of Factor VIII Activity (FVIII:C). Thromb. Haemost. 2002, 87, 436–441. [Google Scholar] [CrossRef]
- Matsumoto, T.; Nogami, K.; Shima, M. A combined approach using global coagulation assays quickly differentiates coagulation disorders with prolonged aPTT and low levels of FVIII activity. Int. J. Hematol. 2016, 105, 174–183. [Google Scholar] [CrossRef]
- Tokutake, T.; Baba, H.; Shimada, Y.; Takeda, W.; Sato, K.; Hiroshima, Y.; Kirihara, T.; Shimizu, I.; Nakazawa, H.; Kobayashi, H.; et al. Exogenous magnesium chloride reduces the activated partial thromboplastin times of lupus anticoagulant-positive patients. PLoS ONE. 2016, 11, e0157835. [Google Scholar] [CrossRef]
- Matsumoto, T.; Wada, H.; Fujimoto, N.; Toyoda, J.; Abe, Y.; Ohishi, K.; Yamashita, Y.; Ikejiri, M.; Hasegawa, K.; Suzuki, K.; et al. An evaluation of the activated partial thromboplastin time waveform. Clin. Appl. Thromb. 2017, 24, 764–770. [Google Scholar] [CrossRef]
- Hasegawa, M.; Wada, H.; Tone, S.; Yamaguchi, T.; Wakabayashi, H.; Ikejiri, M.; Watanabe, M.; Fujimoto, N.; Matsumoto, T.; Ohishi, K.; et al. Monitoring of hemostatic abnormalities in major orthopedic surgery patients treated with edoxaban by APTT waveform. Int. J. Lab. Hematol. 2017, 40, 49–55. [Google Scholar] [CrossRef] [PubMed]
- Suzuki, K.; Wada, H.; Matsumoto, T.; Ikejiri, M.; Ohishi, K.; Yamashita, Y.; Imai, H.; Iba, T. Katayama N: Usefulness of the APTT waveform for the diagnosis of DIC and prediction of the outcome or bleeding risk. Thromb. J. 2019, 17, 12. [Google Scholar] [CrossRef] [PubMed]
- Nakajima, Y.; Nogami, K. The C-terminal acidic region in the A1 domain of factor VIII facilitates thrombin-catalyzed activation and cleavage at Arg 372. J. Thromb. Haemost. 2021, 19, 677–688. [Google Scholar] [CrossRef]
- Suzuki, A.; Suzuki, N.; Kanematsu, T.; Shinohara, S.; Arai, N.; Kikuchi, R.; Matsushita, T. Clot waveform analysis in Clauss fibrinogen assay contributes to classification of fibrinogen disorders. Thromb. Res. 2019, 174, 98–103. [Google Scholar] [CrossRef] [PubMed]
- Hasegawa, M.; Tone, S.; Wada, H.; Naito, Y.; Matsumoto, T.; Yamashita, Y.; Shimaoka, M.; Sudo, A. The evaluation of hemostatic abnormalities using a CWA-Small amount tissue factor induced fix activation assay in major orthopedic surgery patients. Clin. Appl. Thromb. 2021, 27. [Google Scholar] [CrossRef] [PubMed]
- Matsumoto, T.; Wada, H.; Toyoda, H.; Hirayama, M.; Yamashita, Y.; Katayama, N. Modified clot waveform analysis to measure plasma coagulation potential in the presence of the anti-factor IXa/factor X bispecific antibody emicizumab: Comment. J. Thromb. Haemost. 2018, 16, 1665–1666. [Google Scholar] [CrossRef] [Green Version]
- Keshava, S.; Pendurthi, U.R.; Esmon, C.T.; Rao, L.V.M. Vijaya Mohan Rao: Therapeutic doses of recombinant factor VIIa in hemophilia generates thrombin in platelet-dependent and -independent mechanisms. J. Thromb. Haemost. 2020, 18, 1911–1921. [Google Scholar] [CrossRef]

Publisher’s Note: MDPI stays neutral with regard to jurisdictional claims in published maps and institutional affiliations. |
© 2021 by the authors. Licensee MDPI, Basel, Switzerland. This article is an open access article distributed under the terms and conditions of the Creative Commons Attribution (CC BY) license (https://creativecommons.org/licenses/by/4.0/).