
Clinical Limitations of Tissue Annexin A2 Level as a Predictor of Postoperative Overall Survival in Patients with Hepatocellular Carcinoma


Abstract
1. Introduction
2. Materials and Methods
2.1. Patients and Basic Clinical Data
2.2. Western Blot Analysis
2.3. Statistical Analysis
3. Results
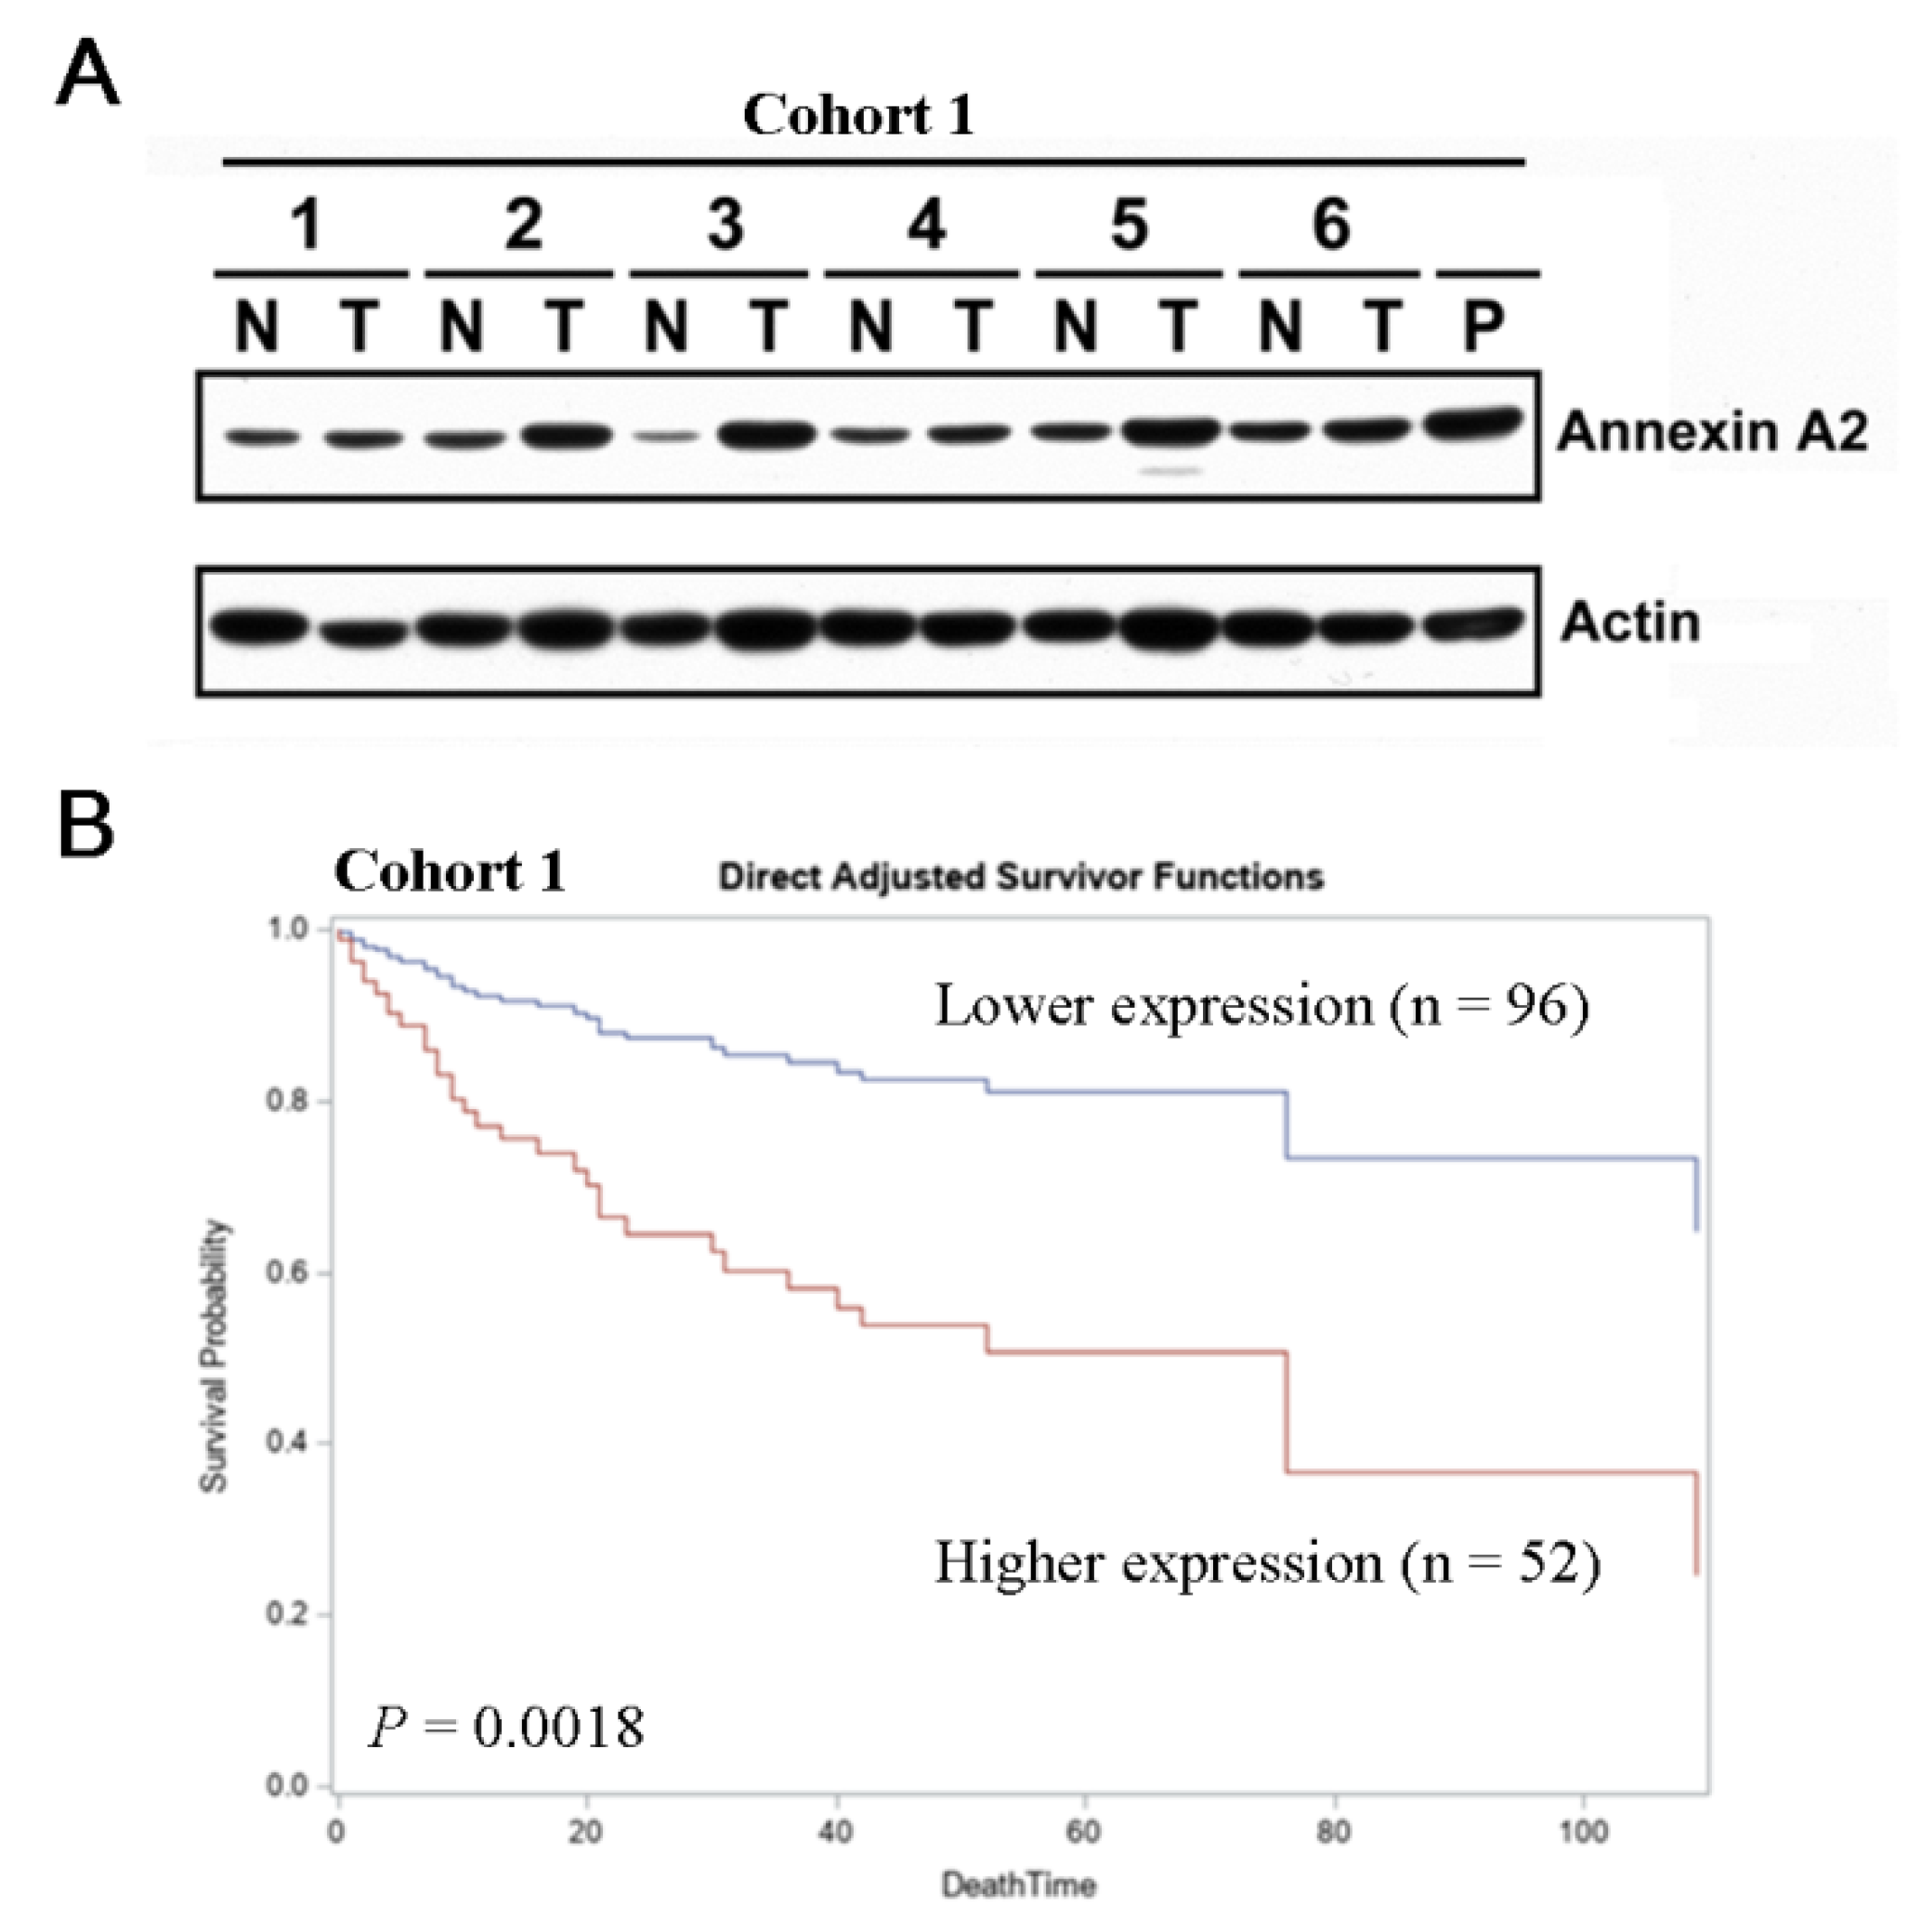
3.1. Elevated ANXA2 Expression Is Negatively Correlated with Clinical Outcomes
3.2. Clinicopathological Predictors for RFS and OS
3.3. ANXA2 Expression Levels in HCC Tissues Are an Effective Prognosis Predictor in Specific Clinical Subgroups of HCC
4. Discussion
5. Conclusions
Supplementary Materials
Author Contributions
Funding
Institutional Review Board Statement
Informed Consent Statement
Data Availability Statement
Acknowledgments
Conflicts of Interest
References
- Kim, E.; Viatour, P. Hepatocellular carcinoma: Old friends and new tricks. Exp. Mol. Med. 2020, 52, 1898–1907. [Google Scholar] [CrossRef]
- Elpek, G.O. Molecular pathways in viral hepatitis-associated liver carcinogenesis: An update. World J. Clin. Cases 2021, 9, 4890–4917. [Google Scholar] [CrossRef]
- Chiang, C.J.; Yang, Y.W.; You, S.L.; Lai, M.S.; Chen, C.J. Thirty-year outcomes of the national hepatitis B immunization program in Taiwan. JAMA 2013, 310, 974–976. [Google Scholar] [CrossRef] [PubMed]
- Park, S.J.; Jang, J.Y.; Jeong, S.W.; Cho, Y.K.; Lee, S.H.; Kim, S.G.; Cha, S.W.; Kim, Y.S.; Cho, Y.D.; Kim, H.S.; et al. Usefulness of AFP, AFP-L3, and PIVKA-II, and their combinations in diagnosing hepatocellular carcinoma. Medicine 2017, 96, e5811. [Google Scholar] [CrossRef]
- Chan, M.Y.; She, W.H.; Dai, W.C.; Tsang, S.H.Y.; Chok, K.S.H.; Chan, A.C.Y.; Fung, J.; Lo, C.M.; Cheung, T.T. Prognostic value of preoperative alpha-fetoprotein (AFP) level in patients receiving curative hepatectomy—An analysis of 1182 patients in Hong Kong. Transl. Gastroenterol. Hepatol. 2019, 4, 52. [Google Scholar] [CrossRef] [PubMed]
- Chen, L.; Lin, L.; Xian, N.; Zheng, Z. Annexin A2 regulates glioma cell proliferation through the STAT3cyclin D1 pathway. Oncol. Rep. 2019, 42, 399–413. [Google Scholar]
- Lee, D.B.; Jamgotchian, N.; Allen, S.G.; Kan, F.W.; Hale, I.L. Annexin A2 heterotetramer: Role in tight junction assembly. Am. J. Physiol.-Ren. Physiol. 2004, 287, F481–F491. [Google Scholar] [CrossRef] [PubMed]
- Jiang, S.L.; Pan, D.Y.; Gu, C.; Qin, H.F.; Zhao, S.H. Annexin A2 silencing enhances apoptosis of human umbilical vein endothelial cells in vitro. Asian Pac. J. Trop. Med. 2015, 8, 952–957. [Google Scholar] [CrossRef] [PubMed]
- Sun, Y.; Gao, G.; Cai, J.; Wang, Y.; Qu, X.; He, L.; Liu, F.; Zhang, Y.; Lin, K.; Ma, S.; et al. Annexin A2 is a discriminative serological candidate in early hepatocellular carcinoma. Carcinogenesis 2013, 34, 595–604. [Google Scholar] [CrossRef] [PubMed]
- Wang, C.; Guo, Y.; Wang, J.; Min, Z. Annexin A2 knockdown inhibits hepatoma cell growth and sensitizes hepatoma cells to 5-fluorouracil by regulating beta-catenin and cyclin D1 expression. Mol. Med. Rep. 2015, 11, 2147–2152. [Google Scholar] [CrossRef] [PubMed]
- Yang, M.; Wang, C.; Li, S.; Xv, X.; She, S.; Ran, X.; Li, S.; Hu, H.; Hu, P.; Zhang, D.; et al. Annexin A2 promotes liver fibrosis by mediating von Willebrand factor secretion. Dig. Liver Dis. 2017, 49, 780–788. [Google Scholar] [CrossRef]
- Liu, Z.; Ling, Q.; Wang, J.; Xie, H.; Xu, X.; Zheng, S. Annexin A2 is not a good biomarker for hepatocellular carcinoma in cirrhosis. Oncol. Lett. 2013, 6, 125–129. [Google Scholar] [CrossRef]
- Roessler, S.; Jia, H.L.; Budhu, A.; Forgues, M.; Ye, Q.H.; Lee, J.S.; Thorgeirsson, S.S.; Sun, Z.; Tang, Z.Y.; Qin, L.X.; et al. A unique metastasis gene signature enables prediction of tumor relapse in early-stage hepatocellular carcinoma patients. Cancer Res. 2010, 70, 10202–10212. [Google Scholar] [CrossRef] [PubMed]
- Lin, Y.H.; Wu, M.H.; Liu, Y.C.; Lyu, P.C.; Yeh, C.T.; Lin, K.H. LINC01348 suppresses hepatocellular carcinoma metastasis through inhibition of SF3B3-mediated EZH2 pre-mRNA splicing. Oncogene 2021, 40, 4675–4685. [Google Scholar] [CrossRef] [PubMed]
- Mazumdar, M.; Glassman, J.R. Categorizing a prognostic variable: Review of methods, code for easy implementation and applications to decision-making about cancer treatments. Stat. Med. 2000, 19, 113–132. [Google Scholar] [CrossRef]
- Luo, S.; Xie, C.; Wu, P.; He, J.; Tang, Y.; Xu, J.; Zhao, S. Annexin A2 is an independent prognostic biomarker for evaluating the malignant progression of laryngeal cancer. Exp. Ther. Med. 2017, 14, 6113–6118. [Google Scholar] [CrossRef]
- Zhang, F.; Zhang, H.; Wang, Z.; Yu, M.; Tian, R.; Ji, W.; Yang, Y.; Niu, R. P-glycoprotein associates with Anxa2 and promotes invasion in multidrug resistant breast cancer cells. Biochem. Pharm. 2014, 87, 292–302. [Google Scholar] [CrossRef]
- Lokman, N.A.; Pyragius, C.E.; Ruszkiewicz, A.; Oehler, M.K.; Ricciardelli, C. Annexin A2 and S100A10 are independent predictors of serous ovarian cancer outcome. Transl. Res. 2016, 171, 83–95.e2. [Google Scholar] [CrossRef]
- Alonso-Alconada, L.; Santacana, M.; Garcia-Sanz, P.; Muinelo-Romay, L.; Colas, E.; Mirantes, C.; Monge, M.; Cueva, J.; Oliva, E.; Soslow, R.A.; et al. Annexin-A2 as predictor biomarker of recurrent disease in endometrial cancer. Int. J. Cancer 2015, 136, 1863–1873. [Google Scholar] [CrossRef]
- Scholten, D.; Trebicka, J.; Liedtke, C.; Weiskirchen, R. The carbon tetrachloride model in mice. Lab. Anim. 2015, 49 (Suppl. 1), 4–11. [Google Scholar] [CrossRef]
- Kolgelier, S.; Demir, N.A.; Inkaya, A.C.; Sumer, S.; Ozcimen, S.; Demir, L.S.; Pehlivan, F.S.; Arslan, M.; Arpaci, A. Serum Levels of Annexin A2 as a Candidate Biomarker for Hepatic Fibrosis in Patients with Chronic Hepatitis B. Hepat. Mon. 2015, 15, e30655. [Google Scholar] [CrossRef]
- Backes, P.; Quinkert, D.; Reiss, S.; Binder, M.; Zayas, M.; Rescher, U.; Gerke, V.; Bartenschlager, R.; Lohmann, V. Role of annexin A2 in the production of infectious hepatitis C virus particles. J. Virol. 2010, 84, 5775–5789. [Google Scholar] [CrossRef] [PubMed]
- Shaker, M.K.; Abdel Fattah, H.I.; Sabbour, G.S.; Montasser, I.F.; Abdelhakam, S.M.; El Hadidy, E.; Yousry, R.; El Dorry, A.K. Annexin A2 as a biomarker for hepatocellular carcinoma in Egyptian patients. World J. Hepatol. 2017, 9, 469–476. [Google Scholar] [CrossRef] [PubMed]
- Chen, Y.D.; Fang, Y.T.; Cheng, Y.L.; Lin, C.F.; Hsu, L.J.; Wang, S.Y.; Anderson, R.; Chang, C.P.; Lin, Y.S. Exophagy of annexin A2 via RAB11, RAB8A and RAB27A in IFN-gamma-stimulated lung epithelial cells. Sci. Rep. 2017, 7, 5676. [Google Scholar] [CrossRef]
- Hitchcock, J.K.; Katz, A.A.; Schafer, G. Dynamic reciprocity: The role of annexin A2 in tissue integrity. J. Cell Commun. Signal. 2014, 8, 125–133. [Google Scholar] [CrossRef]
- Zhang, W.; Zhao, P.; Xu, X.L.; Cai, L.; Song, Z.S.; Cao, D.Y.; Tao, K.S.; Zhou, W.P.; Chen, Z.N.; Dou, K.F. Annexin A2 promotes the migration and invasion of human hepatocellular carcinoma cells in vitro by regulating the shedding of CD147-harboring microvesicles from tumor cells. PLoS ONE 2013, 8, e67268. [Google Scholar]
- Dong, Z.; Yao, M.; Zhang, H.; Wang, L.; Huang, H.; Yan, M.; Wu, W.; Yao, D. Inhibition of Annexin A2 gene transcription is a promising molecular target for hepatoma cell proliferation and metastasis. Oncol. Lett. 2014, 7, 28–34. [Google Scholar] [CrossRef][Green Version]
- Shi, J.; Ren, M.; She, X.; Zhang, Z.; Zhao, Y.; Han, Y.; Lu, D.; Lyu, L. Transgelin-2 contributes to proliferation and progression of hepatocellular carcinoma via regulating Annexin A2. Biochem. Biophys. Res. Commun. 2020, 523, 632–638. [Google Scholar] [CrossRef]
- Qiu, L.W.; Liu, Y.F.; Cao, X.Q.; Wang, Y.; Cui, X.H.; Ye, X.; Huang, S.W.; Xie, H.J.; Zhang, H.J. Annexin A2 promotion of hepatocellular carcinoma tumorigenesis via the immune microenvironment. World J. Gastroenterol. 2020, 26, 2126–2137. [Google Scholar] [CrossRef]
- Chen, C.Y.; Lin, Y.S.; Chen, C.H.; Chen, Y.J. Annexin A2-mediated cancer progression and therapeutic resistance in nasopharyngeal carcinoma. J. Biomed. Sci. 2018, 25, 30. [Google Scholar] [CrossRef] [PubMed]
- Aarli, A.; Skeie Jensen, T.; Kristoffersen, E.K.; Bakke, A.; Ulvestad, E. Inhibition of phytohaemagglutinin-induced lymphoproliferation by soluble annexin II in sera from patients with renal cell carcinoma. APMIS 1997, 105, 699–704. [Google Scholar] [CrossRef] [PubMed]
- An, J.H.; Seong, J.; Oh, H.; Kim, W.; Han, K.H.; Paik, Y.H. Protein expression profiles in a rat cirrhotic model induced by thioacetamide. Korean J. Hepatol. 2006, 12, 93–102. [Google Scholar] [PubMed]
- Lou, Y.; Yu, Y.; Xu, X.; Zhou, S.; Shen, H.; Fan, T.; Wu, D.; Yin, J.; Li, G. Long non-coding RNA LUCAT1 promotes tumourigenesis by inhibiting ANXA2 phosphorylation in hepatocellular carcinoma. J. Cell. Mol. Med. 2019, 23, 1873–1884. [Google Scholar] [CrossRef]
- Cheng, D.; Wang, J.; Dong, Z.; Li, X. Cancer-related circular RNA: Diverse biological functions. Cancer Cell Int. 2021, 21, 11. [Google Scholar] [CrossRef] [PubMed]
- Wang, Y.; Xu, W.; Zu, M.; Xu, H. Circular RNA circ_0021093 regulates miR-432/Annexin A2 pathway to promote hepatocellular carcinoma progression. Anticancer Drugs 2021, 32, 484–495. [Google Scholar] [CrossRef]


| Variable | All Patients | Non-Cirrhosis | Cirrhosis | p |
|---|---|---|---|---|
| Patient number | 148 | 80 | 68 | |
| Gender | ||||
| Female | 36(24.3%) | 20(25.0%) | 16(23.5%) | 0.835 |
| Male | 112(75.7%) | 60(75.0%) | 52(76.5%) | |
| Age (years) | 56.0 ± 14.9 | 54.2±16.1 | 58.1 ± 13.2 | 0.106 |
| Child–Pugh Classification | ||||
| A | 127(85.8%) | 70(87.5%) | 57(83.8%) | 0.523 |
| B | 21(14.2%) | 10(12.5%) | 11(16.2%) | |
| Ascites | ||||
| No | 136(91.9%) | 74(92.5%) | 62(91.2%) | 0.769 |
| Yes | 12(8.1%) | 6(7.5%) | 6(8.8%) | |
| HBsAg | ||||
| Negative | 46(31.1%) | 24(30.0%) | 22(32.4%) | 0.758 |
| Positive | 102(68.9%) | 56(70.0%) | 46(67.6%) | |
| Anti-HCV Ab | ||||
| Negative | 107(72.3%) | 68(85.0%) | 39(57.4%) | <0.001 * |
| Positive | 41(27.7%) | 12(15.0%) | 29(42.6%) | |
| Alcohol consumption | ||||
| No | 104(70.3%) | 59(73.8%) | 45(66.2%) | 0.315 |
| Yes | 44(29.7%) | 21(26.3%) | 23(33.8%) | |
| Tumor status | ||||
| Tumor number | ||||
| 1 | 95(64.2%) | 51(63.8%) | 44(64.7%) | 0.904 |
| ≥2 | 53(35.8%) | 29(36.3%) | 24(35.3%) | |
| Tumor size (cm) | 6.9 ± 4.8 | 8.5 ± 5.1 | 5.1 ± 3.6 | <0.001 * |
| Histological grading | ||||
| 1–2 | 47(31.8%) | 22(27.5%) | 25(36.8%) | 0.228 |
| 3–4 | 101(68.2%) | 58(72.5%) | 43(63.2%) | |
| Microvascular invasion | ||||
| No | 103(69.6%) | 54(67.5%) | 49(72.1%) | 0.548 |
| Yes | 45(30.4%) | 26(32.5%) | 19(27.9%) | |
| Macrovascular invasion | ||||
| No | 136(91.9%) | 74(92.5%) | 62(91.2%) | 0.769 |
| Yes | 12(8.1%) | 6(7.5%) | 6(8.8%) | |
| Capsule | ||||
| No | 37(25.0%) | 22(27.5%) | 15(22.1%) | 0.446 |
| Yes | 111(75.0%) | 58(72.5%) | 53(77.9%) | |
| Microsatellite distribution | ||||
| No | 123(83.1%) | 63(78.8%) | 60(88.2%) | 0.125 |
| Yes | 25(16.9%) | 17(21.3%) | 8(11.8%) | |
| Annexin A2 expression | ||||
| <0.8 (Low) | 96(64.9%) | 62(77.5%) | 34(50.0%) | <0.001 * |
| ≥0.8 (High) | 52(35.1%) | 18(22.5%) | 34(50.0%) | |
| Laboratory data | ||||
| AFP (ng/mL) | 14.9(1.5-327.500) | 6.5(2.9–327.500) | 22.0(1.5–89,637.7) | 0.642 |
| Albumin (g/dL) | 3.7 ± 0.7 | 3.8 ± 0.7 | 3.7 ± 0.6 | 0.427 |
| Bilirubin (mg/dL) | 1.3 ± 1.7 | 1.4 ± 2.1 | 1.2 ± 1.0 | 0.550 |
| Prothrombin time (sec) | 12.4 ± 1.5 | 12.1 ± 1.5 | 12.7 ± 1.5 | 0.042 * |
| AST (U/L) | 94.6 ± 118.8 | 111.7 ± 151.0 | 74.5 ± 57.7 | 0.044 * |
| ALT(U/L) | 77.0 ± 96.8 | 87.9 ± 120.5 | 64.2 ± 56.0 | 0.119 |
| Creatinine (mg/dL) | 1.2 ± 1.4 | 1.3 ± 1.8 | 1.1 ± 0.7 | 0.428 |
| Parameters | HCC Samples (n = 148) | Mean ± SE | pa |
|---|---|---|---|
| Gender | |||
| Male | 112 | 0.6116 ± 0.0475 | 0.8186 |
| Female | 36 | 0.6583 ± 0.1143 | |
| Age (years) | |||
| ≤65 | 100 | 0.6470 ± 0.0623 | 0.8222 |
| >65 | 48 | 0.5729 ± 0.0518 | |
| Cirrhosis | |||
| No | 80 | 0.4913 ± 0.0505 | 0.0003 * |
| Yes | 68 | 0.7779 ± 0.0748 | |
| Child–Pugh classification | |||
| A | 127 | 0.6213 ± 0.0505 | 0.6987 |
| B | 21 | 0.6333 ± 0.0942 | |
| Ascites | |||
| No | 136 | 0.6191 ± 0.0483 | 0.4494 |
| Yes | 12 | 0.6667 ± 0.1157 | |
| HBsAg | |||
| Negative | 46 | 0.7087 ± 0.0917 | 0.1533 |
| Positive | 102 | 0.5843 ± 0.0509 | |
| Anti-HCV Ab | |||
| Negative | 107 | 0.5514 ± 0.0488 | 0.0039 * |
| Positive | 41 | 0.8098 ± 0.0976 | |
| Alcohol consumption | |||
| No | 104 | 0.6115 ± 0.0483 | 0.5390 |
| Yes | 44 | 0.6667 ± 0.1157 | |
| Tumor number | |||
| 1 | 95 | 0.6316 ± 0.0579 | 0.8248 |
| ≥2 | 53 | 0.6500 ± 0.0730 | |
| Tumor size | |||
| ≤5 cm | 72 | 0.6528 ± 0.0544 | 0.2919 |
| >5 cm | 76 | 0.5947 ± 0.0826 | |
| Histological grading | |||
| 1–2 | 47 | 0.6500 ± 0.0951 | 0.7070 |
| 3–4 | 101 | 0.6083 ± 0.0475 | |
| Microvascular invasion | |||
| No | 103 | 0.6291 ± 0.0535 | 0.5899 |
| Yes | 45 | 0.6089 ± 0.0858 | |
| Macrovascular invasion | |||
| No | 136 | 0.6154 ± 0.0482 | 0.2173 |
| Yes | 12 | 0.7083 ± 0.1202 | |
| Capsule | |||
| No | 37 | 0.4378 ± 0.0647 | 0.0069 * |
| Yes | 111 | 0.6847 ± 0.0553 | |
| Microsatellite distribution | |||
| No | 123 | 0.6235 ± 0.0513 | 0.6822 |
| Yes | 25 | 0.6200 ± 0.0923 | |
| AFP | |||
| Normal | 75 | 0.5533 ± 0.0414 | 0.6768 |
| >ULN | 73 | 0.6945 ± 0.0809 | |
| Albumin | |||
| Normal | 93 | 0.6290 ± 0.0550 | 0.5360 |
| ≤LLN | 55 | 0.6127 ± 0.0793 | |
| Bilirubin | |||
| Normal | 115 | 0.6130 ± 0.0506 | 0.7281 |
| >ULN | 33 | 0.6575 ± 0.1017 | |
| Prothrombin time | |||
| Prolonged ≤ 4 s | 137 | 0.6255 ± 0.0480 | 0.9589 |
| Prolonged > 4 s | 11 | 0.5909 ± 0.1254 | |
| AST | |||
| Normal | 45 | 0.4311 ± 0.0490 | 0.0048 * |
| >ULN | 103 | 0.7068 ± 0.0597 | |
| ALT | |||
| Normal | 60 | 0.5800 ± 0.0742 | 0.2407 |
| >ULN | 88 | 0.6523 ± 0.0571 | |
| Creatinine | |||
| Normal | 117 | 0.5820 ± 0.0424 | 0.3514 |
| > ULN | 31 | 0.7774 ± 0.1438 |
| RFS | |||||||
|---|---|---|---|---|---|---|---|
| Univariate Analysis | Multivariate Analysis | ||||||
| Parameters | n | HR | 95% CI | p | HR | 95% CI | p |
| Gender | |||||||
| Female | 36 | ||||||
| Male | 112 | 1.263 | 0.760–2.098 | 0.3668 | |||
| Age (years) | |||||||
| ≤65 | 100 | ||||||
| >65 | 48 | 0.785 | 0.491–1.256 | 0.3125 | |||
| Cirrhosis | |||||||
| No | 80 | ||||||
| Yes | 68 | 1.466 | 0.967–2.223 | 0.0717 | |||
| Child–Pugh classification | |||||||
| A | 127 | ||||||
| B | 21 | 1.345 | 0.714–2.535 | 0.3587 | |||
| Ascites | |||||||
| No | 136 | ||||||
| Yes | 12 | 3.301 | 1.715–6.352 | <0.001 * | 2.274 | 1.156–4.472 | 0.0173 * |
| HBsAg | |||||||
| Negative | 46 | ||||||
| Positive | 102 | 1.113 | 0.701–1.767 | 0.6507 | |||
| Anti-HCV Ab | |||||||
| Negative | 107 | ||||||
| Positive | 41 | 1.180 | 0.736–1.891 | 0.4923 | |||
| Alcohol consumption | |||||||
| No | 104 | ||||||
| Yes | 44 | 1.205 | 0.775–1.873 | 0.4069 | |||
| Tumor status | |||||||
| Tumor number | |||||||
| 1 | 95 | ||||||
| ≥2 | 53 | 3.240 | 2.097–5.005 | <0.0001 * | 2.649 | 1.571–4.467 | 0.0003 * |
| Tumor size (cm) | |||||||
| ≤5 | 72 | ||||||
| >5 | 76 | 1.475 | 0.968–2.247 | 0.0706 | |||
| Histological grading | |||||||
| 1–2 | 47 | ||||||
| 3–4 | 101 | 1.217 | 0.760–1.950 | 0.4133 | |||
| Microvascular invasion | |||||||
| No | 103 | ||||||
| Yes | 45 | 2.514 | 1.623–3.895 | <0.0001 * | 1.489 | 0.878–2.523 | 0.1394 |
| Macrovascular invasion thrombosis | |||||||
| No | 136 | ||||||
| Yes | 12 | 1.516 | 0.760–3.028 | 0.2379 | |||
| Capsule | |||||||
| No | 37 | ||||||
| Yes | 111 | 0.778 | 0.486–1.245 | 0.2954 | |||
| Microsatellite distribution | |||||||
| No | 123 | ||||||
| Yes | 25 | 2.300 | 1.391–3.803 | 0.0012 * | 0.881 | 0.468–1.661 | 0.6962 |
| Annexin A2 expression | |||||||
| <0.8 (Low) | 96 | ||||||
| ≥0.8 (High) | 52 | 1.726 | 1.120–2.659 | 0.0133 * | 1.459 | 0.934–2.279 | 0.0969 |
| Laboratory data | |||||||
| AFP | |||||||
| Normal | 75 | ||||||
| >ULN | 73 | 1.903 | 1.248–2.900 | 0.0028 * | 1.544 | 0.994–2.399 | 0.0531 |
| Albumin | |||||||
| Normal | 93 | 0.769 | 0.497–1.189 | 0.2369 | |||
| ≤LLN | 55 | ||||||
| Bilirubin | |||||||
| Normal | 115 | ||||||
| >ULN | 33 | 1.384 | 0.847–2.261 | 0.1951 | |||
| Prothrombin time | |||||||
| Prolonged ≤ 4 s | 137 | ||||||
| Prolonged > 4 s | 11 | 1.289 | 0.619–2.686 | 0.4981 | |||
| AST | |||||||
| Normal | 45 | ||||||
| >ULN | 103 | 1.846 | 1.132–3.010 | 0.0141 * | 1.719 | 1.027–2.880 | 0.0394 * |
| ALT | |||||||
| Normal | 60 | ||||||
| >ULN | 88 | 1.304 | 0.852–1.995 | 0.2210 | |||
| Creatinine | |||||||
| Normal | 117 | ||||||
| >ULN | 31 | 0.898 | 0.515–1.568 | 0.7057 | |||
| OS | |||||||
|---|---|---|---|---|---|---|---|
| Univariate Analysis | Multivariate Analysis | ||||||
| Parameters | n | HR | 95% CI | p | HR | 95% CI | p |
| Gender | |||||||
| Female | 36 | ||||||
| Male | 112 | 1.826 | 0.701–4.755 | 0.2175 | |||
| Age (years) | |||||||
| ≤65 | 100 | ||||||
| >65 | 48 | 0.345 | 0.121–0.986 | 0.0470 * | 0.494 | 0.160–1.527 | 0.2204 |
| Cirrhosis | |||||||
| No | 80 | ||||||
| Yes | 68 | 1.357 | 0.677–2.720 | 0.3891 | |||
| Child–Pugh classification | |||||||
| A | 127 | ||||||
| B | 21 | 4.894 | 2.345–10.215 | <0.001 * | 3.687 | 1.484–9.159 | 0.0050 * |
| Ascites | |||||||
| No | 136 | ||||||
| Yes | 12 | 4.241 | 1.812–9.926 | <0.001 * | 3.361 | 1.328–8.507 | 0.0105 * |
| HBsAg | |||||||
| Negative | 46 | ||||||
| Positive | 102 | 1.003 | 0.463–2.171 | 0.9949 | |||
| Anti-HCV Ab | |||||||
| Negative | 107 | ||||||
| Positive | 41 | 1.026 | 0.460–2.287 | 0.9509 | |||
| Alcohol consumption | |||||||
| No | 104 | ||||||
| Yes | 44 | 1.723 | 0.856–3.468 | 0.1275 | |||
| Tumor status | |||||||
| Tumor number | |||||||
| 1 | 95 | ||||||
| ≥2 | 53 | 1.666 | 0.807–3.439 | 0.1679 | |||
| Tumor size (cm) | |||||||
| ≤5 | 72 | ||||||
| >5 | 76 | 1.731 | 0.834–3.592 | 0.1410 | |||
| Histological grading | |||||||
| 1–2 | 47 | ||||||
| 3–4 | 101 | 1.108 | 0.506–2.429 | 0.7974 | |||
| Microvascular Invasion | |||||||
| No | 103 | ||||||
| Yes | 45 | 2.796 | 1.356–5.765 | 0.0053 * | 1.921 | 0.873–4.227 | 0.1045 |
| Macrovascular invasion thrombosis | |||||||
| No | 136 | ||||||
| Yes | 12 | 2.488 | 0.953–6.495 | 0.0627 | |||
| Capsule | |||||||
| No | 37 | ||||||
| Yes | 111 | 0.811 | 0.363–1.811 | 0.6097 | |||
| Microsatellite distribution | |||||||
| No | 123 | ||||||
| Yes | 25 | 2.172 | 0.964–4.893 | 0.0612 | |||
| Annexin A2 expression | |||||||
| <0.8 (Low) | 96 | ||||||
| ≥0.8 (High) | 52 | 3.210 | 1.542–6.684 | 0.0018 * | 2.497 | 1.109–5.619 | 0.0270 * |
| Laboratory data | |||||||
| AFP | |||||||
| Normal | 75 | ||||||
| >ULN | 73 | 2.292 | 1.102-4.766 | 0.0264 * | 1.381 | 0.603–3.162 | 0.4446 |
| Albumin | |||||||
| Normal | 93 | 0.515 | 0.257-1.036 | 0.0626 | |||
| ≤LLN | 55 | ||||||
| Bilirubin | |||||||
| Normal | 115 | ||||||
| >ULN | 33 | 2.186 | 1.033-4.627 | 0.0410 * | 1.077 | 0.457–2.538 | 0.8659 |
| Prothrombin time | |||||||
| Prolonged ≤ 4 s | 137 | ||||||
| Prolonged > 4 s | 11 | 2.031 | 0.773–5.340 | 0.1508 | |||
| AST | |||||||
| Normal | 45 | ||||||
| >ULN | 103 | 3.362 | 1.179–9.586 | 0.0233 * | 1.955 | 0.630–6.062 | 0.2458 |
| ALT | |||||||
| Normal | 60 | ||||||
| >ULN | 88 | 1.063 | 0.524-2.154 | 0.8662 | |||
| Creatinine | |||||||
| Normal | 117 | ||||||
| >ULN | 31 | 0.683 | 0.263-1.776 | 0.4346 | |||
Publisher’s Note: MDPI stays neutral with regard to jurisdictional claims in published maps and institutional affiliations. |
© 2021 by the authors. Licensee MDPI, Basel, Switzerland. This article is an open access article distributed under the terms and conditions of the Creative Commons Attribution (CC BY) license (https://creativecommons.org/licenses/by/4.0/).
Share and Cite
Huang, S.-W.; Chen, Y.-C.; Lin, Y.-H.; Yeh, C.-T. Clinical Limitations of Tissue Annexin A2 Level as a Predictor of Postoperative Overall Survival in Patients with Hepatocellular Carcinoma. J. Clin. Med. 2021, 10, 4158. https://doi.org/10.3390/jcm10184158
Huang S-W, Chen Y-C, Lin Y-H, Yeh C-T. Clinical Limitations of Tissue Annexin A2 Level as a Predictor of Postoperative Overall Survival in Patients with Hepatocellular Carcinoma. Journal of Clinical Medicine. 2021; 10(18):4158. https://doi.org/10.3390/jcm10184158
Chicago/Turabian StyleHuang, Shu-Wei, Yen-Chin Chen, Yang-Hsiang Lin, and Chau-Ting Yeh. 2021. "Clinical Limitations of Tissue Annexin A2 Level as a Predictor of Postoperative Overall Survival in Patients with Hepatocellular Carcinoma" Journal of Clinical Medicine 10, no. 18: 4158. https://doi.org/10.3390/jcm10184158
APA StyleHuang, S.-W., Chen, Y.-C., Lin, Y.-H., & Yeh, C.-T. (2021). Clinical Limitations of Tissue Annexin A2 Level as a Predictor of Postoperative Overall Survival in Patients with Hepatocellular Carcinoma. Journal of Clinical Medicine, 10(18), 4158. https://doi.org/10.3390/jcm10184158