Article

High Post-Procedural Transvalvular Gradient or Delayed Mean Gradient Increase after Transcatheter Aortic Valve Implantation: Incidence, Prognosis and Associated Variables. The FRANCE-2 Registry

by
Romain Didier
1,*,
Clément Benic
1,
Bahaa Nasr
1,
Florent Le Ven
1,
Sinda Hannachi
1,
Hélène Eltchaninoff
2,
Edward Koifman
3,
Patrick Donzeau-Gouge
4,
Jean Fajadet
5,
Pascal Leprince
6,
Alain Leguerrier
7,
Michel Lièvre
8,
Alain Prat
9,
Emmanuel Teiger
10,
Thierry Lefevre
4,
Thomas Cuisset
11,
Herve Le Breton
7,
Vincent Auffret
7,
Bernard Iung
12 and
Martine Gilard
1
1
Department of Cardiology, University Hospital of Brest, 29200 Brest, France
2
Cardiology Service, Rouen-Charles-Nicolle University Hospital Center, National Institute of Health and Medical Research U644, 76000 Rouen, France
3
Division of Cardiology, Soroka Medical Center, Beer-Sheva P.O. Box 151, Israel
4
Department of Cardiology and Surgery, Institut Cardiovasculaire Paris Sud, 91300 Massy, France
5
Clinique Pasteur, 31000 Toulouse, France
6
Cardiothoracic Surgery Department, La Pitié-Salpétrière Hospital, 75651 Paris, France
7
Cardiology and Vascular Diseases Service, Pontchaillou University Hospital Center, 35000 Rennes, France
8
Faculty of Medecine Laënnec, University Claude Bernard Lyon, 69000 Lyon, France
9
Cardiologic Hospital, 3 bd du Pr, Leclercq, CEDEX, 59037 Lille, France
10
Department of Cardiology, Henri Mondor University Hospital, Assistance Publique-Hôpitaux de Paris, 94000 Creteil, France
11
Department of Cardiology, La Timone University Hospital Center, Public Assistance Hospitals of Marseille, National Institute of Health and Medical Research UMR 1062, French National Institute for Agricultural Research UMR 1260, University of Aix-Marseille, 13000 Marseille, France
12
Department of Cardiology, University Hospital Department Fire and Paris-Diderot University, Public Assistance Hospitals of Paris, Bichat Hospital, 75013 Paris, France
*
Author to whom correspondence should be addressed.
J. Clin. Med. 2021, 10(15), 3221; https://doi.org/10.3390/jcm10153221
Submission received: 29 June 2021 / Revised: 16 July 2021 / Accepted: 20 July 2021 / Published: 22 July 2021
(This article belongs to the Special Issue New Frontiers in Structural Heart Disease)

Abstract

:
Mean Gradient (MG) elevation can be detected immediately after transcatheter aortic valve implantation (TAVI) or secondarily during follow-up. Comparisons and interactions between these two parameters and their impact on outcomes have not previously been investigated. This study aimed to identify incidence, influence on prognosis, and parameters associated with immediate high post-procedural mean transvalvular gradient (PPMG) and delayed mean gradient increase (6 to 12 months after TAVI, DMGI) in the FRANCE 2 (French Aortic National CoreValve and Edwards 2) registry. The registry includes all consecutive symptomatic patients with severe aortic stenosis who have undergone TAVI. Three groups were analyzed: (1) PPMG < 20 mmHg without DMGI > 10 mmHg (control); (2) PPMG < 20 mmHg with DMGI > 10 mmHg (Group 1); and (3) PPMG ≥ 20 mmHg (Group 2). From January 2010 to January 2012, 4201 consecutive patients were prospectively enrolled in the registry. Controls comprised 2078 patients. In Group 1(n = 131 patients), DMGI exceeded 10 mmHg in 5.6%, and was not associated with greater 4-years mortality than in controls (32.6% vs. 40.1%, p = 0.27). In Group 2 (n = 144 patients), PPMG was at least 20 mmHg in 6.1% and was associated with higher 4-year mortality (48.7% versus 40.1%, p = 0.005). A total of two-thirds of the patients with PPMG ≥ 20 mmHg had MG < 20 mmHg at 1 year, with mortality similar to the controls (39.2% vs. 40.1%, p = 0.73). Patients with PPMG > 20 mmHg 1 year post-TAVI had higher 4-years mortality than the general population of the registry, unlike patients with MG normalization.

1. Introduction

Transcatheter aortic valve implantation (TAVI) is now a well-established alternative to conventional surgical aortic valve replacement (SAVR) in prohibitive, high-risk, and intermediate risk patients with symptomatic aortic valve stenosis [1,2,3,4,5,6]. The extension of indications for TAVI to patients at lower risk is, however, still a matter of debate in patients younger than 75 years of age, despite the last two low-risk randomized studies showing very promising results with the Sapien 3 and Evolute valves [7,8].
In order to standardize the definitions of valve- and patient-oriented durability outcomes and to enable the objective evaluation of existing and novel TAVI prostheses and to compare efficacy versus SAVR, a consensus statement was published by the European Association of Percutaneous Cardiovascular Interventions [9]. Their recommendations to define hemodynamic structural valve deterioration are based on the transprosthetic mean gradient (MG) and aortic regurgitation (AR) severity assessed by echocardiography.
MG elevation can be detected immediately after the procedure or secondarily during the echocardiographic follow-up. The delayed mean transvalvular gradient increase (DMGI) could be more related to valve deterioration, while the immediate post-procedural transprosthetic mean gradient (PPMG) generally represents valve under-expansion, prosthesis patient mismatch, or pressure recovery and high flow. Several studies analyzed incidence and variables associated with immediate PPMG elevation, particularly in valve-in-valve procedures [10,11]. A few also studied long-term gradient progression and the impact on prognosis [12,13]. However, to our knowledge, these two different patterns of elevated gradients after TAVI have not been compared previously.
The aim of the present study was to identify the frequency, determinants, and influence on the prognosis of immediate high PPMG with DMGI in the FRANCE 2 (French Aortic National CoreValve and Edwards 2) registry.

2. Materials and Methods
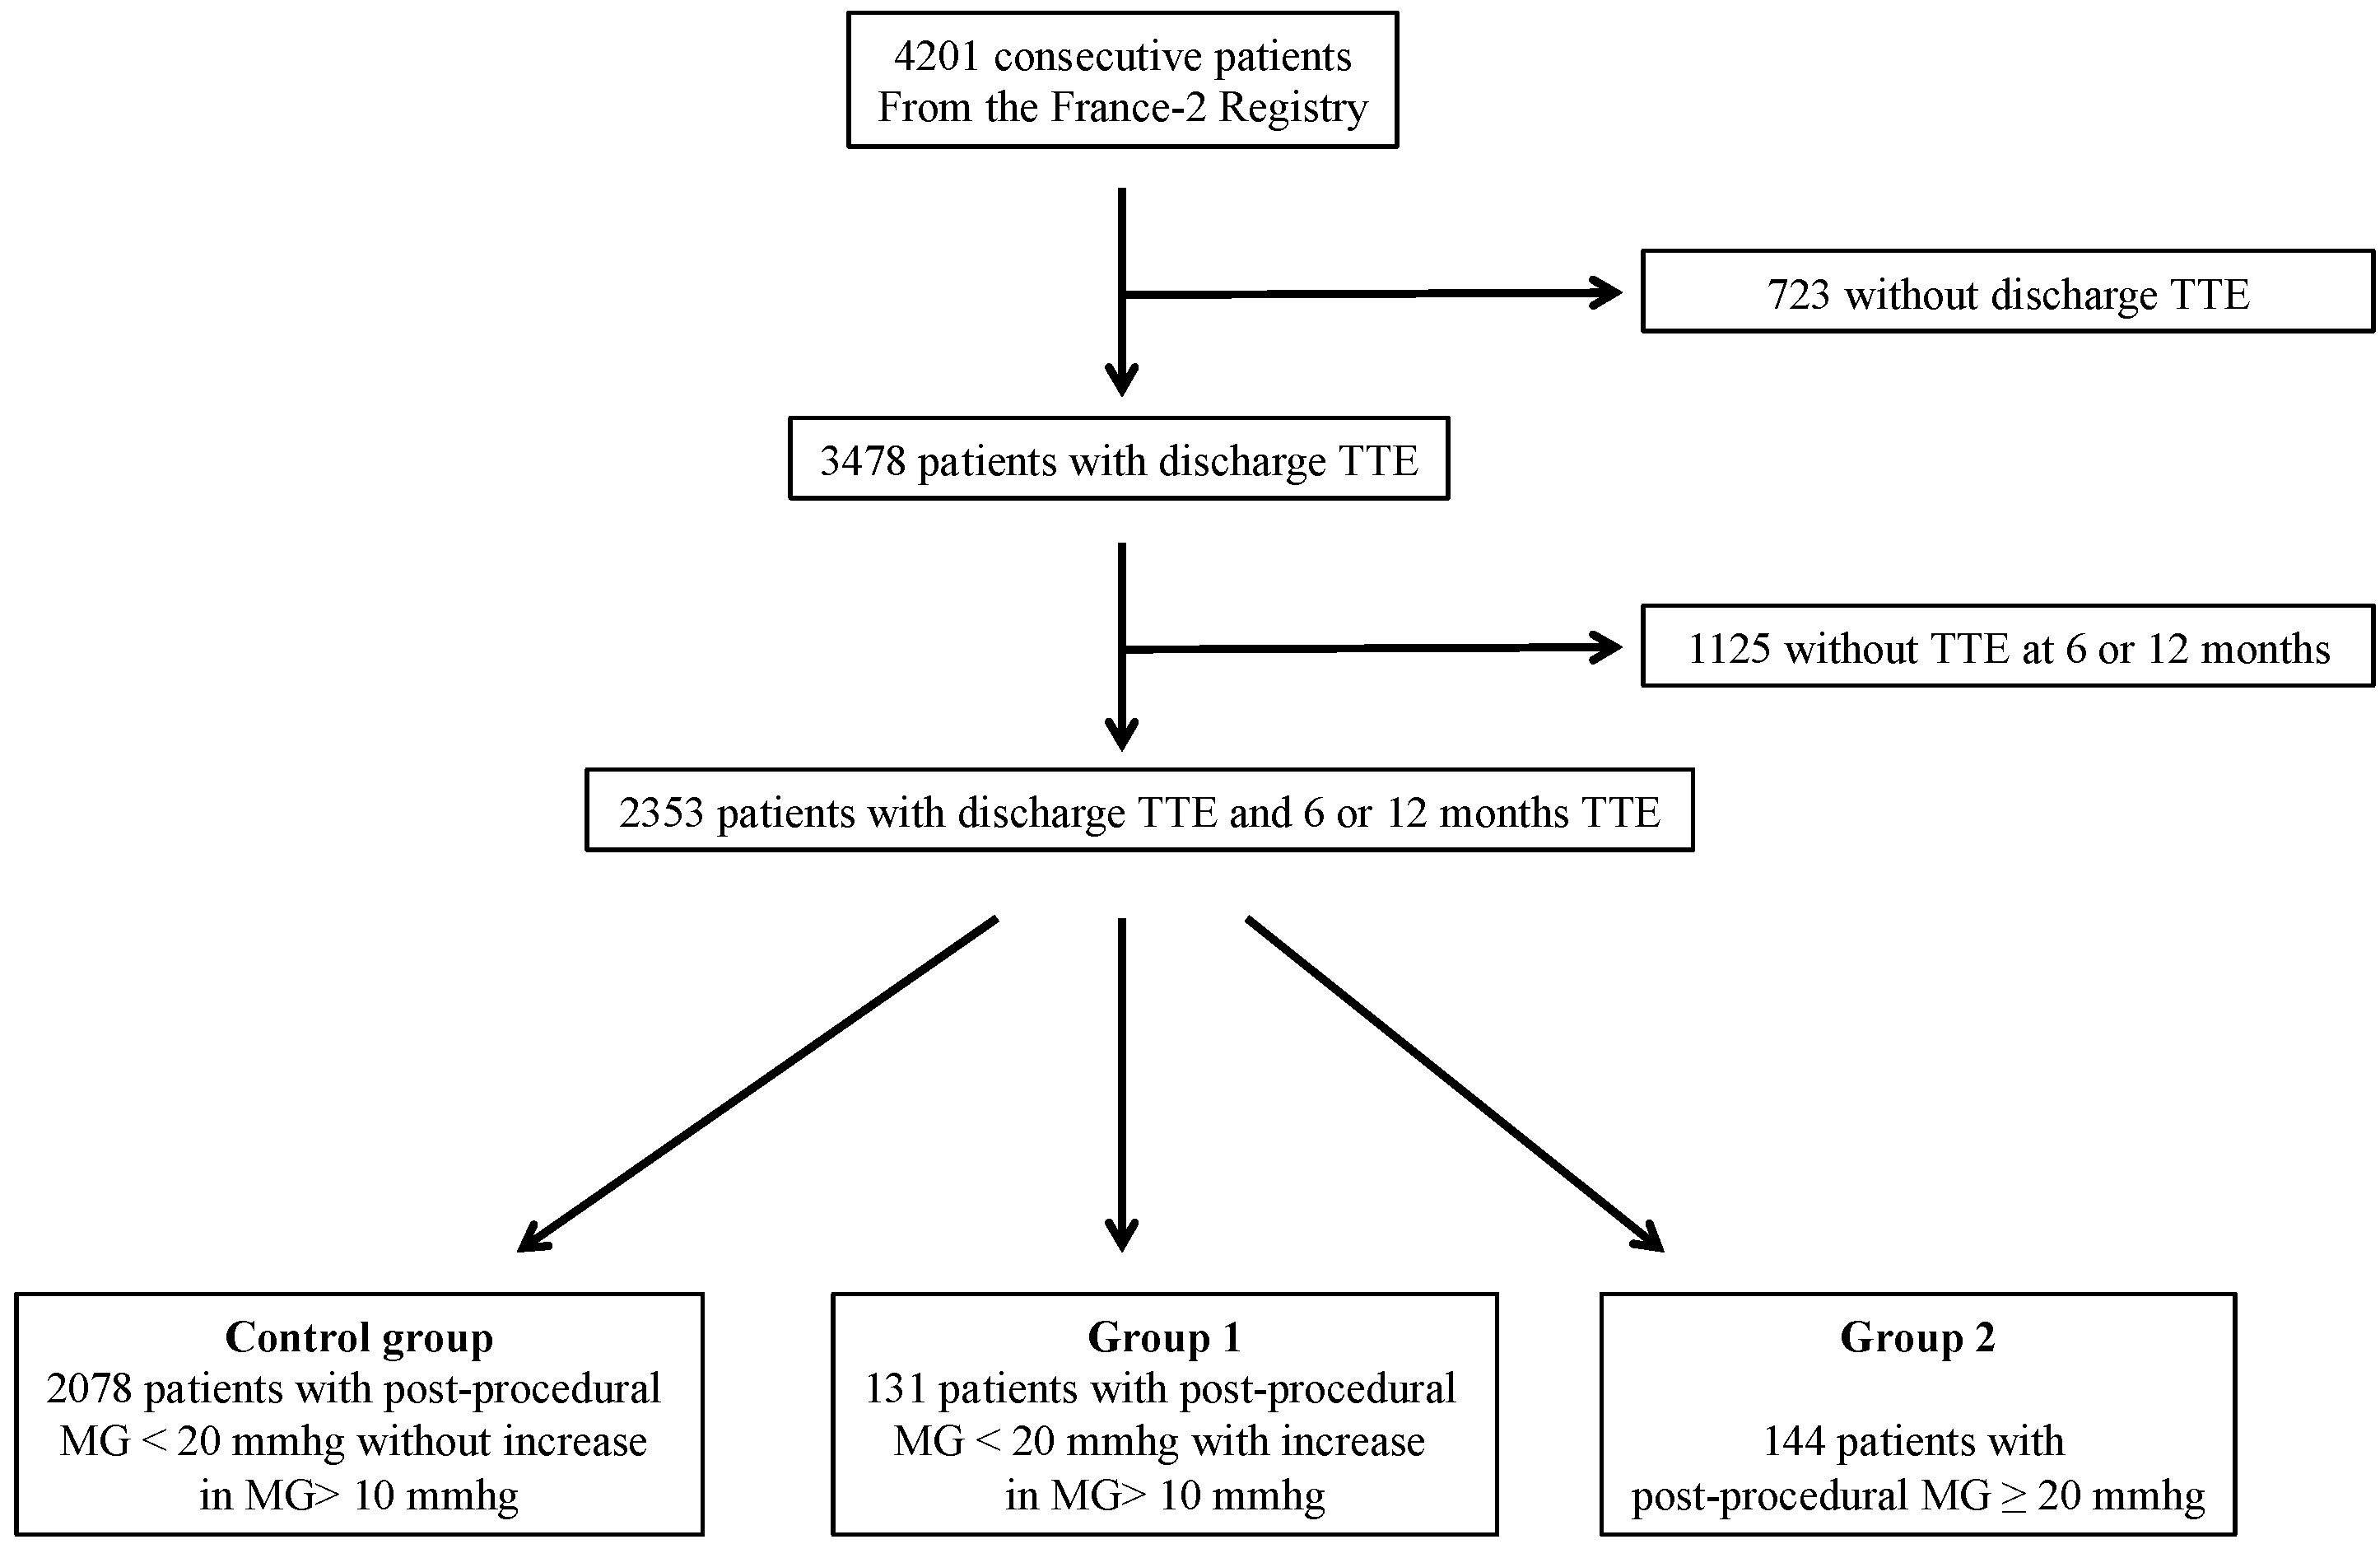
2.1. Population

The design of the FRANCE 2 registry was previously described in the 1-, 3- and 5-year follow-up reports [12,14,15]. Briefly, the registry included all consecutive symptomatic patients (New York Heart Association class >II) with severe aortic stenosis (defined as valve area ≤ 0.8 cm2, mean valve gradient ≥ 40 mm Hg, or peak aortic jet velocity ≥ 4.0 m/s) ineligible for SAVR on heart team evaluation due to coexisting risk features. A total of 34 centers (all 33 French centers and 1 in Monaco) prospectively enrolled all patients undergoing TAVI between January 2010 and January 2012. All patients provided written informed consent for the anonymous processing of their data, and the institutional review board of the French Ministry of Health approved the registry. All patients received either a self-expandable device (CoreValve ReValving System, Medtronic, Minneapolis, MN, USA) or a balloon-expandable device (Edwards SAPIEN or SAPIEN XT prosthesis, Edwards Lifesciences, Irvine, CA, USA). The choice of prosthesis, approach (transfemoral, transapical, or subclavian), and anesthesia (general or local) was at the operator’s discretion. Antithrombotic therapy was left to each individual patient’s team to decide
In the present study, patients without discharge transthoracic echocardiography (TTE) or without 6 or 12 months TTE were excluded from the present analysis. A total of three groups of patients were analyzed: (1) patients with PPMG < 20 mmHg without DMGI > 10 mmHg at 6 or 12 months (control group); (2) patients with PPMG < 20 mmHg and with DMGI > 10 mmHg at 6 or 12 months (Group 1); and finally, (3) patients with PPMG ≥ 20 mmHg at discharge (Group 2).

2.2. Transthoracic Echocardiography (TTE) Evaluation

TTE was performed on the same day as the follow-up visits: before hospital discharge, at 30 days, 6 months, 12 months, and then annually. Valve function was assessed in terms of mean gradient, orifice area, and presence and severity of aortic regurgitation (graded from 0 to 4, with higher grades indicating greater severity). The transprosthetic mean gradient was calculated using the modified Bernoulli formula (∆p = 4 × V2 with v: velocity through aortic valve; mean gradient was calculated by averaging the instantaneous gradients over the ejection period, using the traced velocity curve, and was done by the software directly), and bioprosthesis surface was calculated using the continuity equation (AVA = (A LVOT × VTI LVOT)/VTI AS; with AVA: Aortic Valve Area; A LVOT: Area at left ventricular outflow tract; VTI LVOT: velocity time integral of flow at left ventricular outflow tract; VTI AS: velocity time integral of flow through aortic valve). We chose a mean transprosthetic gradient cut-off at a ≥20 mmHg and ≥10 mmHg change from the post-procedural echocardiography, which corresponded to at least moderate hemodynamic structural valve deterioration according to the consensus statement by the European Association of Percutaneous Cardiovascular Interventions [9]. AR and valve area were not used as a component to define groups 1 and 2.

2.3. Follow-Up and Data Management

According to protocol, visits recording clinical status, events, and echocardiography were planned at 1 month, 6 months, and 1, 2, 3, 4 and 5 years. Data regarding clinical status, complications, and echocardiography were recorded. All adverse events, including mortality, were defined according to VARC (Valve Academic Research Consortium) criteria and were adjudicated by an independent committee. Data were recorded on a standardized electronic case-report form and was sent over the internet to a central database (Axonal). Database quality control was performed by checking data against source documents for 10% of patients in randomly selected centers. All fields were examined for missing data or outliers, and teams were asked to complete or correct data wherever possible. Outlying data were checked and excluded if erroneous; exclusion concerned less than 1% of the data.

2.4. Statistical Analysis

Continuous variables were expressed as mean ± standard deviation or median ± interquartile range according to distribution. Comparison between groups of associated variables used the Student’s t-test, ANOVA or nonparametric tests for continuous variables, and the χ2 test or Fisher’s exact test for categorical variables. Cox proportional univariate analysis was used to identify variables associated with high PPMG or DMGI. Variables with p < 0.10 were selected for multivariate analysis. p-values ≤ 0.05 were considered to indicate statistical significance. Kaplan–Meier survival analysis was used to analyze all-cause mortality and a logrank test was used to compare mortality between the three groups. Comparisons between groups 1 and 2 and the control group were performed using the same Cox model. In the present analysis, due to the very low number of patients remaining in the groups 1 and 2 beyond 4 years, only the 4-year follow-up data were analyzed. All analyses used SAS software, version 9.2 (SAS Institute, Cary, NC, USA).

3. Results

From January 2010 to January 2012, 4201 consecutive patients underwent TAVI and were prospectively enrolled in the FRANCE 2 registry. Before hospital discharge, TTE was performed on 3478 patients. Of them, 2353 patients underwent TTE between the 6th and 12th months following intervention. The majority of patients (2209) had a PPMG < 20 mmHg at discharge. The control group consisted of 2078 patients with PPMG < 20 mmHg without DMGI > 10 mmHg at 12 months. Group 1consisted of 131 patients (5.6%) with PPMG < 20 mmHg and DMGI > 10 mmHg, and finally, Group 2 consisted of 144 patients (6.1%) with a PPMG ≥ 20 mmHg at discharge (Figure 1).
Overall clinical, procedural, and echocardiographic characteristics according to group are summarized in Table 1.

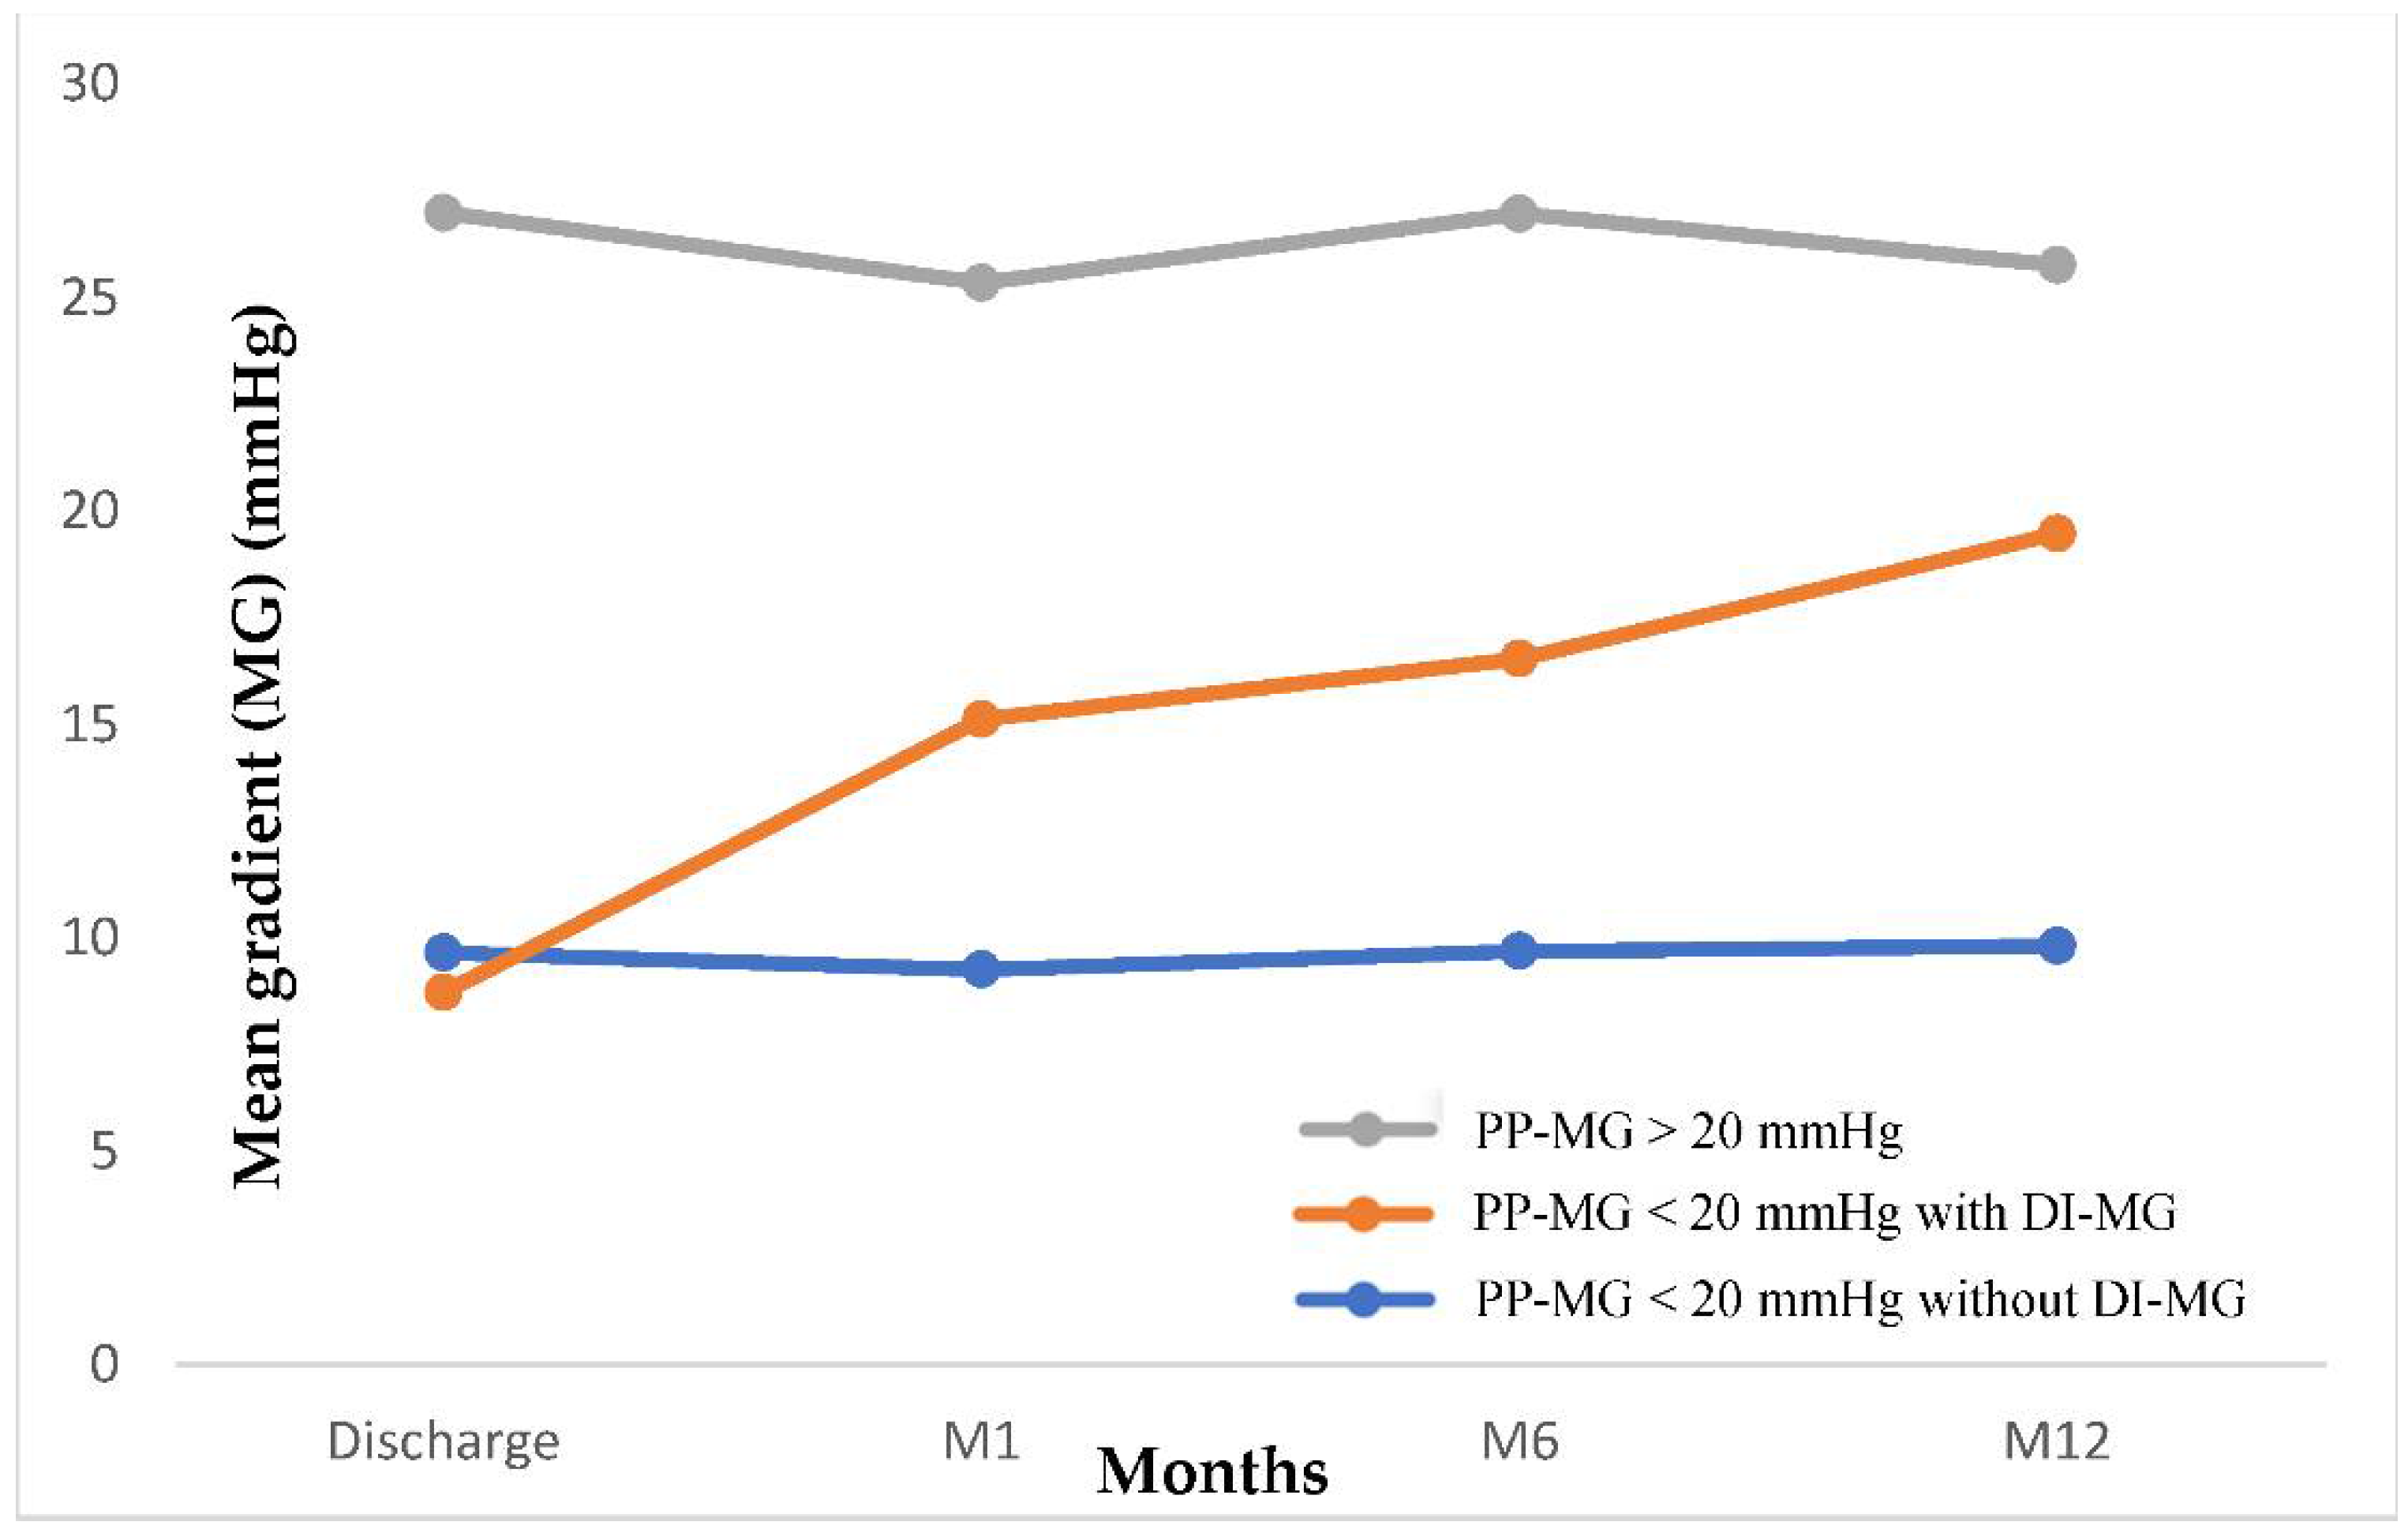
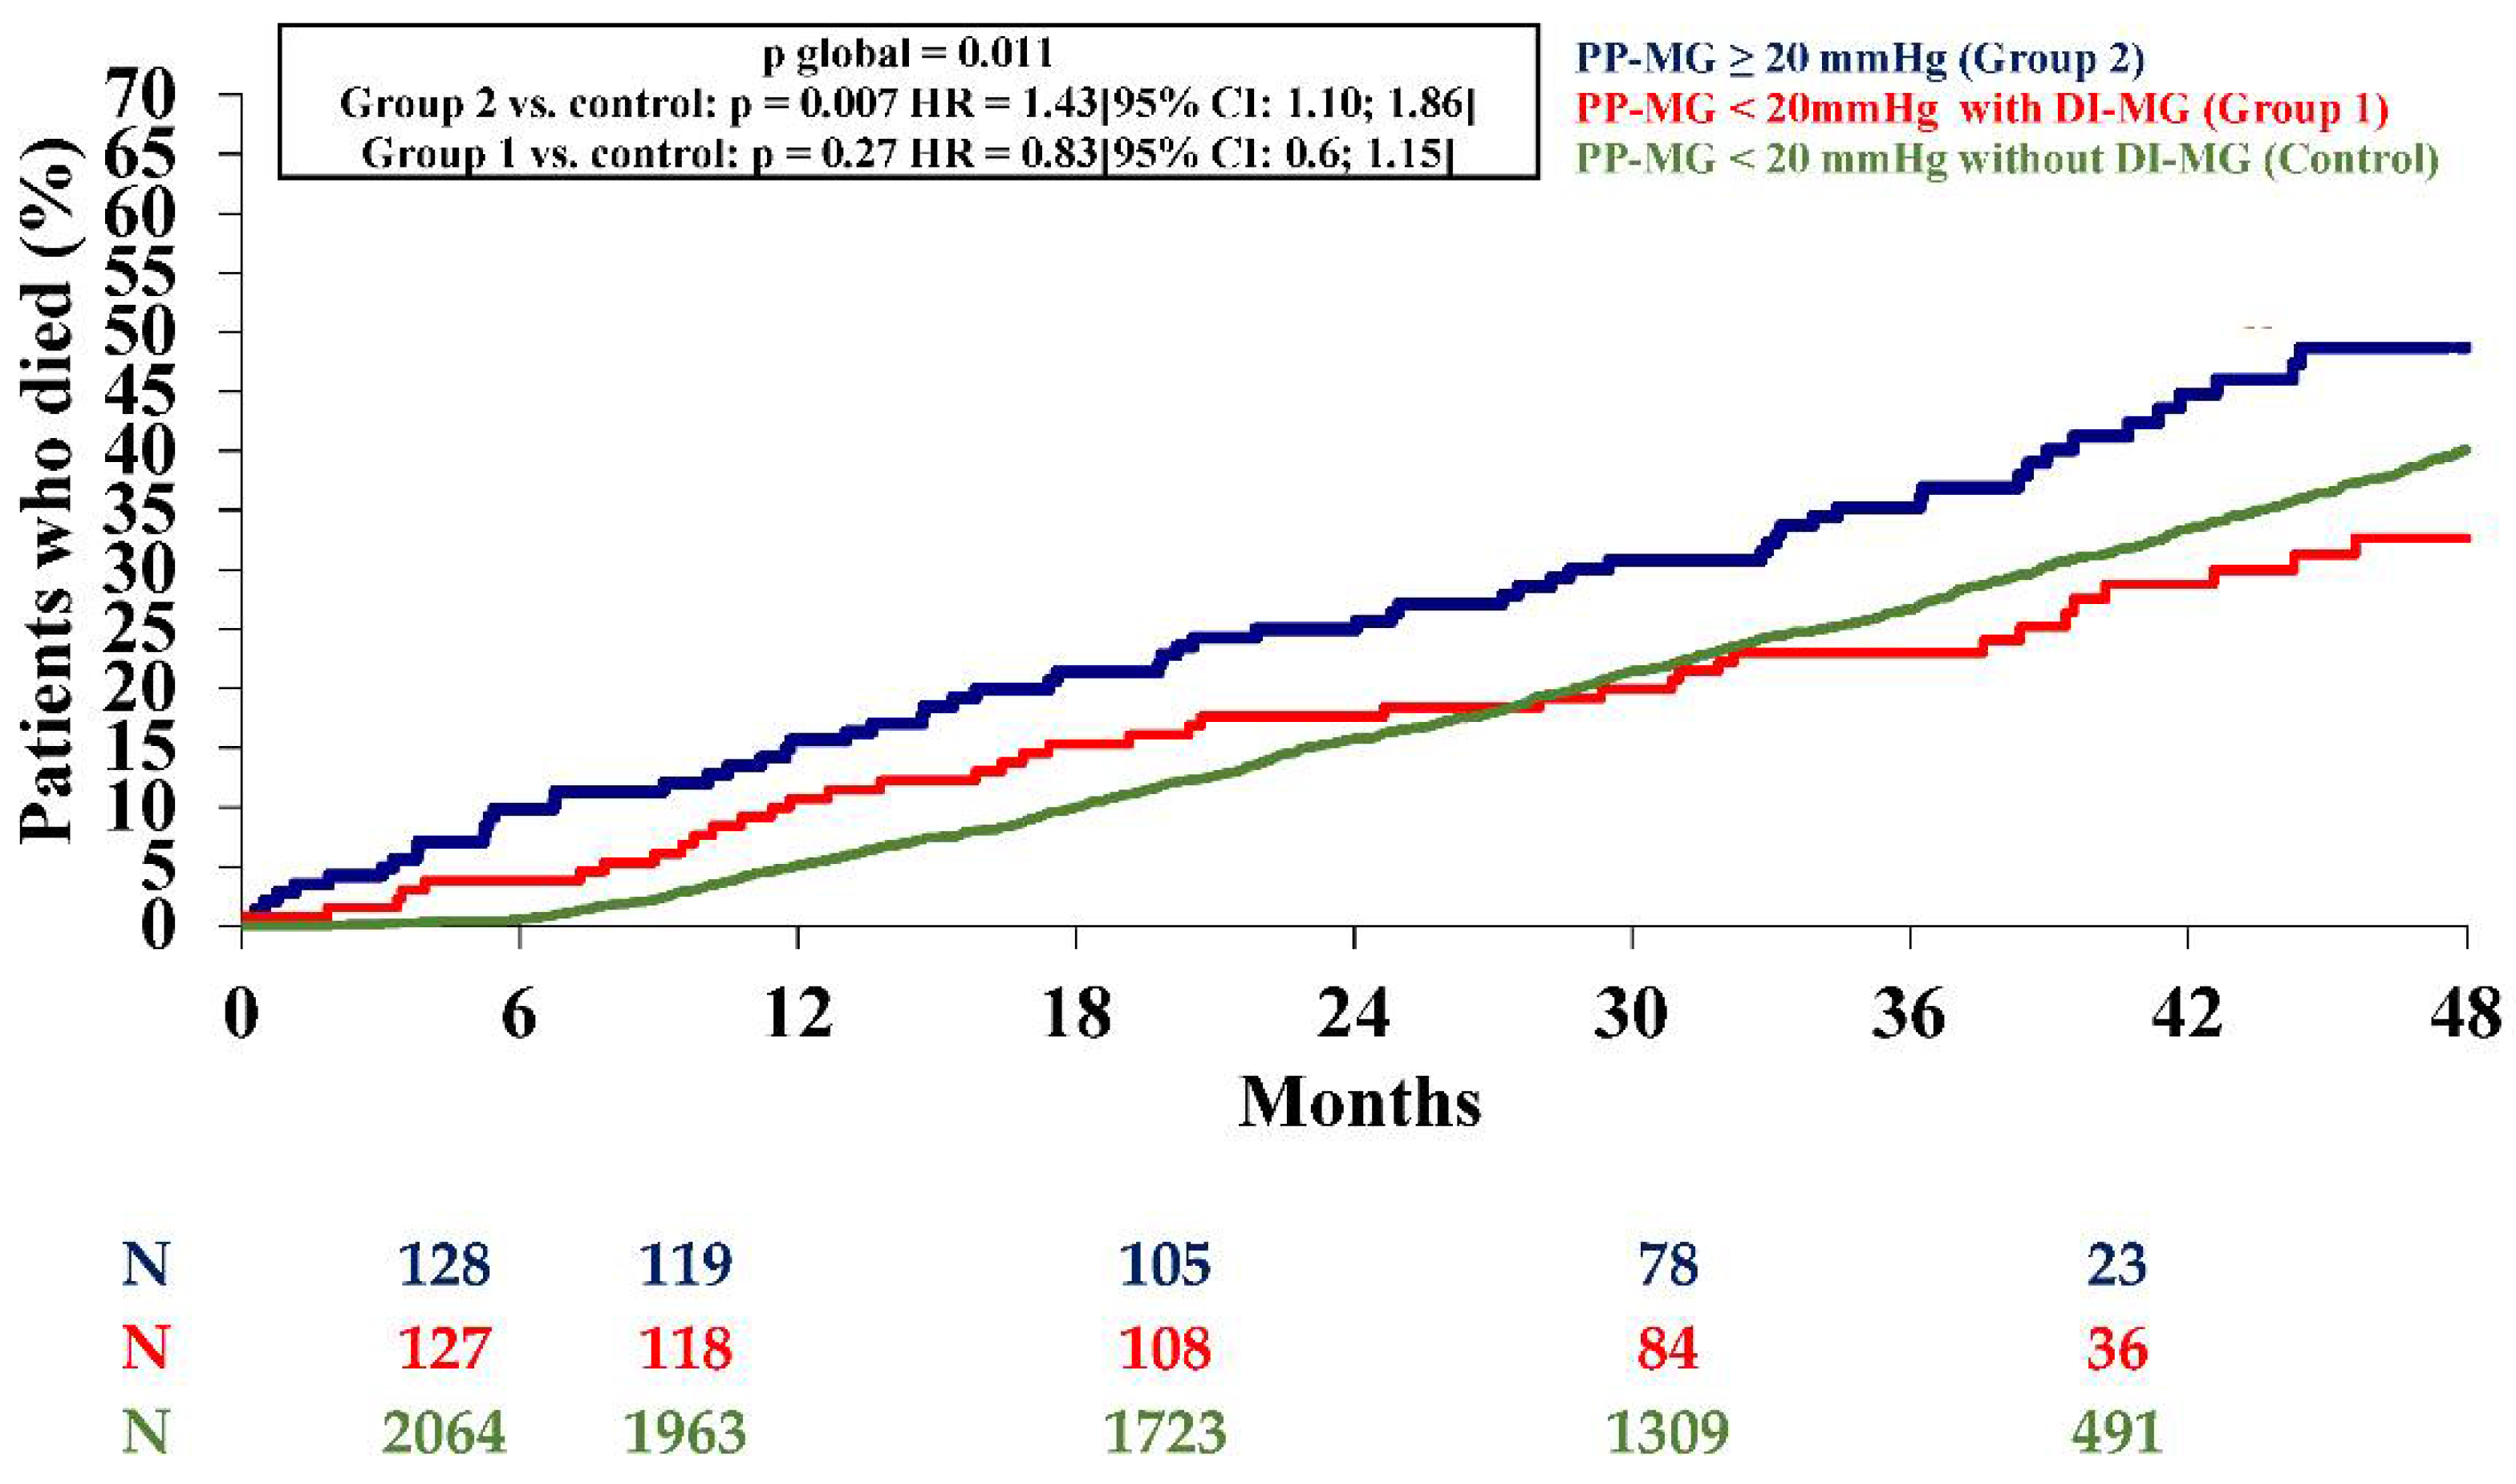
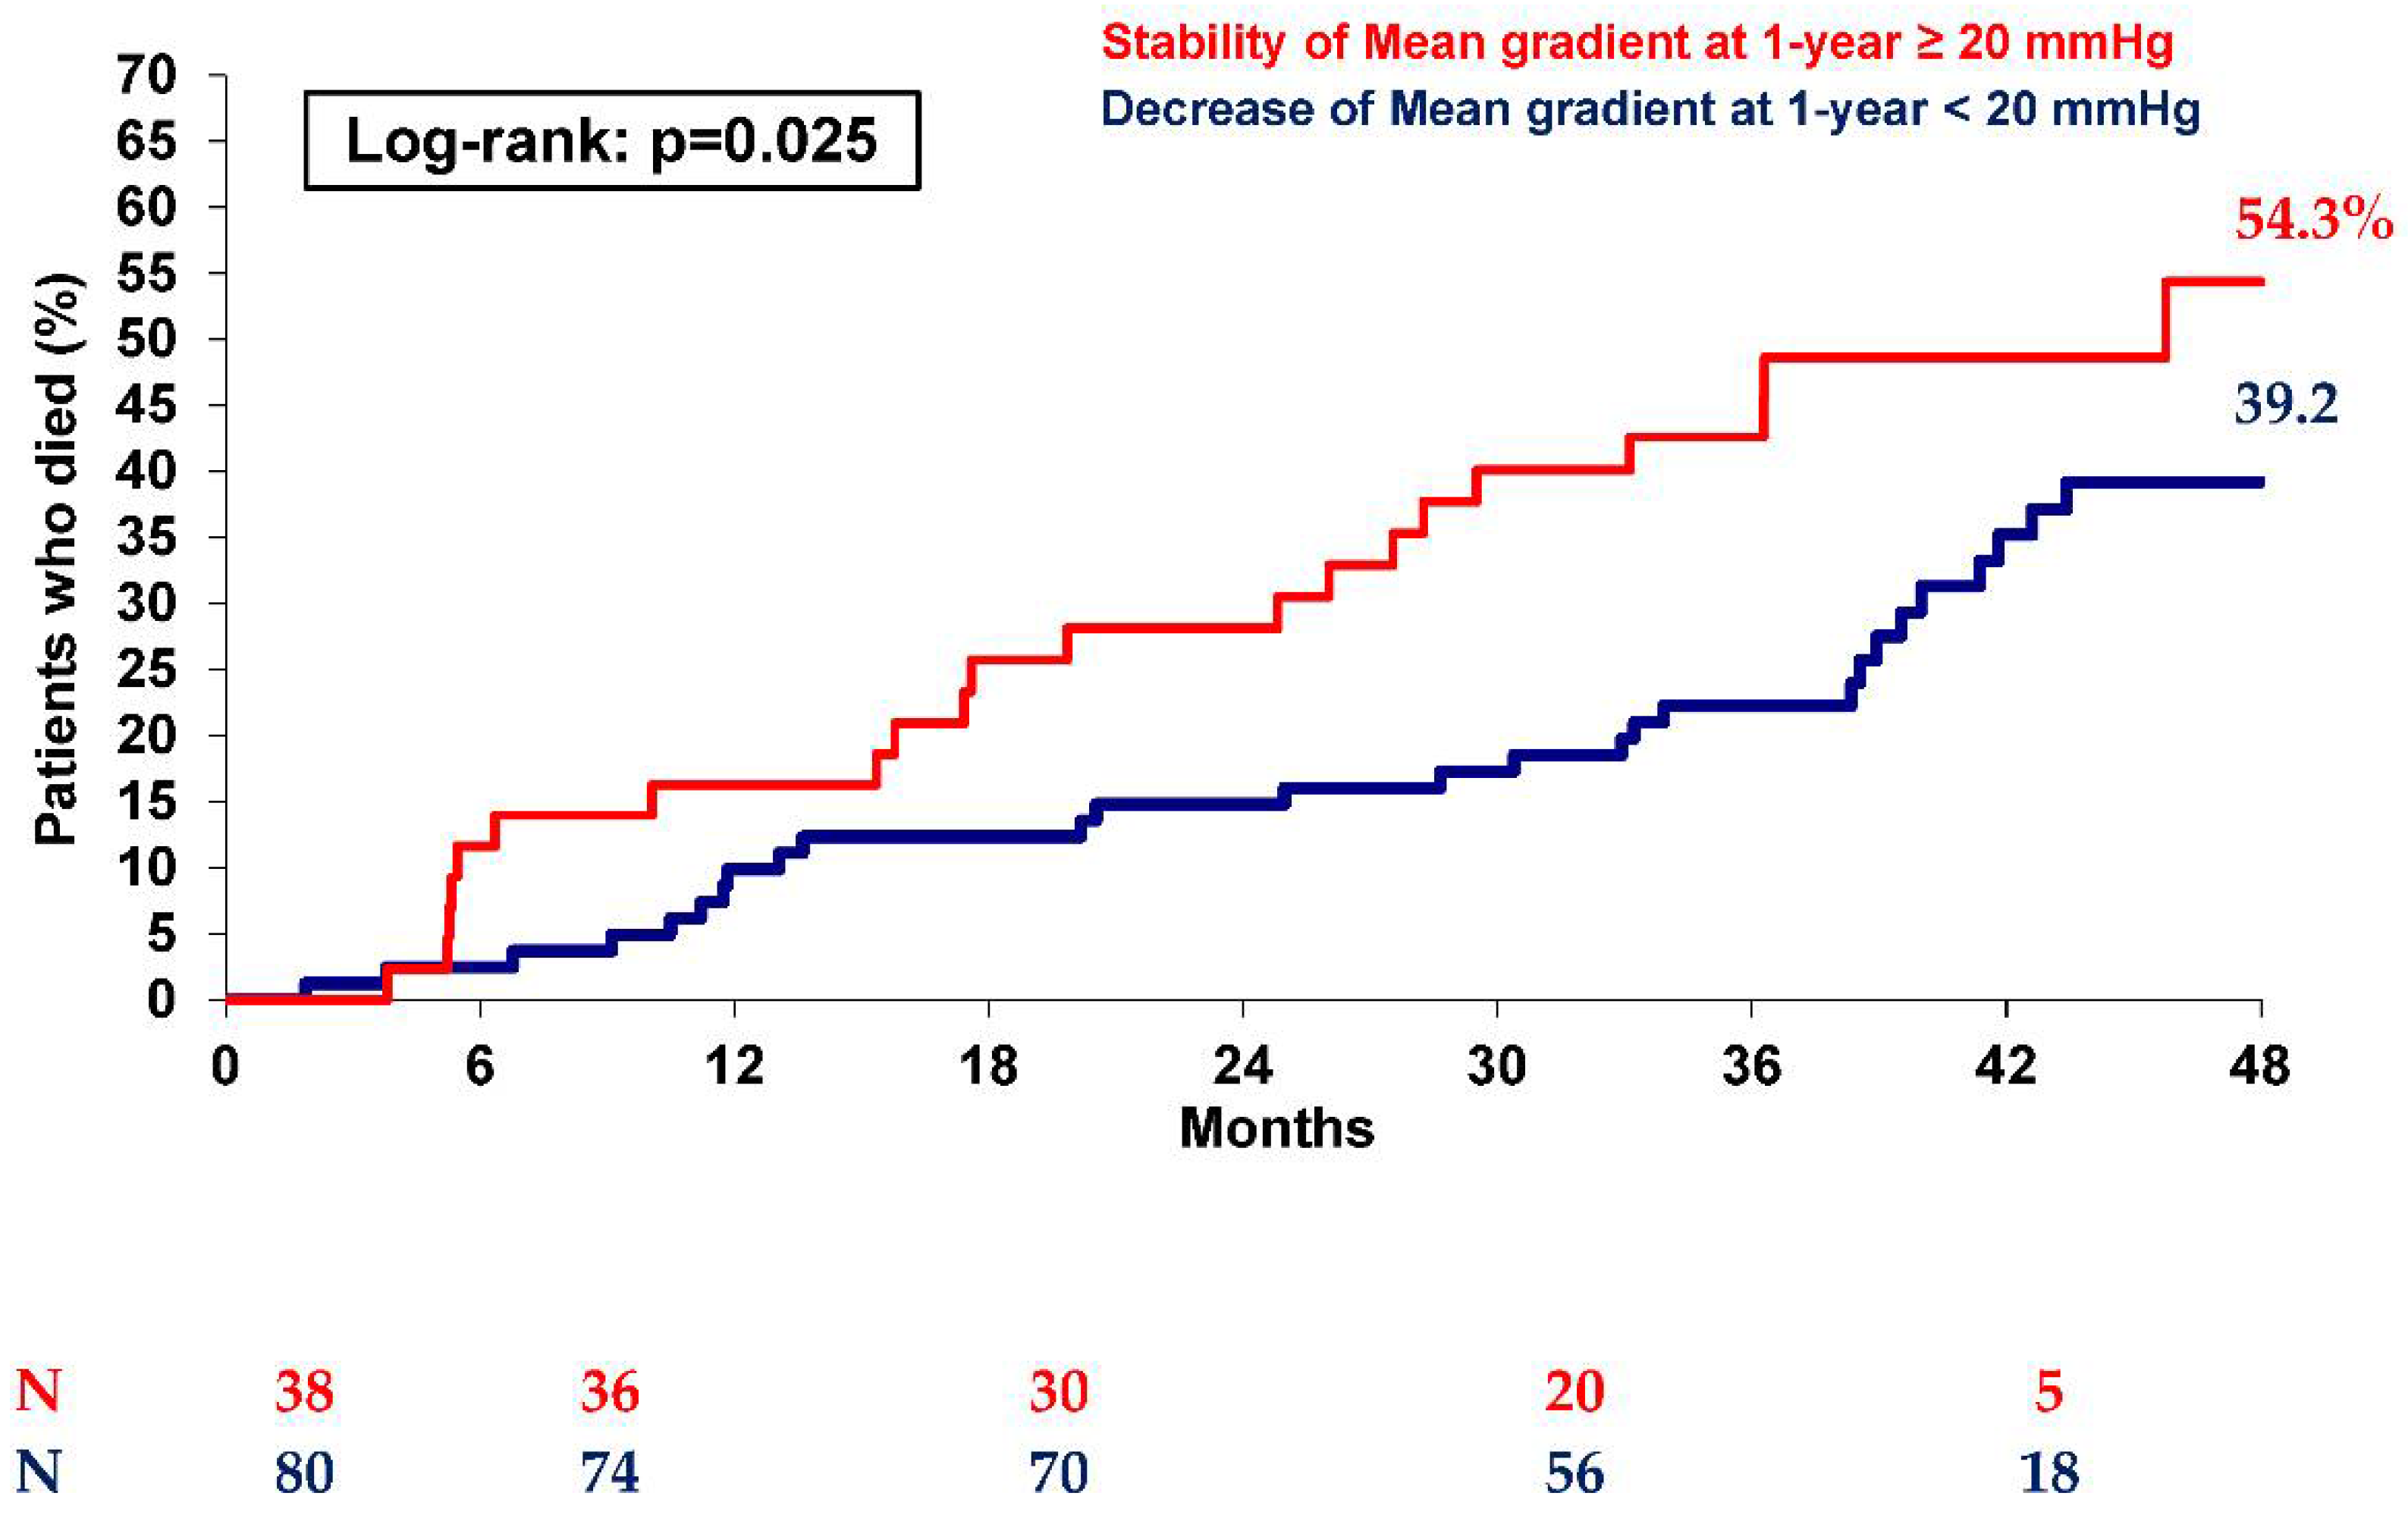
3.1. DMGI in Patients with PPMG < 20 mmHg (Group 1 versus Control Group)

In group 1, the mean gradient increased from 8.7 ± 3.2 mmHg to 19.5 ± 8.1 mmHg during the first year of follow-up (Figure 2). A total of ninety-two patients (70.2%) had a mean gradient between 20 and 30 mmHg, 19 (14.5%) between 30 and 40 mmHg, and 1 patient had mean gradient ≥ 40 mmHg.
Clinical, procedural, and echocardiographic characteristics of the patients in Group 1versus the control group are summarized in Table 1. In comparison to patients without increased mean gradient > 10 mmHg (control group), patients with DMGI had, at baseline, less severe symptoms (p = 0.006), higher blood pressure (p = 0.018), higher left ventricle ejection fraction (LVEF) (p = 0.032), lower mean gradient (p< 0.0001), and more frequent valve-in-valve procedures (p < 0.0001). There was no significant difference in incidence of post-procedural AR between Group 1versus the control (12.1% vs. 14.5%; p = 0.38). At 4 years, incidence of stroke (6.1% vs. 3.5%, p = 0.12) and acute heart failure (23.7% vs. 20.7%, p = 0.42) did not differ between Group 1 and controls. At the 4-year follow-up, there was no significant difference in all-cause mortality according to presence or absence of DMGI in patients with PPMG < 20 mmHg (p = 0.27 with the control group) (Figure 3).
Multivariate analysis of factors associated with DMGI is presented in Table 2. NYHA class I or II (p = 0.0029), absence of high blood pressure (p = 0.029), valve-in-valve procedures (p < 0.0001), valve ≤ 23 mm (p = 0.0019), absence of pre-procedural aspirin treatment (p = 0.04), and lower PPMG (p < 0.0001) were independently associated with the occurrence of DMGI during the first year of follow-up after TAVI.

3.2. Patients with PPMG ≥ 20 mmHg (Group 2 versus Control Group)

Of the patients with elevated PPMG ≥ 20 mmHg (n = 144: 6.1% of the total population with TTE between the 1st and 12th month following intervention), 126 underwent TTE during the following year. Echocardiographic data were missing for 18 patients (lost to follow-up or death).
Overall, PPMG ≥ 20 mmHg was associated with higher 4-year all-cause mortality than the controls (p = 0.007; Figure 3). Incidences of stroke (5.6% vs. 3.8%, p = 0.3) and acute heart failure (24.3% vs. 20.5, p = 0.3) did not differ between Group 2 and the controls. In univariate analysis, patients with PPMG ≥ 20 mmHg were younger (p = 0.004), more often obese (p = 0.004) with more frequent dyslipidemia (p = 0.013), and a lower EuroSCORE (p < 0.0001) compared to the controls (Table 3).
Pre-procedural TTE showed higher LVEF (p = 0.001), higher MG (p < 0.0001), and less frequent pre-operative AR ≥ 2 (p = 0.002). Smaller prostheses were more frequently used than in controls (≤23 mm; p = 0.001), there were more valve-in-valve procedures (p < 0.001), while the incidence of post-procedural AR ≥ 2 did not differ between the 2 groups (18.0 vs. 14.8; p = 0.3). On multivariate analysis (Table 3), younger age (p = 0.007), BMI ≥ 35 kg/m2 (p = 0.01), dyslipidemia (p = 0.01), a lower EuroSCORE (p = 0.0007), a higher pre-procedural mean gradient (p = 0.0003), prosthesis size ≤ 23 mm (p < 0.0001) and valve-in-valve procedures (p < 0.0001) were associated with a high post-procedural mean gradient before discharge.
Interestingly, at 1 year, in the initial 144 patients of Group 2, 83 showed a decrease in MG below 20 mmHg, while 43 patients still showed MG ≥ 20 mmHg. Moreover, at 4 years, as shown in Figure 4, patients with a spontaneous reduction in MG (reaching MG < 20 mmHg during the first year) had lower mortality than those who still showed a mean gradient ≥ 20 mmHg (p = 0.025), with mortality similar to controls (39.2% vs. 40.1%, respectively; p = 0.73). On the other hand, only patients still showing MG > 20 mmHg at 1 year after TAVI had higher 4-year mortality than controls (54.3% vs. 40.1%; p = 0.007).
Table 4 summarizes the peri-procedural characteristics and echocardiographic findings at discharge, 6 months, and 1 year for patients with a high PPMG according to MG progression during the first year of follow-up (MG decrease to <20 mmHg or persistence of MG ≥ 20 mmHg). Notably, at discharge, the indexed aortic valve area was smaller in patients with persisting MG ≥ 20 mmHg than in patients with a decreased gradient (0.67 ± 0.2 vs. 0.90 ± 0.28; p < 0.001).

4. Discussion

The present study reports mid-term clinical and one-year echocardiographic outcomes of patients prospectively included in the FRANCE-2 registry with initial or secondary increase in PPMG, representing the largest cohort of consecutive TAVI patients with available echocardiographic follow-up. The main findings were: (1) DMGI > 10 mmHg was found after discharge at 6 or 12 months in 5.6% of patients and was not associated with higher mortality at 4 years; (2) six variables were associated with DMGI: three clinical conditions (absence of high blood pressure, NYHA class I or II, absence of pre-procedural aspirin treatment), two procedural characteristics (smaller valve size, valve-in-valve procedures), and one echocardiographic parameter (lower PPMG); (3) PPMG ≥ 20 mmHg at discharge was identified in 6.1% of the total registry population and was associated with higher all-cause mortality at 4 years (48.7% versus 40.1%; p = 0.005); (4) two-thirds of patients with PPMG ≥ 20 mmHg at discharge showed a less than 20 mmHg decrease at 1 year and had all-cause mortality consistent with the control population as a whole; (5) four clinical variables (younger age, BMI ≥ 35 kg/m2, dyslipidemia, lower EuroSCORE), two procedural variables (prosthesis size ≤ 23 mm, valve-in-valve procedure) and one echocardiographic parameter (higher pre-procedural mean gradient) were independently associated with a higher PPGM; (6) incidence of AR ≥ 2 was similar in all 3 groups.

4.1. DMGI in Patients with PPMG < 20 mmHg

These patients had good post-procedural TAVI results with a secondary increase in MG, possibly indicating rapid structural deterioration of the valve. In line with previous reports, this secondary increase in MG after TAVI did not seem to be associated with excess early or medium-term mortality [16,17]. Moreover, no difference was found in terms of the incidence of stroke or heart failure. Consistent with the literature, smaller valve and valve-in-valve procedures were associated with early structural valve deterioration [17,18,19]. Interestingly, in the present analysis, pre-procedural aspirin treatment was associated with lower incidence of DMGI, while clopidogrel and anticoagulation treatment were not.

4.2. Patients with PPMG ≥ 20 mmHg

Two-thirds of patients with PPMG ≥ 20 mmHg after TAVI (66%) recovered MG < 20 mmHg at 1 year. Only those with persistent MG > 20 mmHg at 1 year after TAVI had higher 4-year mortality than the controls (54.3% vs. 40.1%; p = 0.007), while patients with MG normalization had similar mortality to the controls (39.2% vs. 40.1%; p = 0.73). It could be argued that this sub-group of patients with a decrease of MG < 20 mmHg over the first year did not have valve under-expansion but rather transient hyperflow through the aortic valve due to left ventricular hypertrophy, which spontaneously regressed at 6 months after potential remodeling of the left ventricle. Brian et al. suggest that early regression of left ventricular hypertrophy can be observed up to 6 months after TAVI [20]. In contrast, the patients with persistent MG ≥ 20 mmHg at 1 year probably have poor valve expansion (highly calcified aortic valve) or limited expansion (more valve-in-valve procedures; 30.2% for patients with persistent MG ≥ 20 mmHg vs. 1.2% for patients with a decrease in MG < 20 mmHg, p < 0.001). Nevertheless, in daily practice, reaching optimal valve expansion at the end of a procedure is a major factor in reducing mortality; however, MG > 20 mmHg should not lead to systematic balloon post-dilatation since it does not necessarily correspond to the under-expansion of the valve, but possibly to transient hyperflow. Inadequate implant apposition can also lead to a mean gradient greater than 20 mmHg and can be reduced by the appropriate choice of prosthesis and the use of pre- and post-dilation to decrease the final gradient. During in-hospital ultrasound evaluation, in the case of MG > 20 mmHg, a CT-scan could be proposed to analyze valve deployment in greater depth, with repeated transthoracic ultrasound evaluation at 6 months and 1 year to assess MG progression. If under-expansion is identified on the CT-scan, additional post-dilation can be discussed to improve the mean valve gradient, which has an impact on the patient’s long-term prognosis.

4.3. Limitations

This study had limitations that need to be taken into consideration. First, the low number of patients remaining in Groups 1 and 2 after 4 years did not allow statistical analysis after that date. However, the FRANCE-2 population tends to have particularly high-risk baseline profiles, and the number of surviving patients falls rapidly over time. Second, the lack of systematic post-procedural CT-scans to evaluate percutaneous prosthetic valve expansion could also constitute a limitation, but this additional examination is not part of standard of care. A CT-scan could have also been interesting to search for the presence of subclinical leaflet thrombosis after implantation. In fact, the mean gradient in general is higher in patients with post-operative thrombosis and may be a risk for accelerated valve degeneration, and therefore an indication of an early gradient increase. Third, the lack of systematic core laboratory evaluation for echocardiographic assessment was another limitation, notably with no formal identification of the mechanism of transient hyperflow through the aortic valve for patients in Group 2 with an MG decrease below 20 mmHg. Finally, the present analysis includes only the earlier generation of percutaneous aortic valves, and it would be interesting to validate the findings with the latest generation of valves.

5. Conclusions

DMGI during the year after TAVI in patients with initial PPMG < 20 mmHg was mostly seen in small percutaneous valve and valve-in-valve procedures and was not associated with a significant increase in 4-year mortality. In contrast, patients with persistent PPMG > 20 mmHg at 1 year after TAVI had higher 4-year mortality than the control FRANCE 2 registry population in contrast to patients with MG normalization.

Author Contributions

All authors listed have made a substantial, direct, and intellectual contribution to the work and approved it for publication. All authors have read and agreed to the published version of the manuscript.

Funding

Edwards Lifesciences and Medtronic partly funded the FRANCE TAVR registry. Edwards Lifesciences and Medtronic had no role in data management, data analysis, or writing of the manuscript.

Institutional Review Board Statement

The study was conducted according to the guidelines of the Declaration of Helsinki and approved by the French Ministry of Health.

Informed Consent Statement

Informed consent was obtained from all subjects involved in the study. Written informed consent has been obtained from the patients to publish this paper.

Data Availability Statement

The data will be not available online.

Conflicts of Interest

The authors declare no conflict of interest.

References

  1. Mack, M.J.; Leon, M.B.; Smith, C.R.; Miller, D.C.; Moses, J.W.; Tuzcu, E.M.; Webb, J.G.; Douglas, P.S.; Anderson, W.N.; Blackstone, E.H.; et al. 5-year outcomes of transcatheter aortic valve replacement or surgical aortic valve re-placement for high surgical risk patients with aortic stenosis (PARTNER 1): A randomised controlled trial. Lancet 2015, 385, 2477–2484. [Google Scholar] [CrossRef]
  2. Deeb, G.M.; Reardon, M.J.; Chetcuti, S.; Patel, H.J.; Grossman, P.M.; Yakubov, S.J.; Kleiman, N.S.; Coselli, J.S.; Gleason, T.G.; Lee, J.S.; et al. 3-Year Outcomes in High-Risk Patients Who Underwent Surgical or Transcatheter Aortic Valve Replacement. J. Am. Coll. Cardiol. 2016, 67, 2565–2574. [Google Scholar] [CrossRef]
  3. Leon, M.B.; Smith, C.R.; Mack, M.J.; Makkar, R.R.; Svensson, L.G.; Kodali, S.K.; Thourani, V.H.; Tuzcu, E.M.; Miller, D.C.; Herrmann, H.C.; et al. Transcatheter or Surgical Aortic-Valve Replacement in Intermediate-Risk Patients. N. Engl. J. Med. 2016, 374, 1609–1620. [Google Scholar] [CrossRef]
  4. Adams, D.H.; Popma, J.J.; Reardon, M.J.; Yakubov, S.J.; Coselli, J.S.; Deeb, G.M.; Gleason, T.G.; Buchbinder, M.; Hermiller, J., Jr.; Kleiman, N.S.; et al. Transcatheter Aortic-Valve Replacement with a Self-Expanding Prosthesis. N. Engl. J. Med. 2014, 370, 1790–1798. [Google Scholar] [CrossRef] [PubMed] [Green Version]
  5. Baumgartner, H.; Falk, V.; Bax, J.J.; De Bonis, M.; Hamm, C.; Holm, P.J.; Iung, B.; Lancellotti, P.; Lansac, E.; Muñoz, D.R.; et al. 2017 ESC/EACTS Guidelines for the management of valvular heart disease. Eur. Heart J. 2017, 38, 2739–2791. [Google Scholar] [CrossRef] [PubMed]
  6. Yancy, C.W.; Jessup, M.; Bozkurt, B.; Butler, J.; Casey, D.E., Jr.; Colvin, M.M.; Drazner, M.H.; Filippatos, G.S.; Fonarow, G.C.; Givertz, M.M.; et al. 2017 ACC/AHA/HFSA Focused Update of the 2013 ACCF/AHA Guideline for the Management of Heart Failure: A Report of the American College of Cardiology/American Heart Association Task Force on Clinical Practice Guidelines and the Heart Failure Society of America. J. Am. Coll. Cardiol. 2017, 136, e137–e161. [Google Scholar] [CrossRef]
  7. Mack, M.J.; Leon, M.B.; Thourani, V.H.; Makkar, R.; Kodali, S.K.; Russo, M.; Kapadia, S.R.; Malaisrie, S.C.; Cohen, D.J.; Pibarot, P.; et al. Transcatheter Aortic-Valve Replacement with a Balloon-Expandable Valve in Low-Risk Patients. N. Engl. J. Med. 2019, 380, 1695–1705. [Google Scholar] [CrossRef] [PubMed]
  8. Popma, J.J.; Deeb, G.M.; Yakubov, S.J.; Mumtaz, M.; Gada, H.; O’Hair, D.; Bajwa, T.; Heiser, J.C.; Merhi, W.; Kleiman, N.S.; et al. Transcatheter Aortic-Valve Replacement with a Self-Expanding Valve in Low-Risk Patients. N. Engl. J. Med. 2019, 380, 1706–1715. [Google Scholar] [CrossRef] [PubMed]
  9. Capodanno, D.; Petronio, A.S.; Prendergast, B.; Eltchaninoff, H.; Vahanian, A.; Modine, T.; Lancellotti, P.; Sondergaard, L.; Ludman, P.F.; Tamburino, C.; et al. Standardized definitions of structural deterioration and valve failure in assessing long-term durability of transcatheter and surgical aortic bioprosthetic valves: A consensus statement from the Euro-pean Association of Percutaneous Cardiovascular Interventions (EAPCI) endorsed by the European Society of Cardiology (ESC) and the European Association for Cardio-Thoracic Surgery (EACTS). Eur. Heart J. 2017, 38, 3382–3390. [Google Scholar] [PubMed] [Green Version]
  10. Del Trigo, M.; Muñoz-Garcia, A.J.; Wijeysundera, H.C.; Nombela-Franco, L.; Cheema, A.N.; Gutierrez, E.; Serra, V.; Kefer, J.; Amat-Santos, I.J.; Benitez, L.M.; et al. Incidence, Timing, and Predictors of Valve Hemodynamic Deterio-ration After Transcatheter Aortic Valve Replacement: Multicenter Registry. J. Am. Coll. Cardiol. 2016, 67, 644–655. [Google Scholar] [CrossRef] [PubMed]
  11. Vemulapalli, S.; Holmes, D.R.; Dai, D.; Matsouaka, R.; Mack, M.J.; Grover, F.L.; Makkar, R.R.; Thourani, V.H.; Douglas, P.S. Valve hemodynamic deterioration and cardiovascular outcomes in TAVR: A report from the STS/ACC TVT Registry. Am. Heart J. 2018, 195, 1–13. [Google Scholar] [CrossRef] [PubMed]
  12. Didier, R.; Eltchaninoff, H.; Donzeau-Gouge, P.; Chevreul, K.; Fajadet, J.; Leprince, P.; Leguerrier, A.; Lièvre, M.; Prat, A.; Teiger, E.; et al. Five-Year Clinical Outcome and Valve Durability after Transcatheter Aortic Valve Replacement in High-Risk Patients. Circulation 2018, 138, 2597–2607. [Google Scholar] [CrossRef] [PubMed]
  13. Blackman, D.J.; Saraf, S.; MacCarthy, P.A.; Myat, A.; Anderson, S.G.; Malkin, C.J.; Cunnington, M.S.; Somers, K.; Brennan, P.; Manoharan, G.; et al. Long-Term Durability of Transcatheter Aortic Valve Prostheses. J. Am. Coll. Cardiol. 2019, 73, 537–545. [Google Scholar] [CrossRef] [PubMed]
  14. Gilard, M.; Eltchaninoff, H.; Iung, B.; Donzeau-Gouge, P.; Chevreul, K.; Fajadet, J.; Leprince, P.; Leguerrier, A.; Lievre, M.; Prat, A.; et al. Registry of Transcatheter Aortic-Valve Implantation in High-Risk Patients. N. Engl. J. Med. 2012, 366, 1705–1715. [Google Scholar] [CrossRef] [PubMed]
  15. Gilard, M.; Eltchaninoff, H.; Donzeau-Gouge, P.; Chevreul, K.; Fajadet, J.; Leprince, P.; Leguerrier, A.; Lievre, M.; Prat, A.; Teiger, E.; et al. Late Outcomes of Transcatheter Aortic Valve Replacement in High-Risk Patients: The FRANCE-2 Registry. J. Am. Coll. Cardiol. 2016, 68, 1637–1647. [Google Scholar] [CrossRef] [PubMed]
  16. Mooney, J.; Sellers, S.L.; Blanke, P.; Pibarot, P.; Hahn, R.T.; Dvir, D.; Douglas, P.S.; Weissman, N.J.; Kodali, S.K.; Thourani, V.H.; et al. CT-Defined Prosthesis–Patient Mismatch Downgrades Frequency and Severity, and Demonstrates No Association With Adverse Outcomes After Transcatheter Aortic Valve Replacement. JACC: Cardiovasc. Interv. 2017, 10, 1578–1587. [Google Scholar] [CrossRef] [PubMed]
  17. Pibarot, P.; Weissman, N.J.; Stewart, W.J.; Hahn, R.T.; Lindman, B.R.; McAndrew, T.; Kodali, S.K.; Mack, M.J.; Thourani, V.H.; Craig Miller, D.; et al. Incidence and sequelae of prosthesis-patient mismatch in transcatheter versus surgical valve replacement in high-risk patients with severe aortic stenosis: A PARTNER trial cohort—A analysis. J. Am. Coll. Cardiol. 2014, 64, 1323–1334. [Google Scholar] [CrossRef] [PubMed] [Green Version]
  18. Pibarot, P.; Simonato, M.; Barbanti, M.; Linke, A.; Kornowski, R.; Rudolph, T.; Spence, M.; Moat, N.; Aldea, G.; Mennuni, M.; et al. Impact of Pre-Existing Prosthesis-Patient Mismatch on Survival Following Aor-tic Valve-in-Valve Procedures. JACC Cardiovasc. Interv. 2018, 11, 133–141. [Google Scholar] [CrossRef] [PubMed]
  19. Durand, E.; Sokoloff, A.; Urena-Alcazar, M.; Chevalier, B.; Chassaing, S.; Didier, R.; Tron, C.; Litzler, P.-Y.; Bouleti, C.; Himbert, D.; et al. Assessment of Long-Term Structural Deterioration of Transcatheter Aortic Bioprosthetic Valves Using the New European Definition. Circ. Cardiovasc. Interv. 2019, 12, e007597. [Google Scholar] [CrossRef] [PubMed]
  20. Lindman, B.R.; Stewart, W.J.; Pibarot, P.; Hahn, R.T.; Otto, C.M.; Xu, K.; Devereux, R.B.; Weissman, N.J.; Enriquez-Sarano, M.; Szeto, W.Y.; et al. Early Regression of Severe Left Ventricular Hypertrophy After Transcatheter Aortic Valve Replacement Is Associated with Decreased Hospitalizations. JACC Cardiovasc. Interv. 2014, 7, 662–673. [Google Scholar] [CrossRef] [PubMed] [Green Version]
Figure 1. Flow chart. TTE: transthoracic echocardiography; MG: Mean Gradient.
Jcm 10 03221 g001
Figure 2. Evolution of aortic MG over time in patients with post procedural MG < 20 mmHg according to the occurrence of delayed increase in MG or not, and in patients with post procedural MG > 20 mmHg. DI-MG: Delayed increase in mean gradient; M: Month; PP-MG: Post-procedural mean gradient.
Jcm 10 03221 g002
Figure 3. Kaplan–Meier mortality curves at 2-years from patients with post-procedural mean gradient < 20 mmHg without delayed increase in mean gradient (Control) or with delayed increase in mean gradient (Group 1) and with post-procedural mean gradient ≥ 20 mmHg (Group 2). DI-MG: delayed increase in mean gradient; M: month; PP-MG: post-procedural mean gradient.
Jcm 10 03221 g003
Figure 4. Kaplan–Meier mortality curves at 2 years of patients with post-procedural mean gradient ≥ 20 mmHg (Group 2) according to the evolution of the mean gradient at 1-year (stability or decrease).
Jcm 10 03221 g004
Table 1. Baseline, procedural, and echocardiographical characteristics.
PP-MG < 20 mmHg without DIMG (Control) n = 2078PP-MG < 20 mmHg with DIMG (Group 1) n = 131PP-MG ≥ 20 mmHg
(Group 2) n = 144
p-Value
Age (year)82.6 ± 7.282.2 ± 6.980.5 ± 9.30.038
Male sex1033/2078 (49.7%)66/131 (50.4%)69/144 (47.9%)0.903
Body mass index (kg/m2)26.21 ± 5.0026.44 ± 4.9326.66 ± 5.720.752
NYHA, III or IV1559/2078 (75.0%)84/131 (64.1%)104/144 (72.2%)
Syncope141/2071 (6.8%)8/131 (6.1%)10/142 (7.0%)0.946
Angina347/2071 (16.8%)14/131 (10.7%)21/142 (14.8%)0.167
Hypertension1439/2071 (69.5%)78/131 (59.9%)113/142 (79.6%)0.020
Diabetes533/2071 (25.7%)29/131 (22.1%)29/142 (20.4%)0.261
Dyslipidaemia1023/2071 (49.4%)55/131 (42%)83/142 (58.5%)0.023
Active smoking67/2071 (3.2%)1/131 (0.8%)7/142 (4.9%)0.126
Coronary artery disease958/2029 (47.2%)56/129 (43.4%)55/138 (39.9%)0.187
Previous CABG386/2071 (18.6%)26/131 (19.8%)24/142 (16.9%)0.816
COPB497/2071 (24.0%)32/131 (24.4%)33/142 (23.2%)0.972
Peripheral vascular disease393/2071 (19.0%)16/131 (12.2%)27/142 (19.0%)0.154
Cerebrovascular disease205/2071 (9.9%)13/131 (9.9%)8/142 (5.6%)0.248
Renal dialysis40/2071 (1.9%)2/131 (1.5%)4/142 (2.8%)0.679
Logistic EuroSCORE (%)20.77 ± 13.2820.48 ± 13.2617.37 ± 11.340.017
STS score (%)13.25 ± 10.9815.52 ± 13.629.99 ± 9.77<0.001
Atrial fibrillation478/2047 (23.2%)35/131 (26.9%)30/144 (21%)0.499
Permanent pacemaker274/2075 (13.2%)21/131 (16%)13/143 (9.1%)0.220
Echocardiographic findings
LVEF (%)53.6 ± 13.956.3 ± 14.857.0 ± 11.90.003
Mean AVG (mmHg)48.57 ± 15.9250.64 ± 17.1155.64 ± 18.62<0.001
Indexed AVA (cm2/m2)0.396 ± 0.1600.418 ± 0.2190.380 ± 0.1090.208
PH (sPAP > 60 mmHg)295/1626 (18.1%)18/95 (18.9%)19/115 (16.5%)0.886
Aortic regurgitation ≥ 2363/1969 (18.4%)29/123 (23.6%)39/138 (28.3%)0.009
Approach site NA
Transfemoral1595/2067 (77.2%)95/130 (73.1%)112/143 (78.3%)
Transapical316/2067 (15.3%)26/130 (20.0%)20/143 (14.0%)
Transaortic or subclavian119/2067 (5.8%)6/130 (4.6%)9/143 (6.3%)
Type of prosthesis
Edwards1424/2077 (68.6%)97/131 (74.0%)94/143 (65.7%)0.310
CoreValve653/2077 (31.4%)34/131 (26.0%)49/143 (34.3%)
Prosthesis size
≤23 mm613/2077 (29.5%)48/131 (36.6%)65/143 (45.5%)<0.001
>23 mm1464/2077 (70.5%)83/131 (63.4%)78/143 (54.5%)
Previous AVR surgery20/2071 (1.0%)9/131 (6.9%)15/142 (10.6%)<0.001
Preoperative treatment
Aspirin1224/2071 (59.1%)67/131 (51.1%)83/142 (58.5%)0.200
Clopidogrel634/2071 (30.6%)32/131 (24.4%)42/144 (29.6%)0.322
VKA493/2071 (23.8%)24/131 (18.3%)29/144 (20.4%)0.250
Discharge echocardiographic findings
LEVF (%)56.0 ± 12.357.1 ± 12.358.9 ± 11.6
Mean AVG (mmHg)10.0 ± 3.48.7 ± 3.224.7 ± 7.3<0.001
Indexed AVA (cm2/m2)1.054 ± 0.2991.076 ± 0.2560.824 ± 0.286
Post-procedural AR ≥ 2293/2017 (14.5%)15/124 (12.1%)25/139 (18.0%)0.385
AR: aortic regurgitation; AVA: aortic valve area; AVG: Aortic valve gradient; COPB: chronic obstructive pulmonary disease; CABG: coronary artery bypass graft; DIMG: delayed increase in mean gradient; LVEF: left ventricular ejection fraction; NYHA: New York Heart Association; PP-MG: post-procedural mean gradient; PH: pulmonary hypertension; STS: Society of Thoracic Surgeons; sPAP: systolic pulmonary artery pressure; VKA: vitamin K antagonist. Values are mean ± SD or % unless otherwise specified.
Table 2. Variables associated with a delayed increase of mean gradient over the first year of follow-up.
PP-MG < 20 mmHg
without DIMG
(Control) n = 2078
PP-MG < 20 mmHg
with DIMG
(Group 1) n = 131
Univariable Analysis
OR [95% CI]
p-ValueMultivariable Analysis
OR [95% CI]
p-Value
Age (year)86.2 ± 7.282.2 ± 6.90.99 [0.97; 1.02]0.552
Male sex49.750.40.97 [0.68; 1.39]0.882
Body mass index (kg/m2)26.2 ± 5.026.4 ± 4.91.01 [0.98; 1.04]0.612
NYHA, III or IV75.064.10.59 [0.41; 0.86]0.0060.56 [0.38; 0.82]0.0029
Syncope7.27.00.98 [0.51; 1.88]0.946
Angina16.810.70.59 [0.34; 1.05]0.072
Hypertension69.559.90.65 [0.45; 0.93]0.0180.66 [0.45; 0.96]0.0289
Diabetes25.722.10.82 [0.54; 1.25]0.360
Dyslipidaemia49.442.00.74 [0.52; 1.06]0.101
Active smoking3.20.80.23 [0.03; 1.67]0.146
Coronary artery disease47.243.40.86 [0.60; 1.23]0.402
Logistic EuroSCORE ≥ 2529.930.51.03 [0.70; 1.51]0.886
Echocardiographic findings
LVEF (%)53.6 ± 13.956.3 ± 14.81.02 [1.00; 1.03]0.032
Mean AVG (mmHg)48.57 ± 15.9250.64 ± 17.111.01 [1.00; 1.02]0.158
Indexed AVA (cm2/m2)0.40 ± 0.160.42 ± 0.221.799 [0.80; 4.06]0.158
PH (sPAP > 60 mmHg)18.118.91.05 [0.62; 1.79]0.843
Aortic regurgitation ≥ 218.423.61.37 [0.89; 2.10]0.157
Procedural characteristics
Edwards68.674.01.31 [0.88; 1.95]0.190
Prosthesis size > 23 mm70.563.40.72 [0.50; 1.05]0.0850.54 [0.37; 0.80]0.0019
Previous AVR surgery1.06.97.57 [3.37; 16.97]<0.00111.40 [4.78; 27.14]<0.0001
Preoperative treatment
Aspirin59.151.10.72 [0.51; 1.03]0.0740.67 [0.45; 0.98]0.040
Clopidogrel30.624.40.73 [0.49; 1.10]0.1370.74 [0.47; 1.14]0.17
VKA23.818.30.72 [0.46; 1.13]0.1530.65 [0.40; 1.05]0.080
Discharge echocardiographic findings
LEVF (%)56.0 ± 12.357.1 ± 12.31.01 [0.99; 1.02]0.3341
Mean AVG (mmHg)10.0 ± 3.48.7 ± 3.20.89 [0.84; 0.94]<0.00010.87 [0.81; 0.92]<0.0001
Indexed AVA (cm2/m2)1.05 ± 0.901.08 ± 0.261.26 [0.60; 2.65]0.536
Post-procedural AR ≥ 214.512.10.81 [0.47; 1.41]0.455
AR: aortic regurgitation; AVA: aortic valve area; AVG: aortic valve gradient; COPB: chronic obstructive pulmonary disease; CABG: coronary artery bypass graft; DIMG: delayed increase in mean gradient; LVEF: left ventricular ejection fraction; NYHA: New York Heart Association; PP-MG: post-procedural mean gradient; PH: pulmonary hypertension; STS: Society of Thoracic Surgeons; sPAP: systolic pulmonary artery pressure; VKA: vitamin K antagonist. Values are mean ± SD or % unless otherwise specified.
Table 3. Variables associated with a post procedural mean gradient ≥ 20 mmHg.
PP-MG < 20 mmHg n = 3334PP-MG ≥ 20 mmHg n = 144Univariable Analysis OR [95% CI]p-ValueMultivariable Analysis OR [95% CI]p-Value
Age (year)82.9 ± 7.180.5 ± 9.30.96 [0.95; 0.98]0.0041.73 [1.16; 2.58]0.007
Male sex49.252.11.12 [0.80; 1.57]0.497
Body mass index (kg/m2)4.910.52.29 [1.31; 4.00]0.0042.75 [1.17; 4.03]0.01
NYHA, III or IV75.172.70.89 [0.61; 1.29]0.526
Syncope7.27.00.98 [0.51; 1.88]0.946
Angina16.314.80.89 [0.55; 1.43]0.624
Hypertension68.374.61.36 [0.93; 2.00]0.114
Diabetes25.720.40.74 [0.49; 1.13]0.162
Dyslipidaemia47.858.51.54 [1.09; 2.16]0.0131.65 [1.12; 2.44]0.011
Active smoking3.14.91.60 [0.73; 3.52]0.237
Coronary artery disease47.039.90.75 [0.53; 1.06]0.100
Logistic EuroSCORE ≥ 2531.218.20.49 [0.32; 0.76]<0.0010.40 [0.24; 0.68]0.0007
Echocardiographic findings
LVEF (%)53.1 ± 14.257.0 ± 11.91.01 [1.01; 1.03]0.0012
Mean AVG (mmHg)48.05 ± 16.1155.64 ± 18.621.03 [1.01; 1.03]<0.00011.03 [1.02; 1.04]0.0003
Indexed AVA (cm2/m2)0.398 ± 0.1690.380 ± 0.1090.359 [0.08; 1.73]0.202
PH (sPAP > 60 mmHg)18.616.50.87 [0.53; 1.43]0.582
Aortic regurgitation ≥ 217.728.31.84 [1.25; 2.69]0.002
Procedural characteristics
Edwards66.365.70.97 [0.68; 1.39]0.883
Prosthesis size > 23 mm72.054.50.47 [0.33; 0.66]<0.0010.43 [0.30; 0.64]<0.0001
Previous AVR surgery1.510.68.60 [4.67; 15.84]<0.00121.38 [9.94; 45.99]<0.0001
Preoperative treatment
Aspirin57.758.51.07 [0.73; 1.45]0.8691.08 [0.72; 1.60]0.74
Clopidogrel29.229.61.02 [0.71; 1.47]0.914
VKA23.820.40.82 [0.54; 1.25]0.3540.87 [0.53; 1.42]0.57
Discharge echocardiographic findings
LEVF (%)55.4 ± 12.658.9 ± 11.61.02 [1.01; 1.04]0.0019
Mean AVG (mmHg)9.8 ± 3.424.7 ± 7.326.70 [9.26; 76.97]<0.0001
Indexed AVA (cm2/m2)1.054 ± 0.2880.824 ± 0.2860.024 [0.01; 0.06]<0.0001
Post-procedural AR ≥ 214.818.01.26 [0.81; 1.97]0.302
AR: aortic regurgitation; AVA: aortic valve area; AVG: aortic valve gradient; COPB: chronic obstructive pulmonary disease; CABG: coronary artery bypass graft; DIMG: delayed increase in mean gradient; LVEF: left ventricular ejection fraction; NYHA: New York Heart Association; PP-MG: post-procedural mean gradient; PH: pulmonary hypertension; PPM: patient-prosthesis mismatch; STS: Society of Thoracic Surgeons; sPAP: systolic pulmonary artery pressure; VKA: vitamin K antagonist. Values are mean ± SD or % unless otherwise specified.
Table 4. Baseline, procedural, and echocardiographic characteristics of patients with high post-procedural mean gradient (Group 2), according to the evolution of the mean gradient over the first year of follow-up (decrease < 20 mmHg or stability ≥ 20 mmHg).
Decrease of the MG over Year < 20 mmHg n = 83Stability of the MG over Year ≥ 20 mmHg n = 43p-Value
Age (year)80.8 ± 9.078.7 ± 10.40.260
Male sex36/83 (43.4%)25/43 (58.1%)0.116
Body mass index (kg/m2)26.03 ± 5.6227.97 ± 6.090.042
NYHA, III or IV56/83 (67.5%)36/43 (83.7%)0.051
Syncope8/83 (9.6%)0/43 (0%)0.050
Hypertension62/83 (74.7%)32/43 (74.4%)0.973
Diabetes11/83 (13.3%)15/43 (34.9%)0.004
Dyslipidaemia46/83 (55.4%)29/43 (67.4%)0.192
Active smoking4/83 (4.8%)3/43 (7.0%)0.689
Coronary artery disease32/83 (38.6%)16/43 (37.2%)0.883
Previous CABG10/83 (12.0%)14/43 (32.6%)0.005
COPB16/83 (19.8%)14/43 (32.6%)0.097
Peripheral vascular disease18/83 (21.7%)7/43 (16.3%)0.470
Cerebrovascular disease7/83 (8.4%)0/43 (0%)0.094
Renal dialysis2/83 (2.4%)1/43 (2.3%)1
Logistic EuroSCORE (%)15.72 ± 9.8620.37 ± 11.970.033
STS score (%)9.37 ± 8.89.69 ± 9.780.895
Atrial fibrillation18/83 (21.7%)7/43 (16.3%)0.470
Permanent pacemaker5/83 (6.0%)6/43 (14.0%)0.135
Echocardiographic findings
LVEF (%)56.1 ± 11.757.5 ± 11.30.621
Mean AVG (mmHg)56.80 ± 19.6554.07 ± 17.010.442
Indexed AVA (cm2/m2)0.384 ± 0.1070.370 ± 0.0980.681
PH (sPAP > 60 mmHg)11/67 (16.4%)7/37 (18.9%)0.747
Aortic regurgitation ≥ 225/79 (31.6%)11/42 (26.2%)0.532
Approach site NA
Transfemoral63/83 (75.9%)36/43 (83.7%)
Transapical13/83 (15.7%)4/43 (9.3%)
Transaortic or subclavian7/83 (8.4%)3/43 (7.0%)
Type of prosthesis
Edwards56/83 (67.5%)26/43 (60.5%)0.434
CoreValve27/83 (32.5%)17/43 (39.5%)
Prosthesis size
≤23 mm39/83 (47.0%)21/43 (48.8%)0.844
>23 mm44/83 (53%)22/43 (51.2%)
Previous AVR surgery1/83 (1.2%)13/43 (30.2%)<0.001
Preoperative treatment
Aspirin47/83 (56.6%)26/43 (60.5%)0.679
Clopidogrel23/83 (31.3%)9/43 (20.9%)0.217
VKA15/83 (18.1%)9/43 (20.9%)0.698
Discharge echocardiographic findings
LEVF (%)59.2 ± 10.759.3 ± 12.20.816
Mean AVG (mmHg)22.8 ± 3.127.0 ± 6.4<0.001
Indexed AVA (cm2/m2)0.901 ± 0.2760.665 ± 0.216<0.001
Post-procedural AR ≥ 219/81 (23.5%)4/40 (10.0%)0.089
6-month echocardiographic findings
LEVF (%)56.6 ± 13.262.3 ± 11.50.035
Mean AVG (mmHg)12.6 ± 4.626.9 ± 15.1<0.001
Indexed AVA (cm2/m2)1.003 ± 0.2970.923 ± 0.4180.297
Post-procedural AR ≥ 215/65 (24.2%)4/26 (16.7%)0.569
1 year echocardiographic findings
LEVF (%)56.2 ± 11.260.9 ± 9.30.066
Mean AVG (mmHg)13.0 ± 4.125.7 ± 9.7<0.001
Indexed AVA (cm2/m2)0.917 ± 0.2640.802 ± 0.2280.195
Post-procedural AR ≥ 210/62 (16.7%)3/26 (12.0%)0.747
AR: aortic regurgitation; AVA: aortic valve area; AVG: aortic valve gradient; COPB: chronic obstructive pulmonary disease; CABG: coronary artery bypass graft; LVEF: left ventricular ejection fraction; NYHA: New York Heart Association; PP-MG: post-procedural mean gradient; PH: pulmonary hypertension; STS: Society of Thoracic Surgeons; sPAP: systolic pulmonary artery pressure; VKA: vitamin K antagonist. Values are mean ± SD or % unless otherwise specified.
Publisher’s Note: MDPI stays neutral with regard to jurisdictional claims in published maps and institutional affiliations.

