
Perspectives on the Role of Magnetic Resonance Imaging (MRI) for Noninvasive Evaluation of Diabetic Kidney Disease

 , , and
Abstract
1. Introduction
2. Pathogenesis and Natural History of DKD
2.1. Perfusion
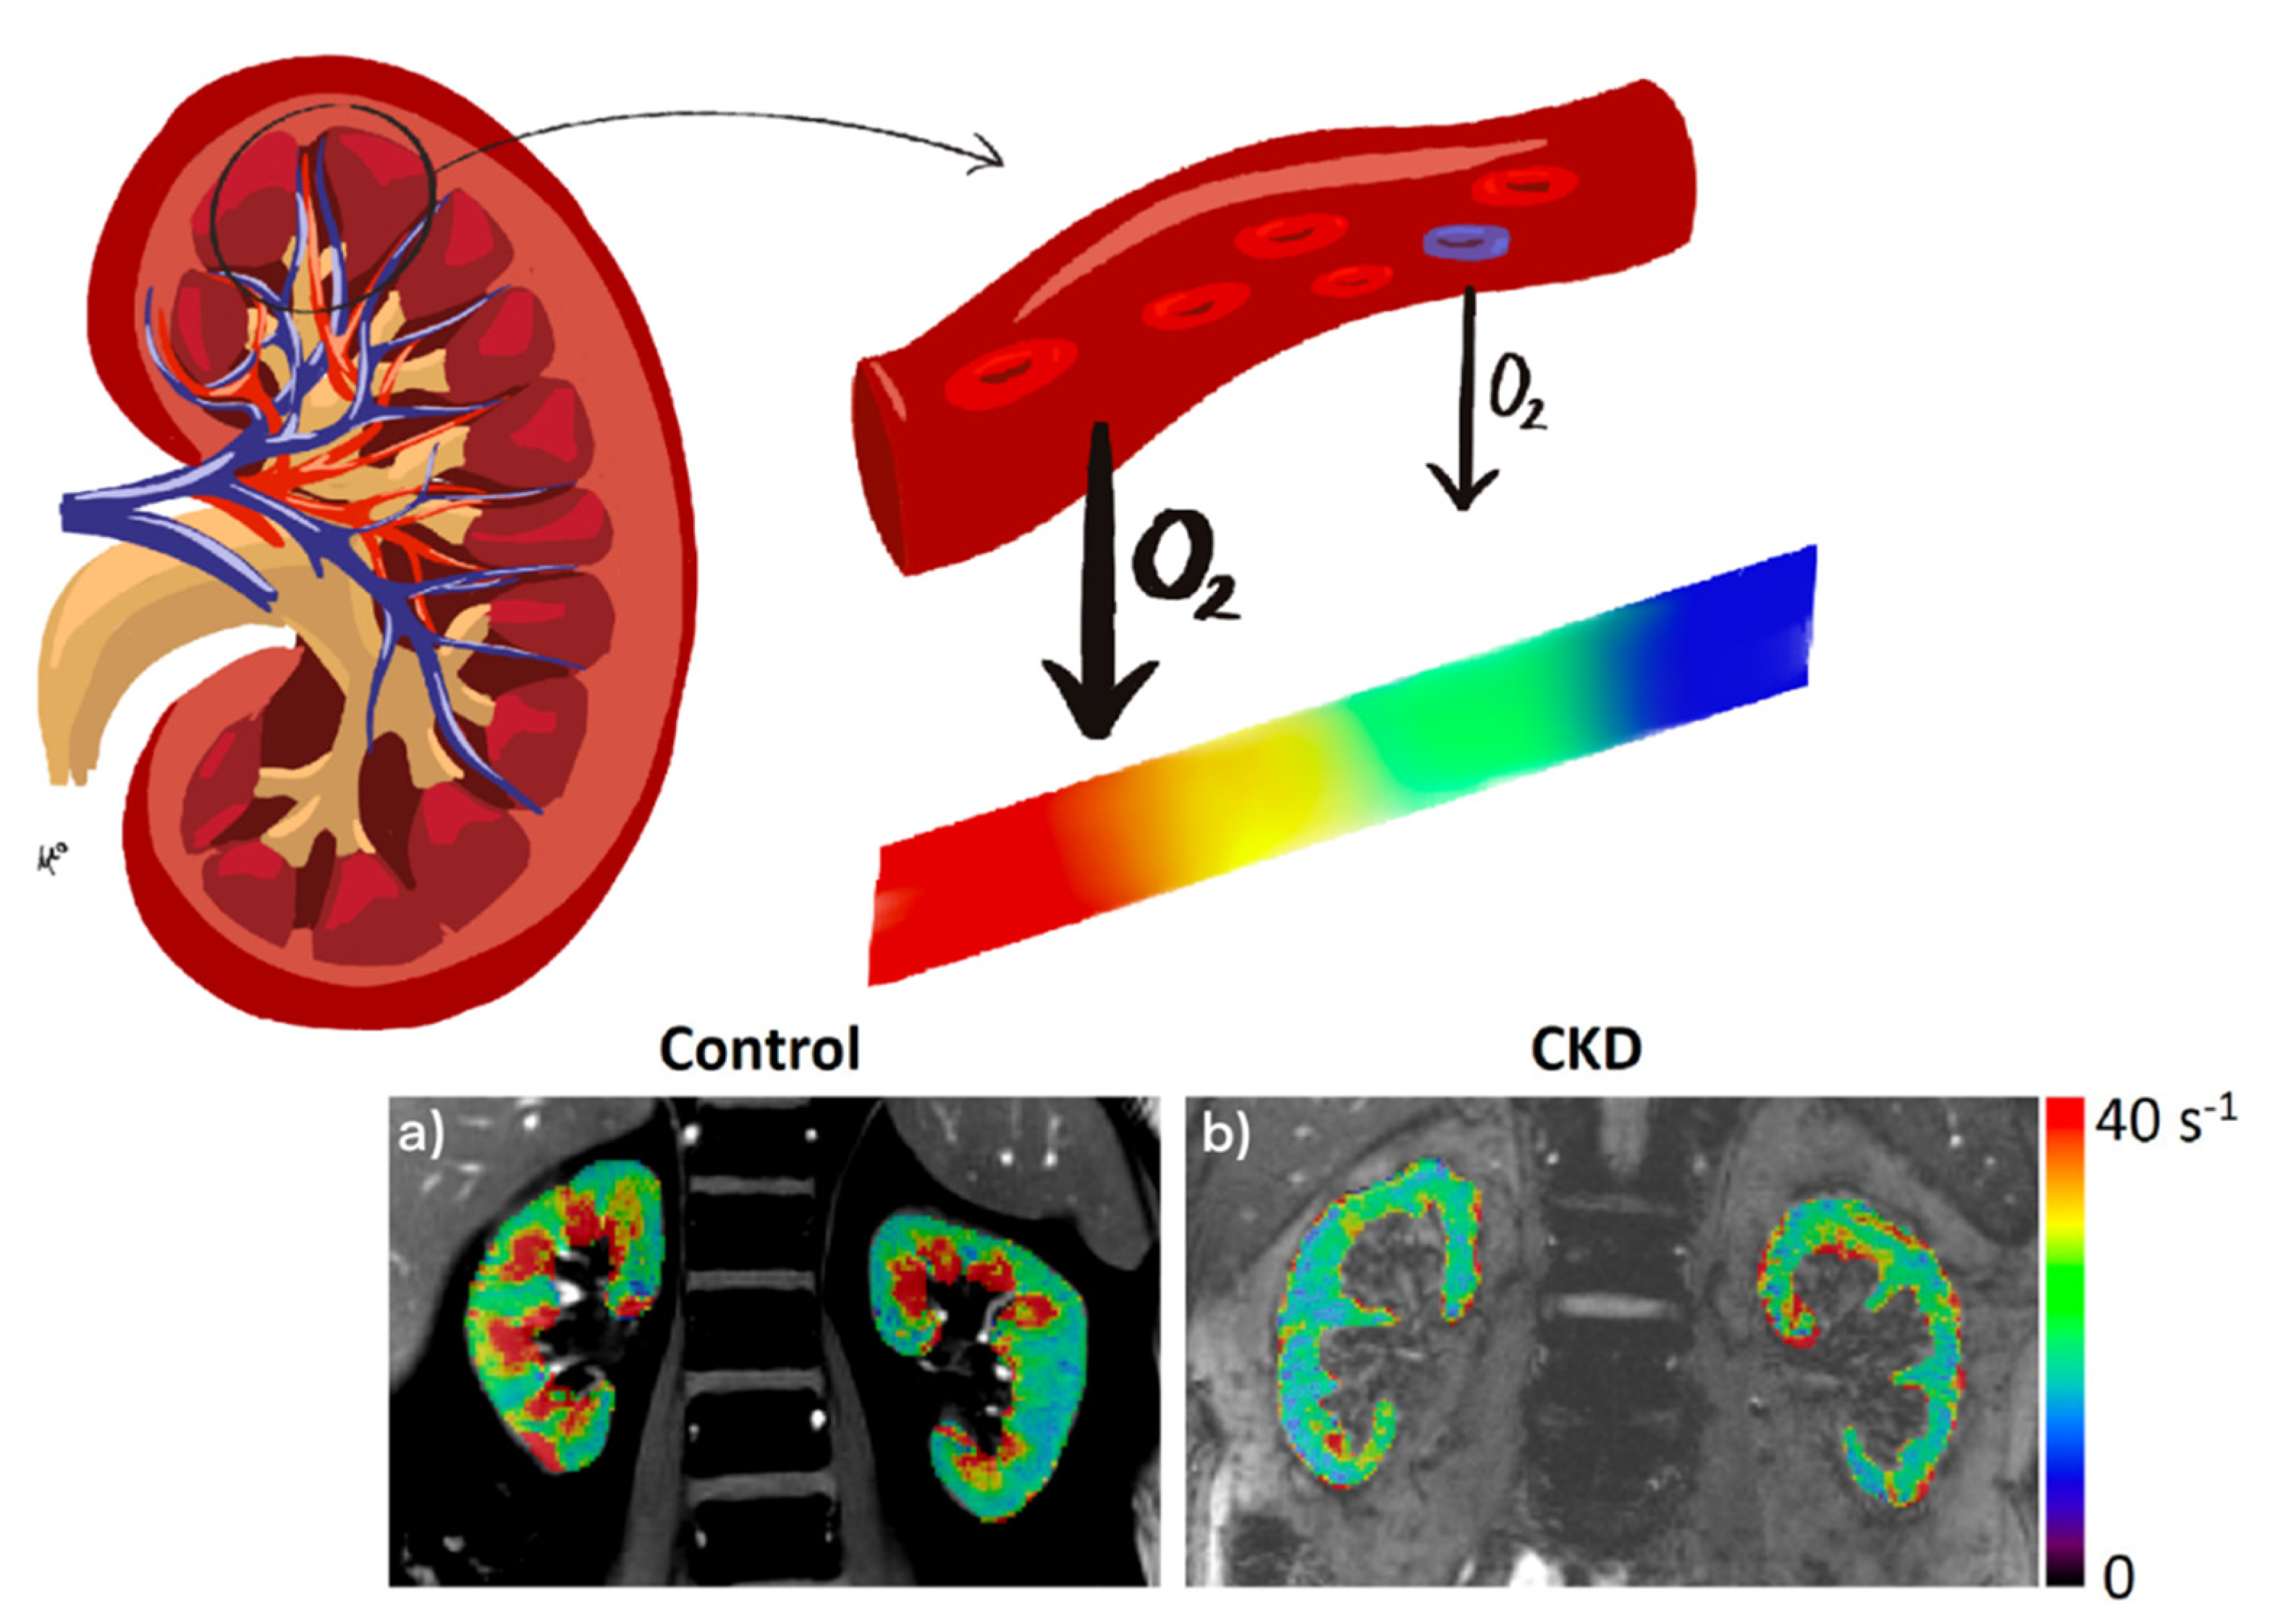
2.2. Oxygenation
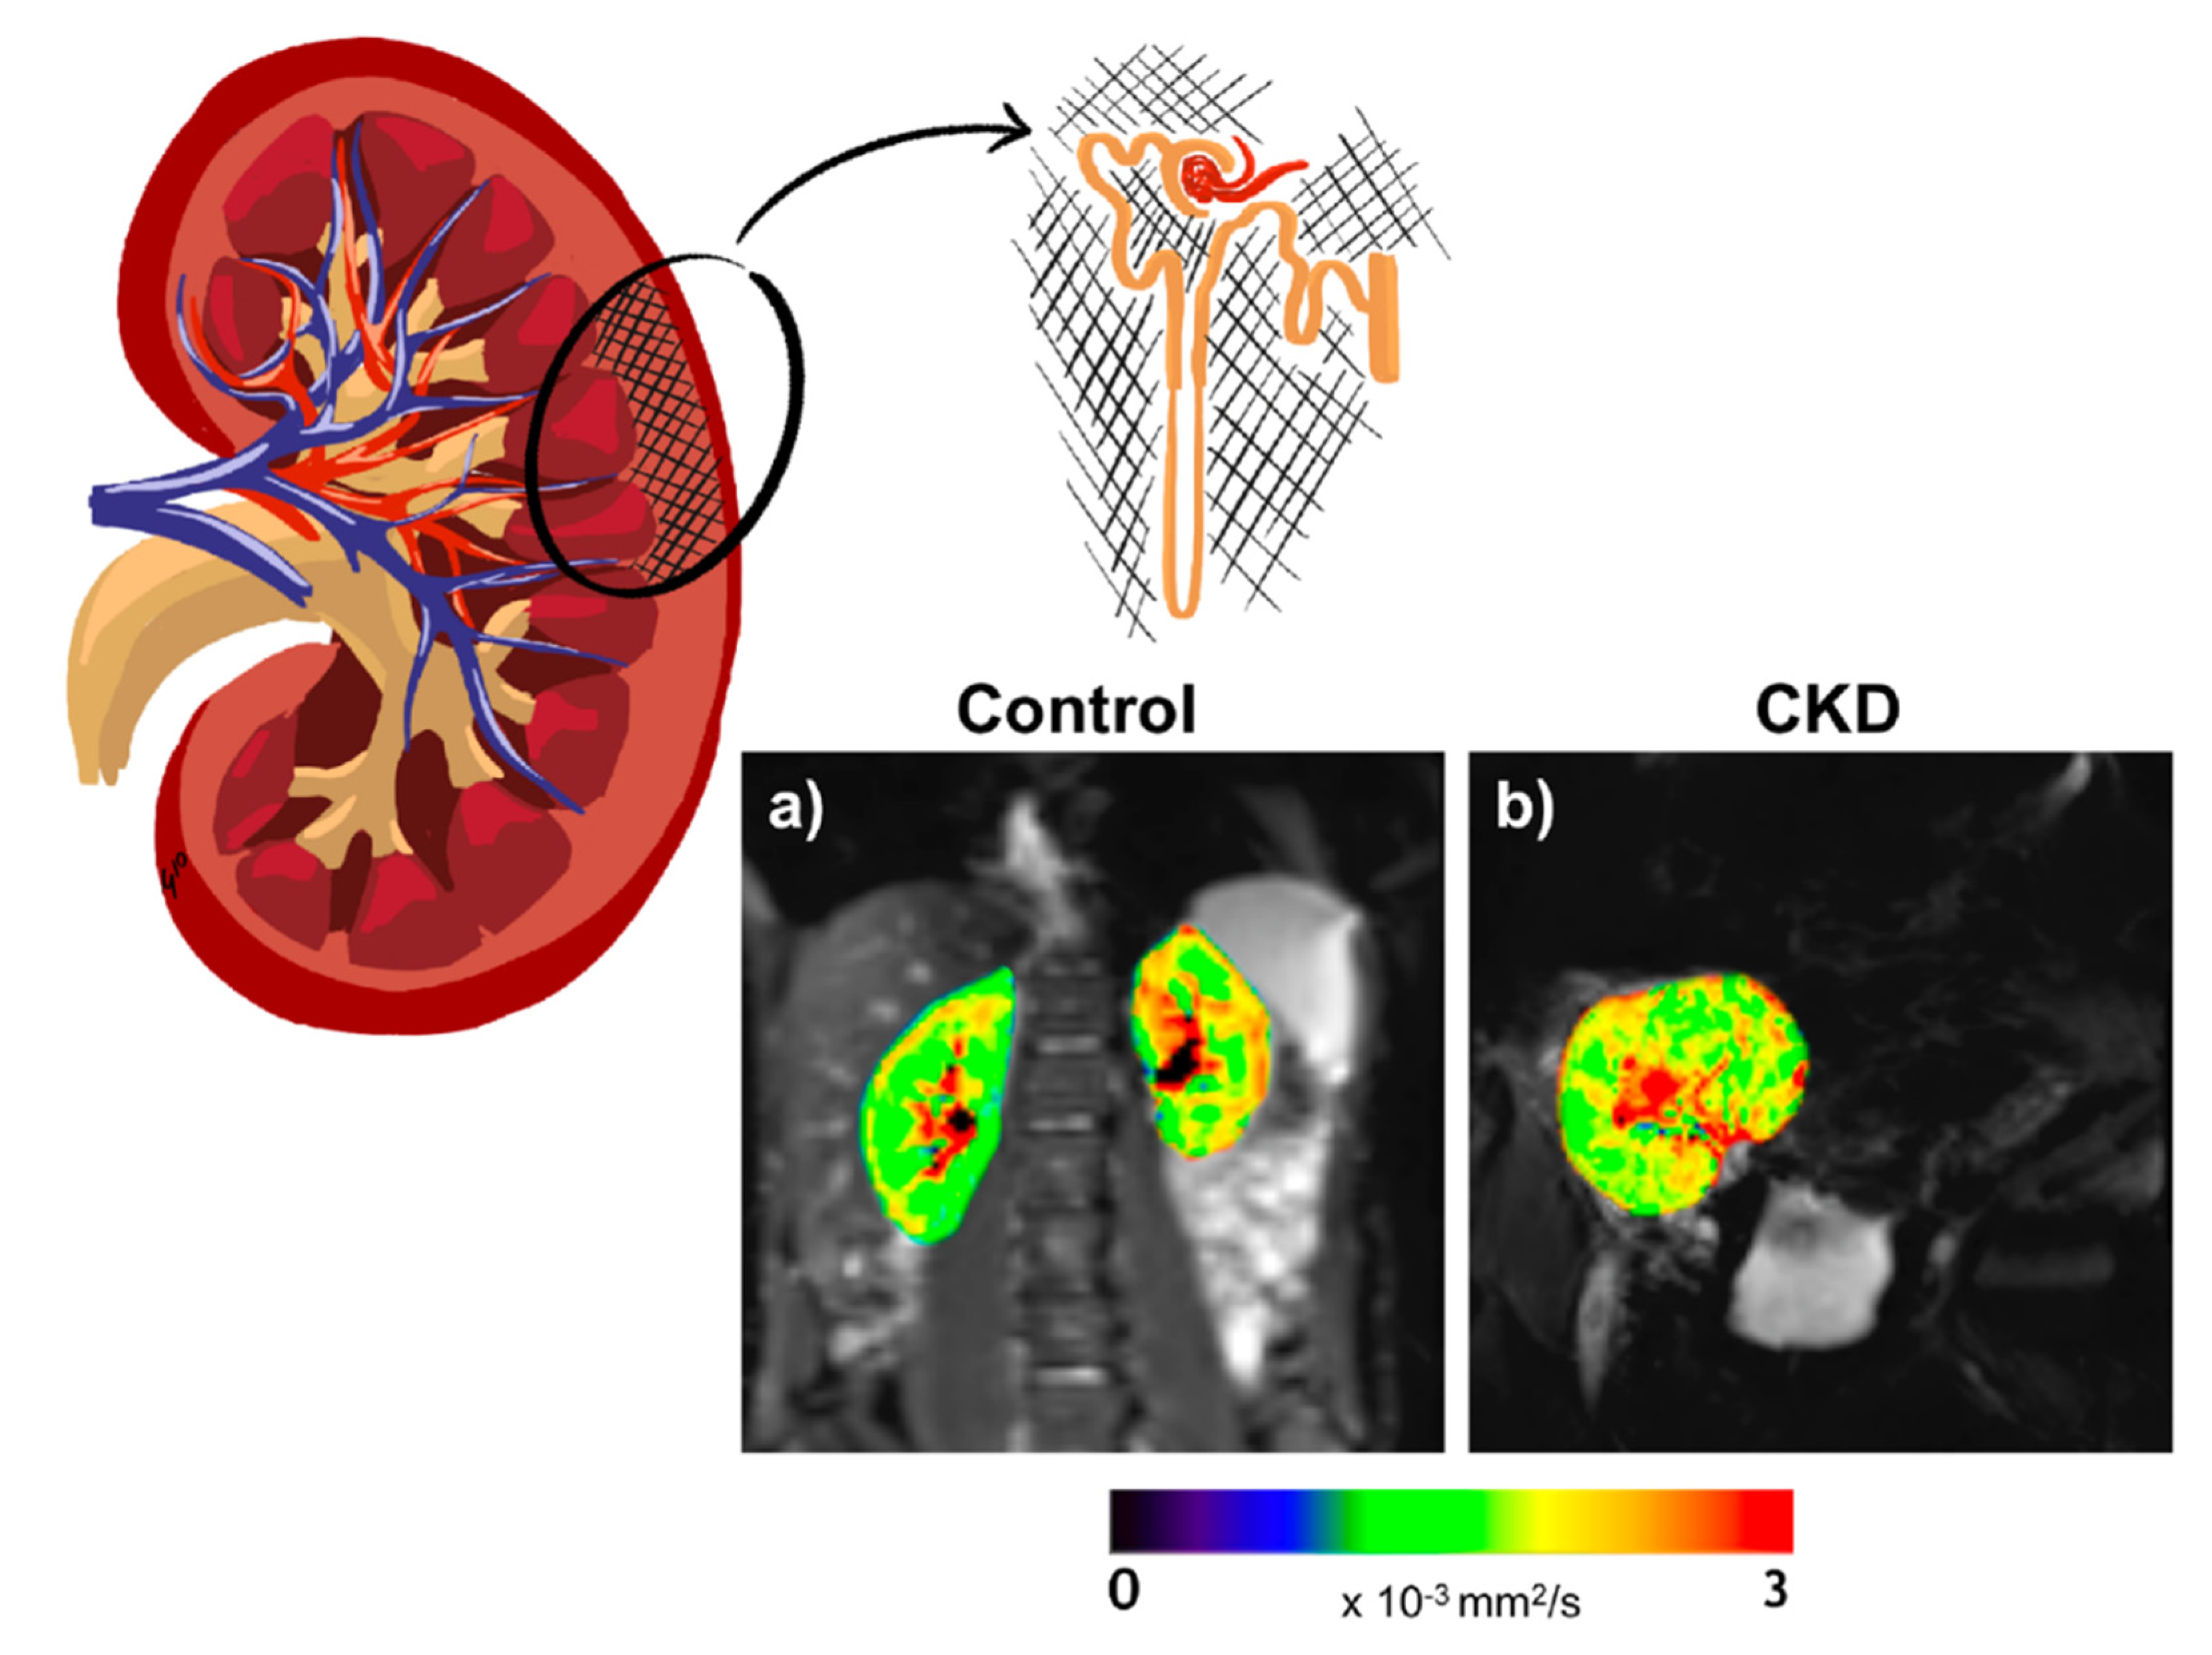
2.3. Microstructure
3. Magnetic Resonance Imaging and Clinical Utility
3.1. ASL
3.2. BOLD
3.3. DWI/DTI
4. Drug Therapies Evaluation
5. Conclusions
Author Contributions
Funding
Institutional Review Board Statement
Informed Consent Statement
Acknowledgments
Conflicts of Interest
References
- Koye, D.N.; Magliano, D.J.; Nelson, R.G.; Pavkov, M.E. The Global Epidemiology of Diabetes and Kidney Disease. Adv. Chronic Kidney Dis. 2018, 121–132. [Google Scholar] [CrossRef] [PubMed]
- Wolf, G.; Sharma, K. Pathogenesis, Clinical Manifestations, and Natural History of Diabetic Nephropathy. In Comprehensive Clinical Nephrology; Johnson, R.J., Feehally, J., Floege, J., Eds.; Elsevier Saunders: Philadelphia, PA, USA, 2015; pp. 354–363. [Google Scholar]
- Klessens, C.Q.F.F.; Woutman, T.D.; Veraar, K.A.M.M.; Zandbergen, M.; Valk, E.J.J.J.; Rotmans, J.I.; Wolterbeek, R.; Bruijn, J.A.; Bajema, I.M. An Autopsy Study Suggests That Diabetic Nephropathy Is Underdiagnosed. Kidney Int. 2016, 90, 149–156. [Google Scholar] [CrossRef]
- Perkins, B.A.; Ficociello, L.H.; Ostrander, B.E.; Silva, K.H.; Weinberg, J.; Warram, J.H.; Krolewski, A.S. Microalbuminuria and the Risk for Early Progressive Renal Function Decline in Type 1 Diabetes. J. Am. Soc. Nephrol. 2007, 18, 1353–1361. [Google Scholar] [CrossRef]
- Ebrahimi, B.; Textor, S.C.; Lerman, L.O. Renal Relevant Radiology: Renal Functional Magnetic Resonance Imaging. Clin. J. Am. Soc. Nephrol. CJASN 2014, 395–405. [Google Scholar] [CrossRef] [PubMed]
- Kopel, J.; Pena-Hernandez, C.; Nugent, K. Evolving Spectrum of Diabetic Nephropathy. World J. Diabetes 2019, 10, 269–279. [Google Scholar] [CrossRef]
- De Boer, I.H.; Afkarian, M.; Rue, T.C.; Cleary, P.A.; Lachin, J.M.; Molitch, M.E.; Steffes, M.W.; Sun, W.; Zinman, B. Renal Outcomes in Patients with Type 1 Diabetes and Macroalbuminuria. J. Am. Soc. Nephrol. 2014, 25, 2342–2350. [Google Scholar] [CrossRef] [PubMed]
- Perkins, B.A.; Ficociello, L.H.; Roshan, B.; Warram, J.H.; Krolewski, A.S. In Patients with Type 1 Diabetes and New-Onset Microalbuminuria the Development of Advanced Chronic Kidney Disease May Not Require Progression to Proteinuria. Kidney Int. 2010, 77, 57–64. [Google Scholar] [CrossRef]
- Goderis, G.; Van Pottelbergh, G.; Truyers, C.; Van Casteren, V.; De Clercq, E.; Van Den Broeke, C.; Buntinx, F. Long-Term Evolution of Renal Function in Patients with Type 2 Diabetes Mellitus: A Registry-Based Retrospective Cohort Study. BMJ Open 2013, 3, e004029. [Google Scholar] [CrossRef]
- Mashitani, T.; Hayashino, Y.; Okamura, S.; Kitatani, M.; Furuya, M.; Iburi, T.; Tsujii, S.; Ishii, H. Association between Dipstick Hematuria and Decline in Estimated Glomerular Filtration Rate among Japanese Patients with Type 2 Diabetes: A Prospective Cohort Study [Diabetes Distress and Care Registry at Tenri (DDCRT 14)]. J. Diabetes Complicat. 2017, 31, 1079–1084. [Google Scholar] [CrossRef]
- Oliva-Damaso, N.; Mora-Gutiérrez, J.M.; Bomback, A.S. Glomerular Diseases in Diabetic Patients: Implications for Diagnosis and Management. J. Clin. Med. 2021, 10, 1855. [Google Scholar] [CrossRef]
- Sharma, S.G.; Bomback, A.S.; Radhakrishnan, J.; Herlitz, L.C.; Stokes, M.B.; Markowitz, G.S.; D’Agati, V.D. The Modern Spectrum of Renal Biopsy Findings in Patients with Diabetes. Clin. J. Am. Soc. Nephrol. 2013, 8, 1718–1724. [Google Scholar] [CrossRef]
- Bermejo, S.; González, E.; López-Revuelta, K.; Ibernon, M.; López, D.; Martín-Gómez, A.; Garcia-Osuna, R.; Linares, T.; Díaz, M.; Martín, N.; et al. Risk Factors for Non-Diabetic Renal Disease in Diabetic Patients. Clin. Kidney J. 2020, 13, 380–388. [Google Scholar] [CrossRef]
- Liu, D.; Huang, T.; Chen, N.; Xu, G.; Zhang, P.; Luo, Y.; Wang, Y.; Lu, T.; Wang, L.; Xiong, M.; et al. The Modern Spectrum of Biopsy-proven Renal Disease in Chinese Diabetic Patients-a Retrospective Descriptive Study. PeerJ 2018, 6, e4522. [Google Scholar] [CrossRef]
- Alicic, R.Z.; Rooney, M.T.; Tuttle, K.R. Diabetic Kidney Disease: Challenges, Progress, and Possibilities. Clin. J. Am. Soc. Nephrol. 2017, 12, 2032–2045. [Google Scholar] [CrossRef]
- Tervaert, T.W.C.; Mooyaart, A.L.; Amann, K.; Cohen, A.H.; Cook, H.T.; Drachenberg, C.B.; Ferrario, F.; Fogo, A.B.; Haas, M.; de Heer, E.; et al. Pathologic Classification of Diabetic Nephropathy. J. Am. Soc. Nephrol. 2010, 21, 556–563. [Google Scholar] [CrossRef]
- Fine, L.G.; Orphanides, C.; Norman, J.T. Progressive Renal Disease: The Chronic Hypoxia Hypothesis. Kidney Int. Suppl. 1998, 65, S74–S78. [Google Scholar]
- Hesp, A.C.; Schaub, J.A.; Prasad, P.V.; Vallon, V.; Laverman, G.D.; Bjornstad, P.; van Raalte, D.H. The Role of Renal Hypoxia in the Pathogenesis of Diabetic Kidney Disease: A Promising Target for Newer Renoprotective Agents Including SGLT2 Inhibitors? Kidney Int. 2020. [Google Scholar] [CrossRef] [PubMed]
- Sun, D.; Eirin, A.; Ebrahimi, B.; Textor, S.C.; Lerman, A.; Lerman, L.O. Early Atherosclerosis Aggravates Renal Microvascular Loss and Fibrosis in Swine Renal Artery Stenosis. J. Am. Soc. Hypertens. 2016, 10, 325–335. [Google Scholar] [CrossRef] [PubMed]
- Barrera-Chimal, J.; Pérez-Villalva, R.; Ortega, J.A.; Sánchez, A.; Rodríguez-Romo, R.; Durand, M.; Jaisser, F.; Bobadilla, N.A. Mild Ischemic Injury Leads to Long-Term Alterations in the Kidney: Amelioration by Spironolactone Administration. Int. J. Biol. Sci. 2015, 11, 892–900. [Google Scholar] [CrossRef] [PubMed]
- Tonneijck, L.; Muskiet, M.H.A.; Smits, M.M.; van Bommel, E.J.; Heerspink, H.J.L.; van Raalte, D.H.; Joles, J.A. Glomerular Hyperfiltration in Diabetes: Mechanisms, Clinical Significance, and Treatment. J. Am. Soc. Nephrol. 2017, 28, 1023–1039. [Google Scholar] [CrossRef]
- Marckmann, P.; Skov, L.; Rossen, K.; Dupont, A.; Damholt, M.B.; Heaf, J.G.; Thomsen, H.S. Nephrogenic Systemic Fibrosis: Suspected Causative Role of Gadodiamide Used for Contrast-Enhanced Magnetic Resonance Imaging. J. Am. Soc. Nephrol. 2006, 17, 2359–2362. [Google Scholar] [CrossRef]
- Perazella, M.A. Current Status of Gadolinium Toxicity in Patients with Kidney Disease. Clin. J. Am. Soc. Nephrol. 2009, 4, 461–469. [Google Scholar] [CrossRef]
- Correas, J.-M.; Anglicheau, D.; Joly, D.; Gennisson, J.-L.; Tanter, M.; Hélénon, O. Ultrasound-Based Imaging Methods of the Kidney-Recent Developments. Kidney Int. 2016, 90, 1199–1210. [Google Scholar] [CrossRef]
- Pallone, T.L.; Robertson, C.R.; Jamison, R.L. Renal Medullary Microcirculation. Physiol. Rev. 1990, 70, 885–920. [Google Scholar] [CrossRef] [PubMed]
- Zimmerhackl, B.; Robertson, C.R.; Jamison, R.L. The Microcirculation of the Renal Medulla. Circ. Res. 1985, 57, 657–667. [Google Scholar] [CrossRef]
- Neuhofer, W.; Beck, F.X. Cell Survival in the Hostile Environment of the Renal Medulla. Annu. Rev. Physiol. 2005, 67, 531–555. [Google Scholar] [CrossRef] [PubMed]
- Evans, R.G.; Gardiner, B.S.; Smith, D.W.; O’Connor, P.M. Intrarenal Oxygenation: Unique Challenges and the Biophysical Basis of Homeostasis. Am. J. Physiol. Renal Physiol. 2008, F1259–F1270. [Google Scholar] [CrossRef]
- Hansell, P.; Welch, W.J.; Blantz, R.C.; Palm, F. Determinants of Kidney Oxygen Consumption and Their Relationship to Tissue Oxygen Tension in Diabetes and Hypertension. Clin. Exp. Pharmacol. Physiol. 2013, 123–137. [Google Scholar] [CrossRef]
- Fine, L.G.; Norman, J.T. Chronic Hypoxia as a Mechanism of Progression of Chronic Kidney Diseases: From Hypothesis to Novel Therapeutics. Kidney Int. 2008, 74, 867–872. [Google Scholar] [CrossRef]
- Rosenberger, C.; Khamaisi, M.; Abassi, Z.; Shilo, V.; Weksler-Zangen, S.; Goldfarb, M.; Shina, A.; Zibertrest, F.; Eckardt, K.U.; Rosen, S.; et al. Adaptation to Hypoxia in the Diabetic Rat Kidney. Kidney Int. 2008, 73, 34–42. [Google Scholar] [CrossRef] [PubMed]
- Palm, F.; Cederberg, J.; Hansell, P.; Liss, P.; Carlsson, P.-O. Reactive Oxygen Species Cause Diabetes-Induced Decrease in Renal Oxygen Tension. Diabetologia 2003, 46, 1153–1160. [Google Scholar] [CrossRef]
- Sharma, K.; McGowan, T.A. TGF-Beta in Diabetic Kidney Disease: Role of Novel Signaling Pathways. Cytokine Growth Factor Rev. 2000, 11, 115–123. [Google Scholar] [CrossRef]
- Klessens, C.Q.F.; Zandbergen, M.; Wolterbeek, R.; Bruijn, J.A.; Rabelink, T.J.; Bajema, I.M.; IJpelaar, D.H.T. Macrophages in Diabetic Nephropathy in Patients with Type 2 Diabetes. Nephrol. Dial. Transplant. 2017, 32, 1322–1329. [Google Scholar] [CrossRef] [PubMed]
- Mora-Gutiérrez, J.M.; Rodríguez, J.A.; Fernández-Seara, M.A.; Orbe, J.; Escalada, F.J.; Soler, M.J.; Slon Roblero, M.F.; Riera, M.; Páramo, J.A.; Garcia-Fernandez, N. MMP-10 Is Increased in Early Stage Diabetic Kidney Disease and Can Be Reduced by Renin-Angiotensin System Blockade. Sci. Rep. 2020, 10, 26. [Google Scholar] [CrossRef]
- Ritt, M.; Ott, C.; Raff, U.; Schneider, M.P.; Schuster, I.; Hilgers, K.F.; Schlaich, M.P.; Schmieder, R.E.; Deanfield, J.E.; Halcox, J.P.; et al. Renal Vascular Endothelial Function in Hypertensive Patients With Type 2 Diabetes Mellitus. Am. J. Kidney Dis. 2009, 53, 281–289. [Google Scholar] [CrossRef] [PubMed]
- Lohr, J.; Mazurchuk, R.J.; Acara, M.A.; Nickerson, P.A.; Fiel, R.J. Magnetic Resonance Imaging (MRI) and Pathophysiology of the Rat Kidney in Streptozotocin-Induced Diabetes. Magn. Reson. Imaging 1991, 9, 93–100. [Google Scholar] [CrossRef]
- Mangili, R.; Sironi, S.; Rankel, G.; Makarovic, M.; Zerbini, G.; Del Maschio, A.; Pozza, G. Magnetic Resonance Imaging of the Kidney in Type 1 (Insulin-Dependent) Diabetes Mellitus. Diabetologia 1992, 35, 1002–1008. [Google Scholar] [CrossRef][Green Version]
- Selby, N.M.; Blankestijn, P.J.; Boor, P.; Combe, C.; Eckardt, K.U.; Eikefjord, E.; Garcia-Fernandez, N.; Golay, X.; Gordon, I.; Grenier, N.; et al. Magnetic Resonance Imaging Biomarkers for Chronic Kidney Disease: A Position Paper from the European Cooperation in Science and Technology Action PARENCHIMA. Nephrol. Dial. Transplant. 2018, 33, ii4–ii14. [Google Scholar] [CrossRef]
- Simms, R.; Sourbron, S. Recent Findings on the Clinical Utility of Renal Magnetic Resonance Imaging Biomarkers. Nephrol. Dial. Transplant. 2020, 35, 915–919. [Google Scholar] [CrossRef]
- Caroli, A.; Pruijm, M.; Burnier, M.; Selby, N.M. Functional Magnetic Resonance Imaging of the Kidneys: Where Do We Stand? The Perspective of the European COST Action PARENCHIMA. Nephrol. Dial. Transplant. 2018, 1–3. [Google Scholar] [CrossRef]
- Mendichovszky, I.; Pullens, P.; Dekkers, I.; Nery, F.; Bane, O.; Pohlmann, A.; de Boer, A.; Ljimani, A.; Odudu, A.; Buchanan, C.; et al. Technical Recommendations for Clinical Translation of Renal MRI: A Consensus Project of the Cooperation in Science and Technology Action PARENCHIMA. Magn. Reson. Mater. Phys. Biol. Med. 2020, 33, 131–140. [Google Scholar] [CrossRef] [PubMed]
- Buchanan, C.E.; Mahmoud, H.; Cox, E.F.; McCulloch, T.; Prestwich, B.L.; Taal, M.W.; Selby, N.M.; Francis, S.T. Quantitative Assessment of Renal Structural and Functional Changes in Chronic Kidney Disease Using Multi-Parametric Magnetic Resonance Imaging. Nephrol. Dial. Transplant. 2020, 35. [Google Scholar] [CrossRef]
- Nery, F.; Buchanan, C.E.; Harteveld, A.A.; Odudu, A.; Bane, O.; Cox, E.F.; Derlin, K.; Gach, H.M.; Golay, X.; Gutberlet, M.; et al. Consensus-Based Technical Recommendations for Clinical Translation of Renal ASL MRI. Magn. Reson. Mater. Phys. Biol. Med. 2020, 33, 141–161. [Google Scholar] [CrossRef]
- Ritt, M.; Janka, R.; Schneider, M.P.; Martirosian, P.; Hornegger, J.; Bautz, W.; Uder, M.; Schmieder, R.E. Measurement of Kidney Perfusion by Magnetic Resonance Imaging: Comparison of MRI with Arterial Spin Labeling to Para-Aminohippuric Acid Plasma Clearance in Male Subjects with Metabolic Syndrome. Nephrol. Dial. Transplant. 2010, 25, 1126–1133. [Google Scholar] [CrossRef] [PubMed]
- Artz, N.S.; Wentland, A.L.; Sadowski, E.A.; Djamali, A.; Grist, T.M.; Seo, S.; Fain, S.B. Comparing Kidney Perfusion Using Noncontrast Arterial Spin Labeling MRI and Microsphere Methods in an Interventional Swine Model. Investig. Radiol. Radiol. 2011, 46, 124–131. [Google Scholar] [CrossRef]
- Artz, N.S.; Sadowski, E.A.; Wentland, A.L.; Djamali, A.; Grist, T.M.; Seo, S.; Fain, S.B. Reproducibility of Renal Perfusion MR Imaging in Native and Transplanted Kidneys Using Non-Contrast Arterial Spin Labeling. J. Magn. Reson. Imaging 2011, 33, 1414–1421. [Google Scholar] [CrossRef] [PubMed]
- Mora-Gutiérrez, J.M.; Garcia-Fernandez, N.; Slon Roblero, M.F.; Páramo, J.A.; Escalada, F.J.; Wang, D.J.; Benito, A.; Fernández-Seara, M.A. Arterial Spin Labeling MRI Is Able to Detect Early Hemodynamic Changes in Diabetic Nephropathy. J. Magn. Reson. Imaging 2017, 46, 1810–1817. [Google Scholar] [CrossRef] [PubMed]
- Tan, H.; Koktzoglou, I.; Prasad, P.V. Renal Perfusion Imaging with Two-Dimensional Navigator Gated Arterial Spin Labeling. Magn. Reson. Med. 2014, 71, 570–579. [Google Scholar] [CrossRef] [PubMed]
- Li, L.-P.; Tan, H.; Thacker, J.M.; Li, W.; Zhou, Y.; Kohn, O.; Sprague, S.M.; Prasad, P.V. Evaluation of Renal Blood Flow in Chronic Kidney Disease Using Arterial Spin Labeling Perfusion Magnetic Resonance Imaging. Kidney Int. Rep. 2017, 2, 36–46. [Google Scholar] [CrossRef]
- Brown, R.S.; Sun, M.R.M.; Stillman, I.E.; Russell, T.L.; Rosas, S.E.; Wei, J.L. The Utility of Magnetic Resonance Imaging for Noninvasive Evaluation of Diabetic Nephropathy. Nephrol. Dial. Transplant. 2020, 35, 970–978. [Google Scholar] [CrossRef]
- Prasad, P.V.; Li, L.-P.; Thacker, J.M.; Li, W.; Hack, B.; Kohn, O.; Sprague, S.M. Cortical Perfusion and Tubular Function as Evaluated by MRI Correlate with Annual Loss in Renal Function in Moderate CKD. Am. J. Nephrol 2019, 49, 114–124. [Google Scholar] [CrossRef]
- Prasad, P.V.; Edelman, R.R.; Epstein, F.H. Noninvasive Evaluation of Intrarenal Oxygenation with BOLD MRI. Circulation 1996, 94, 3271–3275. [Google Scholar] [CrossRef] [PubMed]
- Khatir, D.S.; Pedersen, M.; Jespersen, B.; Buus, N.H. Reproducibility of MRI Renal Artery Blood Flow and BOLD Measurements in Patients with Chronic Kidney Disease and Healthy Controls. J. Magn. Reson. Imaging 2014, 40, 1091–1098. [Google Scholar] [CrossRef]
- Milani, B.; Ansaloni, A.; Sousa-Guimaraes, S.; Vakilzadeh, N.; Piskunowicz, M.; Vogt, B.; Stuber, M.; Burnier, M.; Pruijm, M. Reduction of Cortical Oxygenation in Chronic Kidney Disease: Evidence Obtained with a New Analysis Method of Blood Oxygenation Level-Dependent Magnetic Resonance Imaging. Nephrol. Dial. Transplant. 2017, 32, 2097–2105. [Google Scholar] [CrossRef] [PubMed]
- Vinovskis, C.; Li, L.P.; Prasad, P.; Tommerdahl, K.; Pyle, L.; Nelson, R.G.; Pavkov, M.E.; van Raalte, D.; Rewers, M.; Pragnell, M.; et al. Relative Hypoxia and Early Diabetic Kidney Disease in Type 1 Diabetes. Diabetes 2020, 69, 2700–2708. [Google Scholar] [CrossRef] [PubMed]
- Sugiyama, K.; Inoue, T.; Kozawa, E.; Ishikawa, M.; Shimada, A.; Kobayashi, N.; Tanaka, J.; Okada, H. Reduced Oxygenation but Not Fibrosis Defined by Functional Magnetic Resonance Imaging Predicts the Long-Term Progression of Chronic Kidney Disease. Nephrol. Dial. Transplant. 2020, 35. [Google Scholar] [CrossRef]
- Pruijm, M.; Milani, B.; Pivin, E.; Podhajska, A.; Vogt, B.; Stuber, M.; Burnier, M. Reduced Cortical Oxygenation Predicts a Progressive Decline of Renal Function in Patients with Chronic Kidney Disease. Kidney Int. 2018, 93. [Google Scholar] [CrossRef] [PubMed]
- Zheng, S.S.; He, Y.M.; Lu, J. Noninvasive Evaluation of Diabetic Patients with High Fasting Blood Glucose Using DWI and BOLD MRI. Abdom. Radiol. 2020. [Google Scholar] [CrossRef]
- Yin, W.-J.J.; Liu, F.; Li, X.-M.M.; Yang, L.; Zhao, S.; Huang, Z.-X.X.; Huang, Y.-Q.Q.; Liu, R.-B.B. Noninvasive Evaluation of Renal Oxygenation in Diabetic Nephropathy by BOLD-MRI. Eur. J. Radiol. 2012, 81, 1426–1431. [Google Scholar] [CrossRef]
- Feng, Y.Z.; Ye, Y.J.; Cheng, Z.Y.; Hu, J.J.; Zhang, C.B.; Qian, L.; Lu, X.H.; Cai, X.R. Non-Invasive Assessment of Early Stage Diabetic Nephropathy by DTI and BOLD MRI. Br. J. Radiol. 2020, 93. [Google Scholar] [CrossRef]
- Dos Santos, E.A.; Li, L.P.; Ji, L.; Prasad, P.V. Early Changes with Diabetes in Renal Medullary Hemodynamics as Evaluated by Fiberoptic Probes and BOLD Magnetic Resonance Imaging. Invest. Radiol. 2007, 42, 157–162. [Google Scholar] [CrossRef]
- Li, L.P.; Ji, L.; Santos, E.A.; Prasad, P.; Dunkle, E.; Pierchala, L. Effect of Nitric Oxide Synthase Inhibition on Intrarenal Oxygenation as Evaluated by Blood Oxygenation Level-Dependent Magnetic Resonance Imaging. Investig. Radiol. 2009, 44, 67–73. [Google Scholar] [CrossRef] [PubMed]
- Hueper, K.; Hartung, D.; Gutberlet, M.; Gueler, F.; Sann, H.; Husen, B.; Wacker, F.; Reiche, D. Assessment of Impaired Vascular Reactivity in a Rat Model of Diabetic Nephropathy: Effect of Nitric Oxide Synthesis Inhibition on Intrarenal Diffusion and Oxygenation Measured by Magnetic Resonance Imaging. Am. J. Physiol. Renal Physiol. 2013, 305. [Google Scholar] [CrossRef]
- Epstein, F.H.; Veves, A.; Prasad, P.V. Effect of Diabetes on Renal Medullary Oxygenation During Water Diuresis. Diabetes Care 2002, 25, 575–578. [Google Scholar] [CrossRef] [PubMed]
- Economides, P.A.; Caselli, A.; Zuo, C.S.; Sparks, C.; Khaodhiar, L.; Katsilambros, N.; Horton, E.S.; Veves, A. Kidney Oxygenation during Water Diuresis and Endothelial Function in Patients with Type 2 Diabetes and Subjects at Risk to Develop Diabetes. Metabolism 2004, 53, 222–227. [Google Scholar] [CrossRef] [PubMed]
- Wang, Z.J.; Kumar, R.; Banerjee, S.; Hsu, C.Y. Blood Oxygen Level-Dependent (BOLD) MRI of Diabetic Nephropathy: Preliminary Experience. J. Magn. Reson. Imaging 2011, 33, 655–660. [Google Scholar] [CrossRef]
- Inoue, T.; Kozawa, E.; Okada, H.; Inukai, K.; Watanabe, S.; Kikuta, T.; Watanabe, Y.; Takenaka, T.; Katayama, S.; Tanaka, J.; et al. Noninvasive Evaluation of Kidney Hypoxia and Fibrosis Using Magnetic Resonance Imaging. J. Am. Soc. Nephrol. 2011, 22, 1429–1434. [Google Scholar] [CrossRef]
- Prasad, P.V.; Epstein, F.H. Changes in Renal Medullary PO2 during Water Diuresis as Evaluated by Blood Oxygenation Level-Dependent Magnetic Resonance Imaging: Effects of Aging and Cyclooxygenase Inhibition. Kidney Int. 1999, 55, 294–298. [Google Scholar] [CrossRef] [PubMed]
- Pruijm, M.; Hofmann, L.; Maillard, M.; Tremblay, S.; Glatz, N.; Wuerzner, G.; Burnier, M.; Vogt, B. Effect of Sodium Loading/Depletion on Renal Oxygenation in Young Normotensive and Hypertensive Men. Hypertension 2010, 55, 1116–1122. [Google Scholar] [CrossRef]
- Bane, O.; Mendichovszky, I.A.; Milani, B.; Dekkers, I.A.; Deux, J.F.; Eckerbom, P.; Grenier, N.; Hall, M.E.; Inoue, T.; Laustsen, C.; et al. Consensus-Based Technical Recommendations for Clinical Translation of Renal BOLD MRI. Magn. Reson. Mater. Phys. Biol. Med. 2020, 199–215. [Google Scholar] [CrossRef]
- Caroli, A.; Schneider, M.; Friedli, I.; Ljimani, A.; De Seigneux, S.; Boor, P.; Gullapudi, L.; Kazmi, I.; Mendichovszky, I.A.; Notohamiprodjo, M.; et al. Diffusion-Weighted Magnetic Resonance Imaging to Assess Diffuse Renal Pathology: A Systematic Review and Statement Paper. Nephrol. Dial. Transplant. 2018, 33, ii29–ii40. [Google Scholar] [CrossRef]
- Thoeny, H.C.; Binser, T.; Roth, B.; Kessler, T.M.; Vermathen, P. Noninvasive Assessment of Acute Ureteral Obstruction with Diffusion-Weighted MR Imaging: A Prospective Study. Radiology 2009, 252, 721–728. [Google Scholar] [CrossRef]
- Hueper, K.; Khalifa, A.A.; Bräsen, J.H.; Vo Chieu, V.D.; Gutberlet, M.; Wintterle, S.; Lehner, F.; Richter, N.; Peperhove, M.; Tewes, S.; et al. Diffusion-Weighted Imaging and Diffusion Tensor Imaging Detect Delayed Graft Function and Correlate with Allograft Fibrosis in Patients Early after Kidney Transplantation. J. Magn. Reson. Imaging 2016, 44, 112–121. [Google Scholar] [CrossRef] [PubMed]
- Deng, Y.; Yang, B.; Peng, Y.; Liu, Z.; Luo, J.; Du, G. Use of Intravoxel Incoherent Motion Diffusion-Weighted Imaging to Detect Early Changes in Diabetic Kidneys. Abdom. Radiol. 2018, 43, 2728–2733. [Google Scholar] [CrossRef]
- Lu, L.; Sedor, J.R.; Gulani, V.; Schelling, J.R.; O’Brien, A.; Flask, C.A.; MacRae Dell, K. Use of Diffusion Tensor MRI to Identify Early Changes in Diabetic Nephropathy. Am. J. Nephrol. 2011, 476–482. [Google Scholar] [CrossRef] [PubMed]
- Mrđanin, T.; Nikolić, O.; Molnar, U.; Mitrović, M.; Till, V. Diffusion-Weighted Imaging in the Assessment of Renal Function in Patients with Diabetes Mellitus Type 2. Magn. Reson. Mater. Phys. Biol. Med. 2020. [Google Scholar] [CrossRef]
- Wang, Y.C.; Feng, Y.; Lu, C.Q.; Ju, S. Renal Fat Fraction and Diffusion Tensor Imaging in Patients with Early-Stage Diabetic Nephropathy. Eur. Radiol. 2018, 28, 3326–3334. [Google Scholar] [CrossRef]
- Hueper, K.; Hartung, D.; Gutberlet, M.; Gueler, F.; Sann, H.; Husen, B.; Wacker, F.; Reiche, D. Magnetic Resonance Diffusion Tensor Imaging for Evaluation of Histopathological Changes in a Rat Model of Diabetic Nephropathy. Investig. Radiol. 2012, 47, 430–437. [Google Scholar] [CrossRef] [PubMed]
- Kaimori, J.-Y.; Isaka, Y.; Hatanaka, M.; Yamamoto, S.; Ichimaru, N.; Fujikawa, A.; Shibata, H.; Fujimori, A.; Miyoshi, S.; Yokawa, T.; et al. Visualization of Kidney Fibrosis in Diabetic Nephropathy by Long Diffusion Tensor Imaging MRI with Spin-Echo Sequence OPEN. Sci. Rep. 2017, 7, 5731. [Google Scholar] [CrossRef] [PubMed]
- Yan, Y.Y.; Hartono, S.; Hennedige, T.; Koh, T.S.; Chan, C.M.; Zhou, L.; Rumpel, H.; Martarello, L.; Khoo, J.B.; Koh, D.M.; et al. Intravoxel Incoherent Motion and Diffusion Tensor Imaging of Early Renal Fibrosis Induced in a Murine Model of Streptozotocin Induced Diabetes. Magn. Reson. Imaging 2017, 38, 71–76. [Google Scholar] [CrossRef]
- Berchtold, L.; Friedli, I.; Crowe, L.A.; Martinez, C.; Moll, S.; Hadaya, K.; De Perrot, T.; Combescure, C.; Martin, P.Y.; Vallée, J.P.; et al. Validation of the Corticomedullary Difference in Magnetic Resonance Imaging-Derived Apparent Diffusion Coefficient for Kidney Fibrosis Detection: A Cross-Sectional Study. Nephrol. Dial. Transplant. 2020, 35. [Google Scholar] [CrossRef]
- Prasad, P.V.; Thacker, J.; Li, L.P.; Haque, M.; Li, W.; Koenigs, H.; Zhou, Y.; Sprague, S.M. Multi-Parametric Evaluation of Chronic Kidney Disease by MRI: A Preliminary Cross-Sectional Study. PLoS ONE 2015, 10, e0139661. [Google Scholar] [CrossRef]
- Cakmak, P.; Yagci, A.B.; Dursun, B.; Herek, D.; Fenkci, S.M. Renal Diffusion-Weighted Imaging in Diabetic Nephropathy: Correlation with Clinical Stages of Disease. Diagn. Interv. Radiol. 2014, 20, 374–378. [Google Scholar] [CrossRef] [PubMed]
- Prasad, P.V.; Li, W.; Raj, D.S.; Carr, J.; Carr, M.; Thacker, J.; Li, L.P.; Wang, C.; Sprague, S.M.; Ix, J.H.; et al. Multicenter Study Evaluating Intrarenal Oxygenation and Fibrosis Using Magnetic Resonance Imaging in Individuals with Advanced CKD. Kidney Int. Rep. 2018. [Google Scholar] [CrossRef] [PubMed]
- Chen, X.; Xiao, W.; Li, X.; He, J.; Huang, X.; Tan, Y. In Vivo Evaluation of Renal Function Using Diffusion Weighted Imaging and Diffusion Tensor Imaging in Type 2 Diabetics with Normoalbuminuria versus Microalbuminuria. Front. Med. 2014, 8, 471–476. [Google Scholar] [CrossRef] [PubMed]
- Razek, A.A.K.A.; Al-Adlany, M.A.A.A.; Alhadidy, A.M.; Atwa, M.A.; Abdou, N.E.A. Diffusion Tensor Imaging of the Renal Cortex in Diabetic Patients: Correlation with Urinary and Serum Biomarkers. Abdom. Radiol. 2017, 42, 1493–1500. [Google Scholar] [CrossRef] [PubMed]
- Zhou, H.; Zhang, J.; Zhang, X.M.; Chen, T.; Hu, J.; Jing, Z.; Jian, S. Noninvasive Evaluation of Early Diabetic Nephropathy Using Diffusion Kurtosis Imaging: An Experimental Study. Eur. Radiol. 2020, 1–8. [Google Scholar] [CrossRef] [PubMed]
- Wheeler, D.C.; James, J.; Patel, D.; Viljoen, A.; Ali, A.; Evans, M.; Fernando, K.; Hicks, D.; Milne, N.; Newland-Jones, P.; et al. SGLT2 Inhibitors: Slowing of Chronic Kidney Disease Progression in Type 2 Diabetes. Diabetes 2020, 11, 2757–2774. [Google Scholar] [CrossRef]
- DeFronzo, R.A.; Reeves, W.B.; Awad, A.S. Pathophysiology of Diabetic Kidney Disease: Impact of SGLT2 Inhibitors. Nat. Rev. Nephrol. 2021. [Google Scholar] [CrossRef] [PubMed]
- Niles, D.J.; Artz, N.S.; Djamali, A.; Sadowski, E.A.; Grist, T.M.; Fain, S.B. Longitudinal Assessment of Renal Perfusion and Oxygenation in Transplant Donor-Recipient Pairs Using Arterial Spin Labeling and Blood Oxygen Level-Dependent Magnetic Resonance Imaging. Investig. Radiol. 2016, 51, 113–120. [Google Scholar] [CrossRef]
- Su, C.H.; Hsu, Y.C.; Thangudu, S.; Chen, W.Y.; Huang, Y.T.; Yu, C.C.; Shih, Y.H.; Wang, C.J.; Lin, C.L. Application of Multiparametric MR Imaging to Predict the Diversification of Renal Function in MiR29a-Mediated Diabetic Nephropathy. Sci. Rep. 2021, 11. [Google Scholar] [CrossRef]
- Bjornstad, P.; Škrtić, M.; Lytvyn, Y.; Maahs, D.M.; Johnson, R.J.; Cherney, D.Z.I. The Gomez Equations and Renal Hemodynamic Function in Kidney Disease Research. Am. J. Physiol. Renal Physiol. 2016, 311, F967–F975. [Google Scholar] [CrossRef] [PubMed]
- Ries, M.; Basseau, F.; Tyndal, B.; Jones, R.; Deminière, C.; Catargi, B.; Combe, C.; Moonen, C.W.T.T.; Grenier, N. Renal Diffusion and BOLD MRI in Experimental Diabetic Nephropathy. Blood Oxygen Level-Dependent. J. Magn. Reson. Imaging 2003, 17, 104–113. [Google Scholar] [CrossRef]
- Warner, L.; Glockner, J.F.; Woollard, J.; Textor, S.C.; Romero, J.C.; Lerman, L.O. Determinations of Renal Cortical and Medullary Oxygenation Using Blood Oxygen Level-Dependent Magnetic Resonance Imaging and Selective Diuretics. Investig. Radiol. 2011, 46, 41–47. [Google Scholar] [CrossRef] [PubMed]
- Peng, X.-G.; Bai, Y.-Y.; Fang, F.; Wang, X.-Y.; Mao, H.; Teng, G.-J.; Ju, S. Renal Lipids and Oxygenation in Diabetic Mice: Noninvasive Quantification with MR Imaging. Radiology 2013, 269, 748–757. [Google Scholar] [CrossRef]
- Wang, J.H.; Ren, K.; Sun, W.G.; Zhao, L.; Zhong, H.S.; Xu, K. Effects of Iodinated Contrast Agents on Renal Oxygenation Level Determined by Blood Oxygenation Level Dependent Magnetic Resonance Imaging in Rabbit Models of Type 1 and Type 2 Diabetic Nephropathy. BMC Nephrol. 2014, 15, 140. [Google Scholar] [CrossRef] [PubMed]
- Gooding, K.M.; Lienczewski, C.; Papale, M.; Koivuviita, N.; Maziarz, M.; Dutius Andersson, A.M.; Sharma, K.; Pontrelli, P.; Garcia Hernandez, A.; Bailey, J.; et al. Prognostic Imaging Biomarkers for Diabetic Kidney Disease (IBEAt): Study Protocol. BMC Nephrol. 2020, 21, 242. [Google Scholar] [CrossRef]
- Wang, F.; Katagiri, D.; Li, K.; Takahashi, K.; Wang, S.; Nagasaka, S.; Li, H.; Quarles, C.C.; Zhang, M.Z.; Shimizu, A.; et al. Assessment of Renal Fibrosis in Murine Diabetic Nephropathy Using Quantitative Magnetization Transfer MRI. Magn. Reson. Med. 2018, 80, 2655–2669. [Google Scholar] [CrossRef]
- Kodama, Y.; Hyodo, F.; Yamato, M.; Yasukawa, K.; Minami, Y.; Sonoda, N.; Ogawa, Y.; Ichikawa, K.; Inoguchi, T. Dynamic Nuclear Polarization Magnetic Resonance Imaging and the Oxygen-Sensitive Paramagnetic Agent OX63 Provide a Noninvasive Quantitative Evaluation of Kidney Hypoxia in Diabetic Mice. Kidney Int. 2019, 96, 787–792. [Google Scholar] [CrossRef]
- Prasad, P.V. Update on renal blood oxygenation level-dependent MRI to assess intrarenal oxygenation in chronic kidney disease. Kidney Int. 2018, 93, 778–780. [Google Scholar] [CrossRef]


Publisher’s Note: MDPI stays neutral with regard to jurisdictional claims in published maps and institutional affiliations. |
© 2021 by the authors. Licensee MDPI, Basel, Switzerland. This article is an open access article distributed under the terms and conditions of the Creative Commons Attribution (CC BY) license (https://creativecommons.org/licenses/by/4.0/).
Share and Cite
Mora-Gutiérrez, J.M.; Fernández-Seara, M.A.; Echeverria-Chasco, R.; Garcia-Fernandez, N. Perspectives on the Role of Magnetic Resonance Imaging (MRI) for Noninvasive Evaluation of Diabetic Kidney Disease. J. Clin. Med. 2021, 10, 2461. https://doi.org/10.3390/jcm10112461
Mora-Gutiérrez JM, Fernández-Seara MA, Echeverria-Chasco R, Garcia-Fernandez N. Perspectives on the Role of Magnetic Resonance Imaging (MRI) for Noninvasive Evaluation of Diabetic Kidney Disease. Journal of Clinical Medicine. 2021; 10(11):2461. https://doi.org/10.3390/jcm10112461
Chicago/Turabian StyleMora-Gutiérrez, José María, María A. Fernández-Seara, Rebeca Echeverria-Chasco, and Nuria Garcia-Fernandez. 2021. "Perspectives on the Role of Magnetic Resonance Imaging (MRI) for Noninvasive Evaluation of Diabetic Kidney Disease" Journal of Clinical Medicine 10, no. 11: 2461. https://doi.org/10.3390/jcm10112461
APA StyleMora-Gutiérrez, J. M., Fernández-Seara, M. A., Echeverria-Chasco, R., & Garcia-Fernandez, N. (2021). Perspectives on the Role of Magnetic Resonance Imaging (MRI) for Noninvasive Evaluation of Diabetic Kidney Disease. Journal of Clinical Medicine, 10(11), 2461. https://doi.org/10.3390/jcm10112461