Abstract
The calcineurin inhibitor tacrolimus is included in most immunosuppressive protocols after liver transplantation. This retrospective, observational 24-month study investigated the tolerability of once-daily MeltDose® prolonged-release tacrolimus (LCPT) after switching from twice-daily immediate-release tacrolimus (IR-Tac) in a real-world cohort of 150 patients with previous liver transplantation. No graft rejection or new safety signals were observed. Only 7.3% of patients discontinued LCPT due to side effects. In the overall patient population, median liver transaminases, total cholesterol, triglycerides, glucose, and HbA1c remained constant after switching to LCPT. Total cholesterol significantly decreased (p ≤ 0.002) in patients with initially elevated levels (>200 mg/dL). A total of 71.8% of 96 patients maintained a glomerular filtration rate > 60 mL/min/1.73 m2 throughout the study, while 44.7% of patients were classified as fast metabolizers and 55.3% as slow metabolizers. Median daily tacrolimus dose could be reduced by 50% in fast metabolizers and by 30% in slow metabolizers, while trough levels were maintained in the target range (4–6 ng/mL). In conclusion, our observational study confirmed previous evidence of good overall tolerability and a favorable outcome for the patients after switching from IR-Tac to LCPT after liver transplantation.
1. Introduction
Liver transplantation is a life-saving treatment for patients with end stage liver disease and liver failure. In addition, it may cure some hereditary metabolic disorders and malignancies involving the liver in selected patients. Advances in post-transplant immunosuppression and individual tailoring of immunosuppression regimens balancing benefits and potential harm of therapy have contributed to the improvement of survival rates after liver transplantation [].
The calcineurin inhibitor (CNI) tacrolimus is highly effective in preventing acute rejection after liver transplantation [,,]. It is included in most combination regimens of immunosuppressive drugs, both early after liver transplantation and as part of long-term maintenance regimens [,,]. However, due to its intra- and interindividual pharmacokinetic variability and narrow therapeutic window, frequent monitoring of drug levels and dose adjustments are mandatory. Whereas suboptimal tacrolimus levels may result in graft rejection, increased levels are associated with delayed graft function, metabolic disturbances, and other complications or with nephrotoxicity []. Tacrolimus metabolism is controlled by many factors, particularly by cytochrome P450 enzymes []. In liver transplantation, fast metabolizers (defined by a ratio of blood trough concentration normalized by the daily dose (C/D ratio) <1.09 ng/mL × 1/mg) require higher doses of tacrolimus to attain the intended trough level as compared with slow metabolizers. Higher doses of immediate-release twice-daily tacrolimus (IR-Tac) in fast metabolizers are associated with increased peak tacrolimus concentrations in achieving the same target trough as slow metabolizers [,]. Moreover, fast tacrolimus metabolism is considered a potential risk factor for CNI nephrotoxicity and BK-polyomavirus (BKV) infection [,].
To overcome drawbacks of tacrolimus, immunosuppression protocols with dose reduction, switch and elimination of the agent, as well as a combination of reduced-dose tacrolimus and mechanistic target of rapamycin (mTOR) inhibitors have been investigated [,]. In addition, different galenic formulations have been developed, such as the once-daily prolonged-release tacrolimus created with MeltDose® technology (LCPT) []. Due to the decreased particle size and increased surface/volume ratio of LCPT, this galenic formulation is associated with enhanced bioavailability of tacrolimus by about 40% compared to IR-Tac, allowing for a dose reduction of up to 30% []. Moreover, immunosuppressive therapy with LCPT delivers smooth tacrolimus levels with significantly fewer peak and trough-to-peak fluctuations [,].
The aim of this study was to investigate tolerability of LCPT including renal function and metabolic parameters as well as recipient graft function and adherence to immunosuppressive therapy in a large real-world cohort of patients with previous liver transplantation.
2. Materials and Methods
2.1. Patients
Inclusion criteria were adult patients (≥18 years) after receiving a liver with stable graft function (>6 months) who were converted to Envarsus to improve the adherence to treatment (in the case of Prograf) or for suspected toxicity or low bioavailability. All patients were cared for at the interdisciplinary liver transplantation outpatient service of the university clinic of Essen, Germany. Patient care, diagnostics, treatment, and assessment of data followed routine care of these patients. Written informed consent was obtained from all patients prior to inclusion.
2.2. Study Design
This was a retrospective single-center, observational, single-arm phase 4 study. Data were from consecutive patients who visited the outpatient service within 2 years between December 2015 and December 2017. Patients, who regularly attended the aftercare clinic, were assessed, of whom 150 fulfilled the selection criteria and were included in this study (Figure 1). Patients had been on a stable dose of conventional immunosuppressive treatment with twice-daily IR-Tac (Prograf®, Astellas, Munich, Germany) and showed stable tacrolimus trough concentrations within the target range of 4 to 6 ng/mL. They were then switched to MeltDose® LCPT (Envarsus®, Chiesi, Hamburg, Germany) based on a conversion factor of 1:0.7 (mg/mg), and LCPT dose was adjusted individually in order to achieve tacrolimus trough concentrations within the target range. The administration of tacrolimus formulations to the patients followed clinical criteria and did not depend on their participation in this study. Concomitant medication remained unchanged.
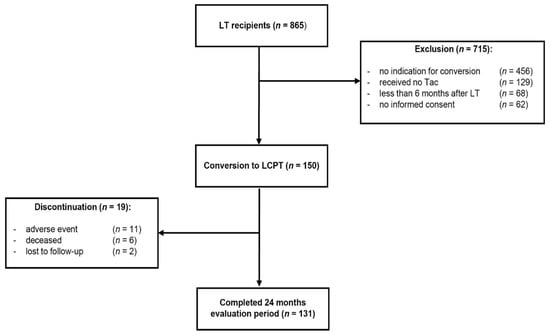
Figure 1.
Study design. A total of 865 liver transplant (LT) recipients were screened for eligibility. During the enrolment 150 patients fulfilled the inclusion criteria and were switched to once-daily MeltDose® tacrolimus (LCPT). Clinical data were analyzed in a 24-month follow-up.
The primary aim of the study was to assess tolerability of LCPT and graft function within the 24-month observational period. Other endpoints included association of tacrolimus-based immunosuppression and occurrence of specific adverse events such as change of renal function, infections, or hematological alterations.
This study was conducted in compliance with independent ethics committees/institutional review boards (Ethics committee of the University Hospital Essen (AZ 16-6815-BO)), informed consent regulations, the Declaration of Helsinki (Version 2013), and International Conference on Harmonisation (ICH) Good Clinical Practice (GCP) Guidelines.
2.3. Assessments
Assessments included baseline patient characteristics such as age, sex, and medical history as well as indication for transplantation, date of transplantation, co-morbidities, adverse events, heart rate, and body mass index (BMI). Laboratory assessments included blood count, serum creatinine, and glomerular filtration rate (GFR) calculated by using the modification of diet in renal disease (MDRD) formula as parameters of kidney function; aspartate amino transferase (AST), alanine amino transferase (ALT), gamma-glutamyl transferase (GGT), and alkaline phosphatase (AP) as parameters of graft function; cholesterol and triglycerides as parameters of lipid metabolism; and random blood glucose and HbA1c as parameters of glucose metabolism as well as measurement of electrolytes, in particularly potassium because it is known that tacrolimus may cause an increase in potassium levels in the blood. Patients were followed up with laboratory checks weekly for the first 2 months and every 3 months afterwards. Liver biopsy was limited to those patients developing symptoms and with increased liver values.
Adherence to treatment was assessed using an extended version of the Morisky Medication Adherence Score [,].
The metabolic rate of tacrolimus was defined as the blood concentration normalized by the daily dose of tacrolimus (C/D ratio), expressed as ng/mL × 1/mg. Patients were classified as “fast” metabolizers or “slow” metabolizers based on their individual C/D ratio values according to the method described by Thölking et al. [].
2.4. Statistical Analysis
Results are displayed as boxplots showing medians and 95% confidence intervals (CIs) of respective blood levels with respect to time as well as to normal or increased values at baseline. Median values and 95% CI ranges in brackets are shown according to the respective time points.
All values were used for statistical analysis, but for clarity outliers are not shown. Normal values or cutoffs of laboratory parameters are indicated by a dashed line. Multiple grouped variables were analyzed by repeated measures analysis of variance (ANOVA). Statistical significance was defined as a p value ≤ 0.05. The effect size (ES) is indicated by Cohen’s f Values of 0.10, 0.25, and 0.4, which are defined by Cohen as small, medium, and large ES [].
3. Results
3.1. Patient Characteristics
A total of 150 patients were included in the study and switched to LCPT. A total of 62% of patients were male, while 38% were female (Table 1). Mean age was 55 (range, 18–77) years. About half of the patients were switched within 1–5 years after transplantation to LCPT-based immunosuppression. After liver transplantation, 22% of patients were switched within 12 months, while 27.3% of patients were switched later than five years after transplantation. At baseline, 26% of patients received mycophenolate mofetil (Roche, Basel, Swizerland) and 10% prednisolon (5 mg per day).

Table 1.
Baseline patient characteristics.
The most frequent indications for liver transplantation were alcoholic liver cirrhosis in 22% of patients, hepatocellular carcinoma in 21.3%, and autoimmune liver disease (primary biliary cirrhosis (PBC)/primary sclerosing cholangitis (PSC)/autoimmune hepatitis (AIH)) in 16% of patients (Table 1).
3.2. Patient Disposition and Adherence
Nineteen (12.7%) patients discontinued treatment with LCPT. In 11 (7.3%) patients, discontinuation was due to adverse effects between week 4 and month 18 after switching therapy. Two patients were lost to follow-up in months 6 and 12, respectively. Six patients died during the observational period.
Adherence to treatment was high throughout the study, with the mean ECS being 5 (range, 0–24) at the time of switching and 5 (range, 0–33) one year after switching to LCPT.
3.3. Liver Graft Function
No rejection of the liver graft was observed in any of the patients. When switching treatment, all patients had normal liver function tests except for 8.4% of patients with elevated AST, 10.7% of patients with elevated ALT, and 19.8% of patients with elevated GGT levels (Figure 2D–F). After switching from IR-Tac to LCPT, median levels of AST, ALT, and GGT remained almost unchanged and within the normal range in the whole study population during the 24-month observational period (Figure 2A–C). Patients with normal (AST: ≤50 U/L, ALT: ≤50 U/L; GGT: ≤55 U/L) or increased transaminases at the time of switching did not show any change of median transaminase levels between baseline and month 24 after switching from IR-Tac to LCPT (Figure 2D–F).
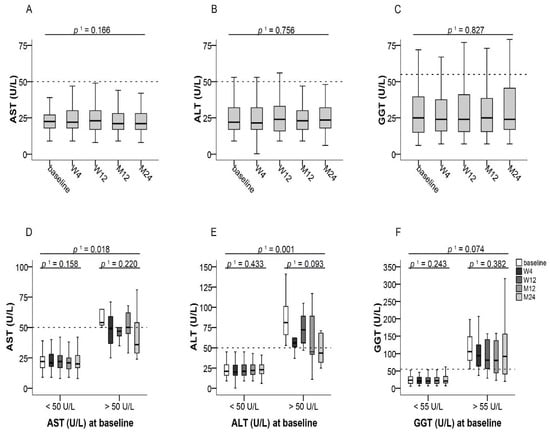
Figure 2.
Liver transaminases after switching to LCPT. (A–C): Boxplots show median values with 95% CI for AST, ALT, and GGT at the baseline visit as well as at weeks 4 and 12 and at months 12 and 24; (D–F): Boxplots show median values with 95% CI for AST, ALT, and GGT according to normal or increased transaminase values at baseline. 1 with Greenhouse–Geisser correction; ALT: alanine amino transferase, AST: aspartate amino transferase, GGT: gamma-glutamyl transferase, LCPT: once-daily MeltDose® prolonged-release tacrolimus, M: month, W: week.
3.4. Kidney Function
Baseline serum creatinine concentrations were normal (≤1.3 mg/dL) in 97 (74.0%) patients at the time of switching from IR-Tac to LCPT. Patients with normal serum creatinine at baseline (≤1.3 mg/dL) showed a slight increase of median serum creatinine by 0.07 from 0.99 (95% CI, 0.63–1.28) to 1.06 mg/dL (95% CI, 0.64–2.0) at month 24 (p ≤ 0.001, f = 0.23) within the normal range (Figure 2F and Figure 3B). In patients whose serum creatinine was increased at baseline (>1.3 mg/dL), a slight increase by 0.02 mg/dL of median serum creatinine from 1.57 (95% CI, 1.3–3.1) to 1.59 mg/dL (95% CI, 1.59–4.52) at month 24 (p ≤ 0.01, f = 0.11) was also observed (Figure 3B). At baseline, 54 (36.0%) patients had a reduced GFR ≤ 60 mL/min/1.73 m2. Of these, 5.5% experienced an improvement of kidney function to a GFR > 60 mL/min/1.73 m2. Reasons for treatment discontinuation in seven patients with GFR < 60 mL/min/1.73 m2 were asthenia, diarrhea, and musculoskeletal complaints, while one patient was lost to follow-up and four died over the course of the study (Figure 3C). Ninety-six (64.0%) patients initially showed a GFR of >60 mL/min/1.73 m2 at baseline. Of those, 71.8% of patients maintained a stable GFR of >60 mL/min/1.73 m2 until month 24. Nine patients with GFR > 60 mL/min/1.73 m2 discontinued treatment due to adverse events such as headache, insomnia, and hair loss, two patients died, and one patient was lost to follow-up (Figure 3D).
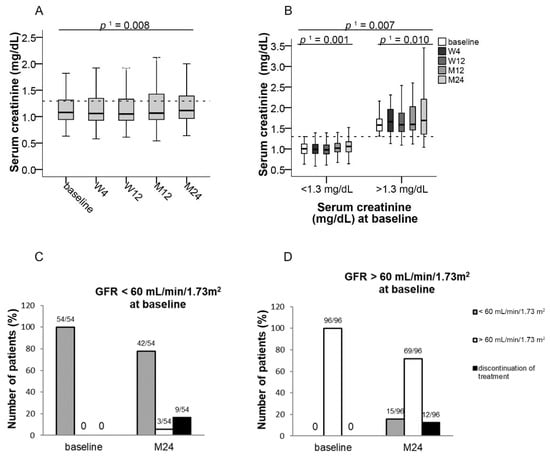
Figure 3.
Median serum creatinine and GFR after switching to LCPT at the baseline visit as well as at weeks 4 and 12 and at months 12 and 24. Boxplots show median values with 95% CI (A) for serum creatinine and (B) for serum creatinine according to normal or increased values at baseline; (C,D) show the number of patients for GFR categories < or > 60 mL/min/1.73 m2 at baseline and at 24 months who initially (C) had a GFR < 60 mL/min/1.73 m2 or (D) had a GFR > 60 mL/min/1.73 m2; 1 with Greenhouse–Geisser correction; GFR: glomerular filtration rate, LCPT: once-daily MeltDose® prolonged-release tacrolimus, M: month, W: week.
3.5. Lipid and Glucose Metabolism
Median cholesterol and triglyceride levels remained unchanged over the study period in the whole study population (Figure 4A,B). Median cholesterol levels of all patients were 193 mg/dL (95% CI, 83–318) at baseline and 189 mg/dL (95% CI, 89–360) at month 24 (Figure 4A). Median triglyceride levels were 133 mg/dL (95% CI, 37–677) at baseline and 129 mg/dL (95% CI, 39–709) at month 24 (Figure 4B).
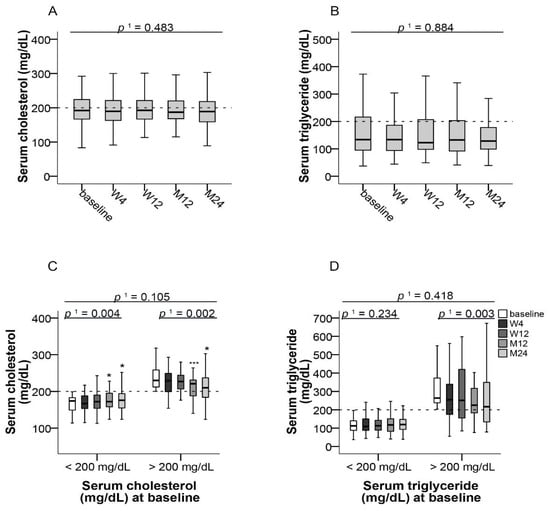
Figure 4.
Blood lipids after switching to LCPT. (A) Boxplots show median values with 95% CI for cholesterol and (B) triglycerides at the baseline visit as well as at weeks 4 and 12 and at months 12 and 24; (C) Boxplots show median values with 95% CI for cholesterol and (D) triglycerides according to normal or increased respective values at baseline. 1 with Greenhouse–Geisser correction; * p ≤ 0.05, *** p ≤ 0.001; LCPT: once-daily MeltDose® prolonged-release tacrolimus, M: month, W: week.
55.7% and 69.5% of patients had normal cholesterol and triglyceride levels (≤200 mg/dL, each), respectively, at baseline. Significant decreases of median cholesterol levels from baseline to month 24 (p ≤ 0.004, f = 0.26 and p ≤ 0.002, f = 0.46 respectively) were observed both in patients who had cholesterol concentrations ≤200 mg/dL as well as in those with >200 mg/dL at baseline (Figure 4C). No significant changes of triglyceride levels were observed in patients with normal triglyceride levels at baseline, whereas patients with increased triglyceride levels at base showed a significant reduction (p ≤ 0.003; Figure 4D).
Median blood glucose concentration of all patients remained nearly unchanged after switch to LCPT over the observational period (Figure 5A). A total of 61.8% of patients initially had blood glucose concentrations within the reference range (74–109 mg/dL) and these remained within this range during the observational period in these patients. Median blood glucose values were 88 mg/dL (95% CI, 74–108) at baseline and 87 mg/dL (95% CI, 61–221) at month 24 (Figure 5C). In patients with low (<74 mg/dL), normal (74–109 mg/dL), or high (>109 mg/dL) blood glucose levels at baseline, no significant change of median blood glucose was observed throughout the study (Figure 5C). In patients with initially low blood glucose levels, a slight increase within the normal reference range was observed.
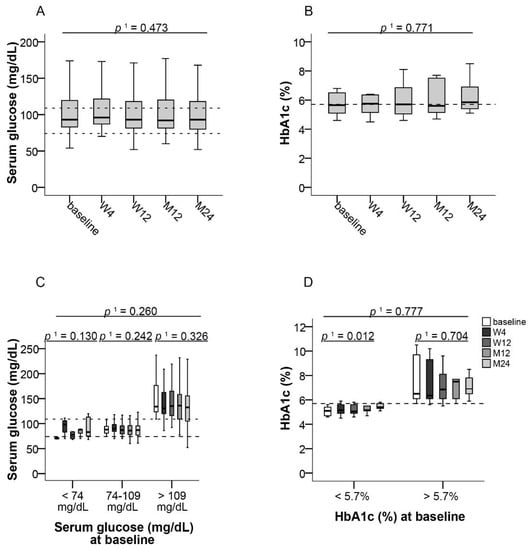
Figure 5.
Parameters of glucose metabolism after switching to LCPT. (A) Boxplots show median values with 95% CI for blood glucose and (B) HbA1c at the baseline visit as well as at weeks 4 and 12 and at months 12 and 24; Boxplots show median values with 95% CI for (C) blood glucose and (D) HbA1c according to normal or increased respective values at baseline. 1 with Greenhouse–Geisser correction; LCPT: once-daily MeltDose® prolonged-release tacrolimus, M: month, W: week.
No significant change of HbA1c was observed in the whole study population from baseline to month 24 (Figure 5B). In patients with an initial HbA1c level ≤5.7%, median HbA1c values significantly increased by 0.3% from 5.1% (95% CI, 4.6–5.6) to 5.4% (95% CI, 5.1–5.8) at month 24 (p ≤ 0.012, f = 0.92), whereas no change was observed in patients who initially had HbA1c values >5.7% (Figure 5D).
3.6. Electrolytes
Median potassium levels were constant during the 24-month observational period in the whole study population (Table 2 and Figure 6A). No change was observed in patients with normal potassium levels (3.5–5.1 mmol/L) at baseline, whereas patients with initially increased potassium levels showed a significant decrease of median potassium by 0.6 from 5.5 (95% CI, 5.3–6.0) to 4.9 mmol/L (95% CI, 4.0–5.6) at month 24 (p ≤ 0.006, f = 0.74) (Figure 6B).
Table 2.
Laboratory parameters at baseline and at 24 months after switching to LCPT.
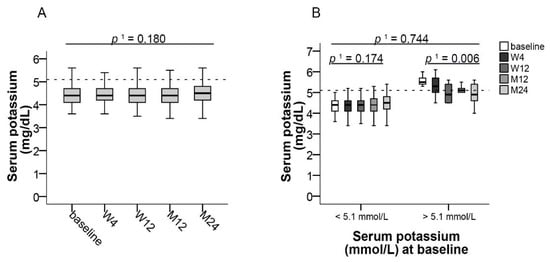
Figure 6.
Potassium levels after switching LCPT. Boxplots show median values with 95% CI for (A) potassium levels and (B) for potassium according to normal or increased values at baseline, both at the baseline visit as well as at weeks 4 and 12 and at months 12 and 24. 1 with Greenhouse–Geisser correction; LCPT: once-daily MeltDose® prolonged-release tacrolimus, M: month, W: week.
3.7. Trough Levels and Metabolism of Tacrolimus
Patients were either considered “fast” metabolizers, if the C/D ratio was below the median of 2.2 ng/mL × 1/mg, or “slow” metabolizers, if the C/D ratio was 2.2 ng/mL × 1/mg or above. According to individual C/D ratios, 67 (44.7%) patients were classified as fast metabolizers and 83 (55.3%) patients as slow metabolizers (Figure 7).
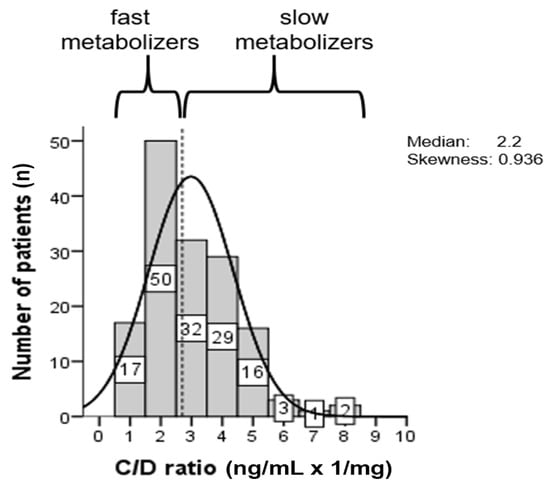
Figure 7.
Histogram of the distribution of the tacrolimus C/D ratio (ng/mL × 1/mg). The patients were categorized according to the median value (dashed line) as slow or fast metabolizers []. Patients showing a C/D ratio <2.2 were defined as fast metabolizers and patients showing a C/D ratio ≥2.2 as slow metabolizers.
In fast metabolizers, median daily tacrolimus dose was significantly reduced by 1 mg (50%) from 3 mg (95% CI, 1–6) at baseline to 2 mg (95% CI, 0.75–6) at month 24 (p ≤ 0.003, f = 0.62). In slow metabolizers, median daily dose was non-significantly reduced by 0.5 mg from 1.5 mg (95% CI, 0.75–3) at baseline to 1 mg (95% CI, 0.75–4.6) at month 24 (Figure 8A). Median tacrolimus trough levels remained within the target range of 4 to 6 ng/mL throughout the study in both fast metabolizers (baseline: 3.7 mg/dL, 95% CI, 1.2–7.6; month 24: 4.2 ng/dL, 95% CI, 1.4–7.5) and slow metabolizers (baseline: 4.5 ng/dL, 95% CI, 1.6–12.0; month 24: 4.6 ng/dL, 95% CI, 1.5–11.9) (Figure 8B).
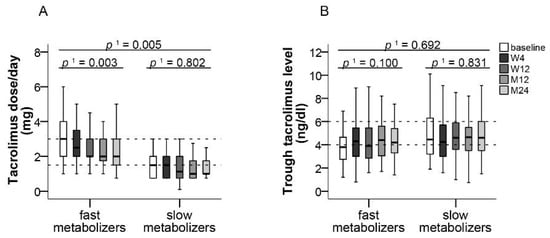
Figure 8.
Tacrolimus dose and trough level in slow and fast metabolizers. Boxplots show median values with 95% CI for (A) tacrolimus dose and (B) tacrolimus trough level according to the categories of slow and fast metabolizers, both at the baseline visit as well as at weeks 4 and 12 and at months 12 and 24. 1 with Greenhouse–Geisser correction; M: month, W: week.
3.8. Adverse Events
No new safety signals for LCPT were observed during the study, and no severe adverse events were reported throughout the study. In particular, no infection and no hematological alterations (Table 2) were reported. Eleven (7.3%) patients discontinued the study prematurely due to adverse events with no difference between fast and slow metabolizers (p ≤ 0.534). Adverse events resulting in treatment discontinuation included asthenia (18.2%) and diarrhea (18.2%), headache (18.2%), facial edema (9.1%) and insomnia (9.1%), hair loss (9.1%), and musculoskeletal complaints (9.1%). For the 11 patients that discontinued the study, we found no association with the etiology of liver disease, gender, or time after LT.
Six (4.0%) patients died during the study due to multiorgan failure, relapse of advanced hepatocellular carcinoma, staphylococcal endocarditis, or suicide. In these patients, death was not considered to be related to therapy.
4. Discussion
In this observational study, the switch of immunosuppressive regimens that included IR-Tac to LCPT after liver transplantation was associated with favorable tolerability and graft function within a 2-year observation period.
No new safety signals were observed in our study. No biopsy proven acute rejection (BPAR) was observed during the study period. However, nine patients showed an increase in GGT, which was due to PSC recurrence (n = 3/9), co-medication (n = 3/9), and ischemic like biliary lesion (ITBL) (n = 3/9).
Only 11 patients discontinued LCPT treatment due to side effects, and death in six patients was considered not related to treatment. Thus, we confirm previous findings of good overall tolerability of LCPT in patients after solid organ transplantation [,], which is likely due to its smooth pharmacokinetic profile and fewer peak-to-trough fluctuations [,]. Accordingly, switching immunosuppressive therapy from IR-Tac or ER-Tac to LCPT has been shown to be associated with significantly lower peak-related toxicity such as tremors, concentration difficulties, headache, and insomnia [,].
Switching from IR-Tac to LCPT was associated with a slight increase of median serum creatinine and a higher proportion of patients experiencing GFR reduction at the end of the study. The serum creatinine values stayed within the reference range. The small effect size indicates that the difference between baseline is negligible over time, despite its statistical significance. In previous studies investigating conversion from IR-Tac to LCPT, no renal function data were presented in a 53-week study in liver transplant recipients [], and in kidney transplant patients a slight but significant increase of mean serum creatinine from 1.56 to 1.61 mg/dL (p < 0.05) was observed in a retrospective cohort study in kidney transplant recipients with no changes of GFR []. Furthermore, a randomized trial in kidney transplant recipients showed similar estimated GFR (eGFR) between LCPT and IR-Tac patients [,], and a systematic review of 10 observational studies did not show differences between IR-Tac and extended-release (ER-)Tac in renal function in adult kidney de novo transplantations []. Therefore, our data indicate a minor effect of switching from IR-Tac to LCPT on renal function in liver transplant recipients. Differences may be due to different patient populations included. Recently Einsiedel et al. demonstrated in 61 patients an improvement of the mean GFR (+4.7 mL/min/1.73 m2) 12 months after conversion to LCTP in comparison to the control group with standard release TAC [].
Dysregulated glucose and lipid metabolism are well-recognized complications of organ transplantation and immunosuppression []. In particular, glucocorticoids and CNIs have been shown to affect glucose metabolism after solid organ transplantation []. Treatment with tacrolimus has been associated with hyperlipidemia, but its occurrence is less severe and less common than with cyclosporine [,]. Whereas in our overall study population median total cholesterol levels remained normal, patients who initially were hypercholesterolemic experienced a significant improvement of median total cholesterol after switching to LCPT. Blood glucose levels did not change significantly, irrespective of initial glycemic status, and a slight increase of HbA1c within the normal reference range in patients with normal HbA1c levels prior to switching could be seen. Therefore, throughout our study, only minor changes of glucose and lipid metabolism were observed. However, hypercholesterolemic patients may benefit from switching to LCPT.
Minimization of CNI doses has been identified as one option to reduce CNI toxicity [,]. Switching to LCPT has been shown to allow for lower tacrolimus dosing in transplant patients due to better bioavailability. In head-to-head comparisons of renal transplant recipients, LCPT treatment was associated with dose reductions by approximately 30% vs. IR-Tac and by 40% vs. once-daily ER-Tac [,]. This is particularly important for patients classified as fast metabolizers who generally require higher IR-Tac doses and who are jeopardized by increased nephrotoxicity [,]. In our study, median tacrolimus dose could be reduced by 50% in fast metabolizers, who comprised 50% of the patients, and by 30% in slow metabolizers. Despite dose reductions, no graft rejection occurred within the observation period. Lower tacrolimus dosing may also have contributed to the good overall long-term tolerability of LCPT. In accordance with previous observations, median trough levels of tacrolimus remained within the target range in both fast and slow metabolizers despite dose reductions [,]. Identification of fast metabolizers and optimization of tacrolimus formulation could therefore provide a strategy to improve graft survival [].
The limitations of this study mainly are due to its observational nature and the lack of randomization, which are associated with limited control over data collection. Moreover, our study was conducted at a single center, which limits the generalization of our results to other institutions or populations. On the other hand, the strengths of our study are that adherence was assessed in all patients and that all measurements were performed by the same staff and with the same assays. In addition, by including consecutive patients for conversion to LCPT, selection bias could be avoided.
5. Conclusions
In conclusion, our observational study confirms previous evidence of good tolerability and a favorable outcome for patients after switching from IR-Tac to LCPT after liver transplantation. This was associated with dose reductions particularly in fast metabolizers. The dose reduction moreover may contribute to the low occurrence of complications. Clinical parameters of graft function and metabolic profiles essentially remained unchanged, and LCPT did not adversely affect kidney function.
Author Contributions
A.F., K.W.: Performed research, collected data, analyzed data, and edited manuscript; A.H.: Collected and analyzed data; F.S.: Designed research; K.H.: Designed research, collected data, analyzed data, and wrote and edited manuscript. All authors have read and agreed to the published version of the manuscript.
Funding
This study was funded by Chiesi GmbH.
Institutional Review Board Statement
This study was conducted in compliance with independent ethics commit-tees/institutional review boards (Ethics committee of the University Hospital Essen (AZ 16-6815-BO)).
Informed Consent Statement
This study was informed consent regulations, the Declaration of Helsinki (Version 2013), and International Conference on Harmonisation (ICH) Good Clinical Practice (GCP) Guidelines.
Acknowledgments
The authors thank all patients involved in the study, as well as their caregivers, care team, investigators and research staff in participating institutions. The authors thank Joachim Sauer for providing medical writing support, which was sponsored by Chiesi GmbH in accordance with Good Publication Practice guidelines.
Conflicts of Interest
The authors declare no conflict of interest. The funders had no role in the design of the study; in the collection, analyses, or interpretation of data; in the writing of the manuscript, or in the decision to publish the results.
References
- Seehofer, D.; Schoning, W.; Neuhaus, P. Deceased donor liver transplantation. Chirurg 2013, 84, 391–397. [Google Scholar] [CrossRef]
- McAlister, V.C.; Haddad, E.; Renouf, E.; Malthaner, R.A.; Kjaer, M.S.; Gluud, L.L. Cyclosporin versus tacrolimus as primary immunosuppressant after liver transplantation: A meta-analysis. Am. J. Transplant. 2006, 6, 1578–1585. [Google Scholar] [CrossRef]
- O’Grady, J.G.; Hardy, P.; Burroughs, A.K.; Elbourne, D.; UK and Ireland Liver Transplant Study Group. Randomized controlled trial of tacrolimus versus microemulsified cyclosporin (TMC) in liver transplantation: Poststudy surveillance to 3 years. Am. J. Transplant. 2007, 7, 137–141. [Google Scholar] [CrossRef]
- Rodriguez-Peralvarez, M.; Guerrero-Misas, M.; Thorburn, D.; Davidson, B.R.; Tsochatzis, E.; Gurusamy, K.S. Maintenance immunosuppression for adults undergoing liver transplantation: A network meta-analysis. Cochrane Database Syst. Rev. 2017, 3, CD011639. [Google Scholar] [CrossRef]
- European Association for the Study of the Liver. EASL Clinical Practice Guidelines: Liver transplantation. J. Hepatol. 2016, 64, 433–485. [Google Scholar] [CrossRef]
- Charlton, M.; Levitsky, J.; Aqel, B.; O’Grady, J.; Hemibach, J.; Rinella, M.; Fung, J.; Ghabril, M.; Thomason, R.; Burra, P.; et al. International Liver Transplantation Society Consensus Statement on Immunosuppression in Liver Transplant Recipients. Transplantation 2018, 102, 727–743. [Google Scholar] [CrossRef]
- Lucey, M.R.; Terrault, N.; Ojo, L.; Hay, J.E.; Neuberger, J.; Blumberg, E.; Teperman, L.W. Long-term management of the successful adult liver transplant: 2012 practice guideline by the American Association for the Study of Liver Diseases and the American Society of Transplantation. Liver Transpl. 2013, 19, 3–26. [Google Scholar] [CrossRef]
- Issa, N.; Kukla, A.; Ibrahim, H.N. Calcineurin inhibitor nephrotoxicity: A review and perspective of the evidence. Am. J. Nephrol. 2013, 37, 602–612. [Google Scholar] [CrossRef]
- Masuda, S.; Inui, K. An up-date review on individualized dosage adjustment of calcineurin inhibitors in organ transplant patients. Pharmacol. Ther. 2006, 112, 184–198. [Google Scholar] [CrossRef]
- Trofe-Clark, J.; Brennan, D.C.; West-Thielke, P.; Milone, M.C.; Lim, M.A.; Neubauer, R.; Nigro, V.; Bloom, R.D. Results of ASERTAA, a Randomized Prospective Crossover Pharmacogenetic Study of Immediate-Release Versus Extended-Release Tacrolimus in African American Kidney Transplant Recipients. Am. J. Kidney Dis. 2018, 71, 315–326. [Google Scholar] [CrossRef]
- Tholking, G.; Schutte-Nutgen, K.; Schmitz, J.; Rovas, A.; Dahmen, M.; Bautz, J.; Jehn, U.; Pavenstadt, H.; Heitplatz, B.; Van Marck, V.; et al. A Low Tacrolimus Concentration/Dose Ratio Increases the Risk for the Development of Acute Calcineurin Inhibitor-Induced Nephrotoxicity. J. Clin. Med. 2019, 8, 1586. [Google Scholar] [CrossRef] [PubMed]
- Tholking, G.; Fortmann, C.; Koch, R.; Gerth, H.U.; Pabst, D.; Pavenstadt, H.; Kabar, I.; Husing, A.; Wolters, H.; Reuter, S.; et al. The tacrolimus metabolism rate influences renal function after kidney transplantation. PLoS ONE 2014, 9, e111128. [Google Scholar] [CrossRef] [PubMed]
- Thölking, G.; Siats, L.; Fortmann, C.; Koch, R.; Hüsing, A.; Cicinnati, V.R.; Gerth, H.U.; Wolters, H.H.; Anthoni, C.; Pavenstädt, H.; et al. Tacrolimus Concentration/Dose Ratio is Associated with Renal Function after Liver Transplantation. Ann. Transplant. 2016, 21, 167–179. [Google Scholar] [CrossRef] [PubMed]
- Jouve, T.; Noble, J.; Rostaing, L.; Malvezzi, P. An update on the safety of tacrolimus in kidney transplant recipients, with a focus on tacrolimus minimization. Expert Opin. Drug Saf. 2019, 18, 285–294. [Google Scholar] [CrossRef]
- Londono, M.C.; Rimola, A.; O’Grady, J.; Sanchez-Fueyo, A. Immunosuppression minimization vs. complete drug withdrawal in liver transplantation. J. Hepatol. 2013, 59, 872–879. [Google Scholar] [CrossRef] [PubMed]
- MeltDose® Technology by the US Patent and Trademark Office. U.S. Patent 7217431, 18 May 2007.
- Garnock-Jones, K.P. Tacrolimus prolonged release (Envarsus(R)): A review of its use in kidney and liver transplant recipients. Drugs 2015, 75, 309–320. [Google Scholar] [CrossRef]
- Alloway, R.R.; Eckhoff, D.E.; Washburn, W.K.; Teperman, L.W. Conversion from twice daily tacrolimus capsules to once daily extended-release tacrolimus (LCP-Tacro): Phase 2 trial of stable liver transplant recipients. Liver Transpl. 2014, 20, 564–575. [Google Scholar] [CrossRef]
- Tremblay, S.; Nigro, V.; Weinberg, J.; Woodle, E.S.; Alloway, R.R. A Steady-State Head-to-Head Pharmacokinetic Comparison of All FK-506 (Tacrolimus) Formulations (ASTCOFF): An Open-Label, Prospective, Randomized, Two-Arm, Three-Period Crossover Study. Am. J. Transplant. 2017, 17, 432–442. [Google Scholar] [CrossRef]
- Türk, T.F.G.; Jagla, M.; Haferkamp, L.; Reimer, J.; Kribben, A.; Witzke, O. Development of the Essen compliance score—Measurement of adherence in kidney transplant patients. Am. J. Transplant. 2009, 9 (Suppl. 2), A296. [Google Scholar]
- Morisky, D.E.; Green, L.W.; Levine, D.M. Concurrent and predictive validity of a self-reported measure of medication adherence. Med. Care 1986, 24, 67–74. [Google Scholar] [CrossRef]
- Cohen, J. Statistical Power Analysis for the Behavioral Sciences, 2nd ed.; Routledge: New York, NY, USA, 1988. [Google Scholar]
- Langone, A.; Steinberg, S.M.; Gedaly, R.; Chan, L.K.; Shah, T.; Sethi, K.D.; Nigro, V.; Morgan, J.C.; Investigators, S. Switching STudy of Kidney TRansplant PAtients with Tremor to LCP-TacrO (STRATO): An open-label, multicenter, prospective phase 3b study. Clin. Transplant. 2015, 29, 796–805. [Google Scholar] [CrossRef] [PubMed]
- Kamar, N.; Cassuto, E.; Piotti, G.; Govoni, M.; Ciurlia, G.; Geraci, S.; Poli, G.; Nicolini, G.; Mariat, C.; Essig, M.; et al. Pharmacokinetics of Prolonged-Release Once-Daily Formulations of Tacrolimus in De Novo Kidney Transplant Recipients: A Randomized, Parallel-Group, Open-Label, Multicenter Study. Adv. Ther. 2019, 36, 462–477. [Google Scholar] [CrossRef]
- Sanchez Fructuoso, A.; Ruiz, J.C.; Franco, A.; Diekmann, F.; Redondo, D.; Calvino, J.; Serra, N.; Aladren, M.J.; Cigarran, S.; Manonelles, A.; et al. Effectiveness and safety of the conversion to MeltDose((R)) extended-release tacrolimus from other formulations of tacrolimus in stable kidney transplant patients: A retrospective study. Clin. Transplant. 2020, 34, e13767. [Google Scholar] [CrossRef] [PubMed]
- Budde, K.; Bunnapradist, S.; Grinyo, J.M.; Ciechanowski, K.; Denny, J.E.; Silva, H.T.; Rostaing, L. Novel once-daily extended-release tacrolimus (LCPT) versus twice-daily tacrolimus in de novo kidney transplants: One-year results of Phase III, double-blind, randomized trial. Am. J. Transplant. 2014, 14, 2796–2806. [Google Scholar] [CrossRef]
- Rostaing, L.; Bunnapradist, S.; Grinyo, J.M.; Ciechanowski, K.; Denny, J.E.; Silva, H.T., Jr.; Budde, K.; Envarsus Study Group. Novel Once-Daily Extended-Release Tacrolimus Versus Twice-Daily Tacrolimus in De Novo Kidney Transplant Recipients: Two-Year Results of Phase 3, Double-Blind, Randomized Trial. Am. J. Kidney Dis. 2016, 67, 648–659. [Google Scholar] [CrossRef] [PubMed]
- Saengram, W.; Vadcharavivad, S.; Poolsup, N.; Chancharoenthana, W. Extended release versus immediate release tacrolimus in kidney transplant recipients: A systematic review and meta-analysis. Eur. J. Clin. Pharmacol. 2018, 74, 1249–1260. [Google Scholar] [CrossRef] [PubMed]
- von Einsiedel, J.; Thölking, G.; Wilms, C.; Vorona, E.; Bokemeyer, A.; Schmidt, H.H.; Kabar, I.; Hüsing-Kabar, A. Conversion from Standard-Release Tacrolimus to MeltDose((R)) Tacrolimus (LCPT) Improves Renal Function after Liver Transplantation. J. Clin. Med. 2020, 9, 1654. [Google Scholar] [CrossRef]
- Noble-Jamieson, G.; Barnes, N. Diagnosis and management of late complications after liver transplantation. Arch. Dis. Child. 1999, 81, 446–451. [Google Scholar] [CrossRef][Green Version]
- Pagadala, M.; Dasarathy, S.; Eghtesad, B.; McCullough, A.J. Posttransplant metabolic syndrome: An epidemic waiting to happen. Liver Transpl. 2009, 15, 1662–1670. [Google Scholar] [CrossRef]
- Pelaez-Jaramillo, M.J.; Cardenas-Mojica, A.A.; Gaete, P.V.; Mendivil, C.O. Post-Liver Transplantation Diabetes Mellitus: A Review of Relevance and Approach to Treatment. Diabetes Ther. 2018, 9, 521–543. [Google Scholar] [CrossRef]
- Roy, A.; Kneteman, N.; Lilly, L.; Marotta, P.; Peltekian, K.; Scudamore, C.; Tchervenkov, J. Tacrolimus as intervention in the treatment of hyperlipidemia after liver transplant. Transplantation 2006, 82, 494–500. [Google Scholar] [CrossRef] [PubMed]
- Canzanello, V.J.; Schwartz, L.; Taler, S.J.; Textor, S.C.; Wiesner, R.H.; Porayko, M.K.; Krom, R.A. Evolution of cardiovascular risk after liver transplantation: A comparison of cyclosporine A and tacrolimus (FK506). Liver Transpl. Surg. 1997, 3, 1–9. [Google Scholar] [CrossRef]
- Sawinski, D.; Trofe-Clark, J.; Leas, B.; Uhl, S.; Tuteja, S.; Kaczmarek, J.L.; French, B.; Umscheid, C.A. Calcineurin Inhibitor Minimization, Conversion, Withdrawal, and Avoidance Strategies in Renal Transplantation: A Systematic Review and Meta-Analysis. Am. J. Transplant. 2016, 16, 2117–2138. [Google Scholar] [CrossRef]
- Farkas, S.A.; Schnitzbauer, A.A.; Kirchner, G.; Obed, A.; Banas, B.; Schlitt, H.J. Calcineurin inhibitor minimization protocols in liver transplantation. Transpl. Int. 2009, 22, 49–60. [Google Scholar] [CrossRef]
- Kwiatkowska, E.; Kwiatkowski, S.; Wahler, F.; Gryczman, M.; Domanki, L.; Marchelk-Mysliwiec, M.; Ciechanowski, K.; Drozd-Dabrowska, M. C/D Ratio in Long-Term Renal Function. Transplant. Proc. 2019, 51, 3265–3270. [Google Scholar] [CrossRef]
- Grinyo, J.M.; Petruzzelli, S. Once-daily LCP-Tacro MeltDose tacrolimus for the prophylaxis of organ rejection in kidney and liver transplantations. Expert Rev. Clin. Immunol. 2014, 10, 1567–1579. [Google Scholar] [CrossRef]
Publisher’s Note: MDPI stays neutral with regard to jurisdictional claims in published maps and institutional affiliations. |
© 2020 by the authors. Licensee MDPI, Basel, Switzerland. This article is an open access article distributed under the terms and conditions of the Creative Commons Attribution (CC BY) license (http://creativecommons.org/licenses/by/4.0/).