Research on Operation Efficiency and Membrane Fouling of A2/O-MBR in Reclaimed Water Treatment

 ,
,
Abstract
1. Introduction
2. Materials and Methods
2.1. Raw Water
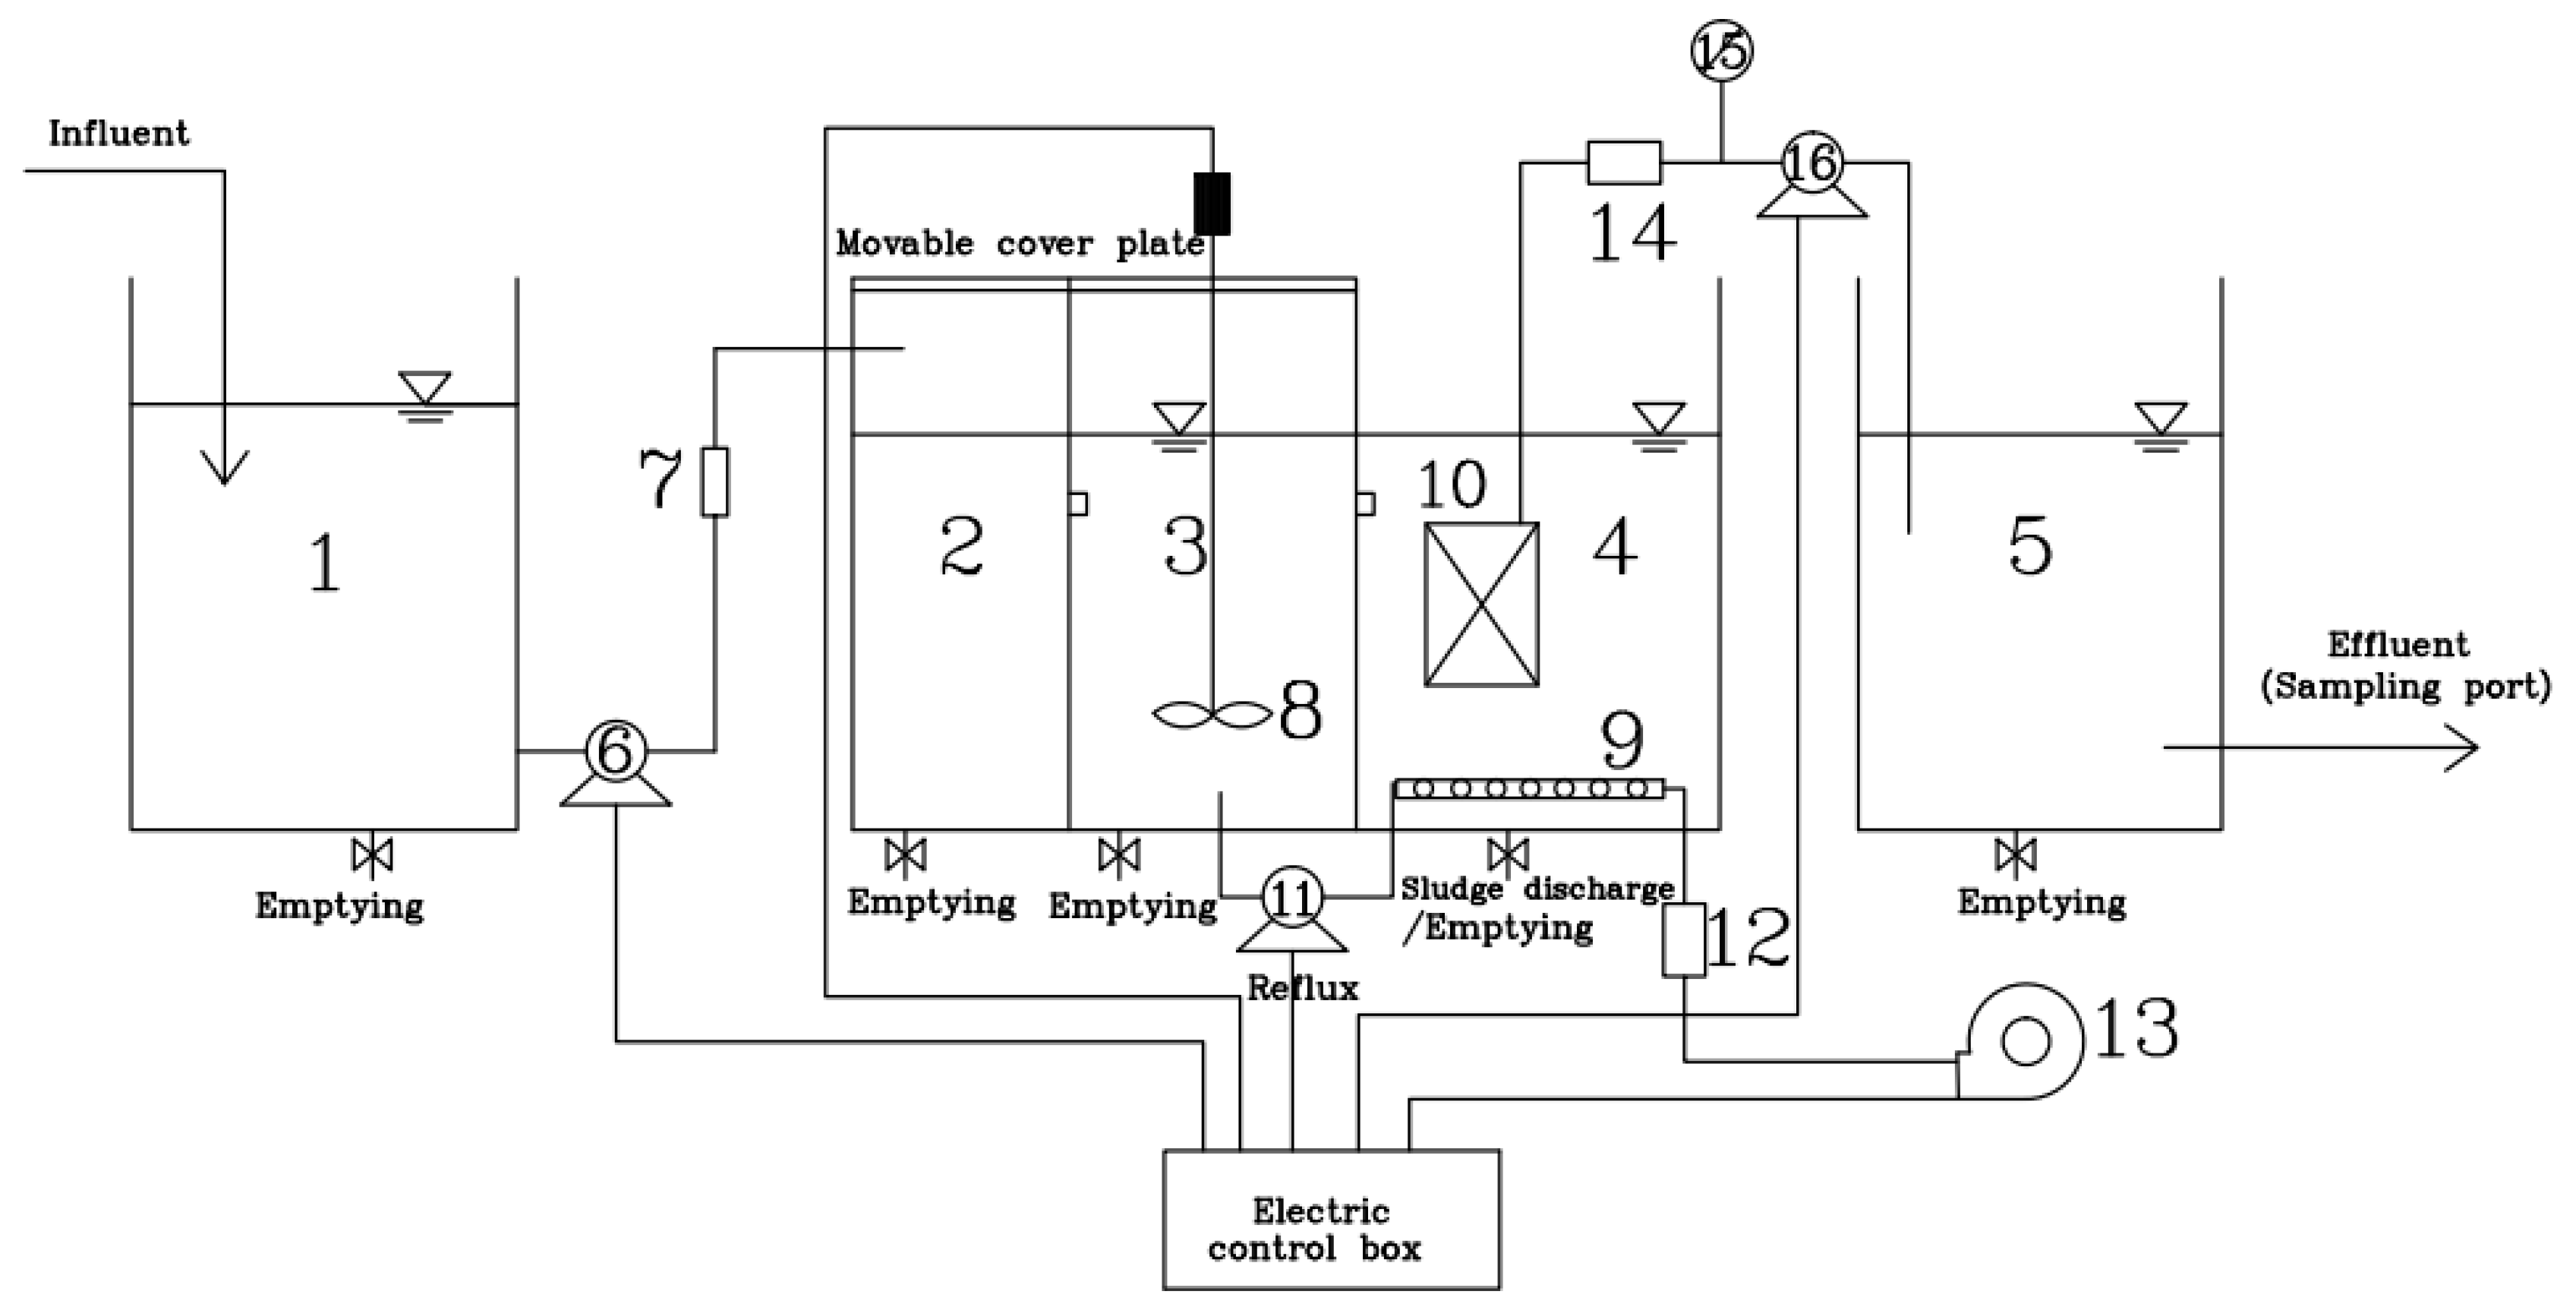
2.2. Experimental Device
2.3. MBR Membrane Module
2.4. Analysis Methods of Water Quality
3. Results and Discussion
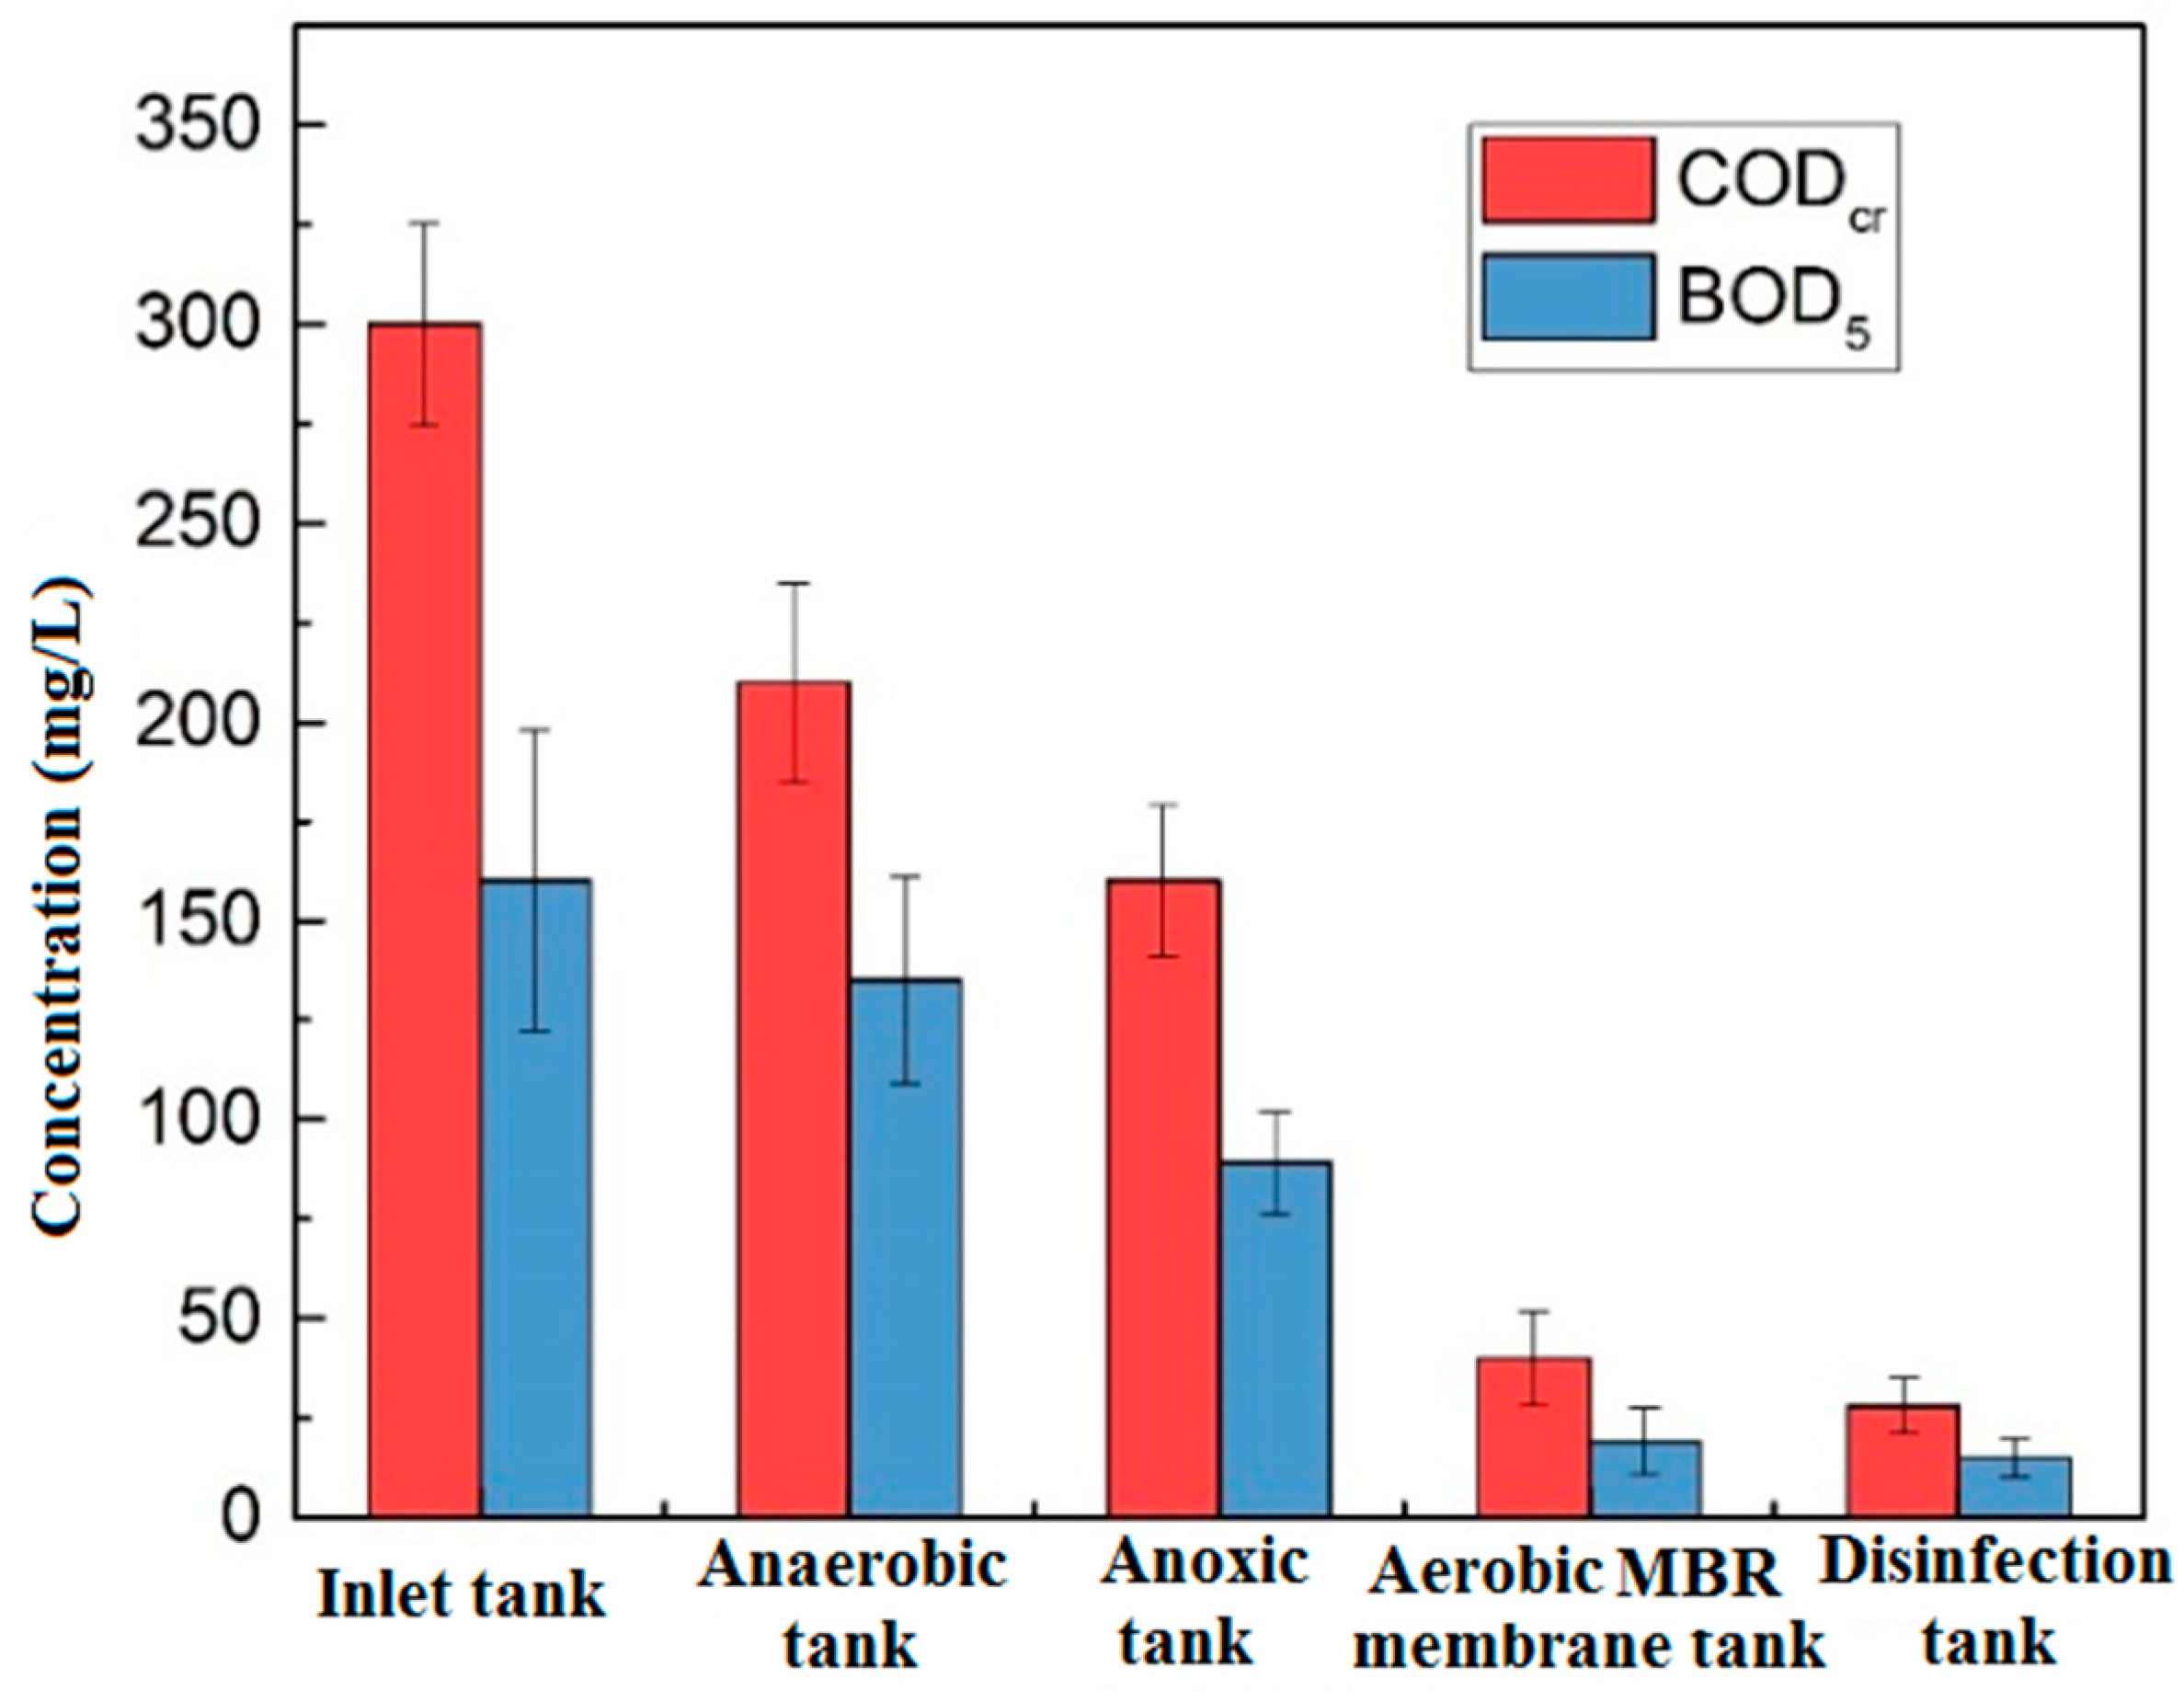
3.1. Water Quality Treatment Effects
3.1.1. Organics
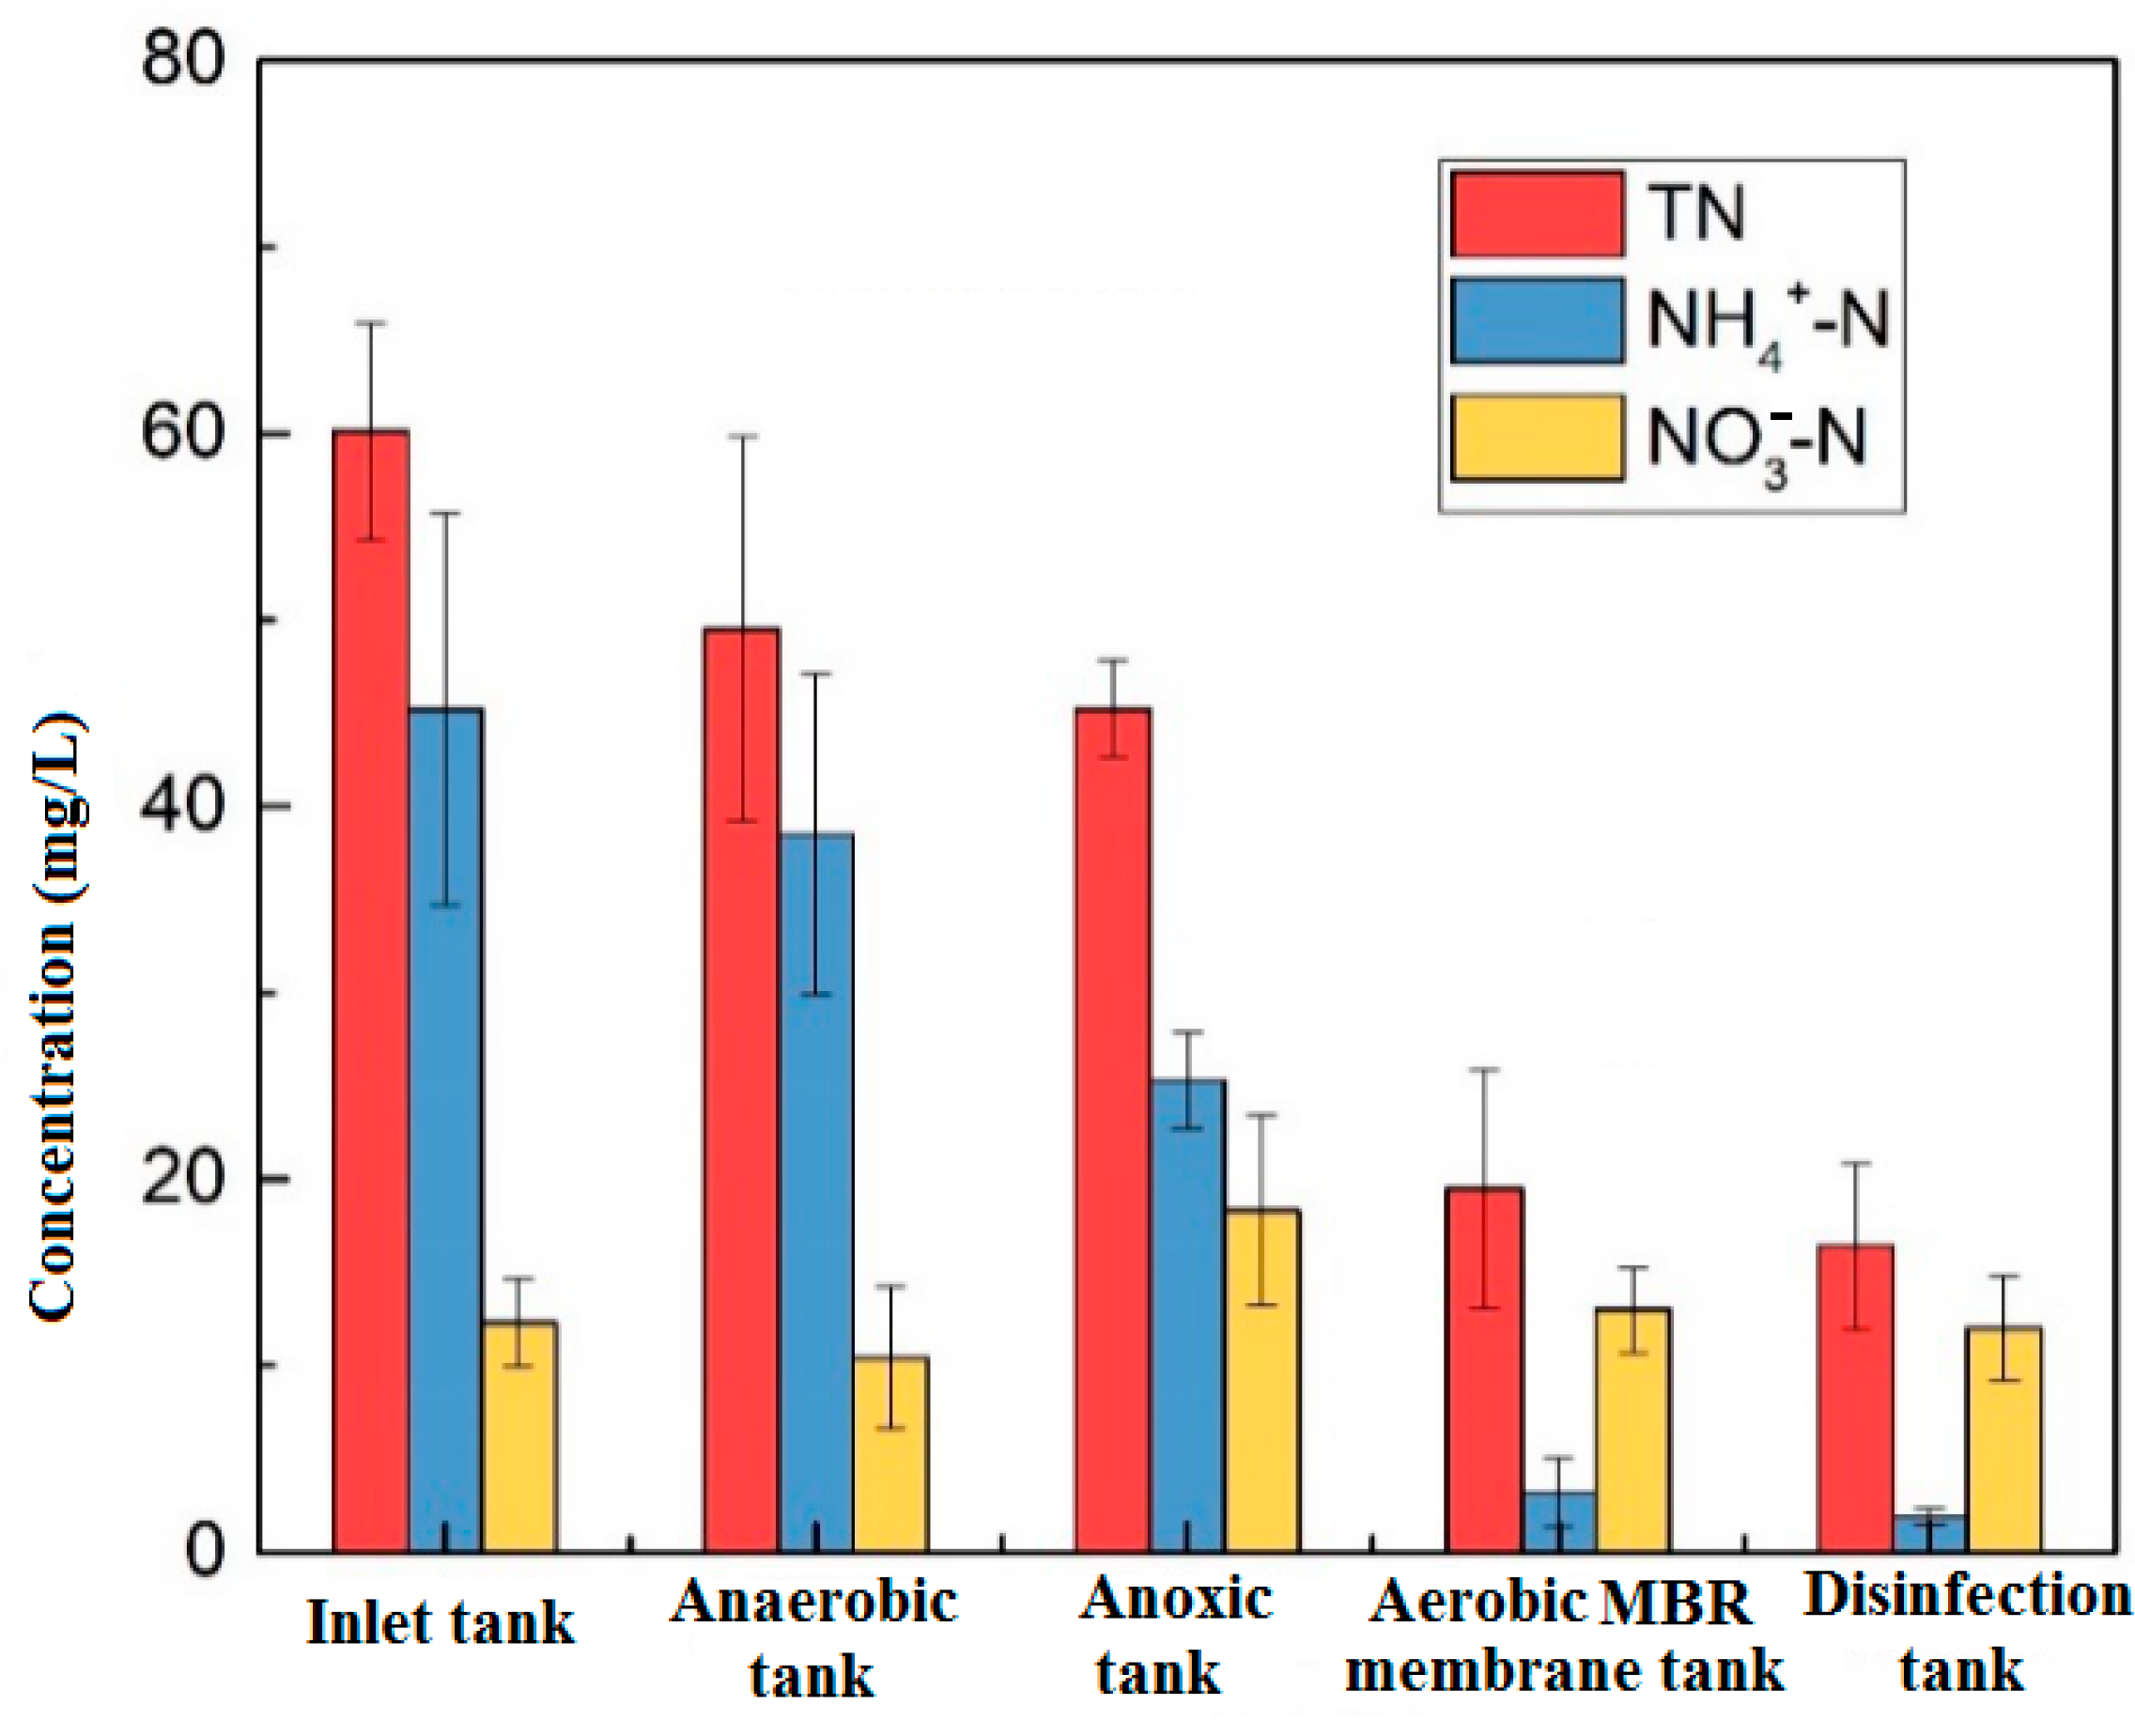
3.1.2. Nitrogen
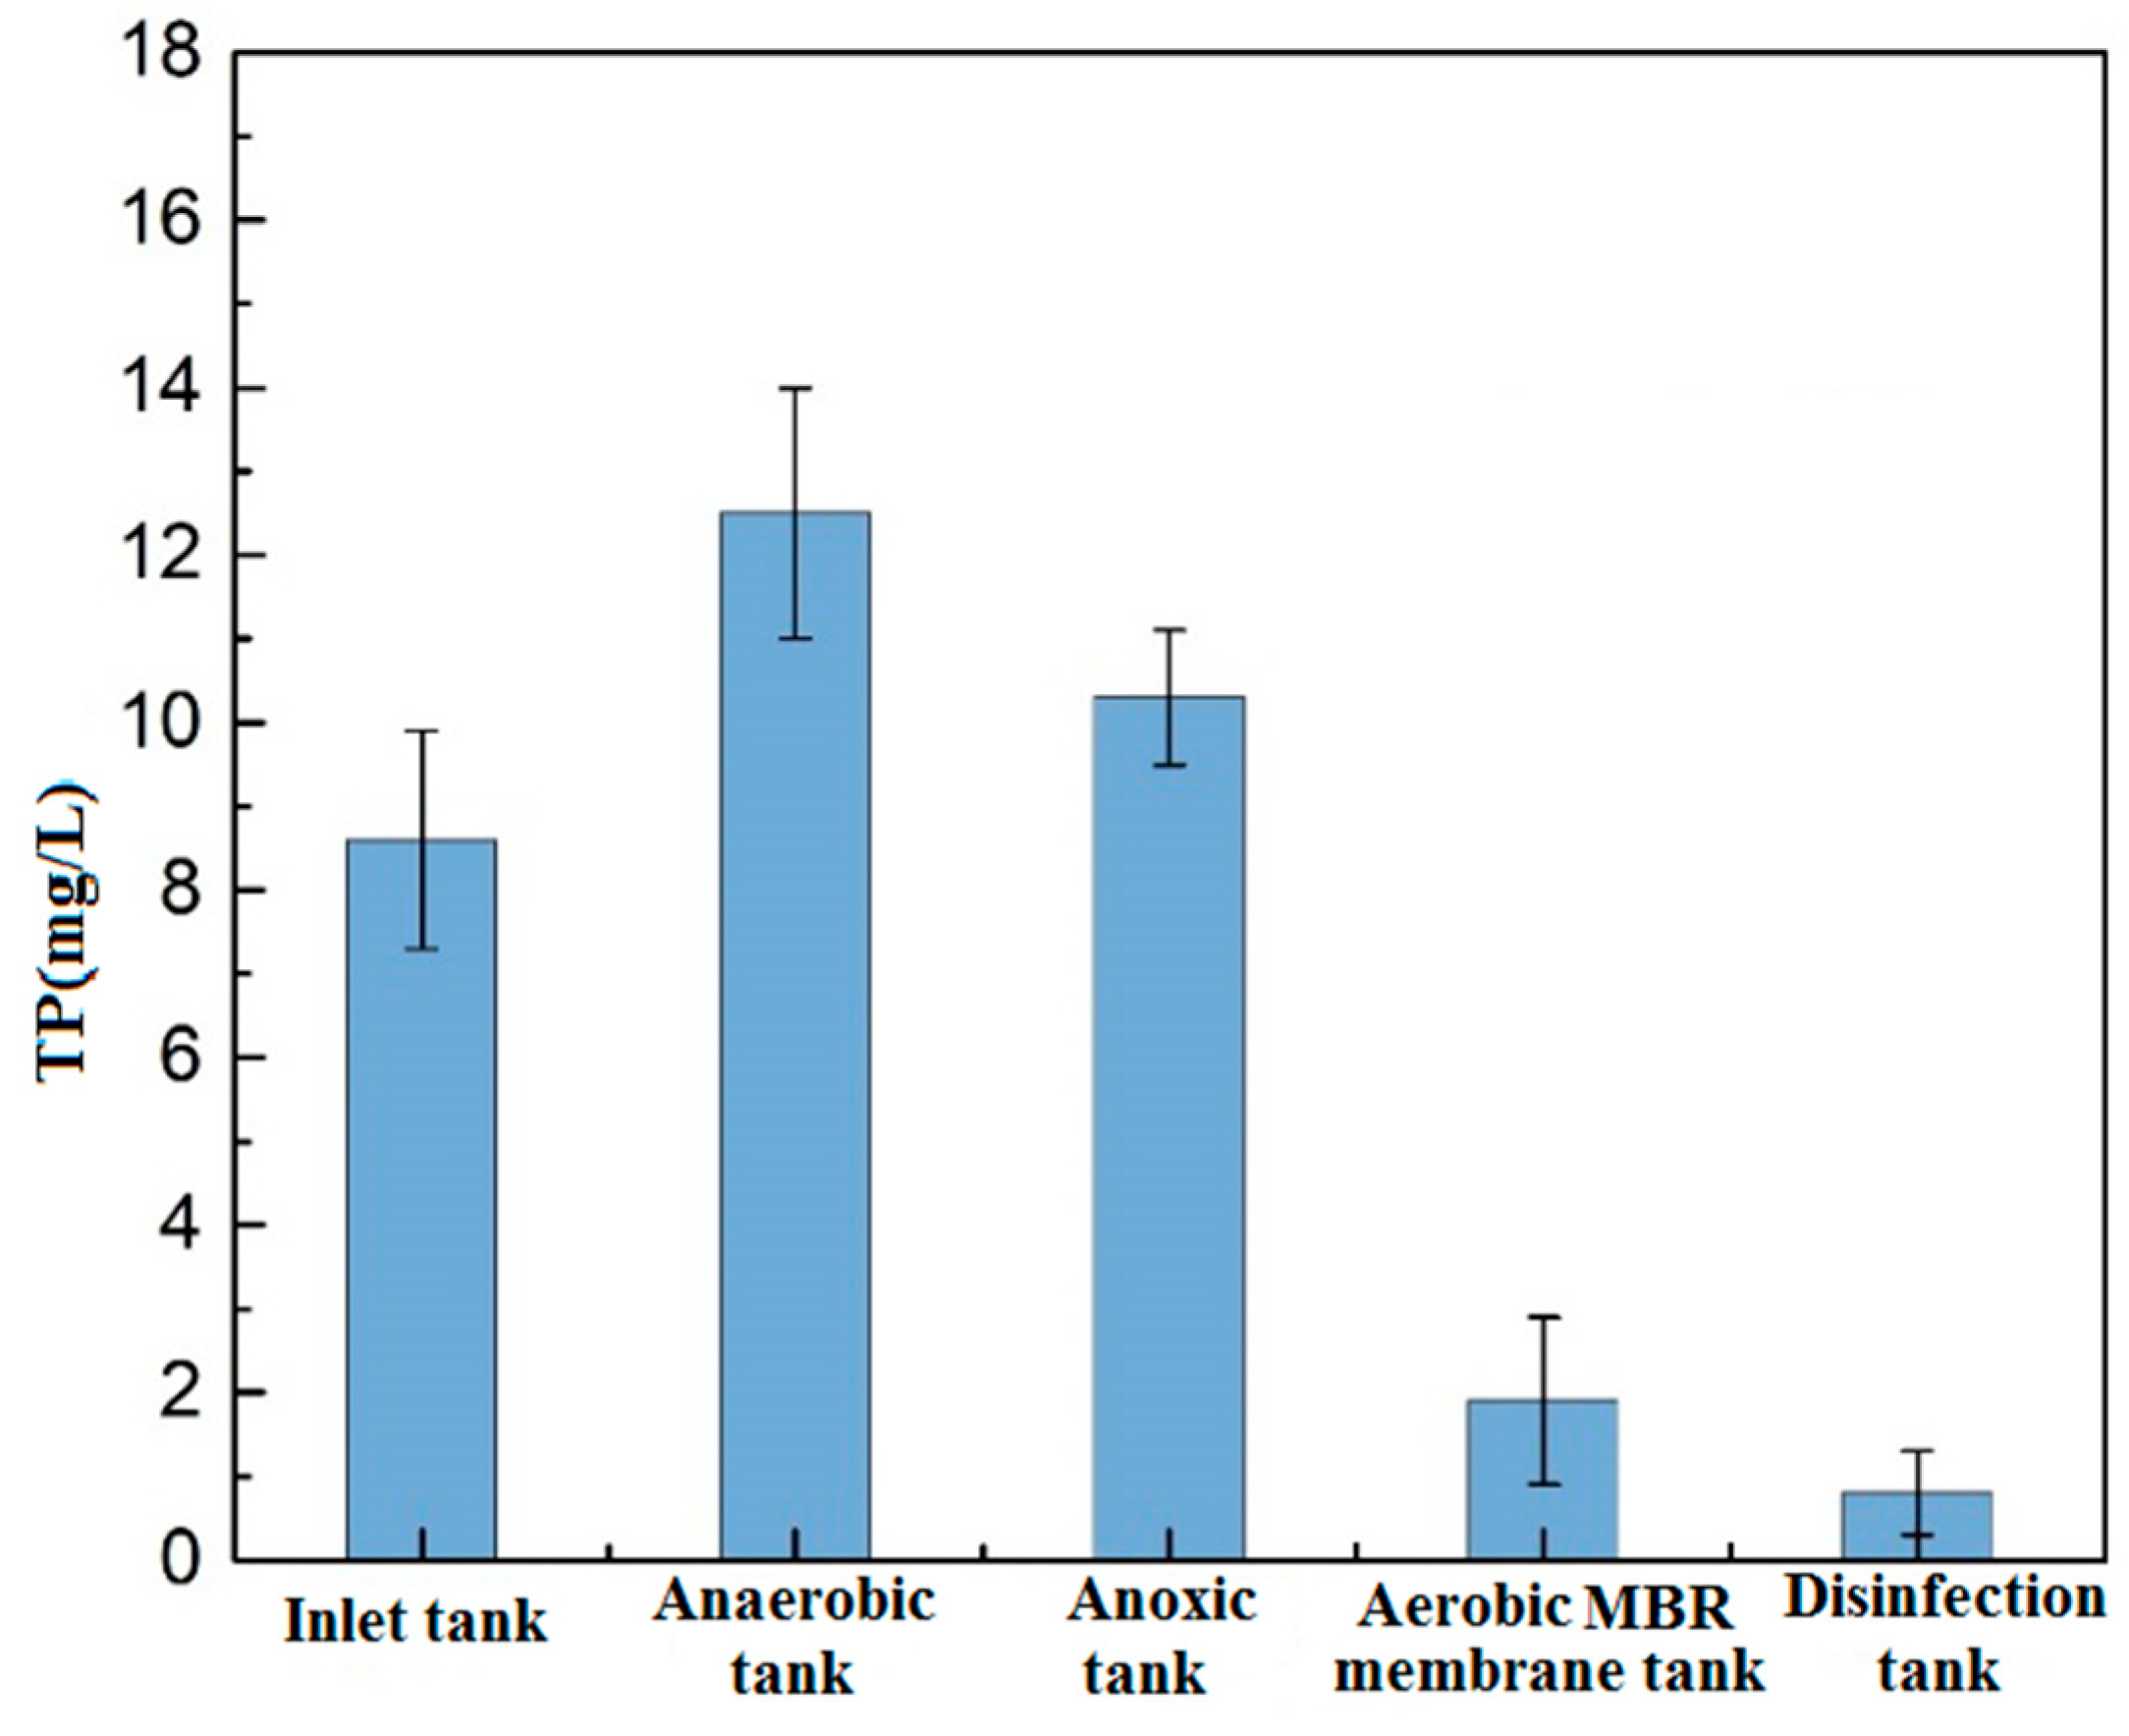
3.1.3. Total Phosphorus
3.2. Microbial Community in the System
3.2.1. Diversity Analysis
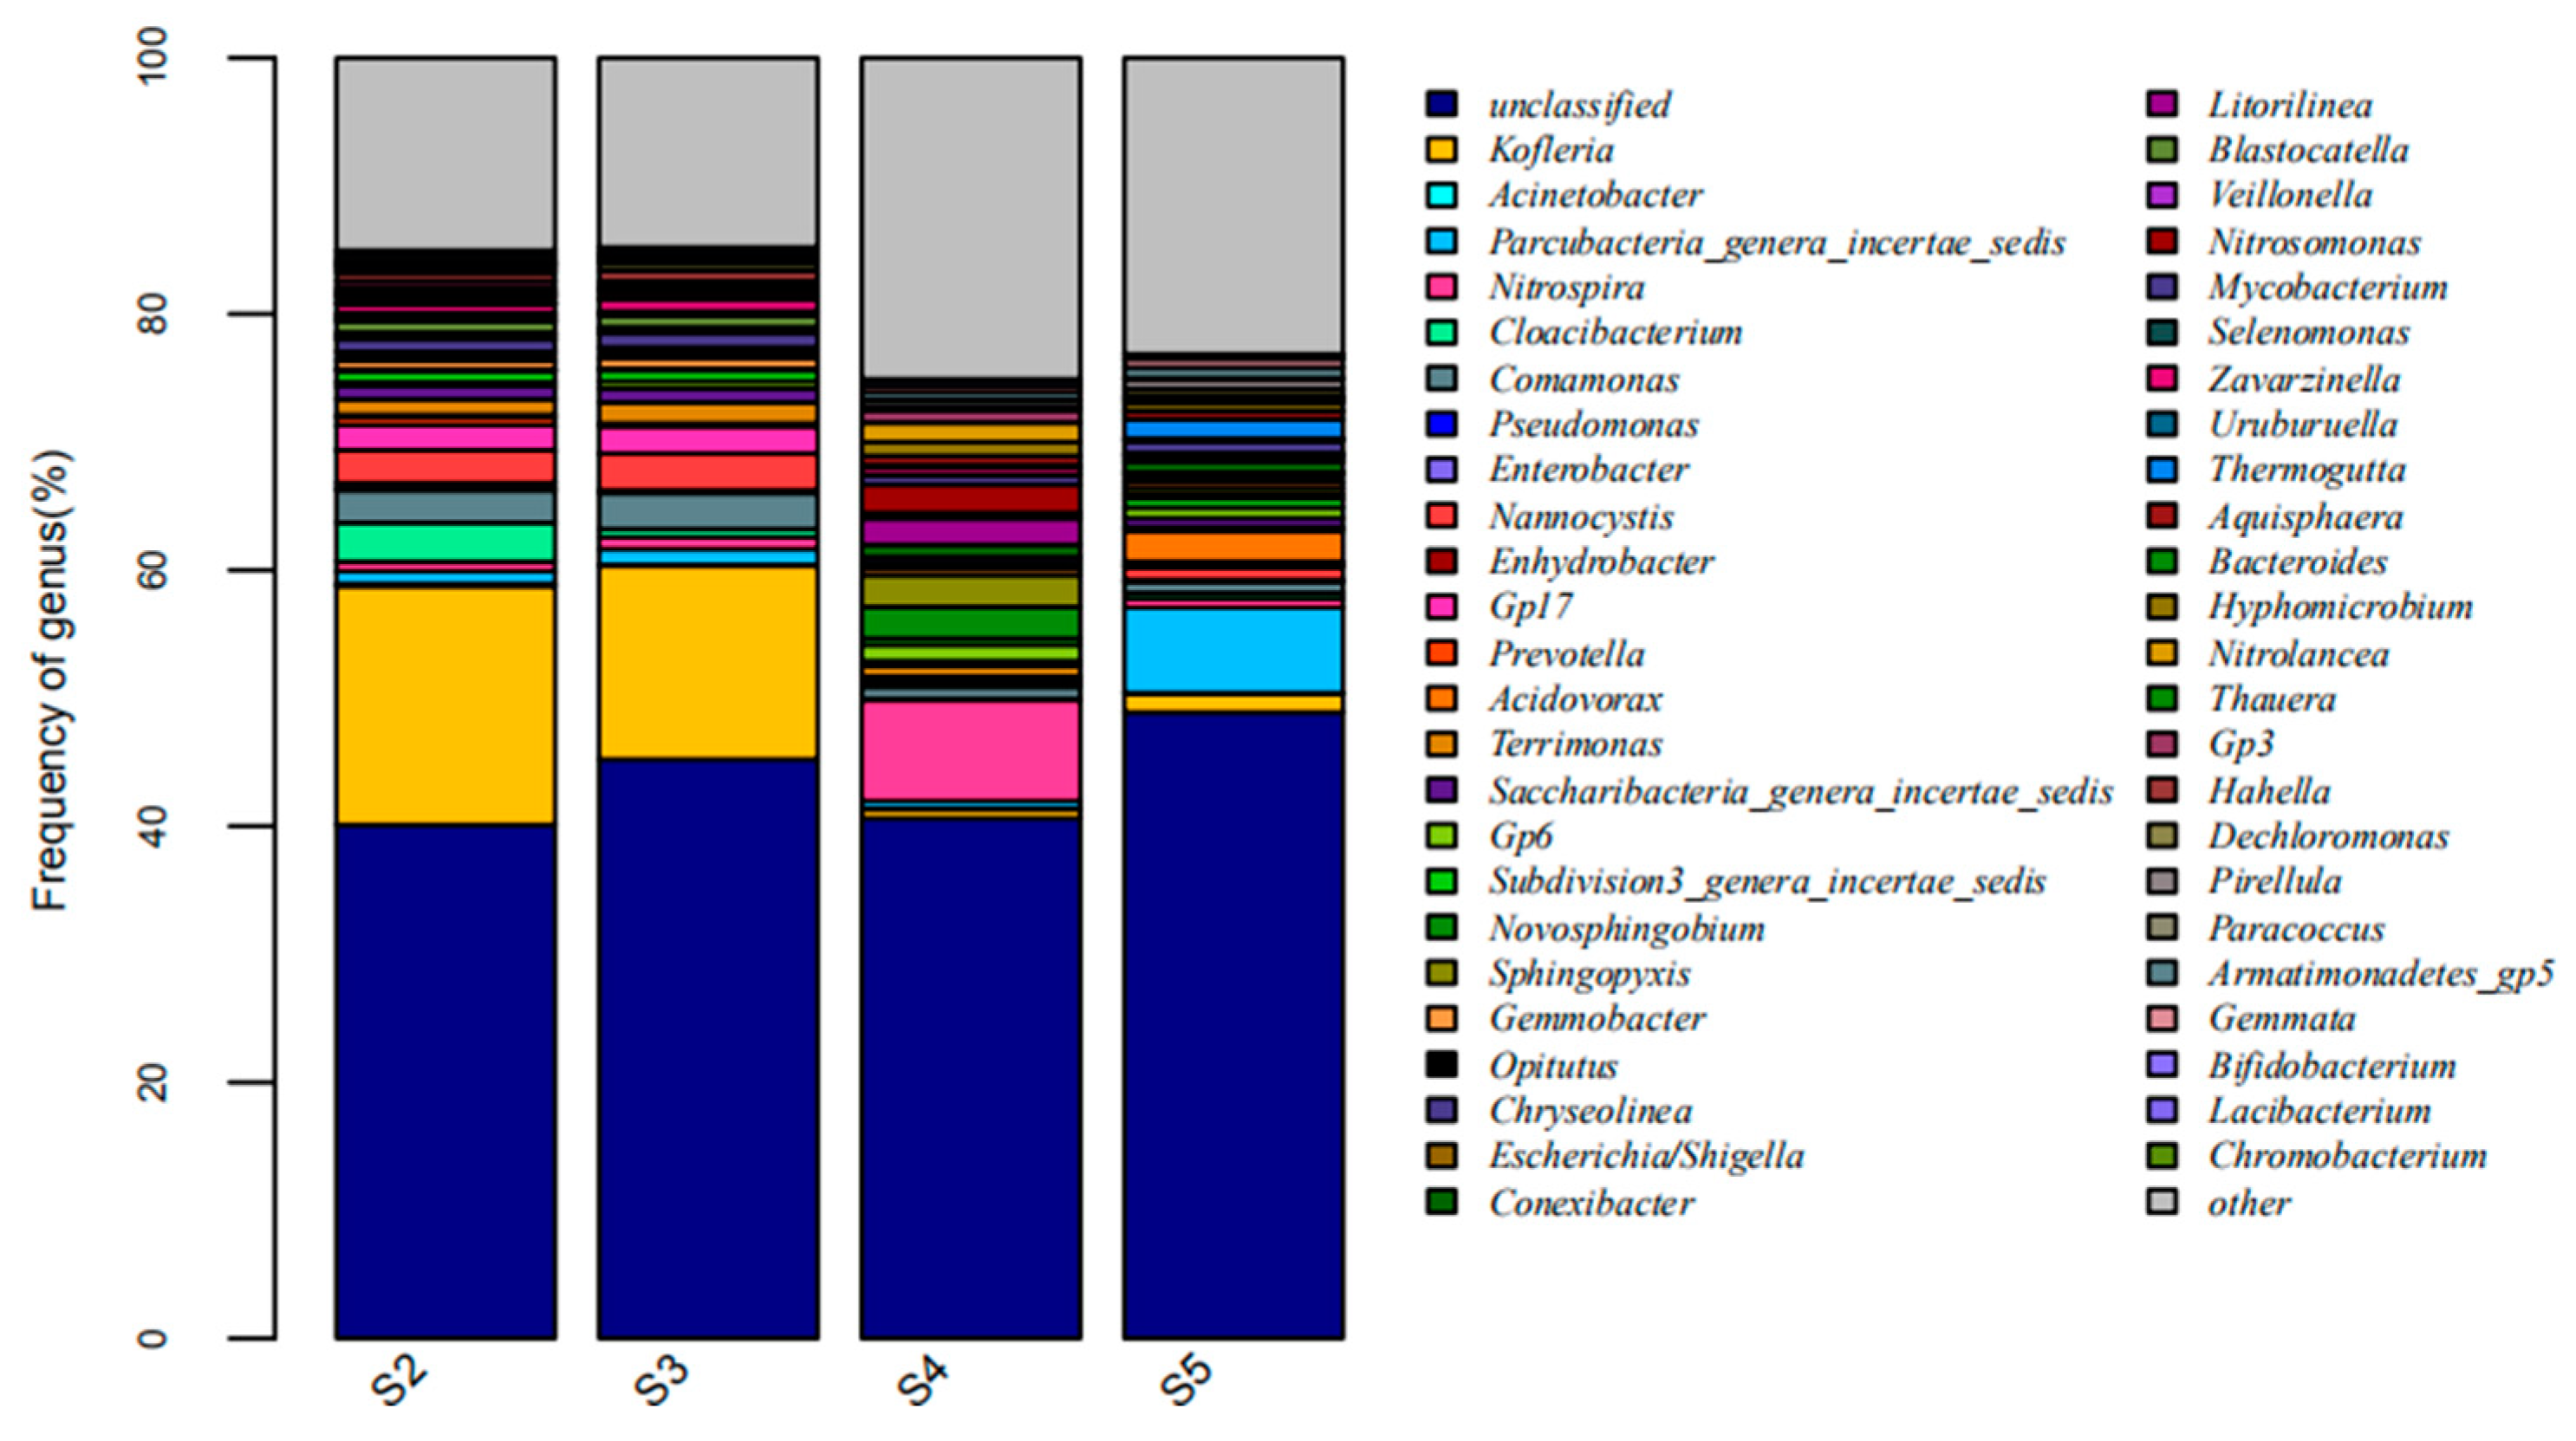
3.2.2. Analysis of Microbial Community
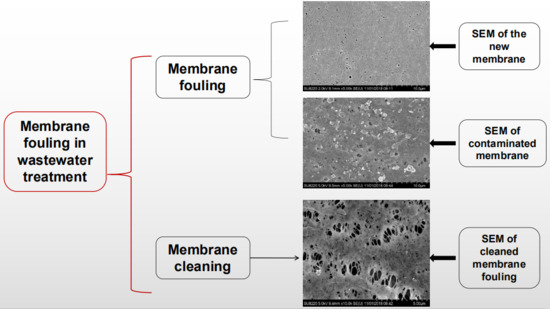
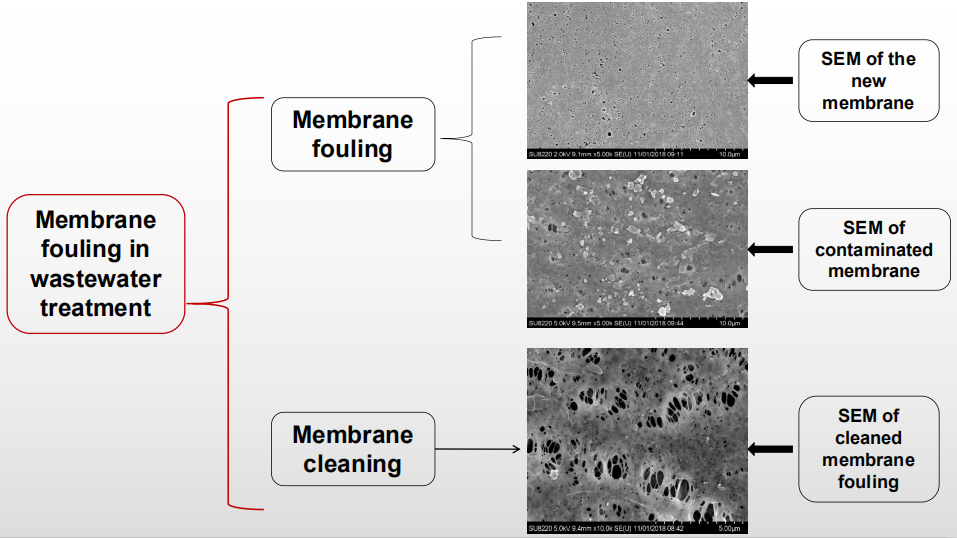
3.3. System Membrane Fouling and Membrane Cleaning Methods
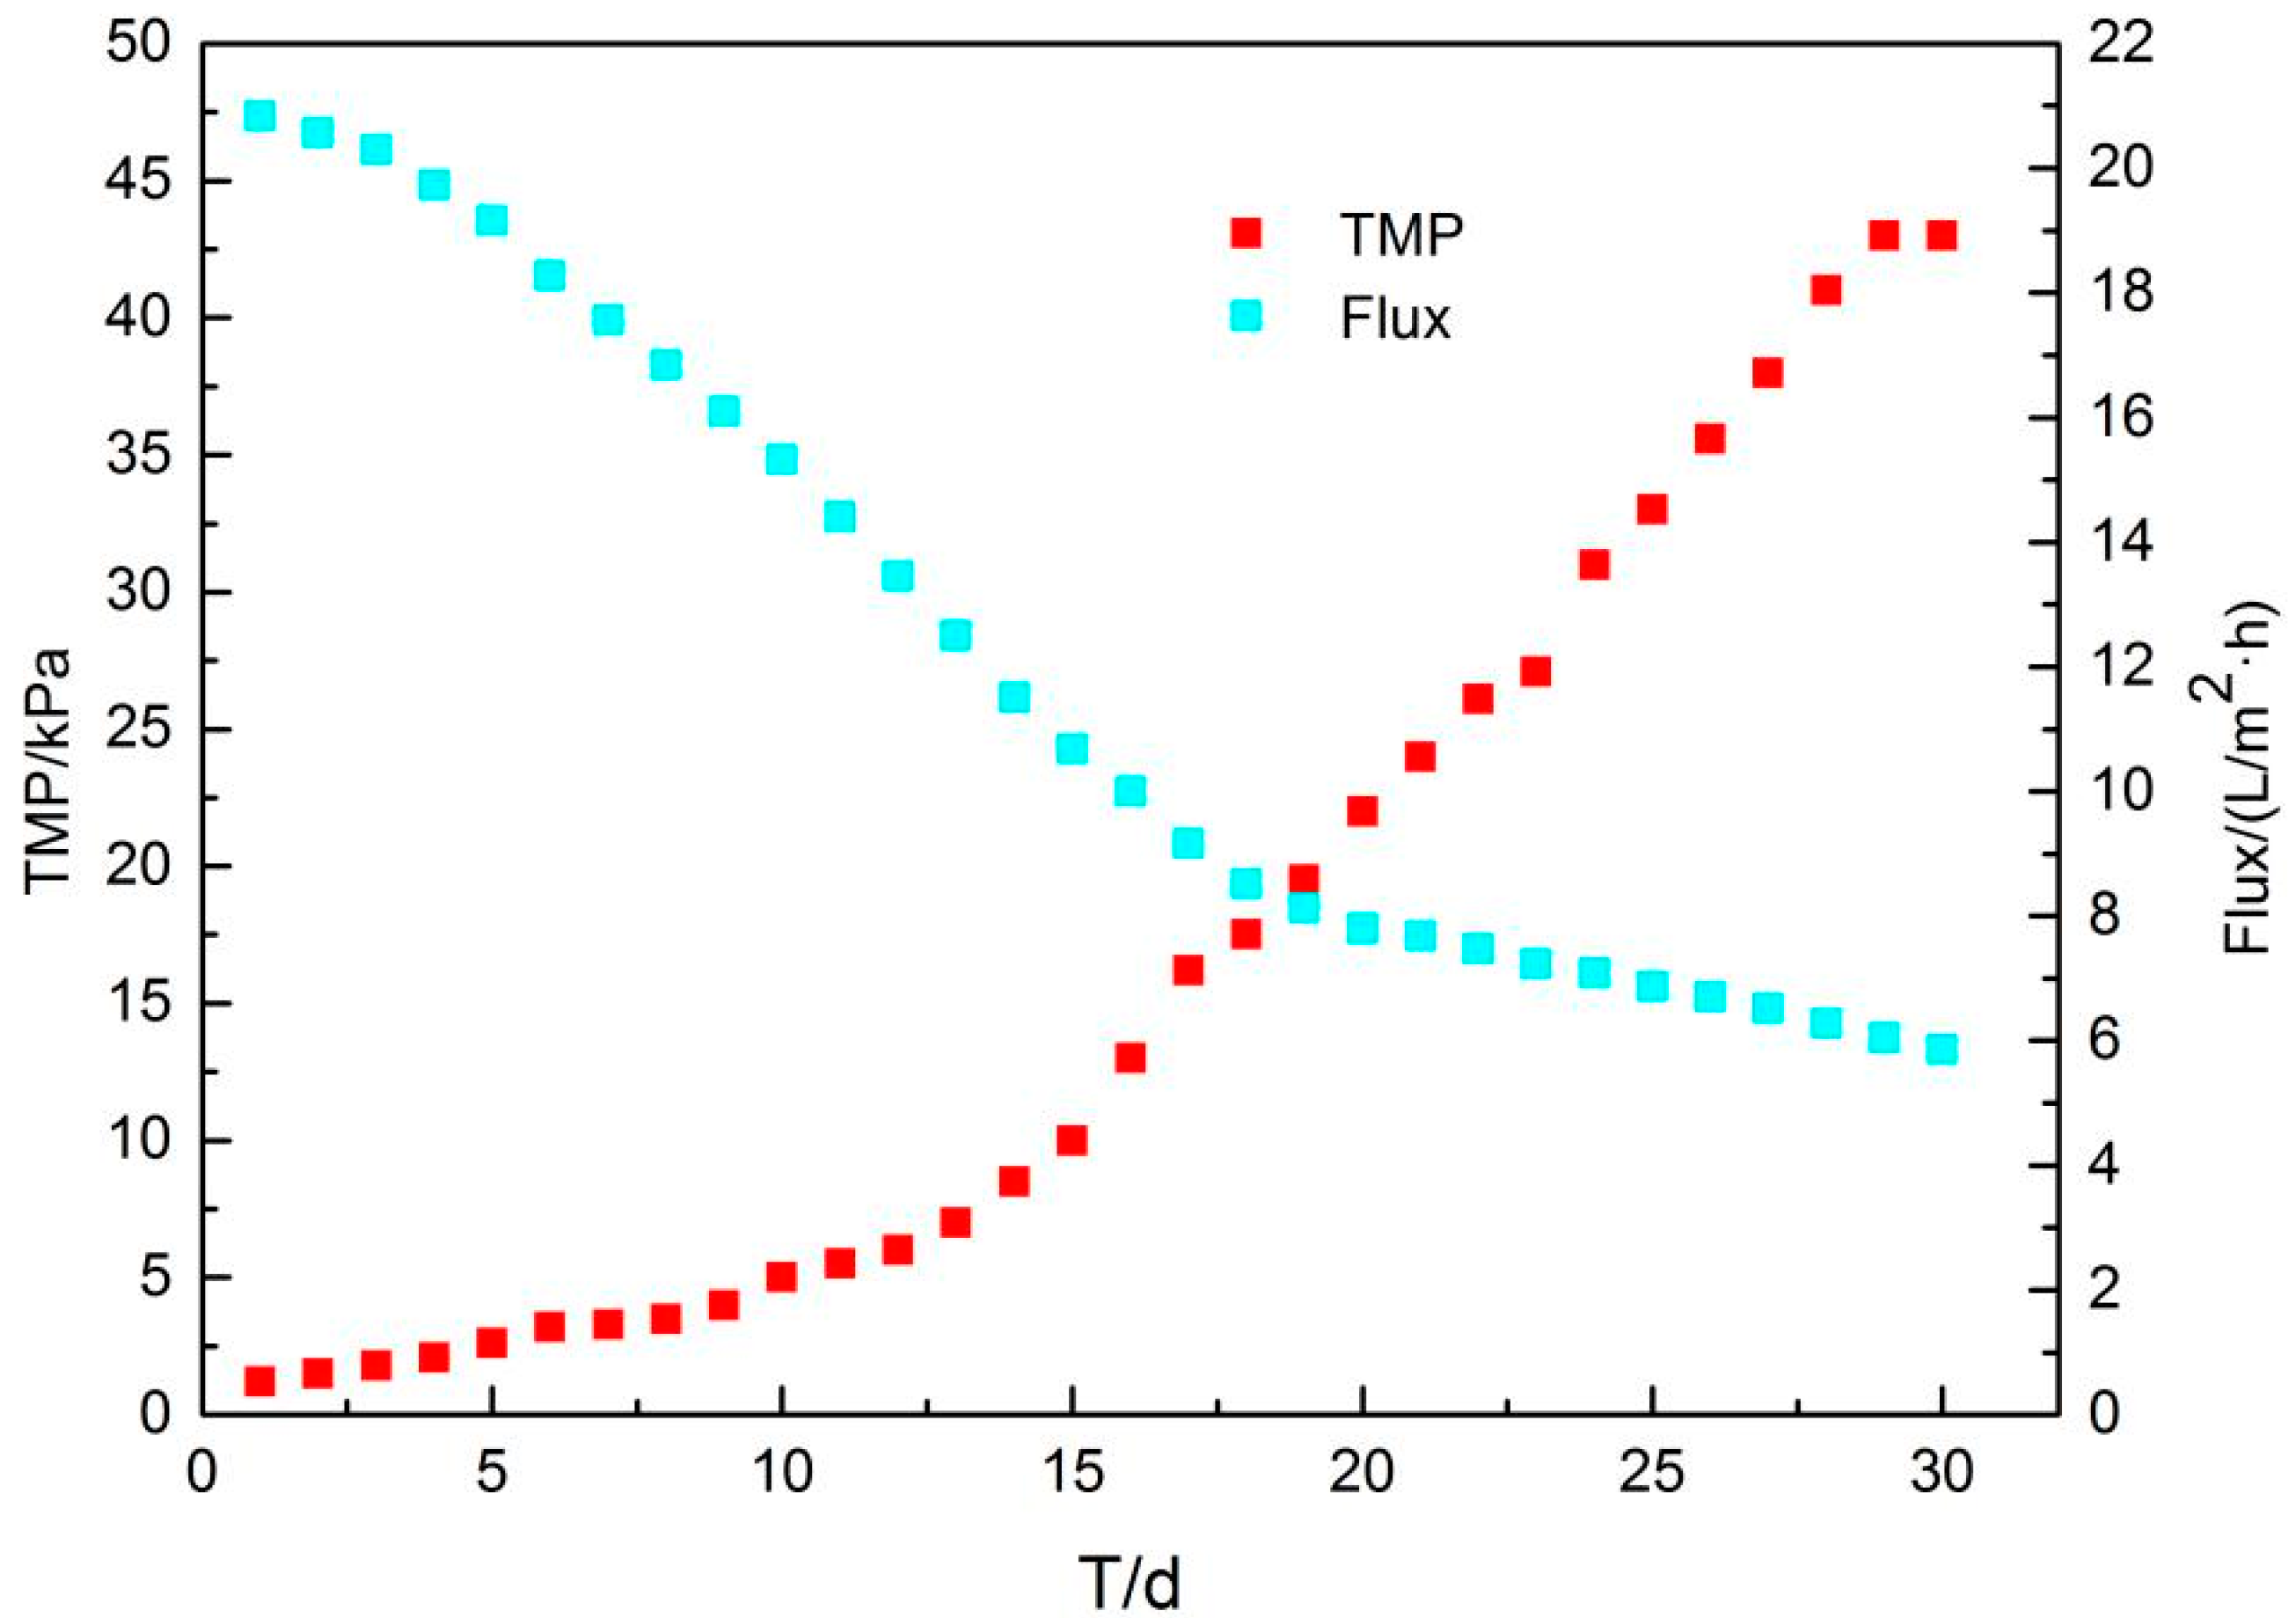
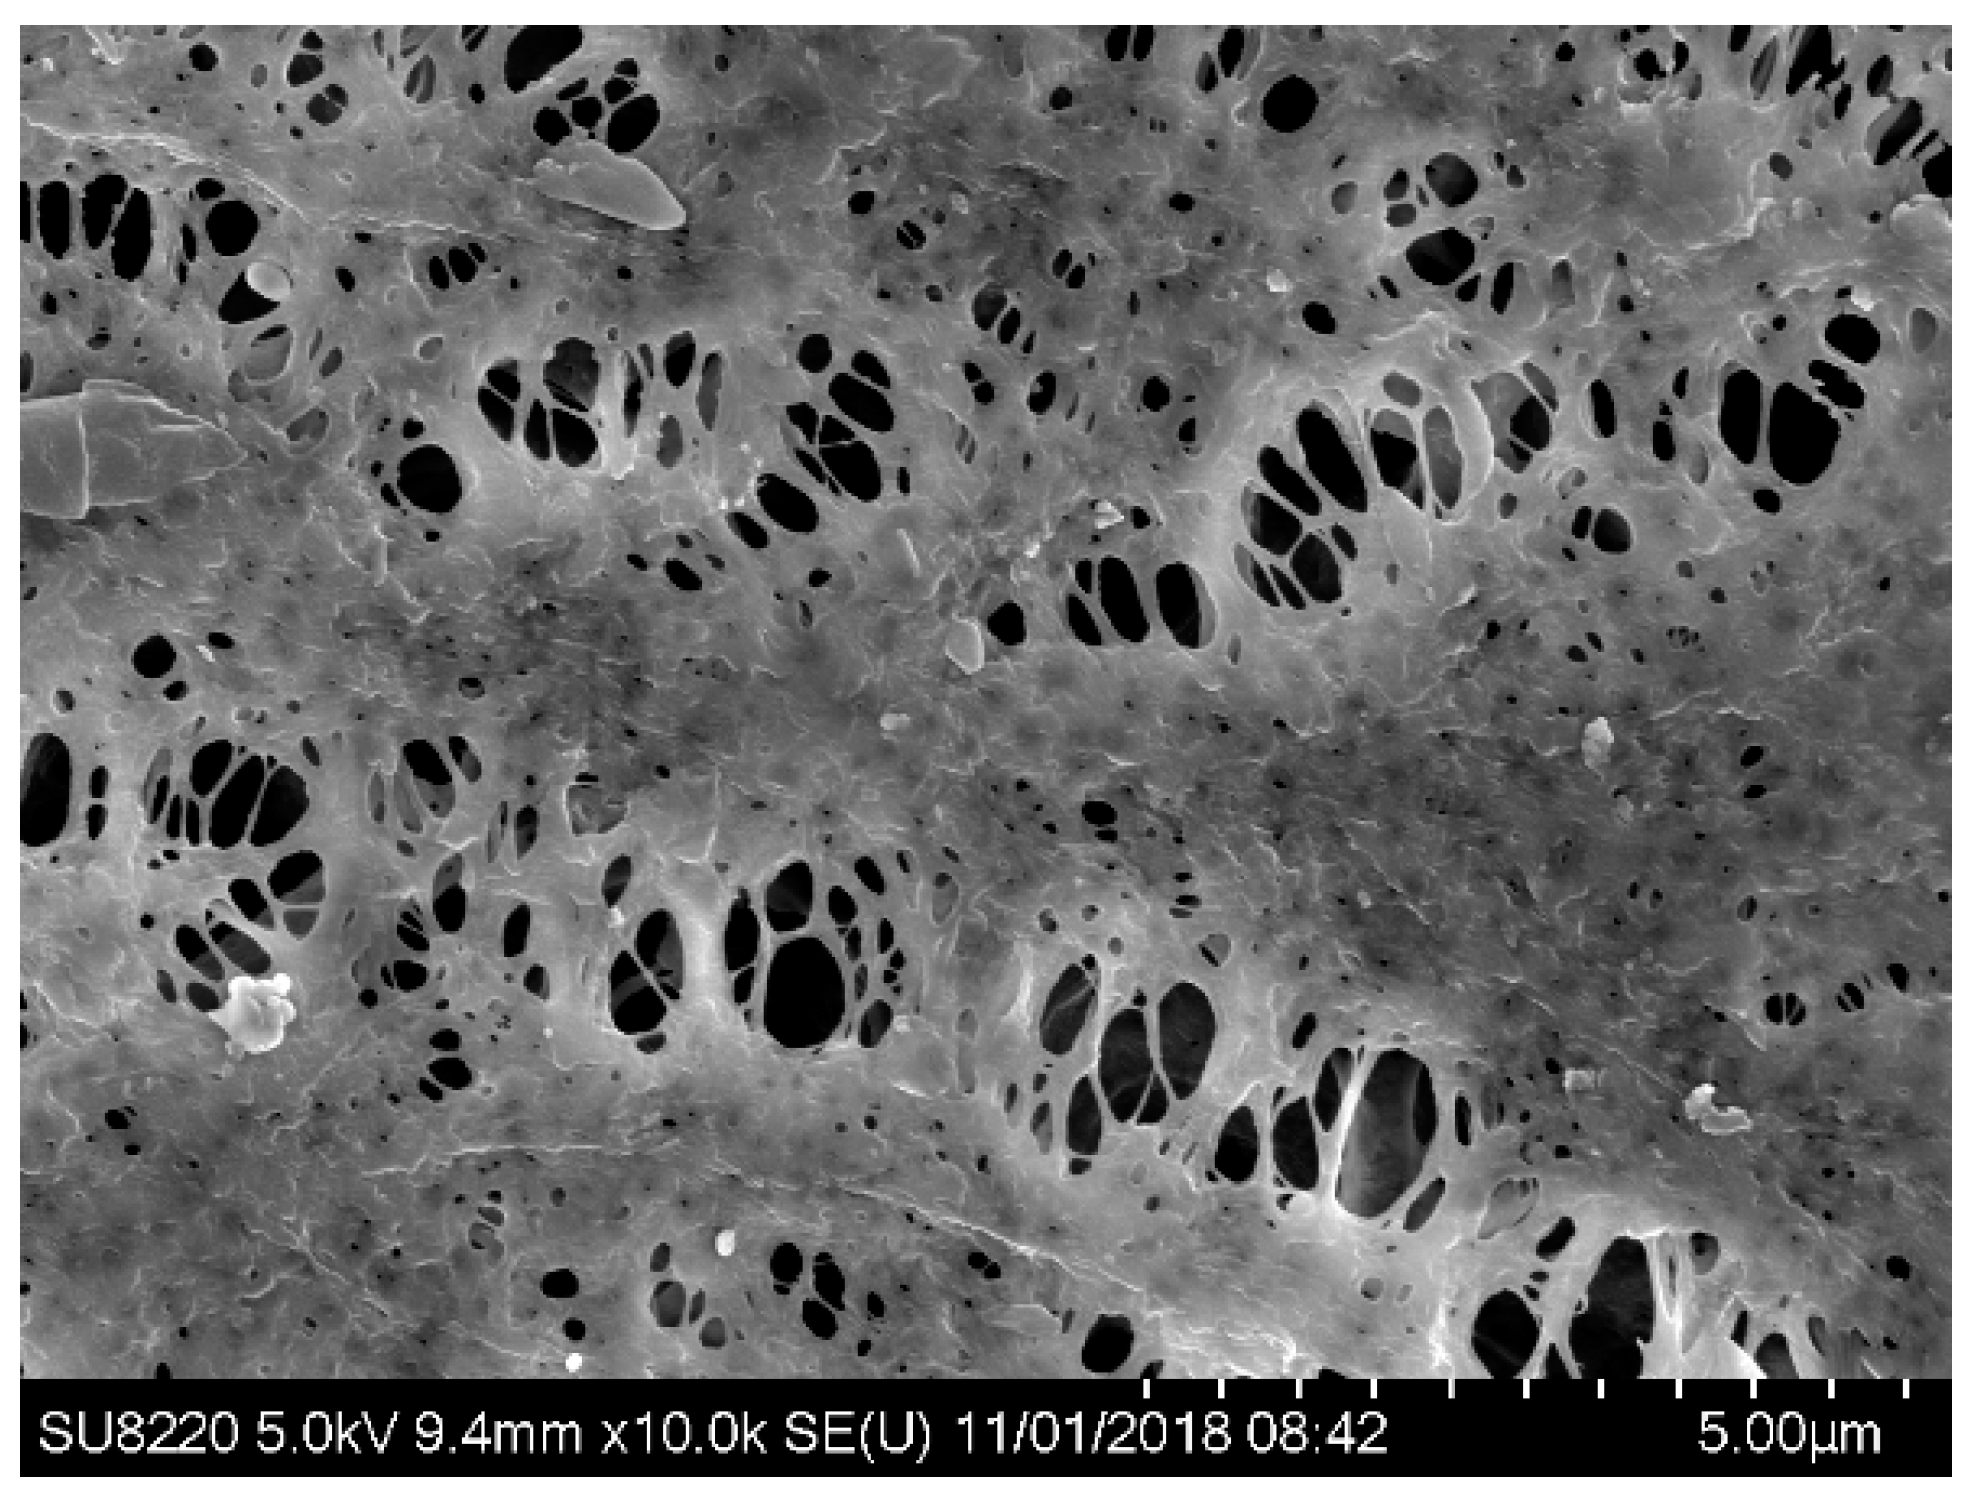
3.3.1. Characterization of Membrane Fouling
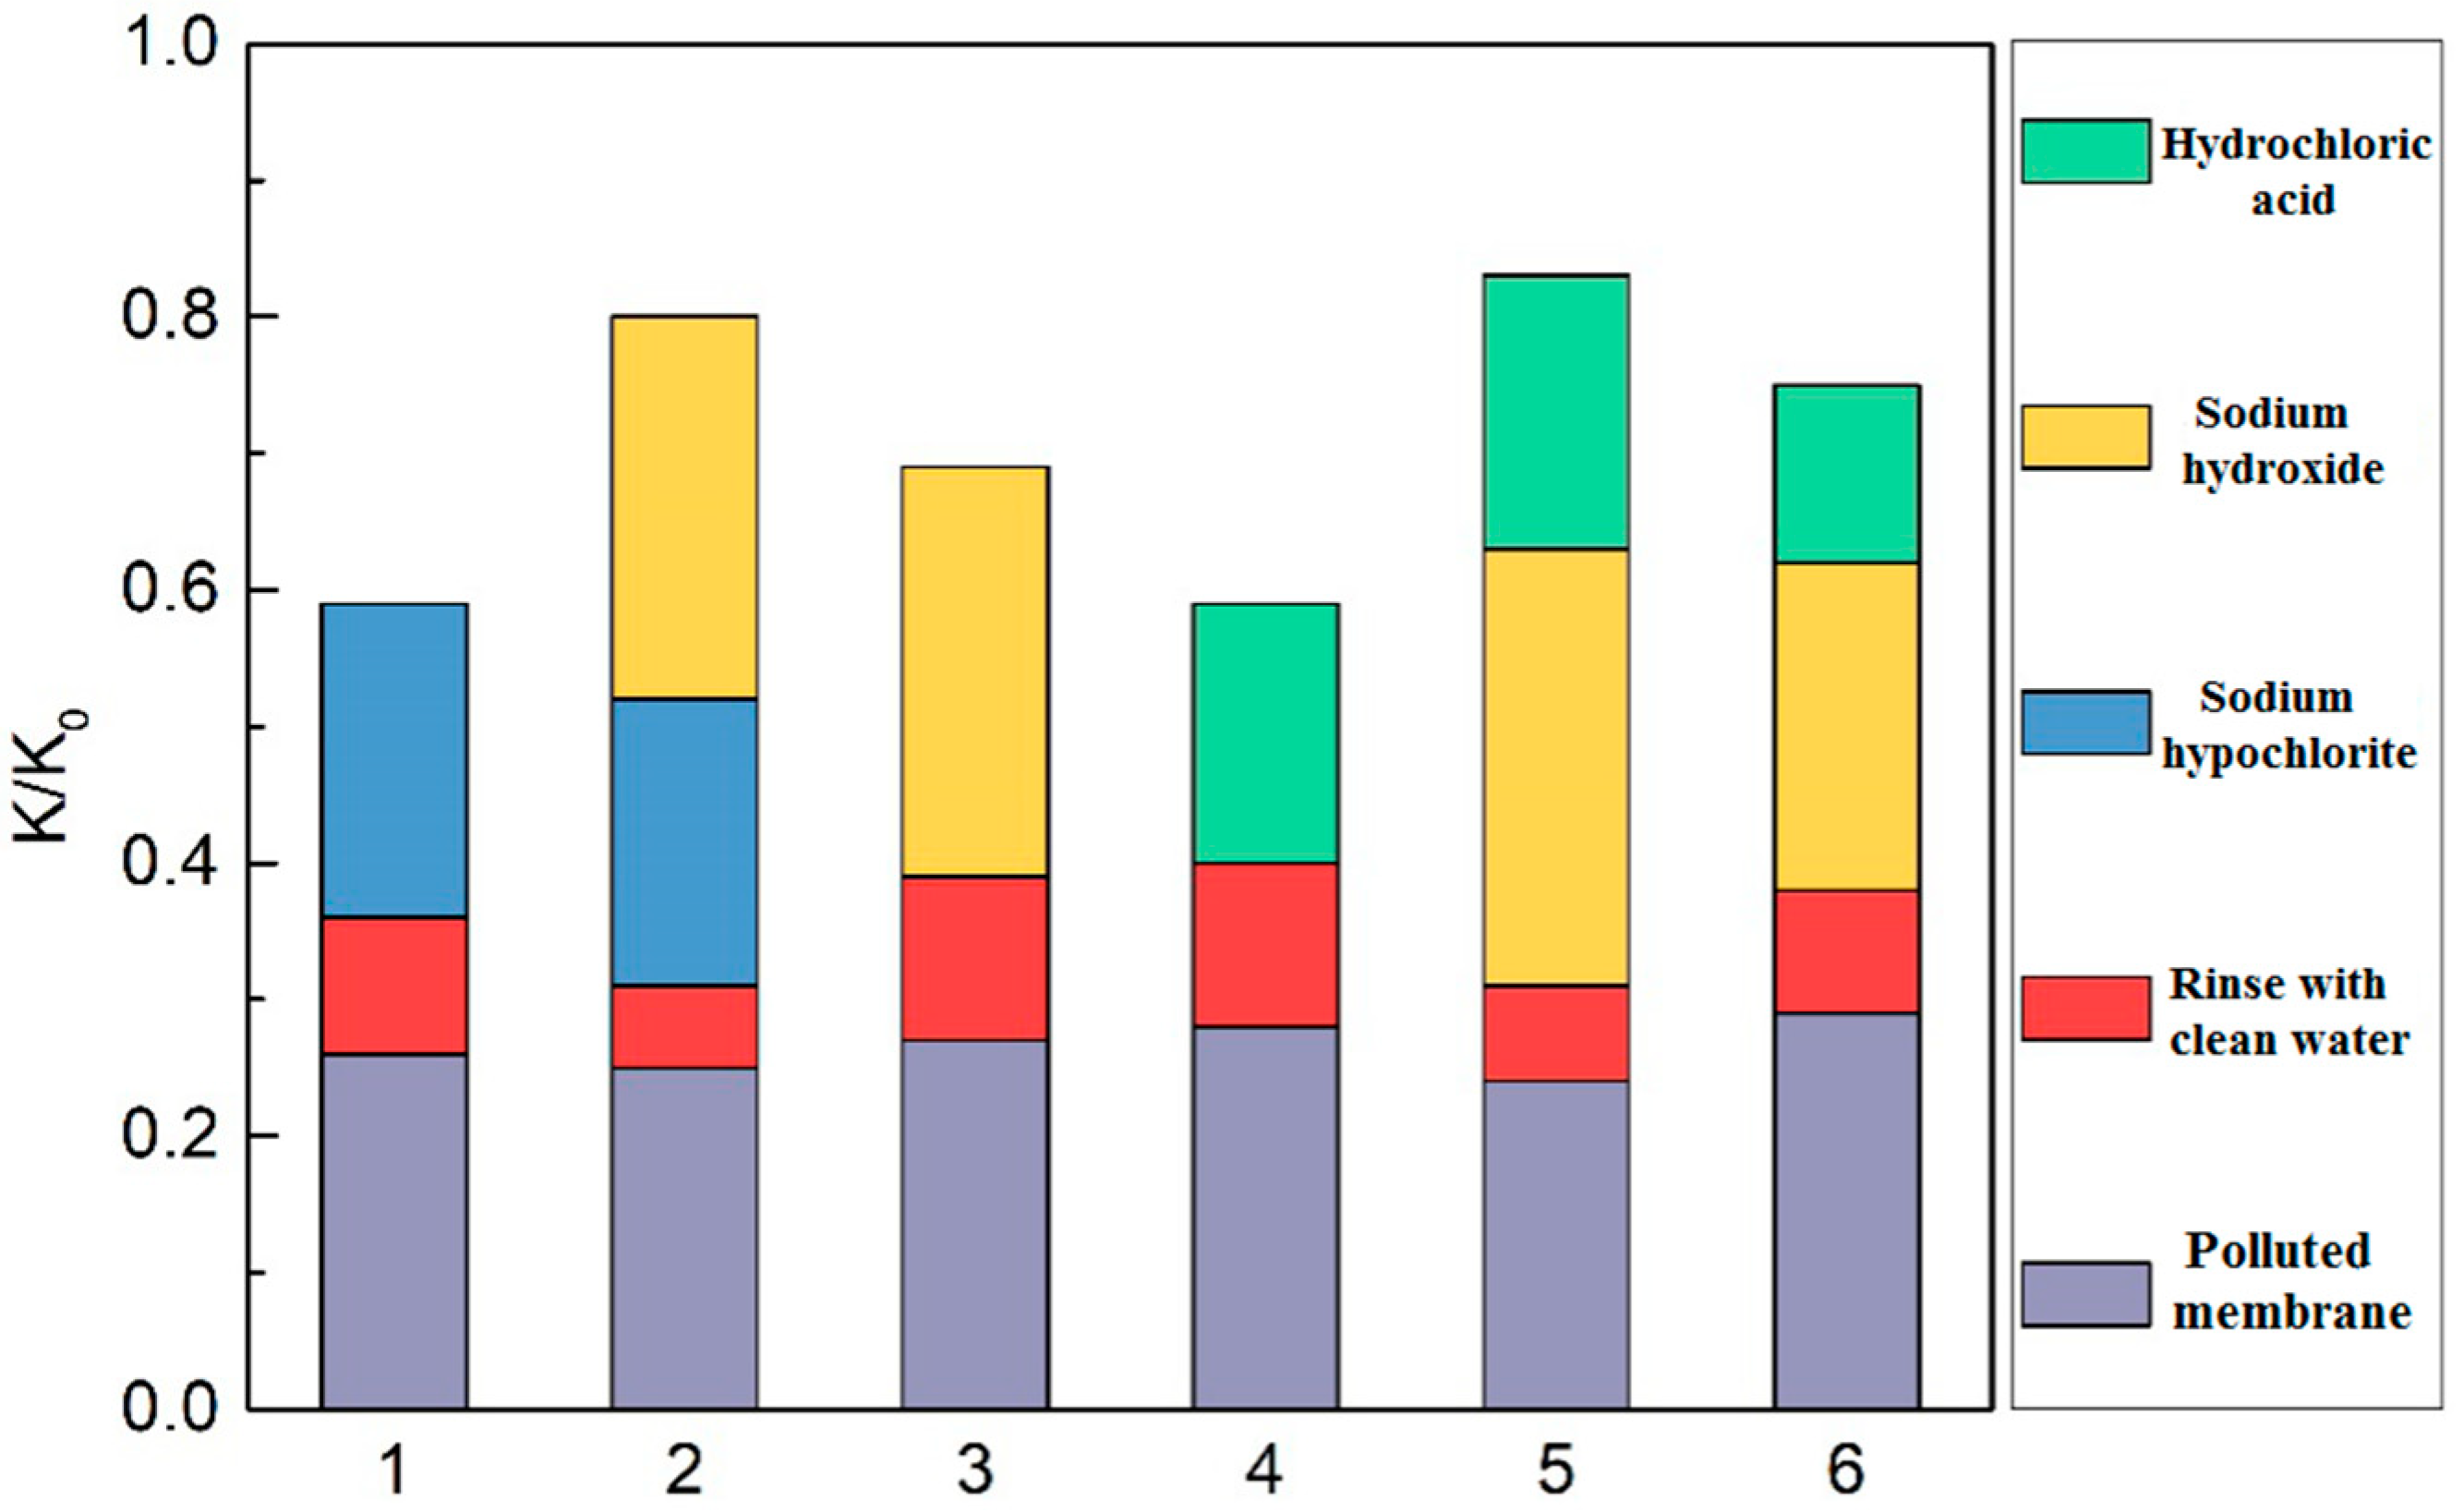
3.3.2. Membrane Cleaning Methods
4. Conclusions
Author Contributions
Funding
Acknowledgments
Conflicts of Interest
References
- Liu, D.; Zhao, J. Evaluation of sustainability of water resources system of megacities—A case study of Beijing Municipality. China Water Resour. 2017, 23, 24–28. [Google Scholar]
- Liu, Z.; Jiang, X. The prediction to Beijing water shortage risk. J. Changchun Inst. Technol. Nat. Sci. Ed. 2012, 13, 117–119. [Google Scholar]
- Wang, H.; Liu, C.; Ma, N.; Li, Q.J.; Wang, P.J.; Meng, Q.Y. Study on domestic wastewater reclamation by A2/O-MBR process based on WWTPs upgrading and reconstruction. Water Wasterwater Eng. 2015, 51 (Suppl. 1), 70–75. [Google Scholar]
- Metcaf, E. Waster Engineering Treatment and Reuse; McGraw-Hill: New York, NY, USA, 2004; pp. 790–801. [Google Scholar]
- Adam, C.; Gnirss, R.; Lesjean, B.; Buisson, H.; Kraume, M. Enhanced biological phosphorus removal in memrane bioreactors. Water Sci. Technol. 2002, 46, 281–286. [Google Scholar] [CrossRef] [PubMed]
- Liu, Y.; Feng, L.; Wang, P.; Feng, K. Design of Beijing Mentougou Underground Reclaimed Water Plant with High Effluent Quality Requirement. China Water Wastewater 2018, 34, 73–75. [Google Scholar]
- Smith, C.; Gregorio, D.; Talcott, R. The use of ultrafiltration membrane for activated sludge separation. In Proceedings of the 24th Annual Purdue Industrial Waste Conference Purdue University, Lafayette, IN, USA, 6–8 May 1969; pp. 1300–1303. [Google Scholar]
- Kraume, M.; Drews, A. Membrane bioreactors in waste water treatment-status and trends. Chem. Eng. Technol. 2010, 33, 1251–1259. [Google Scholar] [CrossRef]
- He, X. Application of Advanced Treatment Technology in the Upgrading Project of an Existing Wastewater Treatment Plant in Beijing. China Water Wastewater 2018, 34, 80–84. [Google Scholar]
- Li, Y.; Jiang, J.; Bai, L.; Wang, H.; Li, J.; Dong, L. Operation Diagnosis and Optimization Analysis of a Reclaimed Water Plant in Beijing. Technol. Water Treat. 2018, 44, 124–127. [Google Scholar]
- Wang, X.D.; Ma, Y.B.; Wang, L.; Yang, Y.T.; Huang, D.X.; Xia, S.Q. Efficacy of A2/O-MBR Combined Process in Wastewater Treatment and the Characteristics of Membrane Fouling. Environ. Sci. 2015, 36, 3743–3748. [Google Scholar]
- Li, S.; Duan, L.; Zhu, B.; Song, Y.H.; Tian, Y. Effect of soluble microbial products on membrane fouling in MBR at various solids retention times. Chin. J. Environ. Eng. 2015, 9, 2731–2738. [Google Scholar]
- Sun, Y.; Zhang, F.; Hu, H.Y.; Sun, Y.; Niu, Z. Statistical Analysis of Influent Water Quality Characteristics of Beijing Wastewater Treatment Plant. Water Wastewater Eng. 2014, 50 (Suppl. 1), 177–181. [Google Scholar]
- Wang, M.; Ge, Z.Q.; Yao, D.W.; Lu, P.F.; Gao, Y. Analysis of Influent Quality Characteristics of a Municipal Wastewater Treatment Plant in Beijing. China Resour. Compr. Util. 2019, 37, 54–58. [Google Scholar]
- Chinese State Environmental Protection Administration. Chinese Water and Wastewater Monitoring Methods, 4th ed.; Chinese Environmental Science Publishing House: Beijing, China, 2002; pp. 210–284. [Google Scholar]
- Park, J.; Yamashita, N.; Park, C.; Shimono, T.; Takeuchi, D.M.; Tanaka, H. Removal characteristics of pharmaceuticals and personal care products: Comparison between membrane bioreactor and various biological treatment processes. Chemosphere 2017, 179, 347. [Google Scholar] [CrossRef] [PubMed]
- Yuan, Z.; Yang, X.; Yu, C. Performance and Stability of Nitrogen and Phosphorus removal by A2O-MBR Process. Technol. Water Treat. 2013, 39, 97–100. [Google Scholar]
- Li, X. Study on Denitrifying Phosphorus Removal Process and Microbiology. Ph.D. Thesis, Harbin Institute of Technology, Harbin, China, 2006. [Google Scholar]
- Ma, J.; Wang, Z.; Li, H.; Park, H.D.; Wu, Z. Metagenomes reveal microbial structures, functional potentials, and biofouling-related genes in a membrane bioreactor. Appl. Microbiol. Biotechnol. 2016, 100, 1–13. [Google Scholar] [CrossRef]
- Mcilroy, S.J.; Szyszka, A.; Starnawski, P.; Saunders, A.M.; Nierychlo, M.; Nielsen, P.H.; Nielsen, J.L. Identification of active denitrifiers in full-scale nutrient removal wastewater treatment systems by application of stable-isotope probing, microautoradiography and FISH. Environ. Microbiol. 2016, 18, 50. [Google Scholar] [CrossRef]
- Tao, L.; Mao, Y.J.; Shi, Y.P.; Quan, X. Start-up and bacterial community compositions of partial nitrification in moving bed biofilm reactor. Appl. Microbiol. Biotechnol. 2017, 101, 1–12. [Google Scholar]
- An, W.; Guo, F.; Song, Y.; Gao, N.; Bai, S.; Dai, J.; Yu, Y.; Wei, H.; Zhang, L.; Yu, D.; et al. Comparative genomics analyses on EPS biosynthesis genes required for floc formation of Zoogloea resiniphila and other activated sludge bacteria. Water Res. 2016, 102, 494–504. [Google Scholar] [CrossRef]
- Wrighton, K.C.; Virdis, B.; Clauwaert, P.; Read, S.T.; Daly, R.A.; Boon, N.; Piceno, Y.; Andersen, G.L.; Coates, J.D.; Rabaey, K. Bacterial community structure corresponds to performance during cathodic nitrate reduction. ISME J. Emultidisciplinary J. Microb. Ecol. 2010, 4, 1443–1455. [Google Scholar] [CrossRef]
- Terna, I.O.; Ahmed, H.R.; Hwa, T.J. Membrane Bioreactor (MBR) Technology for Wastewater Treatment and Reclamation: Membrane Fouling. Membranes 2016, 6, 33. [Google Scholar] [CrossRef]
- Aslam, M.; Charfi, A.; Lesage, G.; Heran, M.; Kim, J. Membrane Bioreactors for Wastewater Treatment: A review of mechanical cleaning by scouring agents to control membrane fouling. Chem. Eng. J. 2017, 307, 897–913. [Google Scholar] [CrossRef]


| Parameter | Concentration (mg/L) |
|---|---|
| CODCr | 300 ± 25.3 |
| BOD5 | 162 ± 38 |
| NH4+-N | 45.2 ± 13.5 |
| TN | 60.1 ± 5.8 |
| TP | 8.6 ± 4.8 |
| Operation Parameter | Value |
|---|---|
| Hydraulic retention time (HRT) | Anaerobic tank/1.5 h; Anoxic tank/2 h; Aerobic tank/4 h |
| Dissolved oxygen (DO) | Anaerobic tank < 0.2 mg/L; Anoxic tank 0.2–0.4 mg/L; Aerobic tank 3 mg/L |
| Sludge retention time (SRT) | 30 d |
| Mixed liquid suspended solids (MLSS) | 7000–9000 mg/L |
| Flow rate | 6 L/min |
| The dimension of reactors | Anaerobic tank/80 L; Anoxic tank/80 L; Aerobic tank/200 L |
| Temperature | 26 ± 6 °C |
| Parameter | Value |
|---|---|
| Membrane material | Polyvinylidene fluoride (PVDF) |
| Membrane form | Immersed plate microfiltration membrane |
| Pore size | 0.20 μm |
| Diaphragm size | 1570 mm × 500 mm × 7 mm |
| Effective membrane area | 1.4 m2 |
| Design running flux | 10–25 L/m2·h |
| Applicable cleaning method | Pickling cleaning, alkaline cleaning, and physical cleaning |
| Sample | Sample Name | OTU | Chao | Coverage | Shannon | Simpson |
|---|---|---|---|---|---|---|
| S1 | Influent | 3388 | 18,174.27 | 0.93 | 5.12 | 0.03 |
| S2 | Anaerobic tank | 3431 | 19,438.27 | 0.92 | 5.19 | 0.04 |
| S3 | Anoxic tank | 3531 | 16,194.30 | 0.94 | 5.22 | 0.03 |
| S4 | Aerobic MBR tank | 3128 | 18,060.14 | 0.94 | 5.95 | 0.02 |
| S5 | Disinfection tank | 2496 | 15,483.53 | 0.92 | 4.31 | 0.01 |
| Number | Cleaning Agents | Mass Concentration |
|---|---|---|
| 1 | Sodium hypochlorite | 0.3% |
| 2 | Sodium hypochlorite & sodium hydroxide | 0.3 + 0.1% |
| 3 | Sodium hydroxide | 0.1% |
| 4 | Hydrochloric acid | 0.2% |
| 5 | Sodium hydroxide followed by hydrochloric acid | 0.1 + 0.2% |
| 6 | Hydrochloric acid followed by sodium hydroxide | 0.2 + 0.1% |
© 2019 by the authors. Licensee MDPI, Basel, Switzerland. This article is an open access article distributed under the terms and conditions of the Creative Commons Attribution (CC BY) license (http://creativecommons.org/licenses/by/4.0/).
Share and Cite
Li, F.; An, X.; Feng, C.; Kang, J.; Wang, J.; Yu, H. Research on Operation Efficiency and Membrane Fouling of A2/O-MBR in Reclaimed Water Treatment. Membranes 2019, 9, 172. https://doi.org/10.3390/membranes9120172
Li F, An X, Feng C, Kang J, Wang J, Yu H. Research on Operation Efficiency and Membrane Fouling of A2/O-MBR in Reclaimed Water Treatment. Membranes. 2019; 9(12):172. https://doi.org/10.3390/membranes9120172
Chicago/Turabian StyleLi, Fenfen, Xinyue An, Cuimin Feng, Jianwei Kang, Junling Wang, and Hongying Yu. 2019. "Research on Operation Efficiency and Membrane Fouling of A2/O-MBR in Reclaimed Water Treatment" Membranes 9, no. 12: 172. https://doi.org/10.3390/membranes9120172
APA StyleLi, F., An, X., Feng, C., Kang, J., Wang, J., & Yu, H. (2019). Research on Operation Efficiency and Membrane Fouling of A2/O-MBR in Reclaimed Water Treatment. Membranes, 9(12), 172. https://doi.org/10.3390/membranes9120172