Successful Integration of Membrane Technologies in a Conventional Purification Process of Tannery Wastewater Streams


Abstract
:1. Introduction
2. Experimental setup
2.1. The Tannery Wastewater Stream
- Coarse gridding
- Sedimentation of sand
- Oil skimming
- Oxidation of sulfides
- Flocculation
- Flotation

| Parameter | ID | Unit | Value |
|---|---|---|---|
| Chemical oxygen demand | COD | mg/L | 55,000 |
| Total suspended solids | TSS | mg/L | 985 |
| Ammonium | NH4 | mg/L | 74 |
| Phosphates | P | mg/L | 2.6 |
| Sulfides | S | mg/L | 0.14 |
| Chromium | Cr | mg/L | 198 |
| Parameter | Unit | Value | Discharge limits |
|---|---|---|---|
| COD | mg/L | 2,020 | 160 |
| TSS | mg/L | 266 | 80 |
| NH4 | mg/L | 69 | 15 |
| P | mg/L | 2.5 | 10 |
| S | mg/L | 0.09 | 1 |
| Cr | mg/L | 195 | 2 |
2.2. The Membrane Pilot Plant Used

3. Results and Discussion
| TMP (bar) | ∆ t (h) | (−∆ m/∆t)° (L h−2 m−2 bar) × 10−5 | (−∆ m/∆t)* (L h−2 m−2 bar) × 10−5 |
|---|---|---|---|
| 2 | 1 | 14.124 | 14.124 |
| 3 | 2 | 5.817 | 14.124 |
| 4 | 3 | 6.394 | 14.124 |
| 5 | 4 | 12.191 | 14.124 |
| 6 | 5 | 16.130 | 14.124 |
| 7 | 6 | 16.847 | 14.124 |
| Parameter | Unit | Value | Discharge limits |
|---|---|---|---|
| COD | mg/L | 102 | 160 |
| TSS | mg/L | 0 | 80 |
| NH4 | mg/L | 5.89 | 15 |
| P | mg/L | <2.5 | 10 |
| S | mg/L | 0.09 | 1 |
| Cr | mg/L | 7.92 | 2 |

| Parameter | Unit | Value | Discharge limits |
|---|---|---|---|
| COD | mg/L | 86 | 160 |
| TSS | mg/L | 0 | 80 |
| Cr | mg/L | 0.04 | 2 |
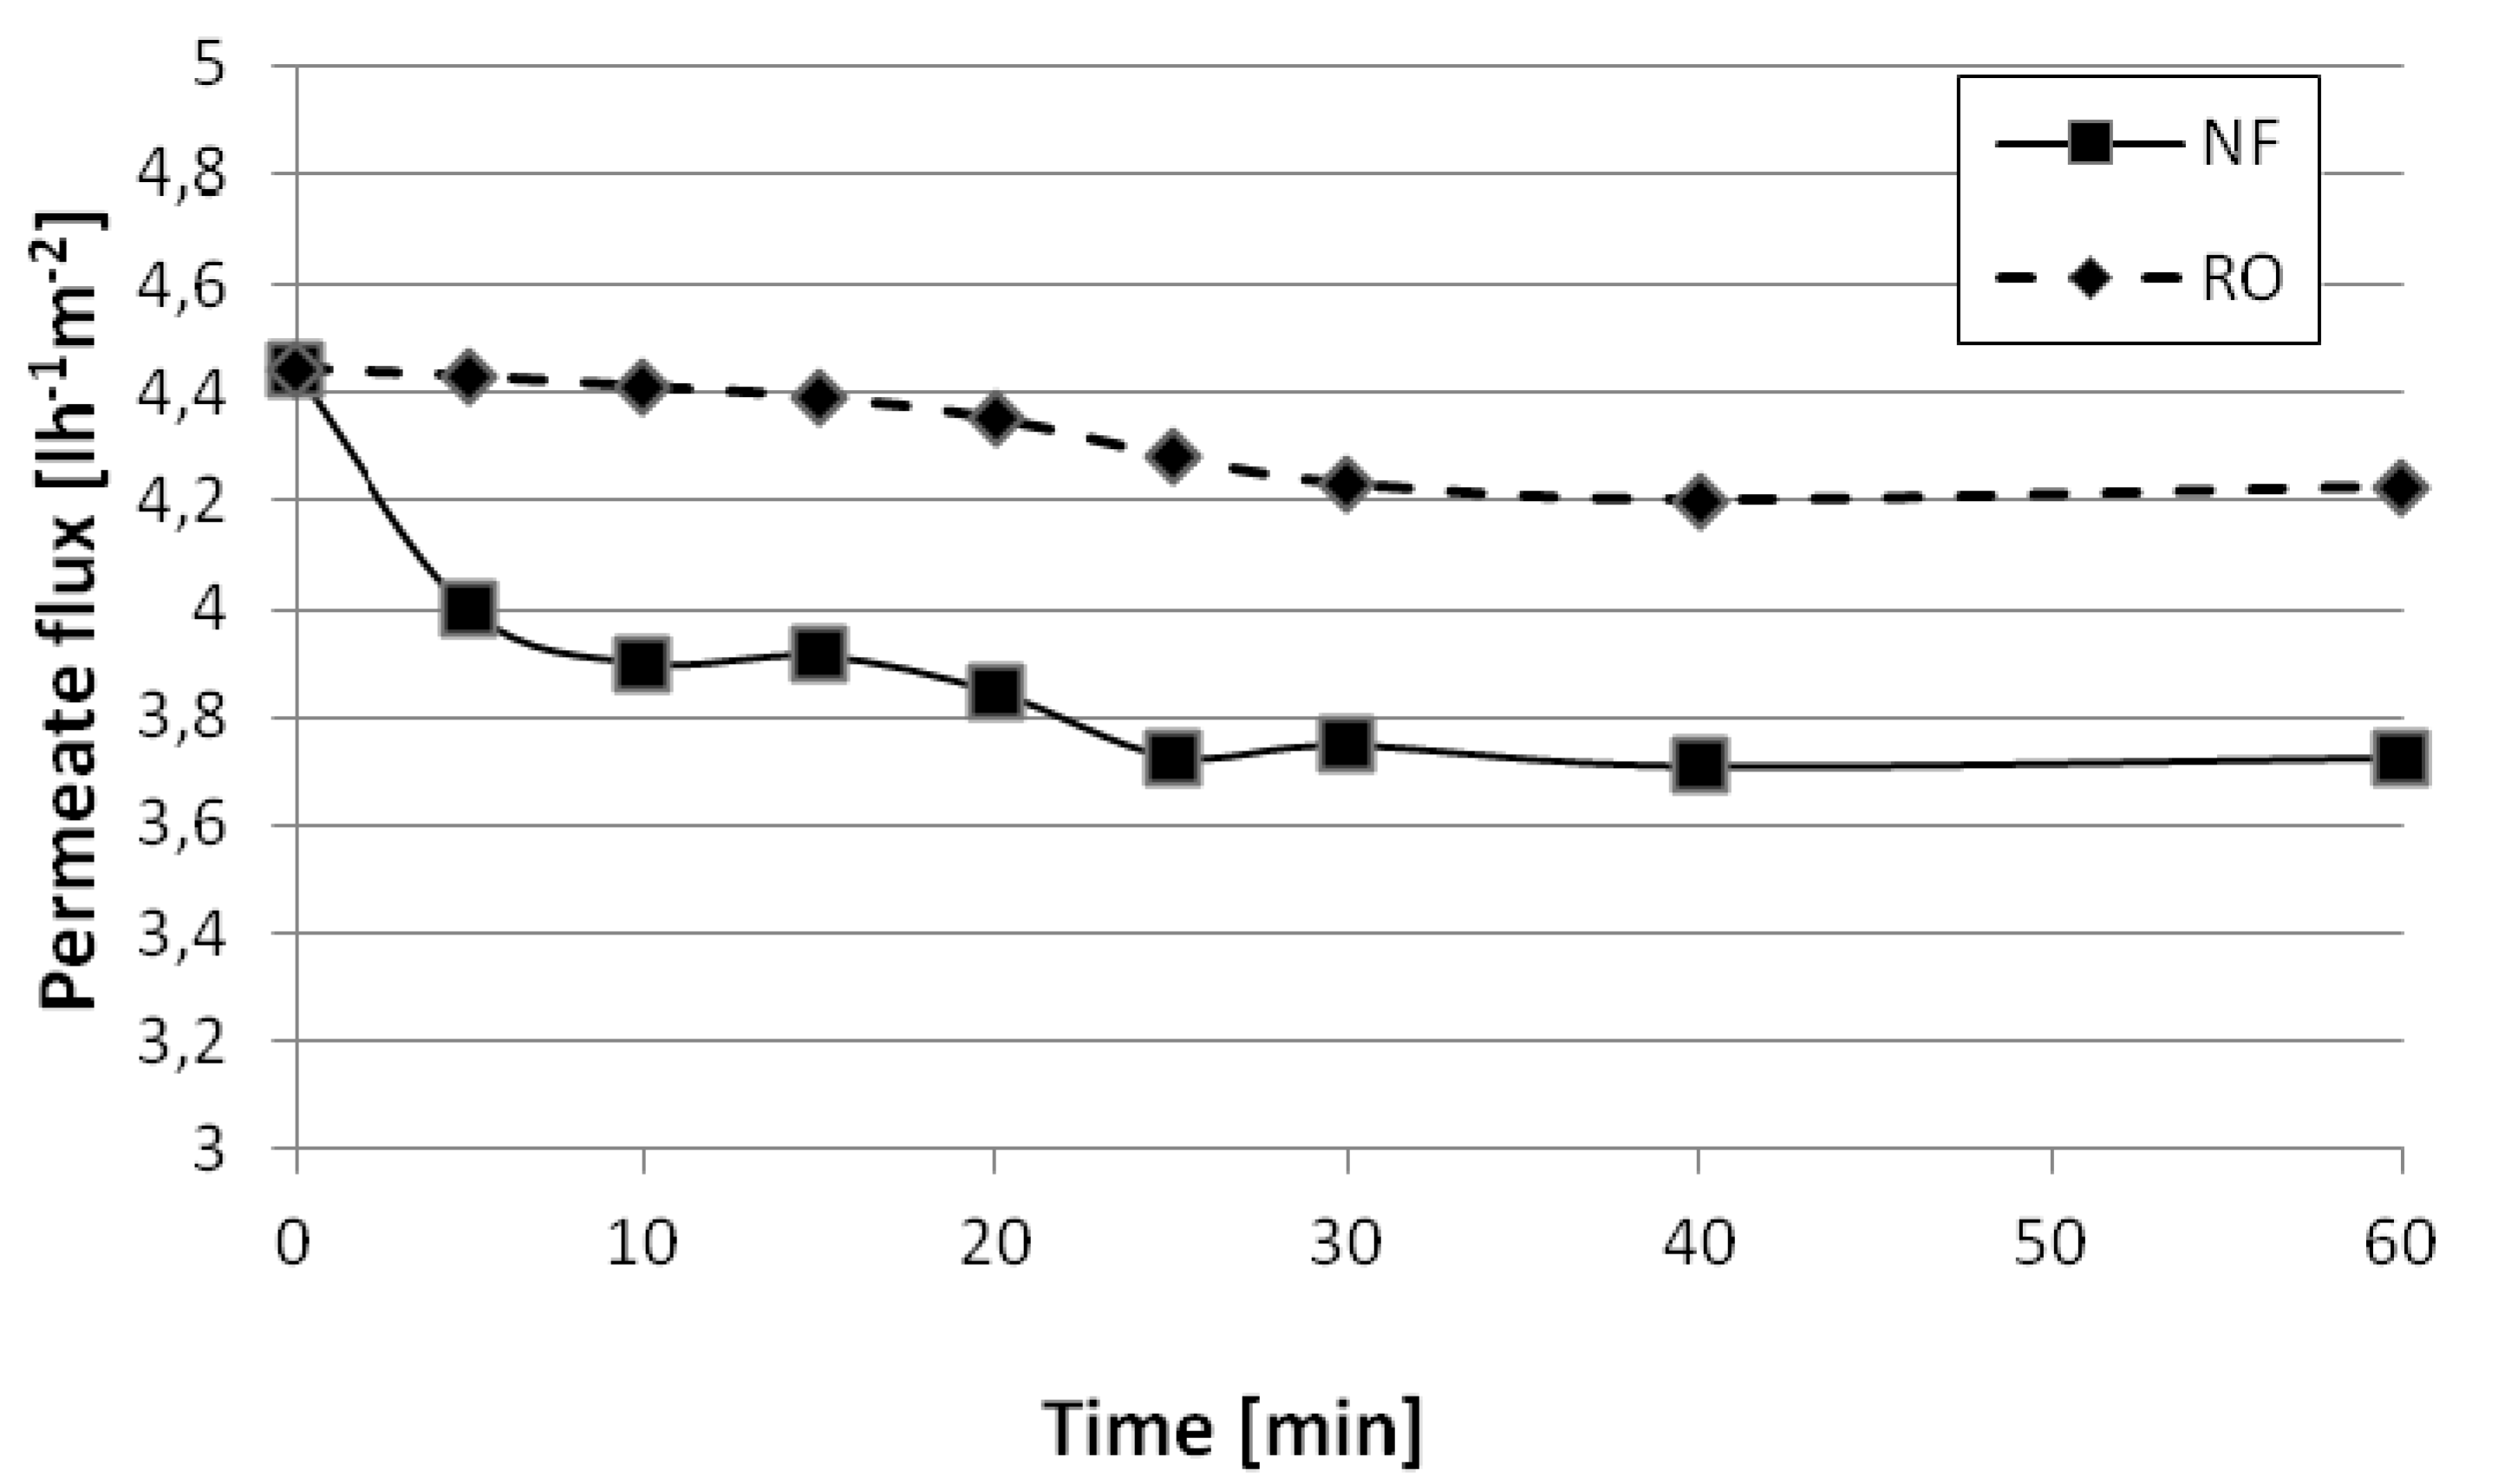
- Investment costsThe membrane plant is designed for a capacity of 646 m3 h−1, in “feed & bleed” configuration, capable of guaranteeing the project permeate flux, equal to the one found at the end of NF operation and equal to 3.7 L m−2 h−1 (see Figure 2). In the case of NF, the permeate flux will reduce accordingly to the value of the “a” parameter, that is, of 3.7 L m−2 h−1 every 1,101 days. This means that NF membrane modules must be substituted every three years. This is not the case of RO, which is less prone to fouling, which may be substituted every five years. In the case of an overdesign of the surface area of NF of 100%, the number of required membrane modules, each having 32 m2 of membrane area, are 5456 and 2584 for NF and RO, respectively.Moreover, 4020 membrane housings, each capable of hosting two membrane modules, are needed. The hypothesized configuration adopted in this preliminary economic analysis was parallel, and the mean pressure drop estimated is approximately 1 bar. Moreover, the housings need to be served by pumps, piping and instrumentation (50% of the membrane housing costs), and in addition to this, the plant needs space and services (15% of total costs). Finally, a yearly fixed amortization rate, for 15 year plant lifetime, equal to 6%, is taken into account. The adopted costs for the membrane module and housing were 25 € m−2 and 400 €.
- Operating costsMainly given by electricity consumption of the pumps and maintenance (10% of plant costs), a total of 80 kW of electric power is required. Costs are 0.11 € kWh−1.
- Disposal of concentratesThe NF concentrates must be compressed by a filter press and then sent to disposal at fixed fees. The almost clear RO concentrate, rich in chromium, may be recycled back to the tannery process, in this study, without costs or benefits.
| Costs [€ m−3] | Membrane process |
|---|---|
| Amortization costs | 1.44 |
| Operating costs | 0.12 |
| Disposal of concentrates | 0.24 |
| TOTAL | 1.80 |
4. Conclusions
References
- Uberoi, N.K. Environmental Management; Excel Books: New Delhi, India, 2003; p. 269. [Google Scholar]
- Wiegant, W.M.; Kalker, T.J.J.; Sontakke, V.N.; Zwaag, R.R. Full scale experience with tannery water management: An integrated approach. Water Sci. Technol. 1999, 39, 169–176. [Google Scholar]
- Sreeram, K.J.; Ramasami, T. Sustaining tanning process through conservation, recovery and better utilization of chromium. Resour. Conserv. Recycl. 2003, 38, 185–212. [Google Scholar] [CrossRef]
- Stoop, M.L.M. Water management of production systems optimised by environmentally oriented integral chain management: Case study of leather manufacturing in developing countries. Technovation 2003, 23, 265–278. [Google Scholar] [CrossRef]
- Ahn, D.H.; Chung, Y.C.; Yoo, Y.J.; Pak, D.W.; Chang, W.S. Improved treatment of tannery wastewater using zoogloea ranigera and its extracellular polymer in an activated sludge process. Biotechnol. Lett. 1996, 18, 917–922. [Google Scholar] [CrossRef]
- Vijayaraghvan, K.; Murthy, D.V.H. Effect of toxic substances inanaerobic treatment of tannery wastewater. Bioprocess Biosys. Eng. 1997, 16, 151–155. [Google Scholar] [CrossRef]
- Wiemann, M.; Schenk, H.; Hegemann, W. Anaerobic treatment oftannery wastewater with simultaneous sulphide elimination. Water Res. 1998, 32, 774–780. [Google Scholar] [CrossRef]
- Di Iaconi, C.; Lopez, A.; Ramadori, R.; Passino, R. Tannerywastewater treatment by sequencing batch biofilm reactor. Environ. Sci. Technol. 2003, 37, 3199–3205. [Google Scholar] [CrossRef]
- Farabegoli, G.; Carucci, A.; Majone, M.; Rolle, E. Biological treatment of tannery wastewater in the presence of chromium. J. Environ. Manag. 2004, 71, 345–349. [Google Scholar] [CrossRef]
- Schrank, S.G.; Jos, H.J.; Moreira, R.F.P.M.; Schroder, H.F. Fentons oxidation of various-based tanning materials. Desalination 2003, 50, 411–423. [Google Scholar]
- Sekaran, G.; Chitra, K.; Mariappan, K.; Raghavan, K.V. Removal of sulphide in anaerobically treated tannery wastewater by wet air oxidation. J. Environ. Sci. Health 1996, 31, 579–598. [Google Scholar]
- Dogruel, S.; Ates, G.E.; Germirli, B.F.; Orhon, D. Ozonation of nonbiodegradable organics in tannery wastewater. J. Environ. Sci. Health. A 2004, 39, 1705–1715. [Google Scholar] [CrossRef]
- Sacco, O.; Stoller, M.; Vaiano, V.; Ciambelli, P.; Chianese, A.; Sannino, D. Photocatalytic Degradation of Organic Dyes under Visible Light on N-Doped Photocatalysts. Int. J. Photoenergy 2012, 2012, 626759:1–626759:8. [Google Scholar]
- Sannino, D.; Vaiano, V.; Sacco, O.; Ciambelli, P. Mathematical modelling of photocatalytic degradation of methylene blue under visible light irradiation. J. Environ. Chem. Eng. 2013, 1, 56–60. [Google Scholar] [CrossRef]
- De Caprariis, B.; di Rita, M.; Stoller, M.; Verdone, N.; Chianese, A. Reaction-precipitation by a spinning disc reactor: Influence of hydrodynamics on nanoparticles production. Chem. Eng. Sci. 2012, 76, 73–80. [Google Scholar] [CrossRef]
- Di Iaconi, C.; Lopez, A.; Ricco, G.; Ramadori, R. Treatment options for tannery wastewater. I: Alkalinization with or without post-ozonation. J. Anal. Environ. Cultur. Herit. Chem. 2001, 91, 587–594. [Google Scholar]
- Orhon, D.; Sözen, S.; Çokgör, E.U.; Genceli, E.A. The effect of chemical settling on the kinetics and design of activated sludge for tannery wastewaters. Water Sci. Technol. 1998, 38, 355–362. [Google Scholar] [CrossRef]
- Song, Z.; Williams, C.J.; Edyvean, R.G.J. Treatment of tannery wastewater by chemical coagulation. Desalination 2004, 164, 249–259. [Google Scholar] [CrossRef]
- Churchley, J.H. Removal of sewage effluent—The use of a fullscaleozone plant. Water Sci. Technol. 1994, 30, 275–284. [Google Scholar]
- Stern, S.R.; Rodighiro, I. Aerobic treatment of textile dyeing wastewater. Water Sci. Technol. 2003, 47, 55–59. [Google Scholar]
- Chu, W. Dye removal from textile dye wastewaters using recycled alum sludge. Water Res. 2001, 35, 3147–3152. [Google Scholar] [CrossRef]
- Field, R.W.; Wu, D.; Howell, J.A.; Gupta, B.B. Critical flux concept for microfiltration fouling. J. Membr. Sci. 1995, 100, 259–272. [Google Scholar] [CrossRef]
- Le-Clech, P.; Chen, V.; Fane, T.A.G. Fouling in membrane bioreactors used in wastewater treatment. J. Membr. Sci. 2006, 284, 17–53. [Google Scholar] [CrossRef]
- Field, R.W.; Pearce, G.K. Critical, sustainable and threshold fluxes for membrane filtration with water industry applications. Adv. Colloid Interface Sci. 2011, 164, 38–44. [Google Scholar] [CrossRef]
- Stoller, M.; Bravi, M.; Chianese, A. Threshold flux measurements of a nanofiltration membrane module by critical flux data conversion. Desalination 2013, 315, 142–148. [Google Scholar] [CrossRef]
- Stoller, M.; Chianese, A. Optimization of membrane batch processes by means of the critical flux theory. Desalination 2006, 191, 62–70. [Google Scholar] [CrossRef]
- Stoller, M.; Bravi, M. Critical flux analyses on differently pretreated olive vegetation waste water streams: some case studies. Desalination 2010, 250, 578–582. [Google Scholar] [CrossRef]
- Stoller, M. On the effect of flocculation as pretreatment process and particle size distribution for membrane fouling reduction. Desalination 2009, 240, 209–217. [Google Scholar] [CrossRef]
- Iaquinta, M.; Stoller, M.; Merli, C. Optimization of a nanofiltration membrane process for tomato industry wastewater effluent treatment. Desalination 2009, 245, 314–320. [Google Scholar] [CrossRef]
- Stoller, M. Technical optimization of a dual ultrafiltration and nanofiltration pilot plant in batch operation by means of the critical flux theory: A case study. Chem. Eng. Process. 2008, 47, 1165–1170. [Google Scholar] [CrossRef]
- Stoller, M. Effective fouling inhibition by critical flux based optimization methods on a NF membrane module for olive mill wastewater treatment. Chem. Eng. J. 2011, 168, 1140–1148. [Google Scholar] [CrossRef]
- Ochando-Pulido, J.M.; Stoller, M.; Bravi, M.; Martinez-Ferez, A.; Chianese, A. Batch membrane treatment of olive vegetation wastewater from two-phase olive oil production process by threshold flux based methods. Sep. Purif. Technol. 2012, 101, 34–41. [Google Scholar] [CrossRef]
- Stoller, M.; de Caprariis, B.; Cicci, A.; Verdone, N.; Bravi, M.; Chianese, A. About proper membrane process design affected by fouling by means of the analysis of measured threshold flux data. Sep. Purif. Technol. 2013, 114, 83–89. [Google Scholar] [CrossRef]
- Stoller, M.; Ochando Pulido, J.M.; Chianese, A. Comparison of Critical and Threshold Fluxes on Ultrafiltration and Nanofiltration by Treating 2-phase or 3-phase Olive Mill Wastewater. Chem. Eng. Trans. 2013, 32, 397–402. [Google Scholar]
- Stoller, M. A Three Year Long Experience of Effective Fouling Inhibition by Threshold Flux Based Optimization Methods on a NF Membrane Module for Olive Mill Wastewater Treatment. Chem. Eng. Trans. 2013, 32, 37–42. [Google Scholar]
© 2013 by the authors; licensee MDPI, Basel, Switzerland. This article is an open access article distributed under the terms and conditions of the Creative Commons Attribution license (http://creativecommons.org/licenses/by/3.0/).
Share and Cite
Stoller, M.; Sacco, O.; Sannino, D.; Chianese, A. Successful Integration of Membrane Technologies in a Conventional Purification Process of Tannery Wastewater Streams. Membranes 2013, 3, 126-135. https://doi.org/10.3390/membranes3030126
Stoller M, Sacco O, Sannino D, Chianese A. Successful Integration of Membrane Technologies in a Conventional Purification Process of Tannery Wastewater Streams. Membranes. 2013; 3(3):126-135. https://doi.org/10.3390/membranes3030126
Chicago/Turabian StyleStoller, Marco, Olga Sacco, Diana Sannino, and Angelo Chianese. 2013. "Successful Integration of Membrane Technologies in a Conventional Purification Process of Tannery Wastewater Streams" Membranes 3, no. 3: 126-135. https://doi.org/10.3390/membranes3030126
APA StyleStoller, M., Sacco, O., Sannino, D., & Chianese, A. (2013). Successful Integration of Membrane Technologies in a Conventional Purification Process of Tannery Wastewater Streams. Membranes, 3(3), 126-135. https://doi.org/10.3390/membranes3030126