
DPPC Membrane Under Lateral Compression and Stretching to Extreme Limits: Phase Transitions and Rupture


Abstract
1. Introduction
2. Methodology
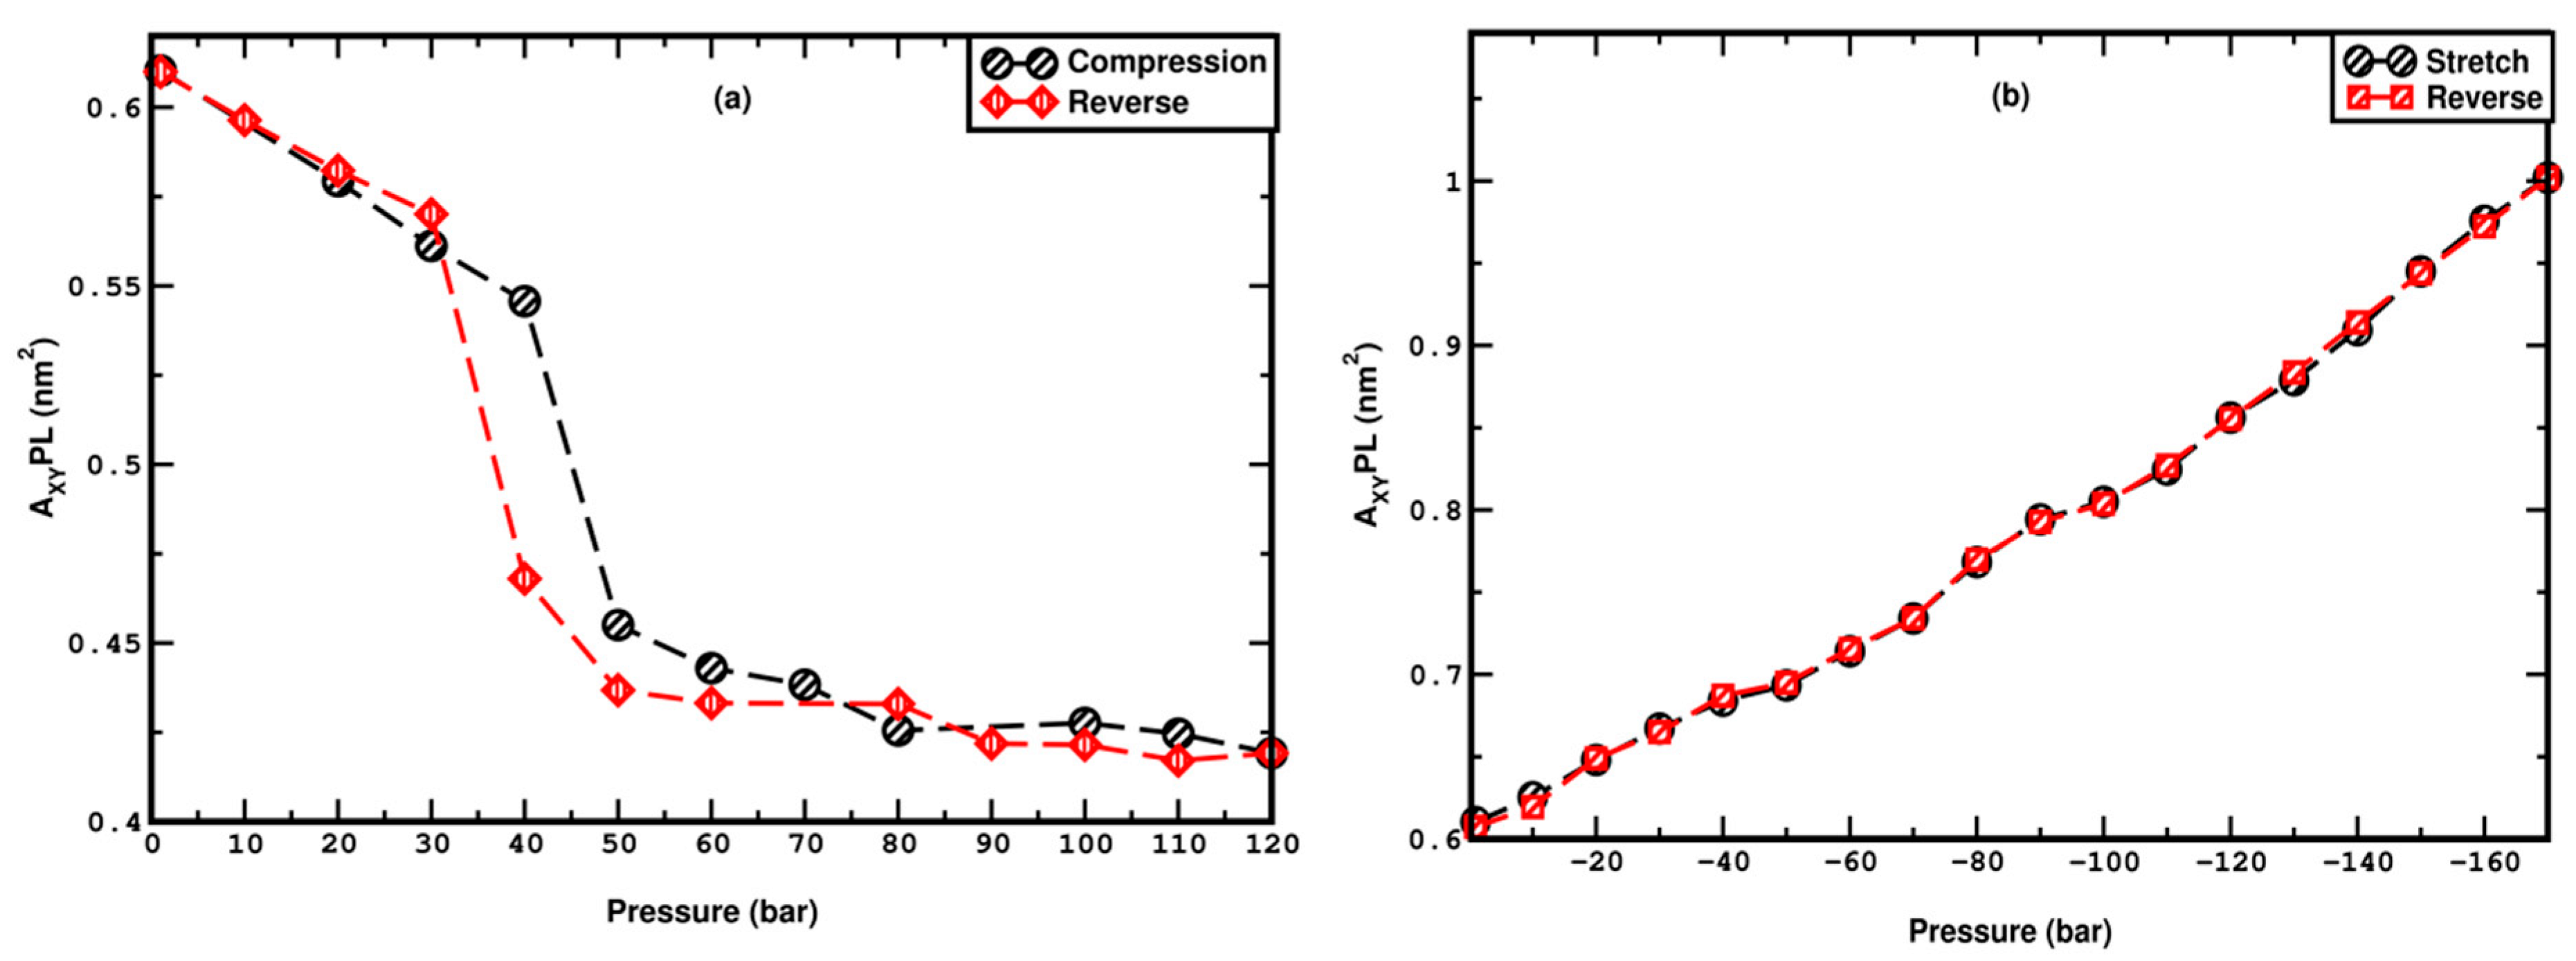
Area per Lipid
3. Results and Discussion
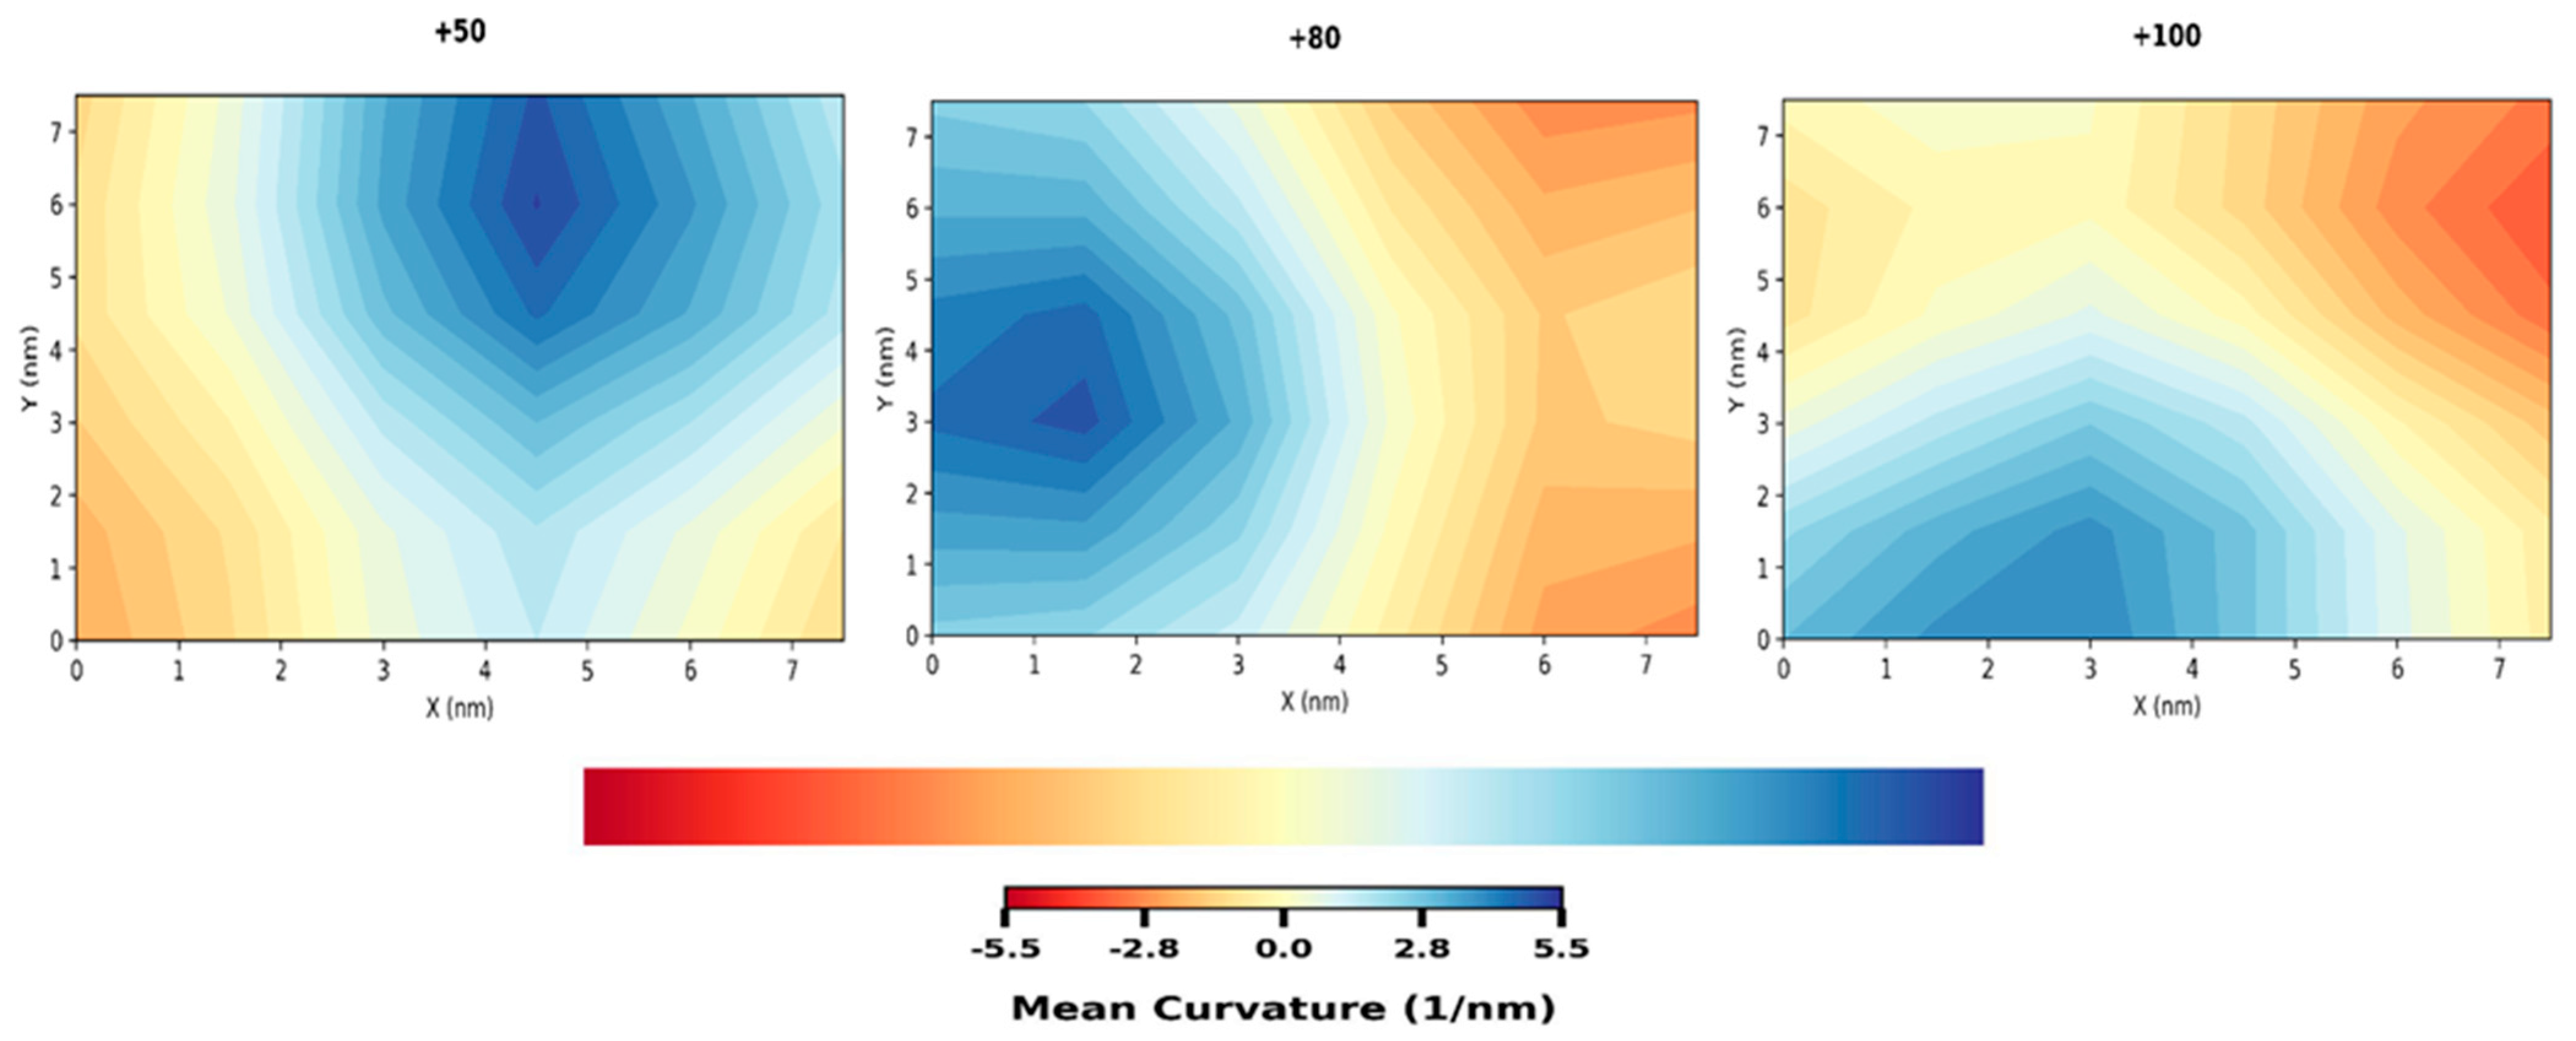
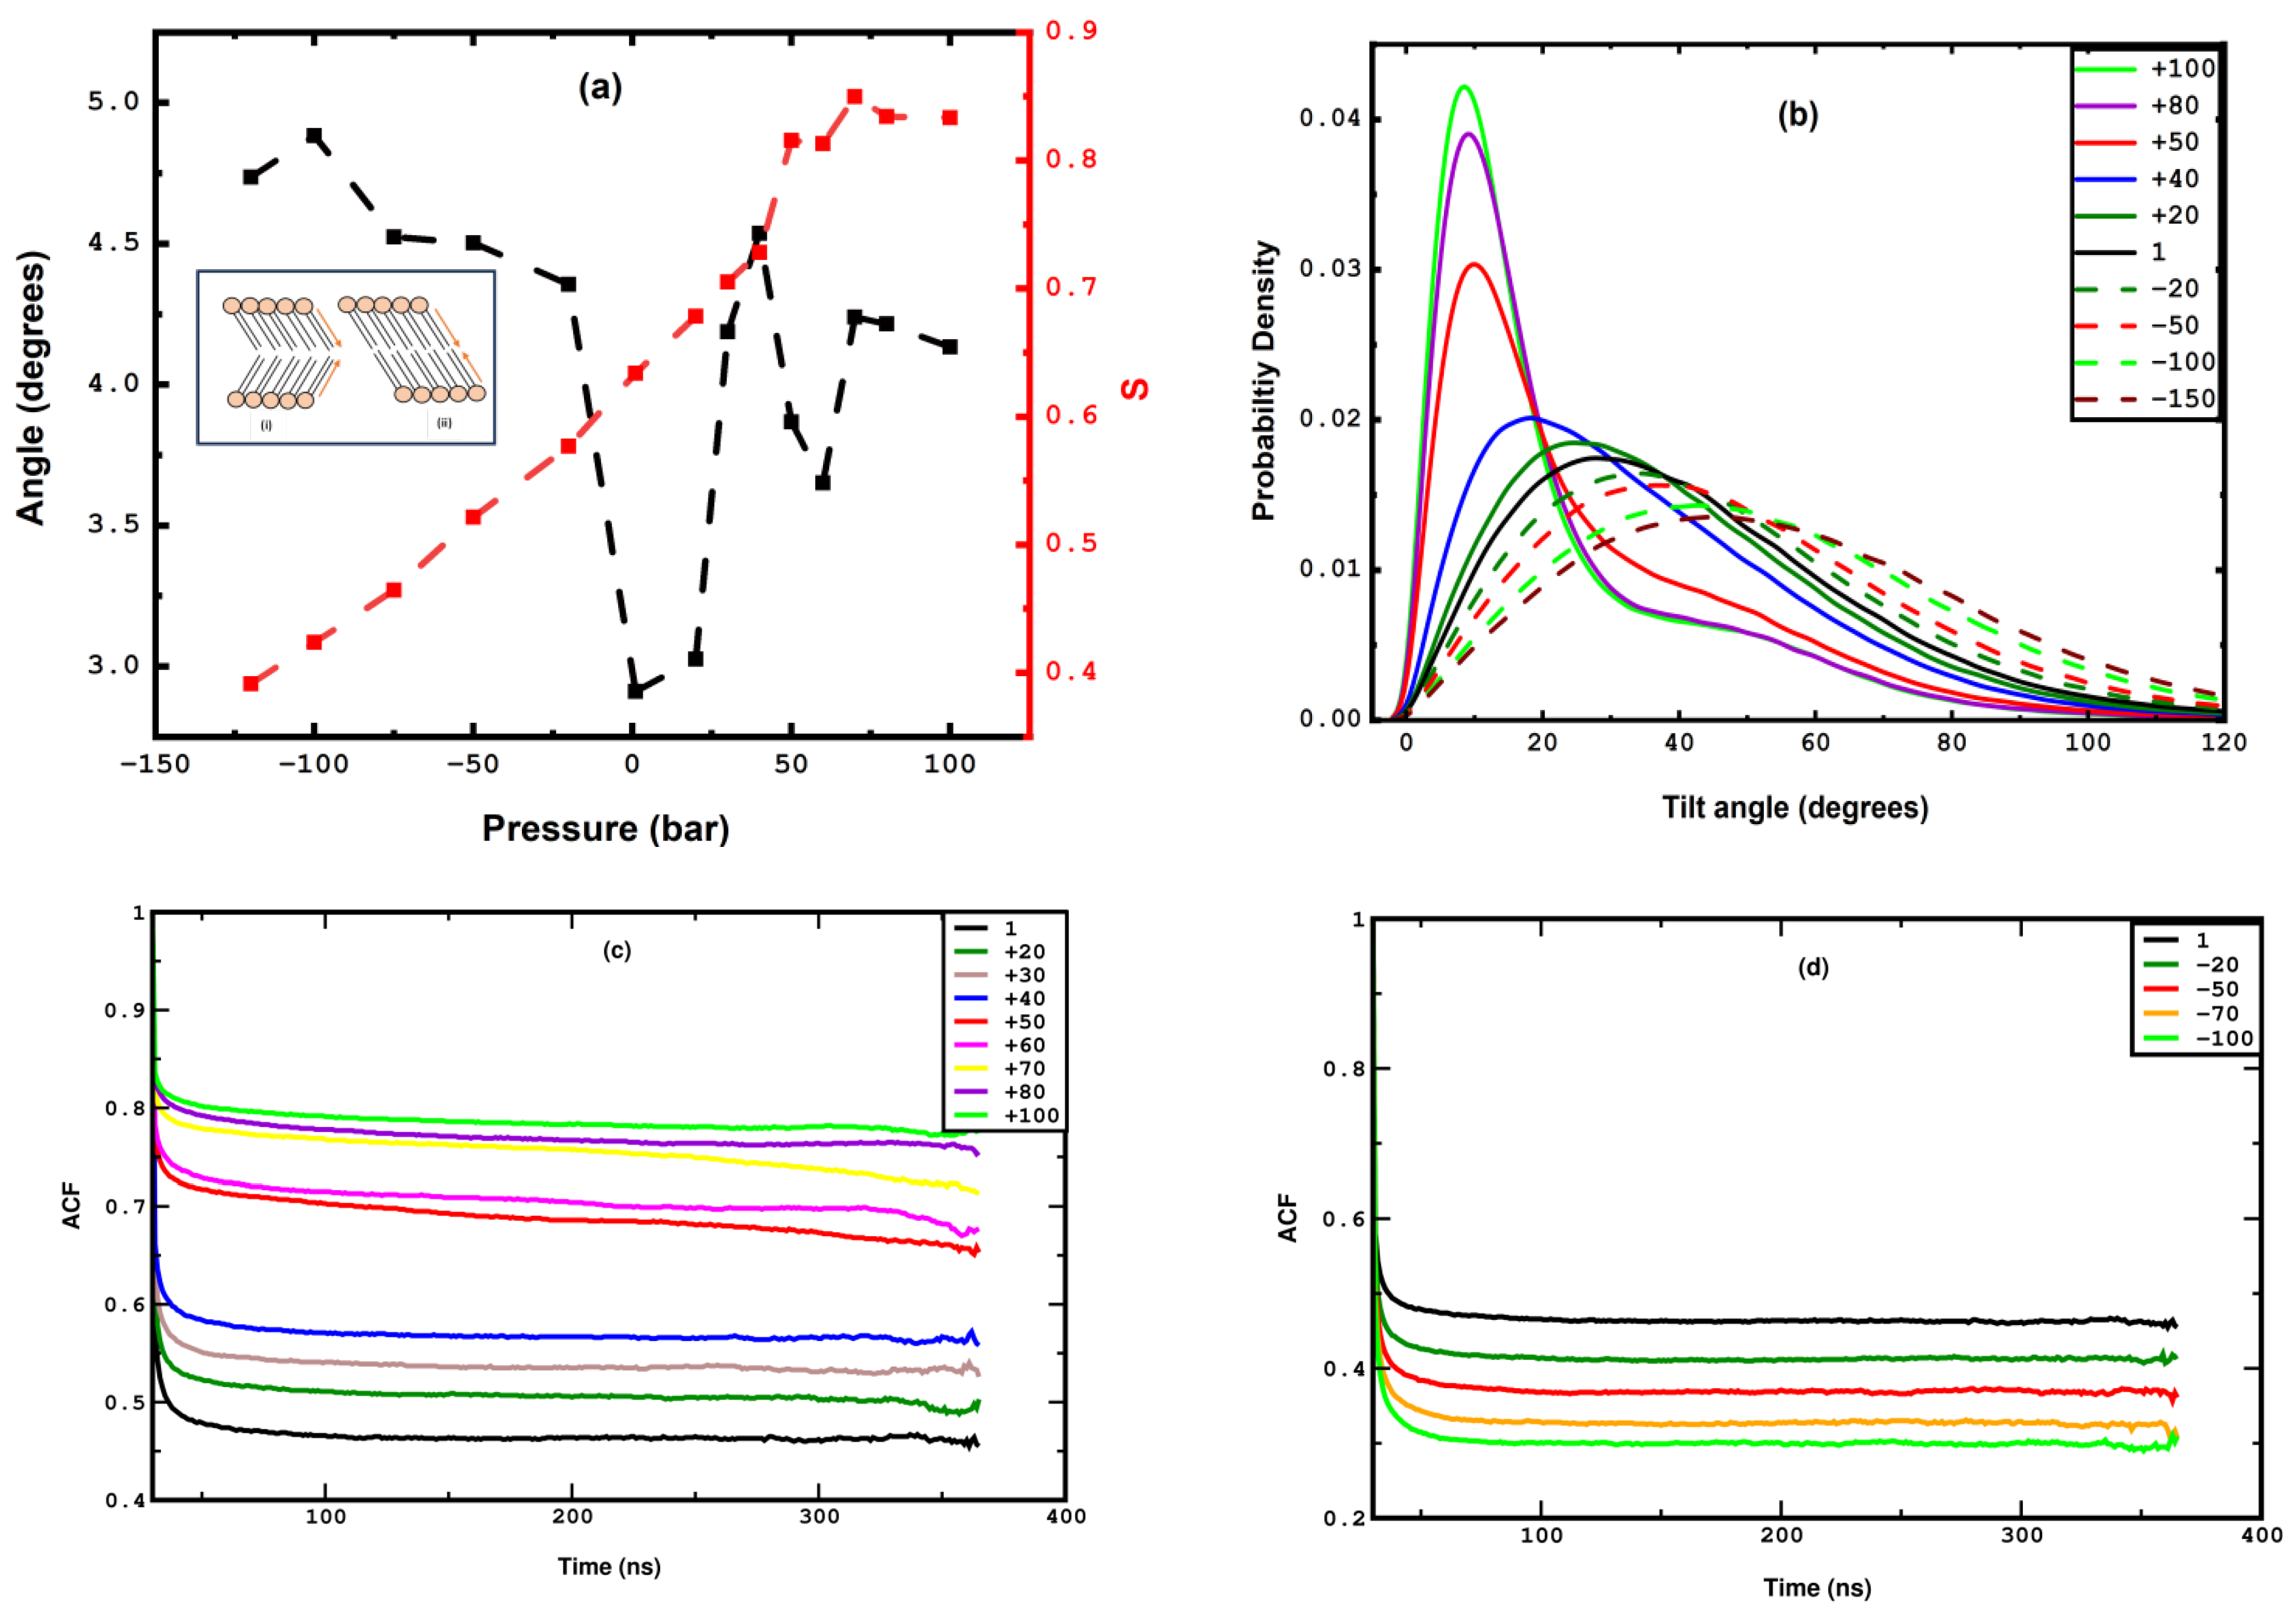
3.1. Compression
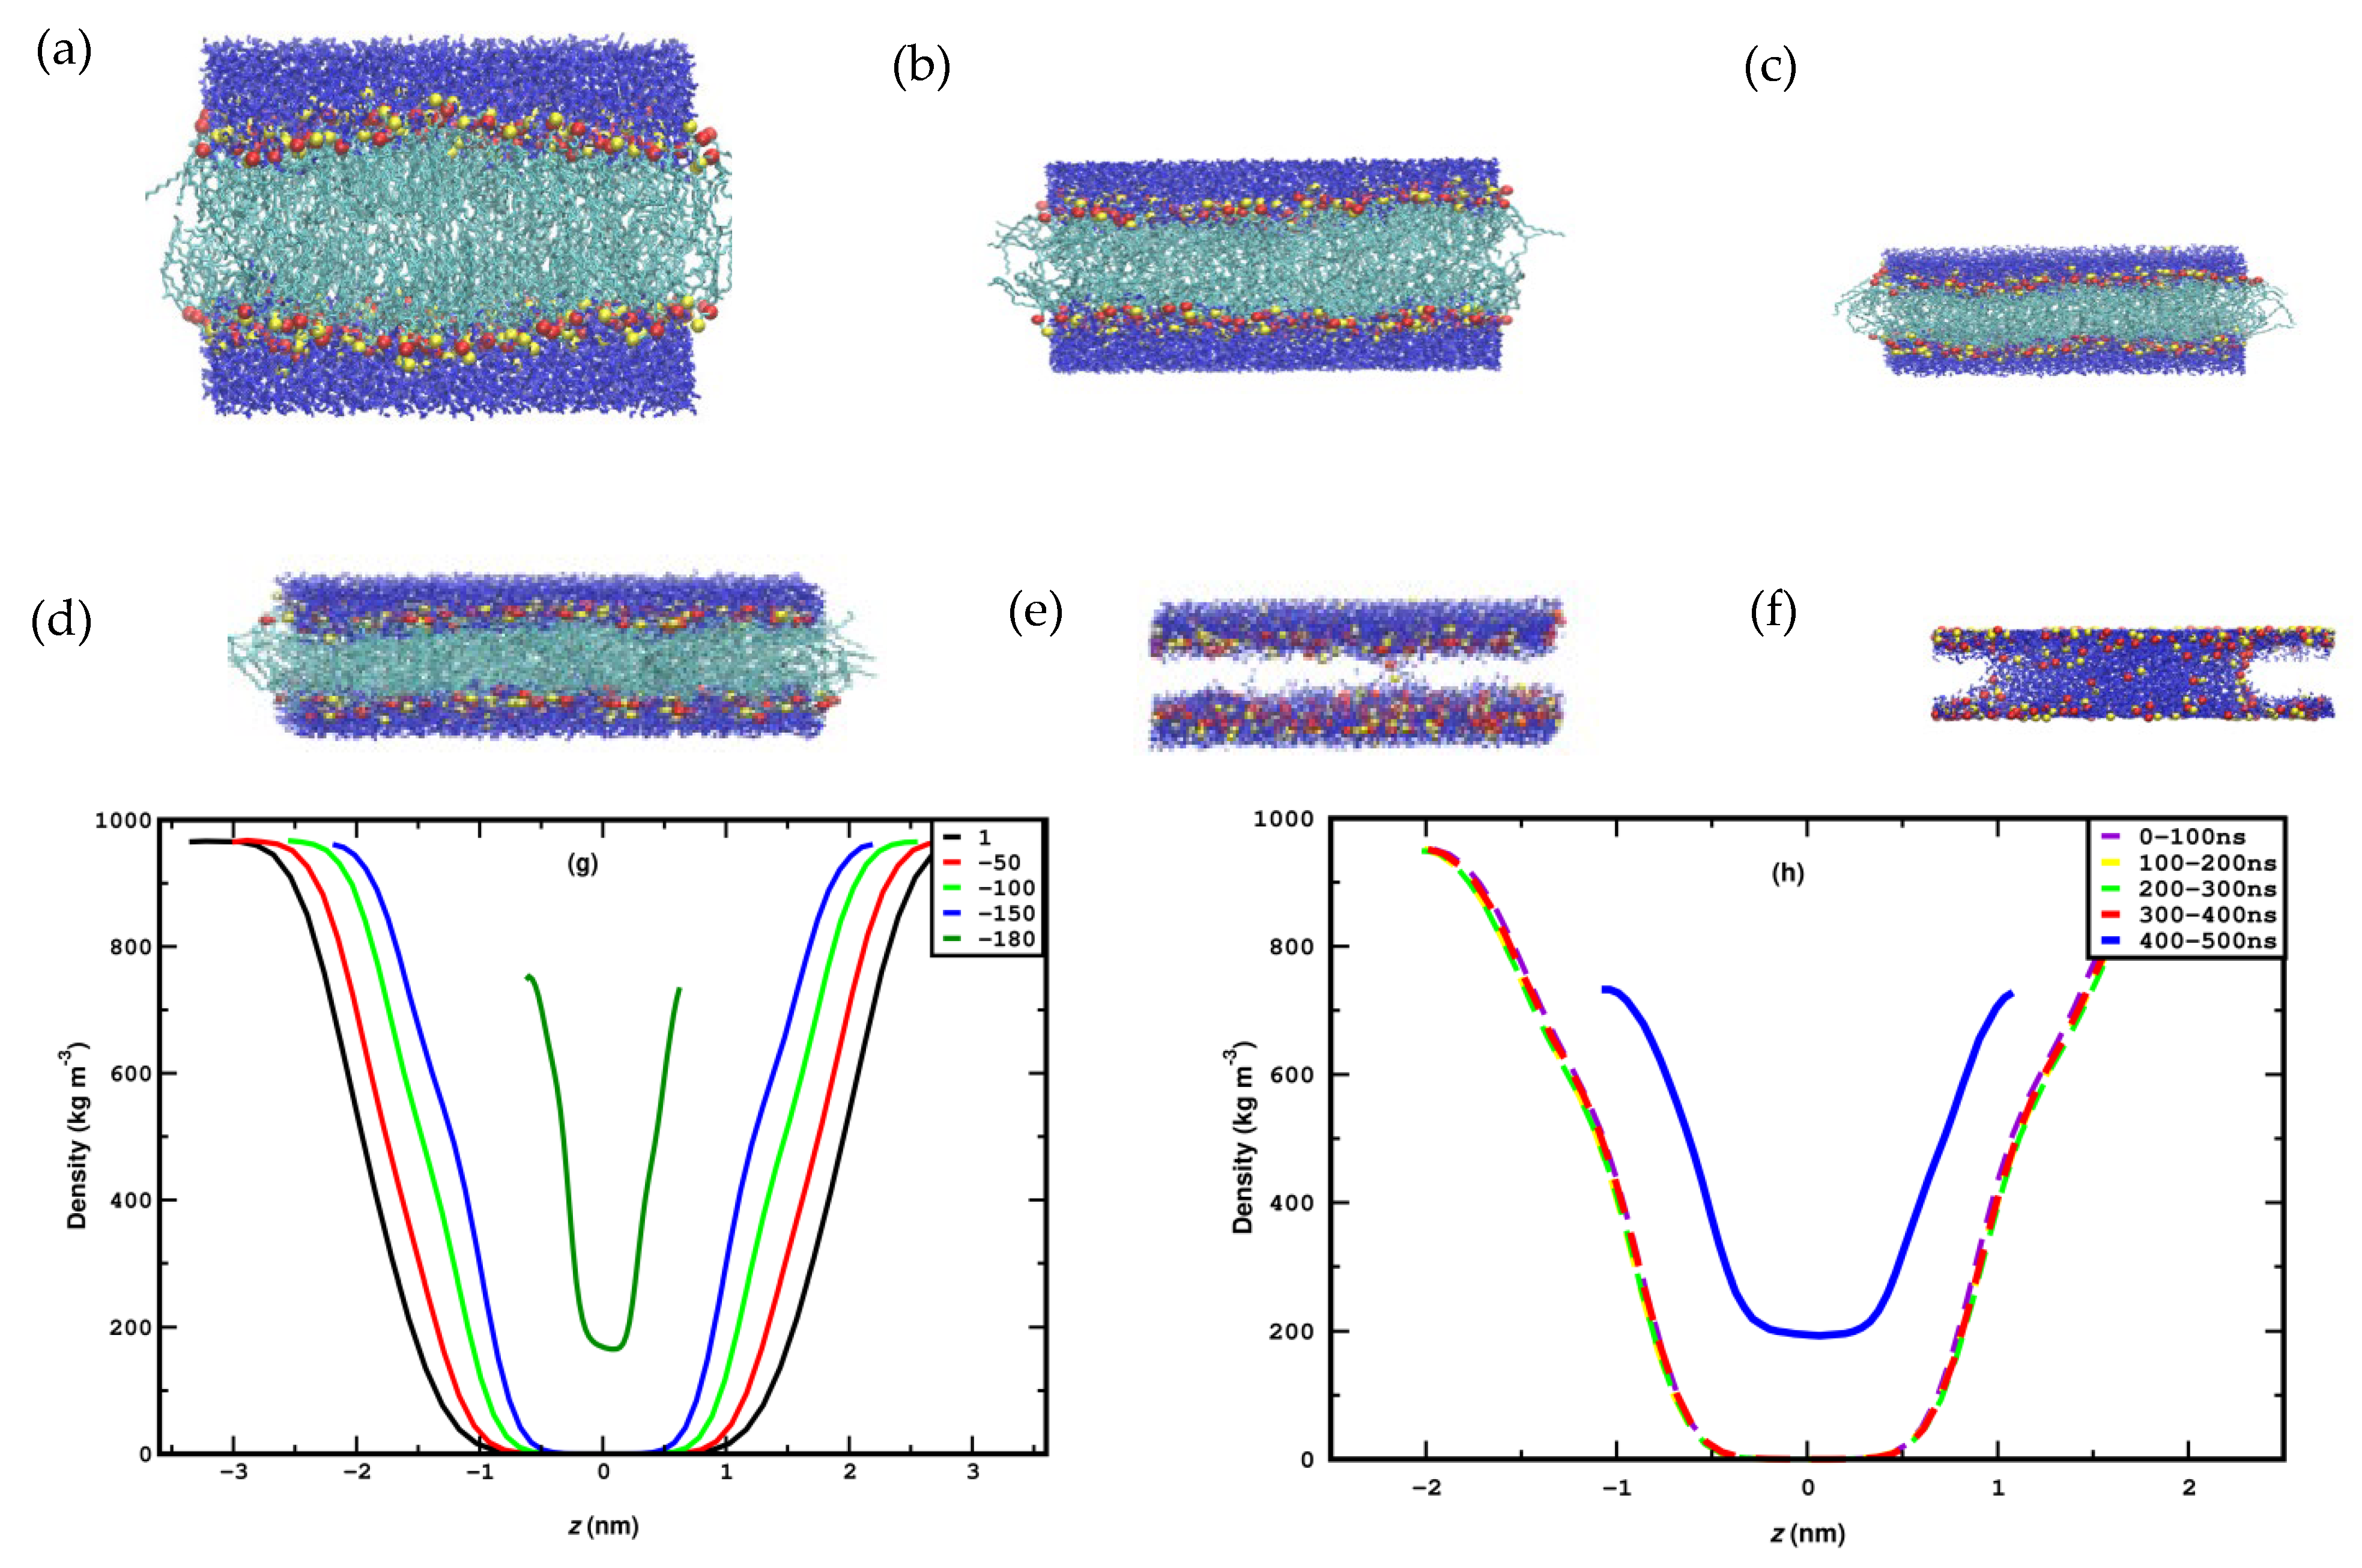
3.2. Stretching
4. Pressure Hysteresis
5. Conclusions
Supplementary Materials
Author Contributions
Funding
Data Availability Statement
Acknowledgments
Conflicts of Interest
References
- Lopes, D.; Jakobtorweihen, S.; Nunes, C.; Sarmento, B.; Reis, S. Shedding light on the puzzle of drug-membrane interactions: Experimental techniques and molecular dynamics simulations. Prog. Lipid Res. 2017, 65, 24–44. [Google Scholar] [CrossRef] [PubMed]
- Van Meer, G.; Voelker, D.R.; Feigenson, G.W. Membrane lipids: Where they are and how they behave. Nat. Rev. Mol. Cell Biol. 2008, 9, 112–124. [Google Scholar] [CrossRef]
- Sych, T.; Gurdap, C.O.; Wedemann, L.; Sezgin, E. How does liquid-liquid phase separation in model membranes reflect cell membrane heterogeneity? Membranes 2021, 11, 323. [Google Scholar] [CrossRef] [PubMed]
- Gupta, S.; Soni, J.; Kumar, A.; Mandal, T. Origin of the nonlinear structural and mechanical properties in oppositely curved lipid mixtures. J. Chem. Phys. 2023, 159, 165102. [Google Scholar] [CrossRef] [PubMed]
- Los, D.A.; Murata, N. Membrane fluidity and its roles in the perception of environmental signals. Biochim. Biophys. Acta Biomembr. 2004, 1666, 142–157. [Google Scholar] [CrossRef]
- Peetla, C.; Stine, A.; Labhasetwar, V. Biophysical Interactions with Model Lipid Membranes: Applications in Drug Discovery and Drug Delivery. Mol. Pharm. 2009, 6, 1264–1276. [Google Scholar] [CrossRef]
- McMurchie, E.J.; Raison, J.K. Membrane lipid fluidity and its effect on the activation energy of membrane-associated enzymes. Biochim. Biophys. Acta-Biomembr. 1979, 554, 364–374. [Google Scholar] [CrossRef]
- Niemelä, P.S.; Miettinen, M.S.; Monticelli, L.; Hammaren, H.; Bjelkmar, P.; Murtola, T.; Lindahl, E.; Vattulainen, I. Membrane proteins diffuse as dynamic complexes with lipids. J. Am. Chem. Soc. 2010, 132, 7574–7575. [Google Scholar] [CrossRef]
- Garavaglia, M.; Dopinto, S.; Ritter, M.; Fürst, J.; Saino, S.; Guizzardi, F.; Jakab, M.; Bazzini, C.; Vezzoli, V.; Dossena, S.; et al. Membrane thickness changes ion-selectivity of channel-proteins. Cell. Physiol. Biochem. 2004, 14, 231–240. [Google Scholar] [CrossRef]
- Kasparyan, G.; Hub, J.S. Molecular Simulations Reveal the Free Energy Landscape and Transition State of Membrane Electroporation. Phys. Rev. Lett. 2024, 132, 148401. [Google Scholar] [CrossRef]
- Filipe, H.A.L.; Cardoso, R.M.S.; Loura, L.M.S.; Moreno, M.J. Interaction of Amphiphilic Molecules with Lipid Bilayers: Kinetics of Insertion, Desorption and Translocation. In Membrane Organization and Dynamics; Springer International Publishing: Berlin/Heidelberg, Germany, 2017; Volume 20, pp. 49–89. [Google Scholar]
- Mallick, S.; Agmon, N. Lateral diffusion of ions near membrane surface. Phys. Chem. Chem. Phys. 2024, 26, 19433–19449. [Google Scholar] [CrossRef] [PubMed]
- Kalutskii, M.A.; Galimzyanov, T.R.; Pinigin, K.V. Determination of elastic parameters of lipid membranes from simulation under varied external pressure. Phys. Rev. E 2023, 107, 024414. [Google Scholar] [CrossRef] [PubMed]
- Tomasini, M.D.; Rinaldi, C.; Tomassone, M.S. Molecular dynamics simulations of rupture in lipid bilayers. Exp. Biol. Med. 2010, 235, 181–188. [Google Scholar] [CrossRef]
- Murphy, M.A.; Mun, S.; Horstemeyer, M.F.; Baskes, M.I.; Bakhtiary, A.; LaPlaca, M.C.; Gwaltney, S.R.; Williams, L.N.; Prabhu, R.K. Molecular dynamics simulations showing 1-palmitoyl-2-oleoyl-phosphatidylcholine (POPC) membrane mechanoporation damage under different strain paths. J. Biomol. Struct. Dyn. 2019, 37, 1346–1359. [Google Scholar] [CrossRef]
- Zhang, L.; Zhang, Z.; Jasa, J.; Li, D.; Cleveland, R.O.; Negahban, M.; Jérusalem, A. Molecular dynamics simulations of heterogeneous cell membranes in response to uniaxial membrane stretches at high loading rates. Sci. Rep. 2017, 7, 8316. [Google Scholar] [CrossRef] [PubMed]
- Fanani, M.L.; Ambroggio, E.E. Phospholipases and Membrane Curvature: What Is Happening at the Surface? Membranes 2023, 13, 190. [Google Scholar] [CrossRef]
- Knudsen, H.L.; Frangos, J.A.; Melchior, B.; Brum, C.d.A.; Duarte, I.D.G.; Webb, R.C.; Leite, R.; Norvell, S.M.; Ponik, S.M.; Bowen, D.K.; et al. Role of cytoskeleton in shear stress-induced endothelial nitric oxide production. Am. J. Physiol. Circ. Physiol. 1997, 273, H347–H355. [Google Scholar] [CrossRef]
- Gudi, S.; Nolan, J.P.; Frangos, J.A. Modulation of GTPase activity of G proteins by fluid shear stress and phospholipid composition. Proc. Natl. Acad. Sci. USA 1998, 95, 2515–2519. [Google Scholar] [CrossRef]
- Sukharev, S.I.; Blount, P.; Martinac, B.; Blattner, F.R.; Kung, C. A large-conductance mechanosensitive channel in E. coli encoded by mscL alone. Nature 1994, 368, 265–268. [Google Scholar] [CrossRef]
- Shigematsu, T.; Koshiyama, K.; Wada, S. Effects of Stretching Speed on Mechanical Rupture of Phospholipid/Cholesterol Bilayers: Molecular Dynamics Simulation. Sci. Rep. 2015, 5, srep15369. [Google Scholar] [CrossRef]
- Ermakov, Y.A. Electric Fields at the Lipid Membrane Interface. Membranes 2023, 13, 883. [Google Scholar] [CrossRef] [PubMed]
- Hamill, O.P.; Martinac, B. Molecular Basis of Mechanotransduction in Living Cells. Physiol. Rev. 2001, 81, 685–740. [Google Scholar] [CrossRef] [PubMed]
- Martinac, B.; Hamill, O.P. Gramicidin A channels switch between stretch activation and stretch inactivation depending on bilayer thickness. Proc. Natl. Acad. Sci. USA 2002, 99, 4308–4312. [Google Scholar] [CrossRef]
- Blood, P.D.; Ayton, G.S.; Voth, G.A. Probing the molecular-scale lipid bilayer response to shear flow using nonequilibrium molecular dynamics. J. Phys. Chem. B 2005, 109, 18673–18679. [Google Scholar] [CrossRef] [PubMed]
- Gullingsrud, J.; Schulten, K. Lipid bilayer pressure profiles and mechanosensitive channel gating. Biophys. J. 2004, 86, 3496–3509. [Google Scholar] [CrossRef] [PubMed]
- Zhang, Y.-L.; Frangos, J.A.; Chachisvilis, M. Laurdan fluorescence senses mechanical strain in the lipid bilayer membrane. Biochem. Biophys. Res. Commun. 2006, 347, 838–841. [Google Scholar] [CrossRef] [PubMed]
- Haidekker, M.A.; Ling, T.; Anglo, M.; Stevens, H.Y.; Frangos, J.A.; Theodorakis, E.A. New fluorescent probes for the measurement of cell membrane viscosity. Chem. Biol. 2001, 8, 123–131. [Google Scholar] [CrossRef] [PubMed]
- Butler, P.J.; Norwich, G.; Weinbaum, S.; Chien, S. Shear stress induces a time- and position-dependent increase in endothelial cell membrane fluidity. Am. J. Physiol. Physiol. 2001, 280, C962–C969. [Google Scholar] [CrossRef]
- Allen, M.P.; Tildesley, D.J. Computer Simulation of Liquids; Oxford University Press: Oxford, UK, 2017. [Google Scholar]
- Moradi, S.; Nowroozi, A.; Shahlaei, M. Shedding light on the structural properties of lipid bilayers using molecular dynamics simulation: A review study. RSC Adv. 2019, 9, 4644–4658. [Google Scholar] [CrossRef]
- Feller, S.E. Molecular dynamics simulations of lipid bilayers. Curr. Opin. Colloid Interface Sci. 2000, 5, 217–223. [Google Scholar] [CrossRef]
- Fu, H.; Chen, H.; Blazhynska, M.; de Lacam, E.G.C.; Szczepaniak, F.; Pavlova, A.; Shao, X.; Gumbart, J.C.; Dehez, F.; Roux, B.; et al. Accurate determination of protein:ligand standard binding free energies from molecular dynamics simulations. Nat. Protoc. 2022, 17, 1114–1141. [Google Scholar] [CrossRef] [PubMed]
- Liu, K.; Watanabe, E.; Kokubo, H. Exploring the stability of ligand binding modes to proteins by molecular dynamics simulations. J. Comput. Mol. Des. 2017, 31, 201–211. [Google Scholar] [CrossRef] [PubMed]
- Guterres, H.; Im, W. Improving Protein-Ligand Docking Results with High-Throughput Molecular Dynamics Simulations. J. Chem. Inf. Model. 2020, 60, 2189–2198. [Google Scholar] [CrossRef]
- Karplus, M.; Kuriyan, J. Molecular dynamics and protein function. Proc. Natl. Acad. Sci. USA 2005, 102, 6679–6685. [Google Scholar] [CrossRef] [PubMed]
- Childers, M.C.; Daggett, V. Insights from molecular dynamics simulations for computational protein design. Mol. Syst. Des. Eng. 2017, 2, 9–33. [Google Scholar] [CrossRef]
- Pikkemaat, M.G.; Linssen, A.B.; Berendsen, H.J.; Janssen, D.B. Molecular dynamics simulations as a tool for improving protein stability. Protein Eng. Des. Sel. 2002, 15, 185–192. [Google Scholar] [CrossRef]
- Cao, Z.; Bian, Y.; Hu, G.; Zhao, L.; Kong, Z.; Yang, Y.; Wang, J.; Zhou, Y. Bias-exchange metadynamics simulation of membrane permeation of 20 amino acids. Int. J. Mol. Sci. 2018, 19, 885. [Google Scholar] [CrossRef]
- Kruszewska, N.; Domino, K.; Drelich, R.; Urbaniak, W.; Petelska, A.D. Interactions between beta-2-glycoprotein-1 and phospholipid bilayer—A molecular dynamic study. Membranes 2020, 10, 396. [Google Scholar] [CrossRef]
- Kopeć, W.; Telenius, J.; Khandelia, H. Molecular dynamics simulations of the interactions of medicinal plant extracts and drugs with lipid bilayer membranes. FEBS J. 2013, 280, 2785–2805. [Google Scholar] [CrossRef]
- Ortiz, J.; Teruel, J.A.; Aranda, F.J.; Ortiz, A. On the Mechanism of Membrane Permeabilization by Tamoxifen and 4-Hydroxytamoxifen. Membranes 2023, 13, 292. [Google Scholar] [CrossRef]
- Magalhães, F.S.S.; Vieira, E.D.; Batista, M.R.B.; Costa-Filho, A.J.; Basso, L.G.M. Effects of Nicotine on the Thermodynamics and Phase Coexistence of Pulmonary Surfactant Model Membranes. Membranes 2024, 14, 267. [Google Scholar] [CrossRef] [PubMed]
- Pinigin, K.V. Local Stress in Cylindrically Curved Lipid Membrane: Insights into Local Versus Global Lateral Fluidity Models. Biomolecules 2024, 14, 1471. [Google Scholar] [CrossRef]
- Warshaviak, D.T.; Muellner, M.J.; Chachisvilis, M. Effect of membrane tension on the electric field and dipole potential of lipid bilayer membrane. Biochim. Biophys. Acta-Biomembr. 2011, 1808, 2608–2617. [Google Scholar] [CrossRef]
- Kong, X.; Qin, S.; Lu, D.; Liu, Z. Surface tension effects on the phase transition of a DPPC bilayer with and without protein: A molecular dynamics simulation. Phys. Chem. Chem. Phys. 2014, 16, 8434–8440. [Google Scholar] [CrossRef] [PubMed]
- Reddy, A.S.; Warshaviak, D.T.; Chachisvilis, M. Effect of membrane tension on the physical properties of DOPC lipid bilayer membrane. Biochim. Biophys. Acta-Biomembr. 2012, 1818, 2271–2281. [Google Scholar] [CrossRef] [PubMed]
- Muddana, H.S.; Gullapalli, R.R.; Manias, E.; Butler, P.J. Atomistic simulation of lipid and DiI dynamics in membrane bilayers under tension. Phys. Chem. Chem. Phys. 2010, 13, 1368–1378. [Google Scholar] [CrossRef]
- Cascales, J.J.L.; Otero, T.F.; Romero, A.J.F.; Camacho, L. Phase transition of a DPPC bilayer induced by an external surface pressure: From bilayer to monolayer behavior. A molecular dynamics simulation study. Langmuir 2006, 22, 5818–5824. [Google Scholar] [CrossRef]
- Leontiadou, H.; Mark, A.E.; Marrink, S.J. Molecular Dynamics Simulations of Hydrophilic Pores in Lipid Bilayers. Biophys. J. 2004, 86, 2156–2164. [Google Scholar] [CrossRef]
- Xie, J.Y.; Ding, G.H.; Karttunen, M. Molecular dynamics simulations of lipid membranes with lateral force: Rupture and dynamic properties. Biochim. Biophys. Acta-Biomembr. 2014, 1838, 994–1002. [Google Scholar] [CrossRef]
- Khakbaz, P.; Klauda, J.B. Investigation of phase transitions of saturated phosphocholine lipid bilayers via molecular dynamics simulations. Biochim. Biophys. Acta-Biomembr. 2018, 1860, 1489–1501. [Google Scholar] [CrossRef]
- Marrink, S.J.; Risselada, J.; Mark, A.E. Simulation of gel phase formation and melting in lipid bilayers using a coarse grained model. Chem. Phys. Lipids 2005, 135, 223–244. [Google Scholar] [CrossRef] [PubMed]
- van der Veen, J.N.; Kennelly, J.P.; Wan, S.; Vance, J.E.; Vance, D.E.; Jacobs, R.L. The critical role of phosphatidylcholine and phosphatidylethanolamine metabolism in health and disease. Biochim. Biophys. Acta-Biomembr. 2017, 1859, 1558–1572. [Google Scholar] [CrossRef]
- Kučerka, N.; Tristram-Nagle, S.; Nagle, J.F. Closer look at structure of fully hydrated fluid phase DPPC bilayers. Biophys. J. 2006, 90, L83–L85. [Google Scholar] [CrossRef]
- Rossos, G.; Hadjikakou, S.K.; Kourkoumelis, N. Molecular dynamics simulation of 2-benzimidazolyl-urea with DPPC lipid membrane and comparison with a copper(II) complex derivative. Membranes 2021, 11, 743. [Google Scholar] [CrossRef] [PubMed]
- Lindahl; Abraham; Hess; van der Spoel. GROMACS 2021.4 Source Code; Zenodo: Meyrin, Switzerland, 2021. [Google Scholar] [CrossRef]
- Humphrey, W.; Dalke, A.; Schulten, K. VMD: Visual molecular dynamics. J. Mol. Graph. 1996, 14, 33–38. [Google Scholar] [CrossRef]
- Nagle, J.F.; Tristram-Nagle, S. Structure of lipid bilayers. Biochim. Biophys. Acta-Rev. Biomembr. 2000, 1469, 159–195. [Google Scholar] [CrossRef]
- Marrink, S.-J.; Berger, O.; Tieleman, P.; Jähnig, F. Adhesion forces of lipids in a phospholipid membrane studied by molecular dynamics simulations. Biophys. J. 1998, 74, 931–943. [Google Scholar] [CrossRef] [PubMed]
- Berendsen, H.J.C.; Postma, J.P.M.; Van Gunsteren, W.F.; Hermans, J. Interaction Models for Water in Relation to Protein Hydration. In Intermolecular Forces; Pullman, B., Ed.; Springer: Dordrecht, The Netherlands, 1981. [Google Scholar]
- Hess, B.; Bekker, H.; Berendsen, H.J.C.; Fraaije, J.G.E.M. LINCS: A linear constraint solver for molecular simulations. J. Comput. Chem. 1997, 18, 1463–1472. [Google Scholar] [CrossRef]
- Darden, T.; York, D.; Pedersen, L. Particle mesh Ewald: An N⋅log(N) method for Ewald sums in large systems. J. Chem. Phys. 1993, 98, 10089–10092. [Google Scholar] [CrossRef]
- Nosé, S. A unified formulation of the constant temperature molecular dynamics methods. J. Chem. Phys. 1984, 81, 511–519. [Google Scholar] [CrossRef]
- Nosé, S. A molecular dynamics method for simulations in the canonical ensemble. Mol. Phys. 1984, 52, 255–268. [Google Scholar] [CrossRef]
- Hoover, W.G. Canonical dynamics: Equilibrium phase-space distributions. Phys. Rev. A 1985, 31, 1695–1697. [Google Scholar] [CrossRef]
- Nosé, S.; Klein, M. Constant pressure molecular dynamics for molecular systems. Mol. Phys. 1983, 50, 1055–1076. [Google Scholar] [CrossRef]
- Parrinello, M.; Rahman, A. Polymorphic transitions in single crystals: A new molecular dynamics method. J. Appl. Phys. 1981, 52, 7182–7190. [Google Scholar] [CrossRef]
- Brooks, B.R.; Brooks, C.L., III; MacKerell, A.D., Jr.; Nilsson, L.; Petrella, R.J.; Roux, B.; Won, Y.; Archontis, G.; Bartels, C.; Boresch, S.; et al. CHARMM: The biomolecular simulation program. J. Comput. Chem. 2009, 30, 1545–1614. [Google Scholar] [CrossRef] [PubMed]
- Kučerka, N.; Nieh, M.-P.; Katsaras, J. Fluid phase lipid areas and bilayer thicknesses of commonly used phosphatidylcholines as a function of temperature. Biochim. Biophys. Acta-Biomembr. 2011, 1808, 2761–2771. [Google Scholar] [CrossRef]
- Filipe, H.A.L.; Loura, L.M.S.; Moreno, M.J. Permeation of a Homologous Series of NBD-Labeled Fatty Amines through Lipid Bilayers: A Molecular Dynamics Study. Membranes 2023, 13, 551. [Google Scholar] [CrossRef]
- Li, J.; Xia, Z.; Cai, S.; Xia, S.; Zhang, X. The non-thermal influences of ultrasound on cell membrane: A molecular dynamics study. J. Mol. Struct. 2024, 1299, 137140. [Google Scholar] [CrossRef]
- Gowers, R.J.; Linke, M.; Barnoud, J.; Reddy, T.J.E.; Melo, M.N.; Seyler, S.L.; Domanski, J.; Dotson, D.L.; Buchoux, S.; Kenney, I.M.; et al. MDAnalysis: A Python Package for The Rapid Analysis of Molecular Dynamics Simulations. In Proceedings of the 15th Python in Science Conference, Austin, TX, USA, 11–17 July 2016; Volume 98, p. 105. [Google Scholar]
- Michaud-Agrawal, N.; Denning, E.J.; Woolf, T.B.; Beckstein, O. MDAnalysis: A toolkit for the analysis of molecular dynamics simulations. J. Comput. Chem. 2011, 32, 2319–2327. [Google Scholar] [CrossRef]
- Nagle, J. Area/lipid of bilayers from NMR. Biophys. J. 1993, 64, 1476–1481. [Google Scholar] [CrossRef]
- Zhuang, X.; Makover, J.R.; Im, W.; Klauda, J.B. A systematic molecular dynamics simulation study of temperature dependent bilayer structural properties. Biochim. Biophys. Acta-Biomembr. 2014, 1838, 2520–2529. [Google Scholar] [CrossRef] [PubMed]
- Carrascosa-Tejedor, J.; Santamaria, A.; Pereira, D.; Maestro, A. Structure of DPPC monolayers at the air/buffer interface: A neutron reflectometry and ellipsometry study. Coatings 2020, 10, 507. [Google Scholar] [CrossRef]
- Zuo, Y.Y.; Chen, R.; Wang, X.; Yang, J.; Policova, Z.; Neumann, A.W. Phase Transitions in Dipalmitoylphosphatidylcholine Monolayers. Langmuir 2016, 32, 8501–8506. [Google Scholar] [CrossRef] [PubMed]
- Guzmán, E.; Orsi, D.; Cristofolini, L.; Liggieri, L.; Ravera, F. Two-dimensional DPPC based emulsion-like structures stabilized by silica nanoparticles. Langmuir 2014, 30, 11504–11512. [Google Scholar] [CrossRef]
- Olżyńska, A.; Zubek, M.; Roeselova, M.; Korchowiec, J.; Cwiklik, L. Mixed DPPC/POPC Monolayers: All-atom Molecular Dynamics Simulations and Langmuir Monolayer Experiments. Biochim. Biophys. Acta-Biomembr. 2016, 1858, 3120–3130. [Google Scholar] [CrossRef]
- Lai, K.; Wang, B.; Zhang, Y.; Zhang, Y. High pressure effect on phase transition behavior of lipid bilayers. Phys. Chem. Chem. Phys. 2012, 14, 5744–5752. [Google Scholar] [CrossRef] [PubMed]
- Andrienko, D. Introduction to liquid crystals. J. Mol. Liq. 2018, 267, 520–541. [Google Scholar] [CrossRef]
- Martínez-Fernández, D.; Herranz, M.; Foteinopoulou, K.; Karayiannis, N.C.; Laso, M. Local and Global Order in Dense Packings of Semi-Flexible Polymers of Hard Spheres. Polymers 2023, 15, 551. [Google Scholar] [CrossRef]
- Martínez-Fernández, D.; Pedrosa, C.; Herranz, M.; Foteinopoulou, K.; Karayiannis, N.C.; Laso, M. Random close packing of semi-flexible polymers in two dimensions: Emergence of local and global order. J. Chem. Phys. 2024, 161, 034902. [Google Scholar] [CrossRef]
- Leekumjorn, S.; Sum, A.K. Molecular studies of the gel to liquid-crystalline phase transition for fully hydrated DPPC and DPPE bilayers. Biochim. Biophys. Acta-Biomembr. 2007, 1768, 354–365. [Google Scholar] [CrossRef]
- Hofsäß, C.; Lindahl, E.; Edholm, O. Molecular Dynamics Simulations of Phospholipid Bilayers with Cholesterol. Biophys. J. 2003, 84, 2192–2206. [Google Scholar] [CrossRef] [PubMed]
- Kulig, W.; Tynkkynen, J.; Javanainen, M.; Manna, M.; Rog, T.; Vattulainen, I.; Jungwirth, P. How well does cholesteryl hemisuccinate mimic cholesterol in saturated phospholipid bilayers? J. Mol. Model. 2014, 20, 2121. [Google Scholar] [CrossRef] [PubMed]
- Qin, S.-S.; Yu, Z.-W.; Yu, Y.-X. Structural characterization on the gel to liquid-crystal phase transition of fully hydrated DSPC and DSPE bilayers. J. Phys. Chem. B 2009, 113, 8114–8123. [Google Scholar] [CrossRef]
- Berger, O.; Edholm, O.; Jähnig, F. Molecular dynamics simulations of a fluid bilayer of dipalmitoylphosphatidylcholine at full hydration, constant pressure, and constant temperature. Biophys. J. 1997, 72, 2002–2013. [Google Scholar] [CrossRef]
- Sun, L.; Böckmann, R.A. Membrane phase transition during heating and cooling: Molecular insight into reversible melting. Eur. Biophys. J. 2018, 47, 151–164. [Google Scholar] [CrossRef]
- Meleleo, D. Study of resveratrol’s interaction with planar lipid models: Insights into its location in lipid bilayers. Membranes 2021, 11, 132. [Google Scholar] [CrossRef] [PubMed]
- Guo, X.-Y.; Peschel, C.; Watermann, T.; von Rudorff, G.F.; Sebastiani, D. Cluster formation of polyphilic molecules solvated in a DPPC bilayer. Polymers 2017, 9, 488. [Google Scholar] [CrossRef]
- Neupane, S.; Cordoyiannis, G.; Renner, F.U.; Losada-Pérez, P. Real-Time monitoring of interactions between solid-supported lipid vesicle layers and short- and medium-chain length alcohols: Ethanol and 1-pentanol. Biomimetics 2019, 4, 8. [Google Scholar] [CrossRef]
- Dai, Y.; Xie, Z.; Liang, L. Pore Formation Mechanism of A-Beta Peptide on the Fluid Membrane: A Combined Coarse-Grained and All-Atomic Model. Molecules 2022, 27, 3924. [Google Scholar] [CrossRef]
- Yin, Q.; Shi, X.; Ding, H.; Dai, X.; Wan, G.; Qiao, Y. Interactions of borneol with DPPC phospholipid membranes: A molecular dynamics simulation study. Int. J. Mol. Sci. 2014, 15, 20365–20381. [Google Scholar] [CrossRef]

| Pressure Low Loading (bar) | Simulation Index | Rupture? | Time of Rupture (ns) |
|---|---|---|---|
| −170 | #1 | No | NA |
| −170 | #2 | No | NA |
| −170 | #3 | No | NA |
| −170 | #4 | No | NA |
| −180 | #1 | Yes | 106 |
| −180 | #2 | Yes | 426 |
| −180 | #3 | Yes | 416 |
| −180 | #4 | No | NA |
| −190 | #1 | Yes | 238 |
| −190 | #2 | Yes | 74 |
| −190 | #3 | Yes | 103 |
| −190 | #4 | Yes | 458 |
| −200 | #1 | Yes | 188 |
| −200 | #2 | Yes | 55 |
| −200 | #3 | Yes | 207 |
| −200 | #4 | Yes | 154 |
Disclaimer/Publisher’s Note: The statements, opinions and data contained in all publications are solely those of the individual author(s) and contributor(s) and not of MDPI and/or the editor(s). MDPI and/or the editor(s) disclaim responsibility for any injury to people or property resulting from any ideas, methods, instructions or products referred to in the content. |
© 2025 by the authors. Licensee MDPI, Basel, Switzerland. This article is an open access article distributed under the terms and conditions of the Creative Commons Attribution (CC BY) license (https://creativecommons.org/licenses/by/4.0/).
Share and Cite
Das, S.; Karayiannis, N.C.; Roy, S. DPPC Membrane Under Lateral Compression and Stretching to Extreme Limits: Phase Transitions and Rupture. Membranes 2025, 15, 161. https://doi.org/10.3390/membranes15060161
Das S, Karayiannis NC, Roy S. DPPC Membrane Under Lateral Compression and Stretching to Extreme Limits: Phase Transitions and Rupture. Membranes. 2025; 15(6):161. https://doi.org/10.3390/membranes15060161
Chicago/Turabian StyleDas, Subhalaxmi, Nikos Ch. Karayiannis, and Supriya Roy. 2025. "DPPC Membrane Under Lateral Compression and Stretching to Extreme Limits: Phase Transitions and Rupture" Membranes 15, no. 6: 161. https://doi.org/10.3390/membranes15060161
APA StyleDas, S., Karayiannis, N. C., & Roy, S. (2025). DPPC Membrane Under Lateral Compression and Stretching to Extreme Limits: Phase Transitions and Rupture. Membranes, 15(6), 161. https://doi.org/10.3390/membranes15060161