
Development of Hollow Fiber Membranes Suitable for Outside-In Filtration of Human Blood Plasma


Abstract

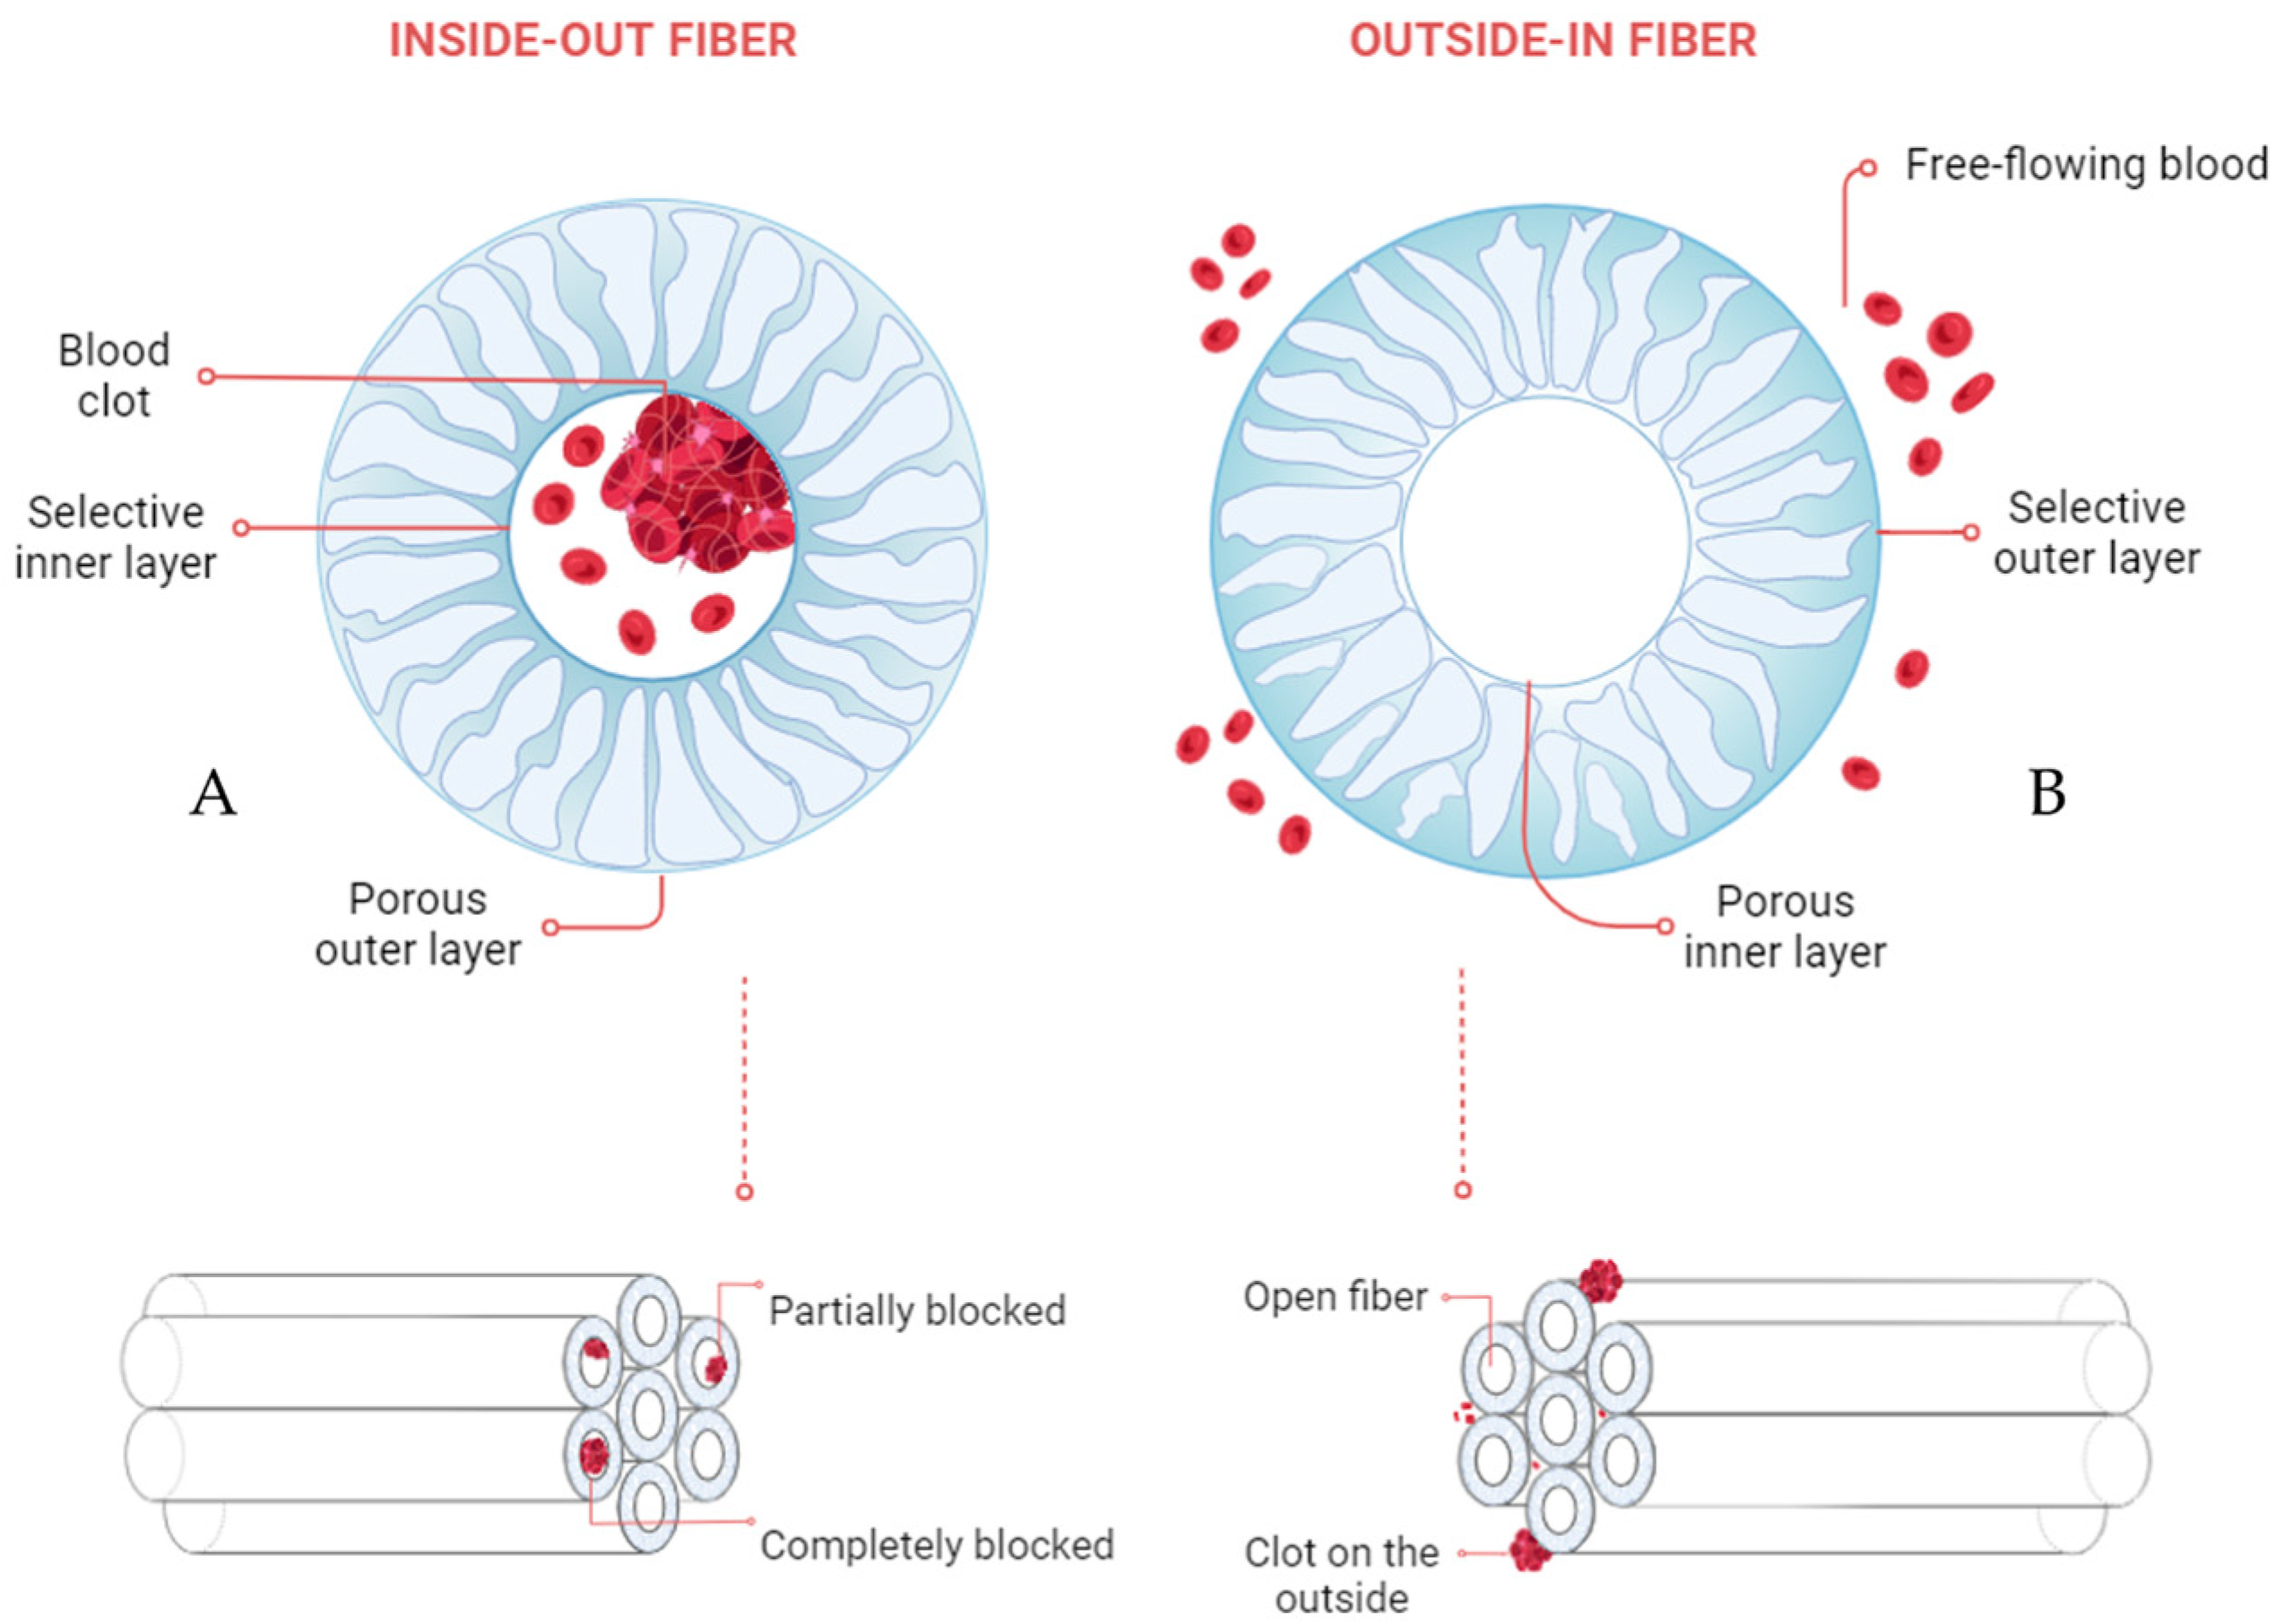
1. Introduction
2. Materials and Methods
2.1. Membrane Fabrication
2.2. Membrane Characterization
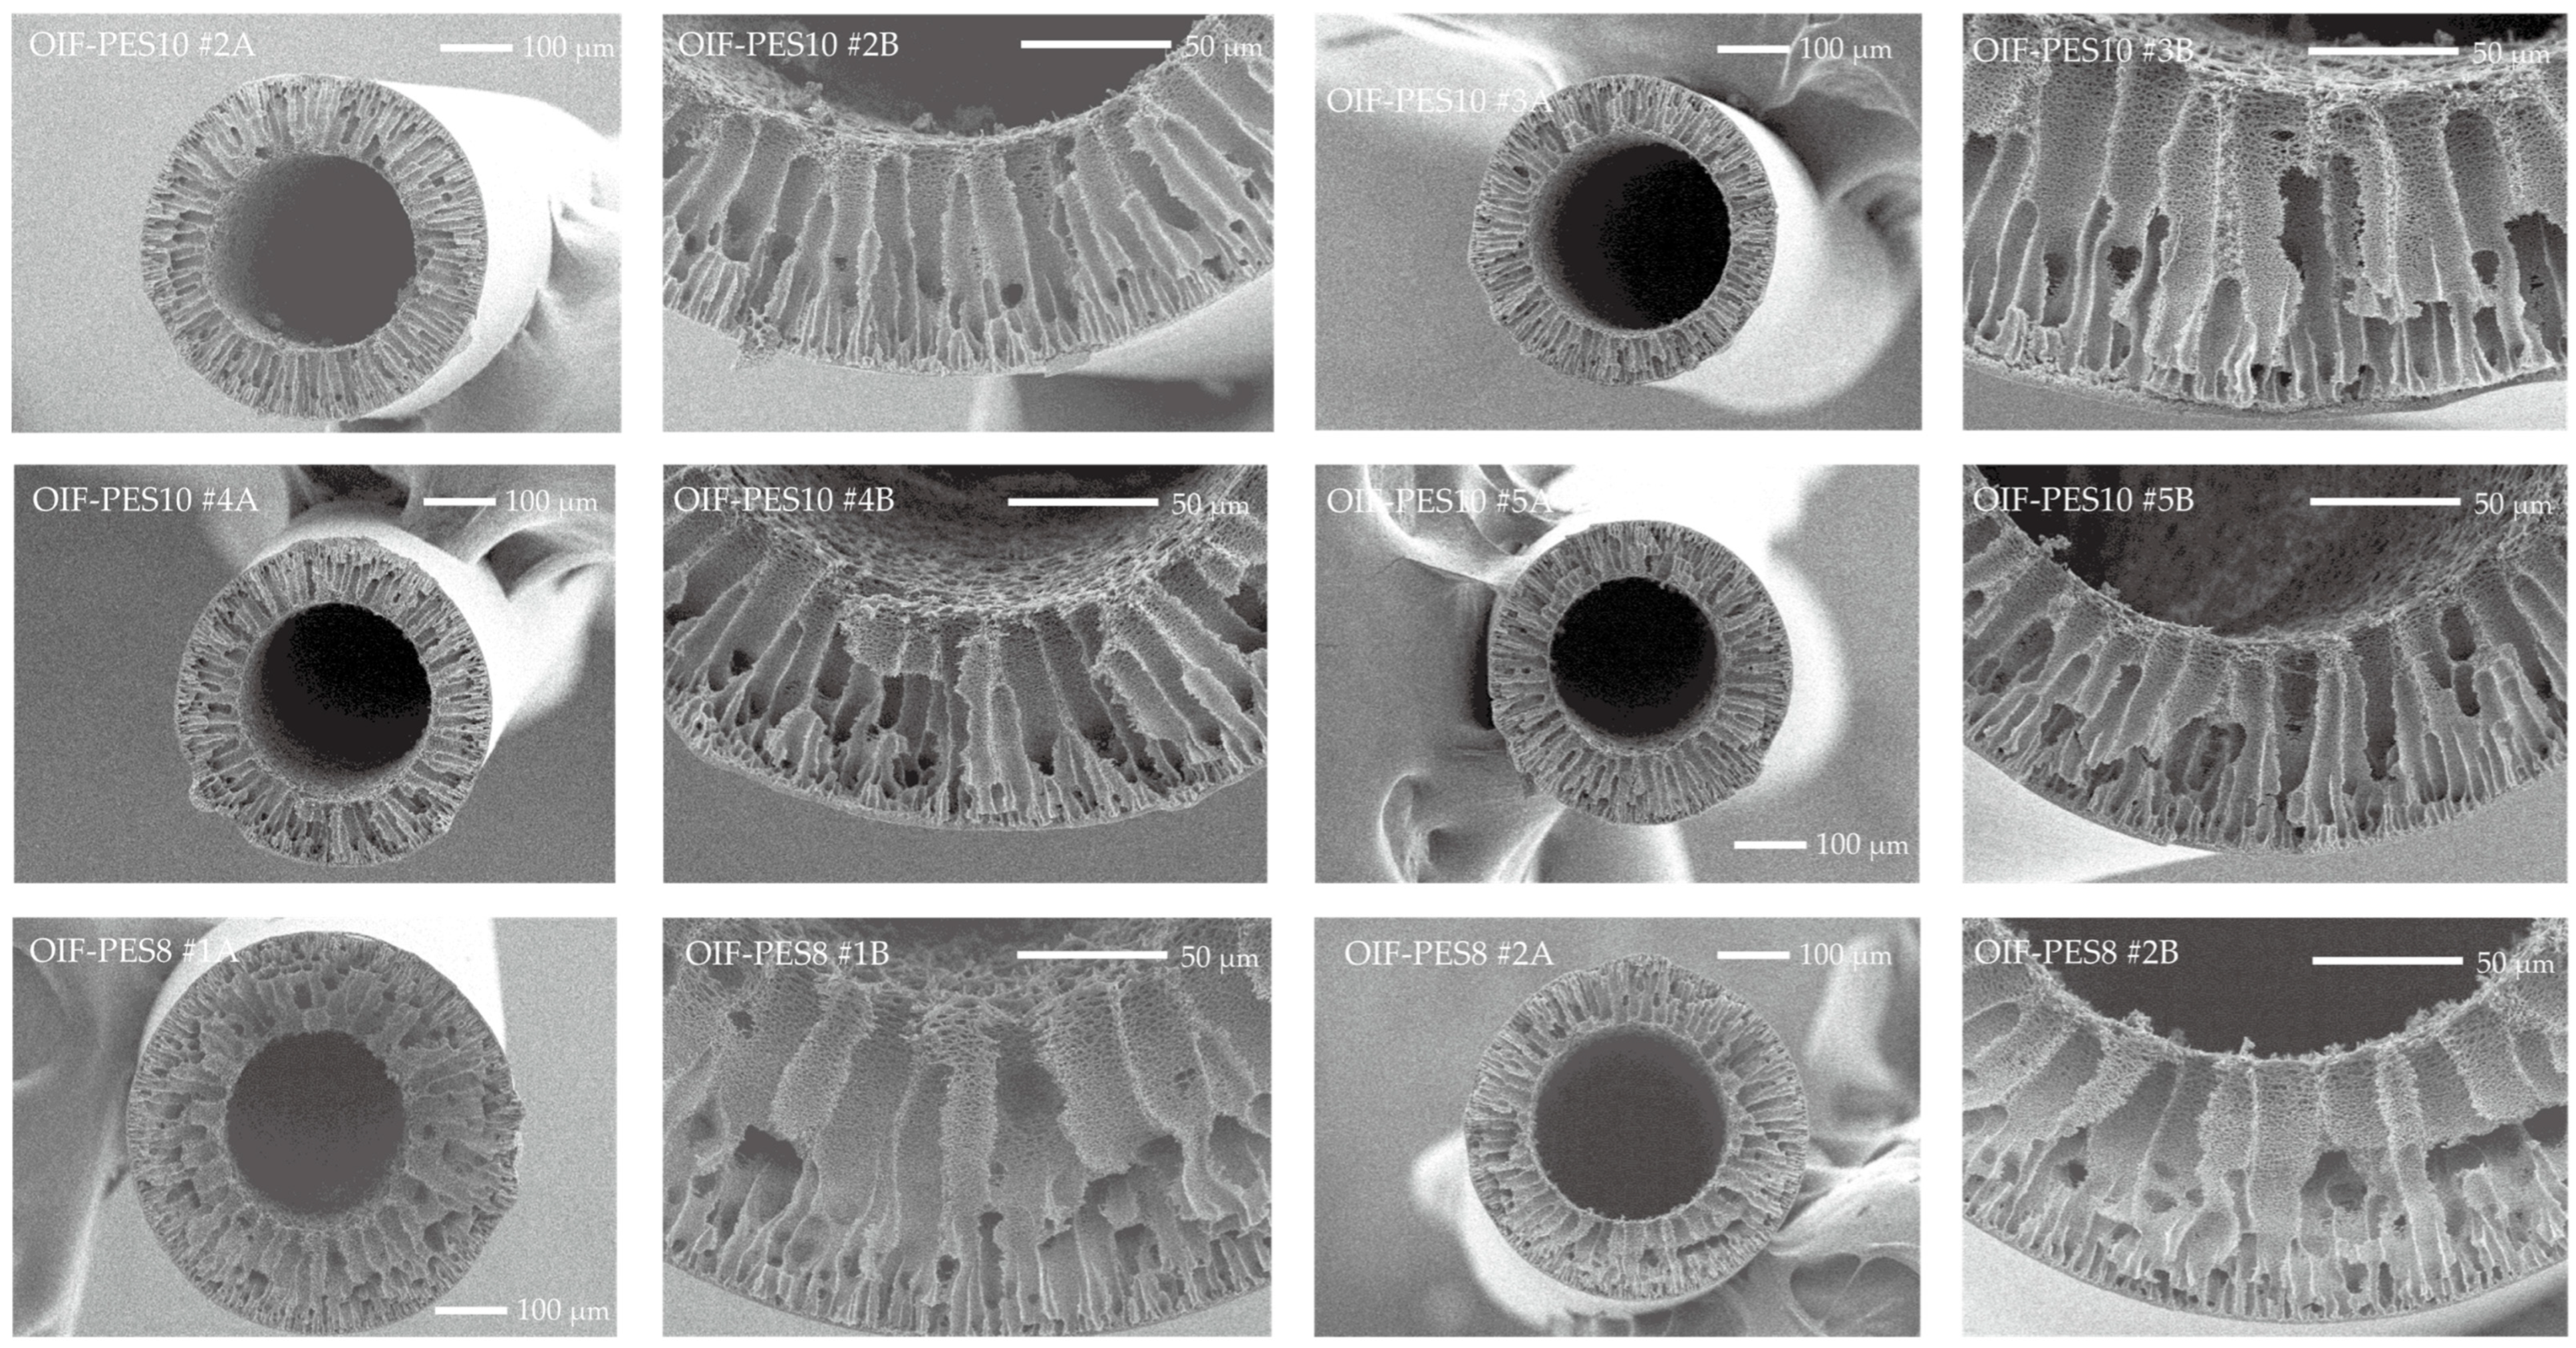
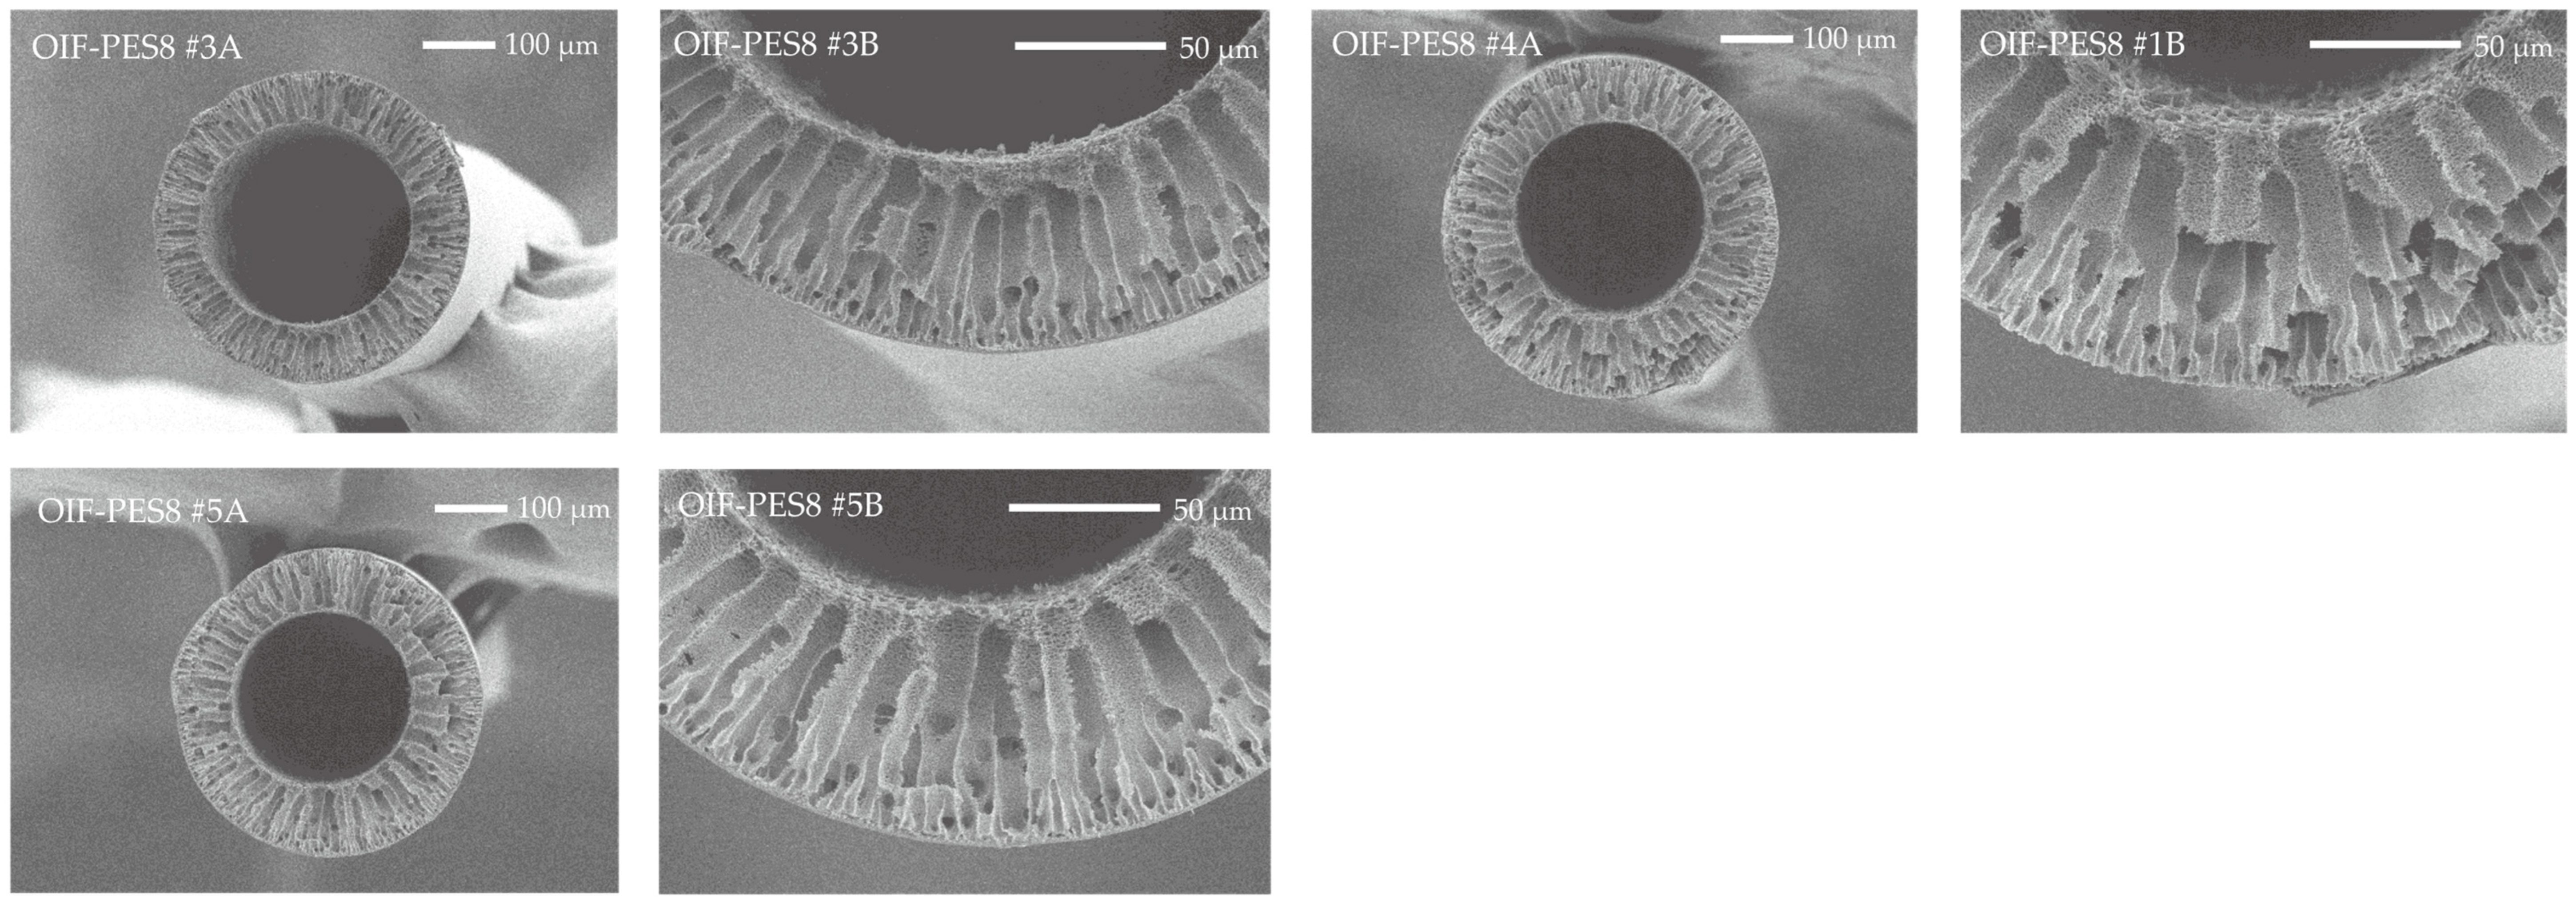
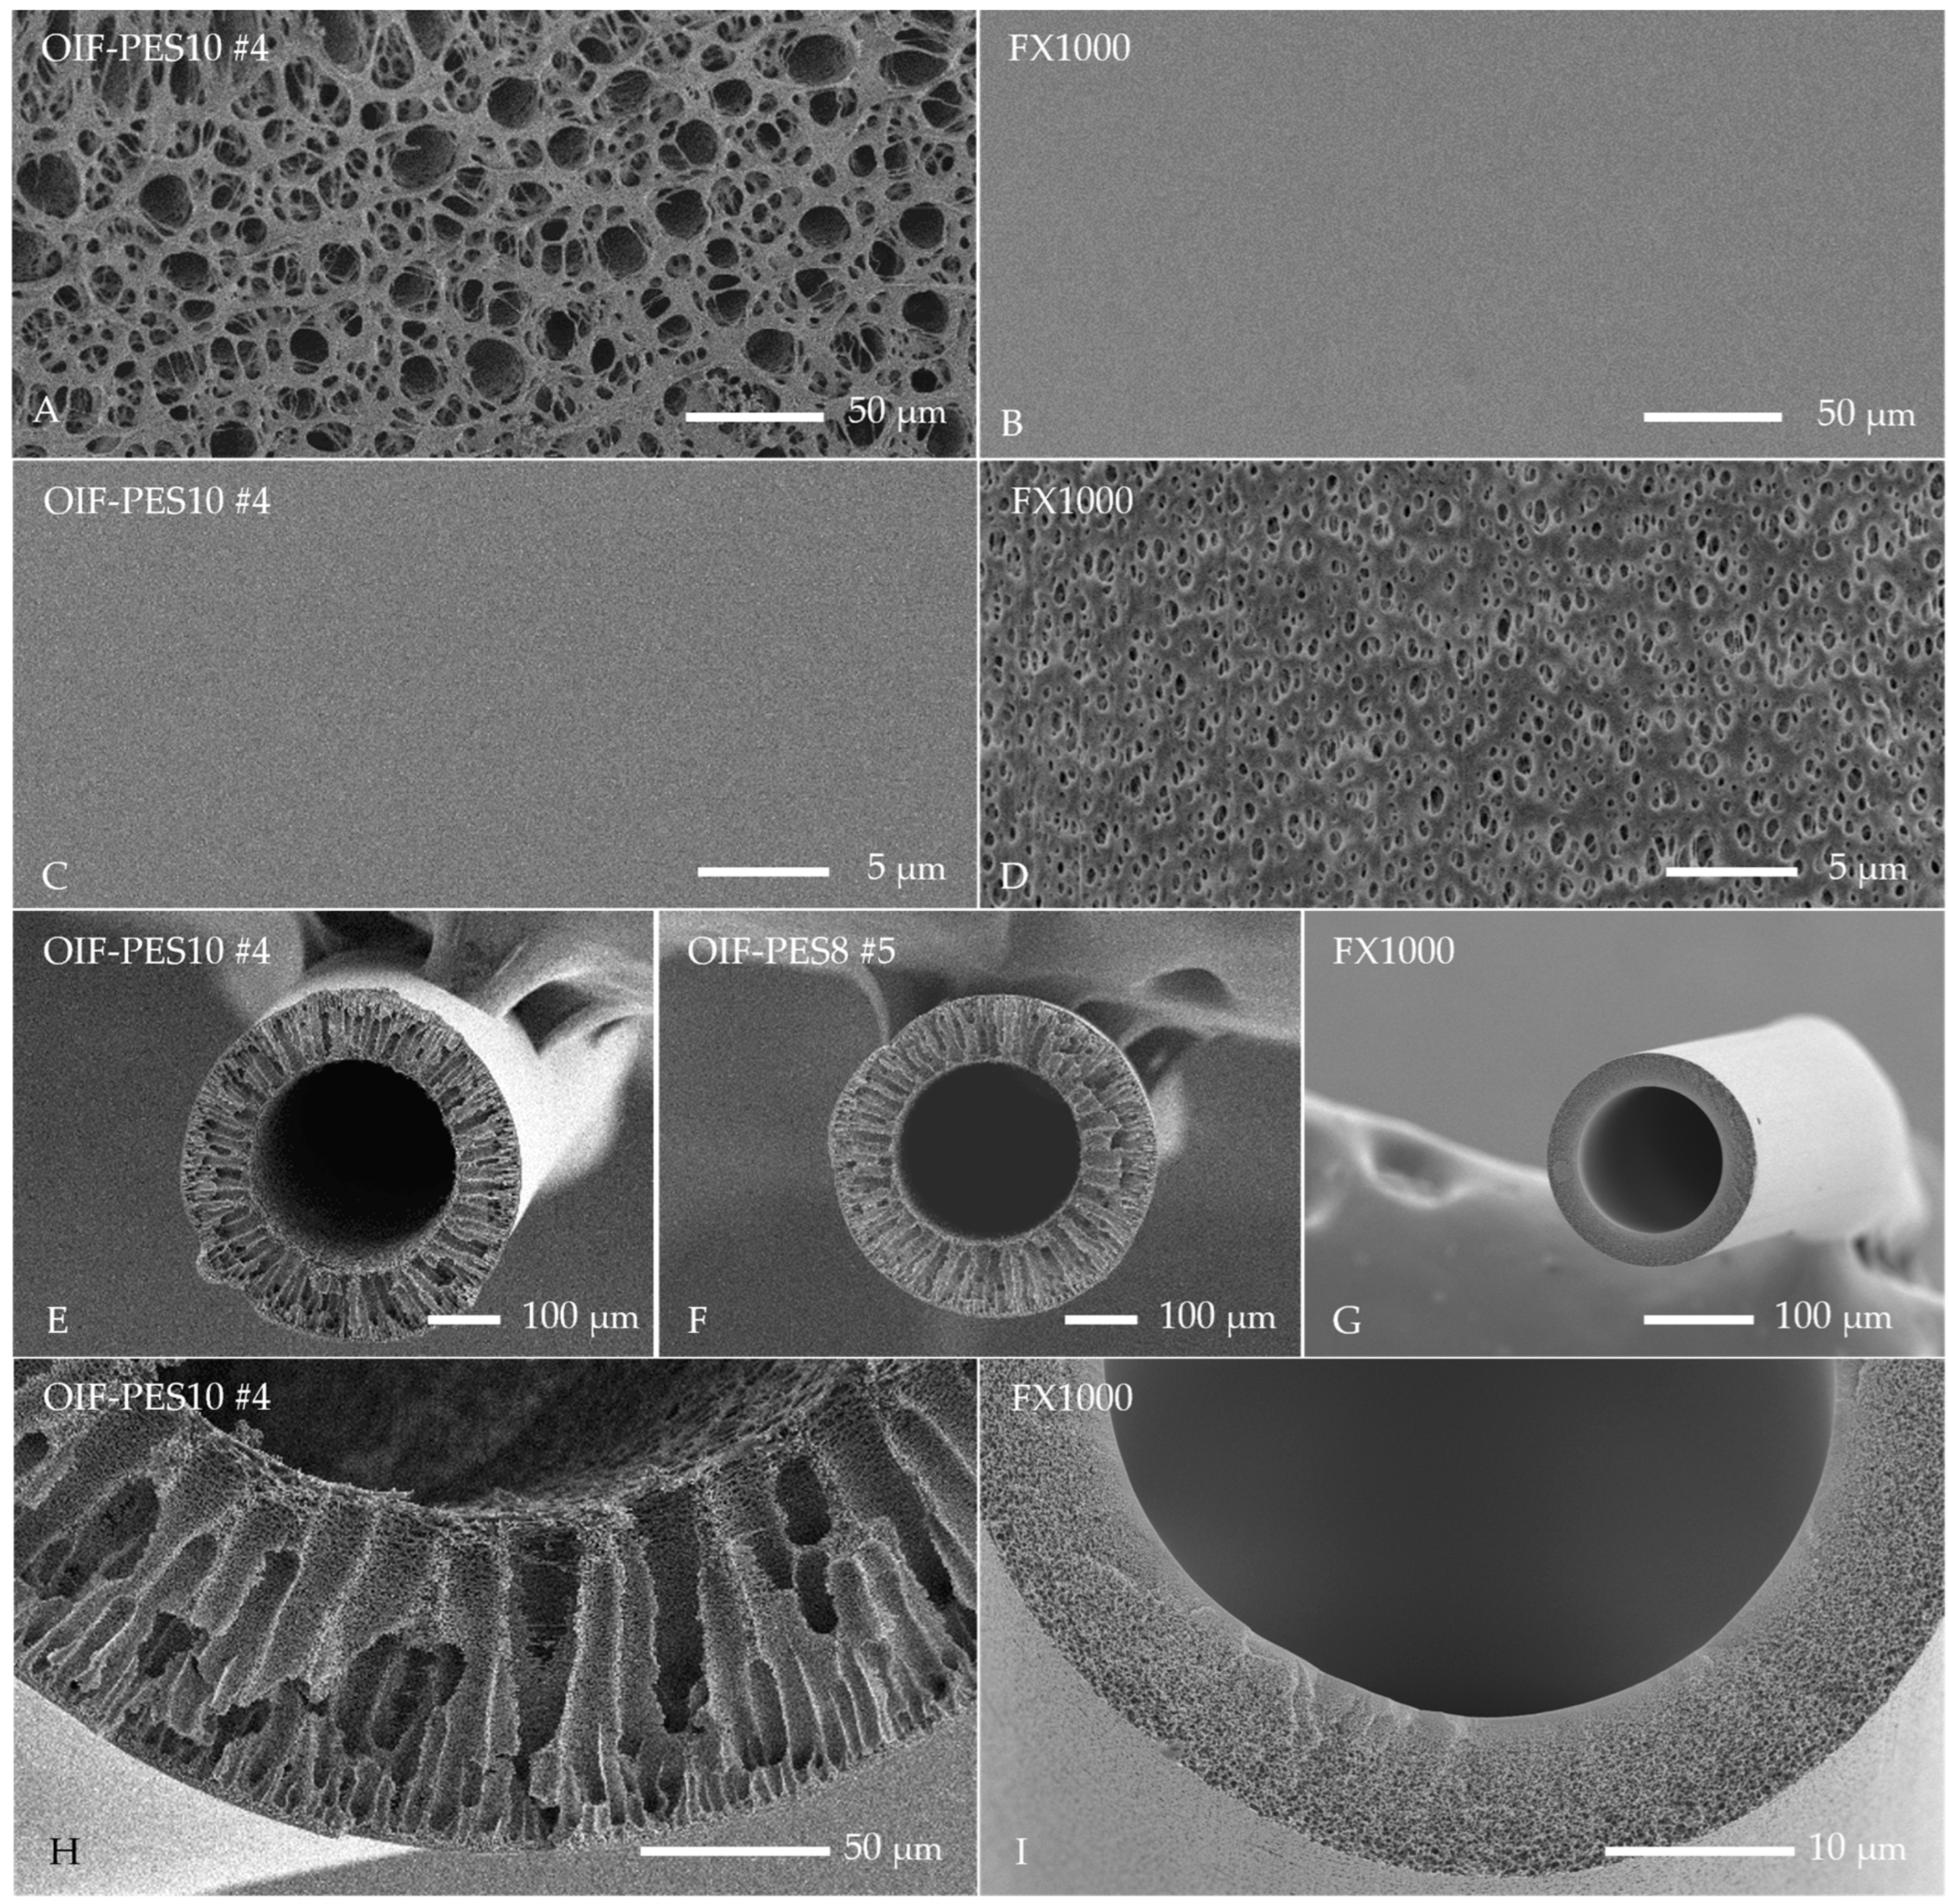
2.2.1. Scanning Electron Microscopy (SEM)
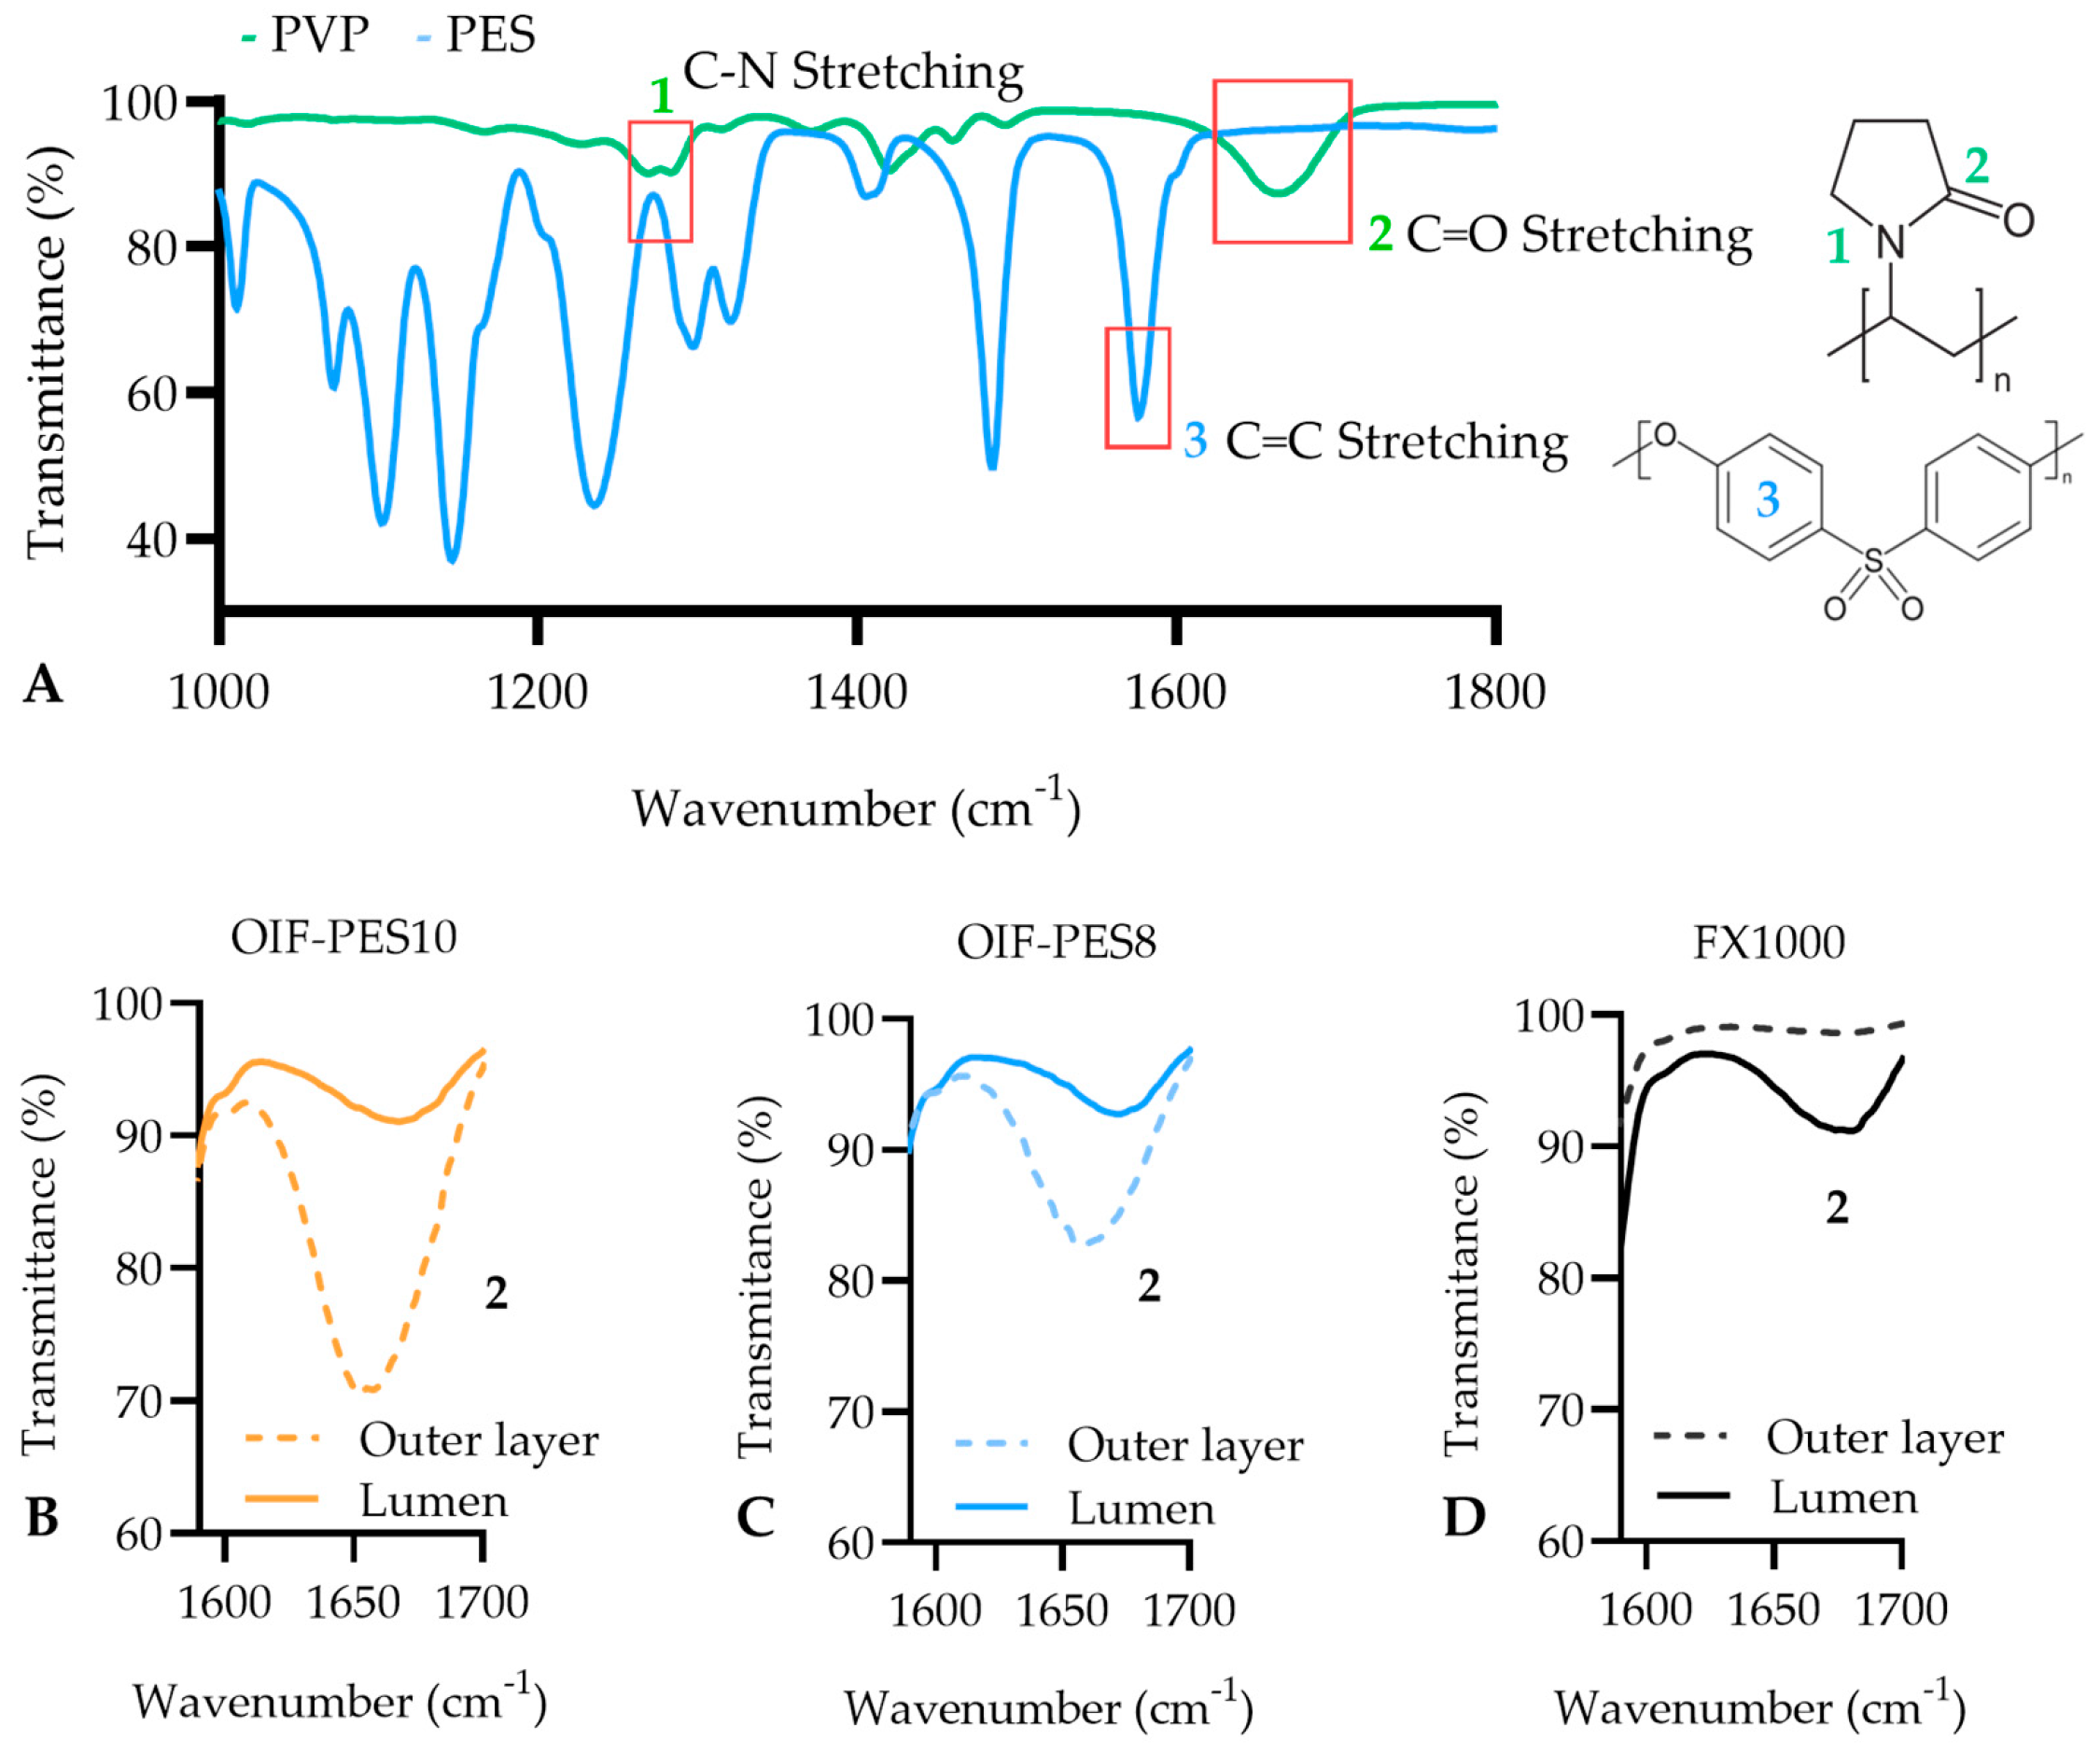
2.2.2. Attenuated Total Reflectance-Fourier Transform Infrared Spectroscopy (ATR-FTIR)
2.2.3. X-Ray Photoelectron Spectroscopy (XPS)
2.2.4. Mechanical Properties
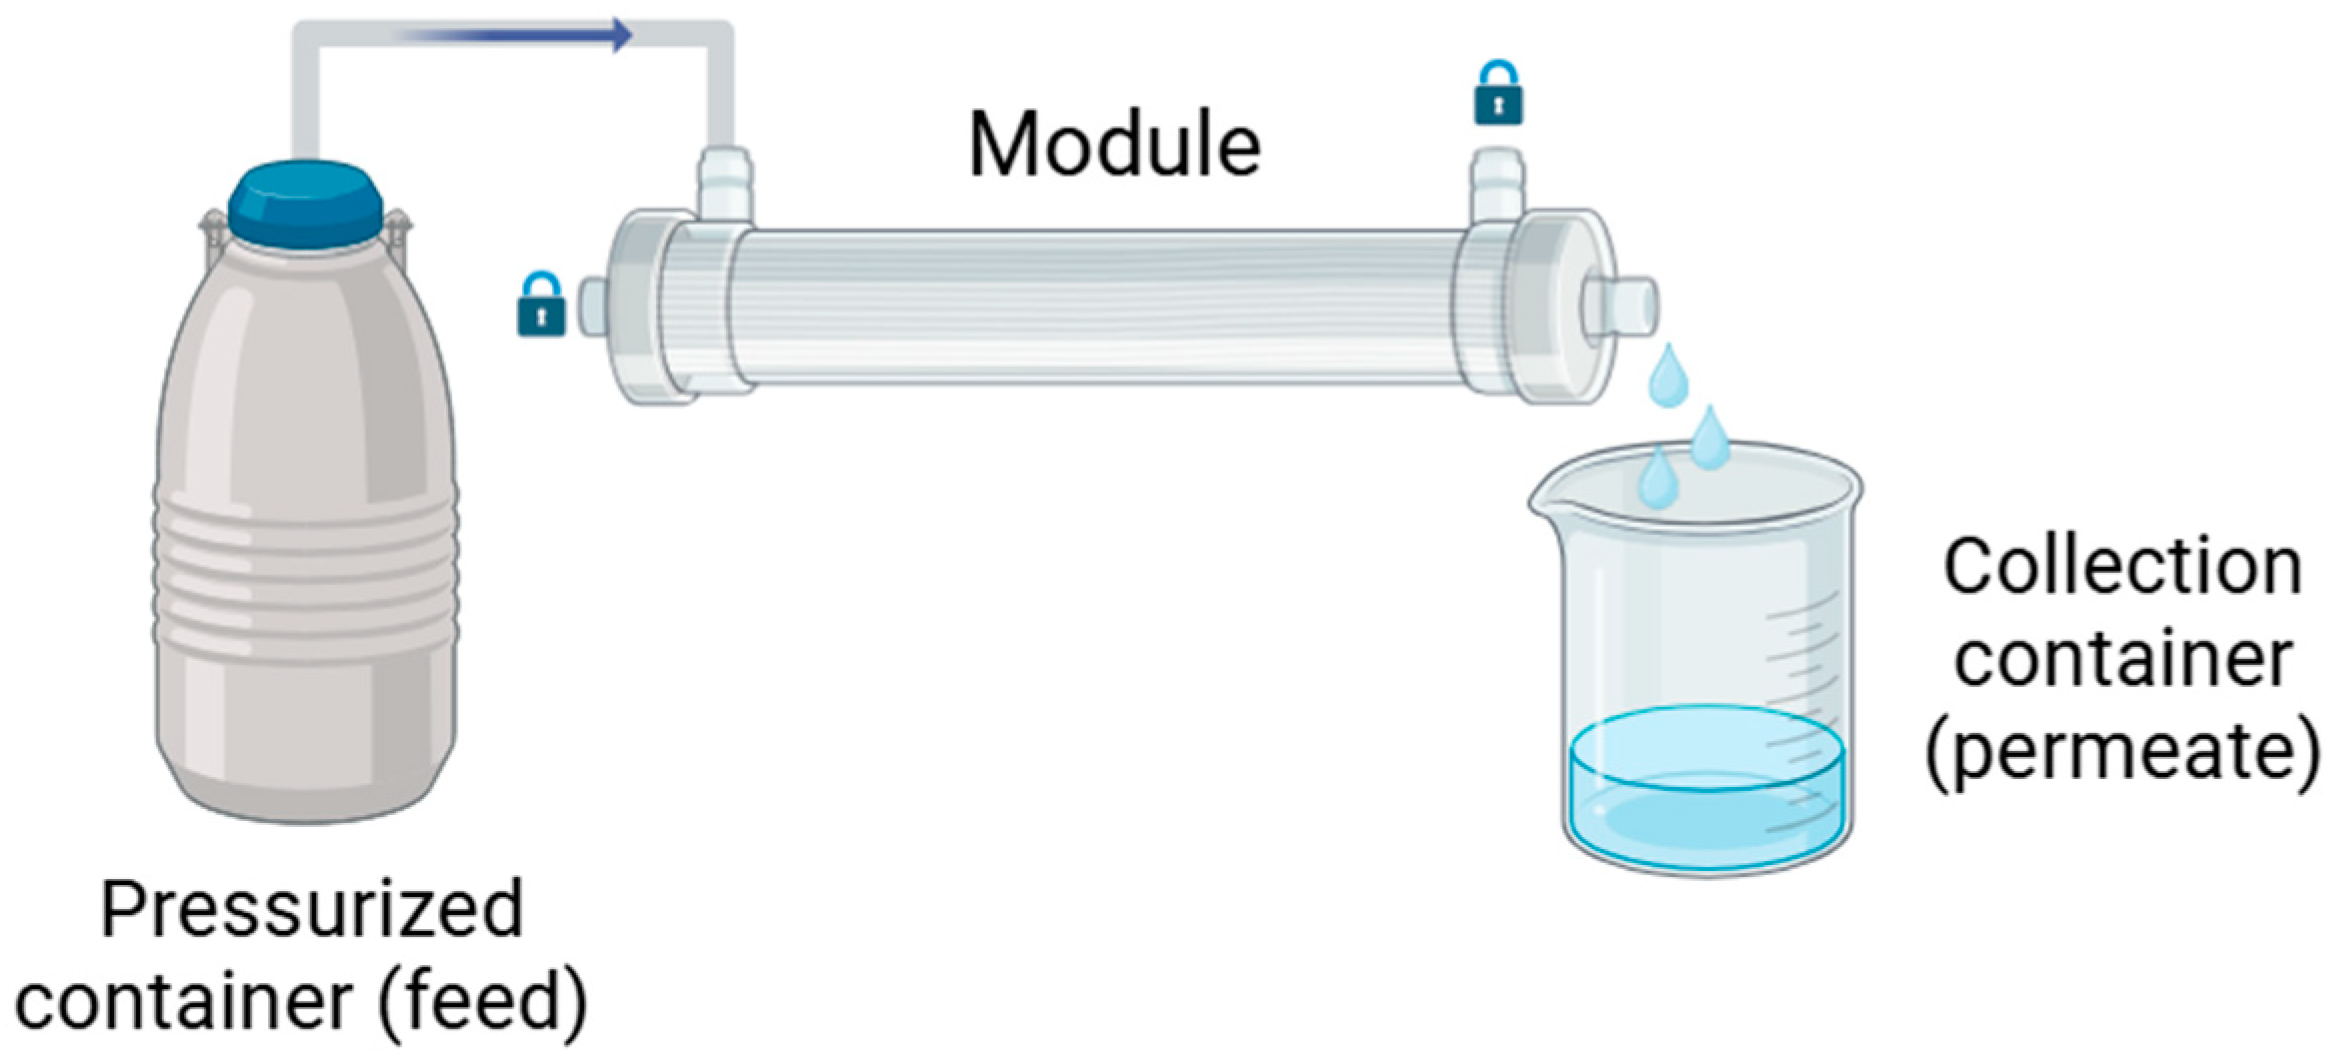
2.2.5. Membrane Performance
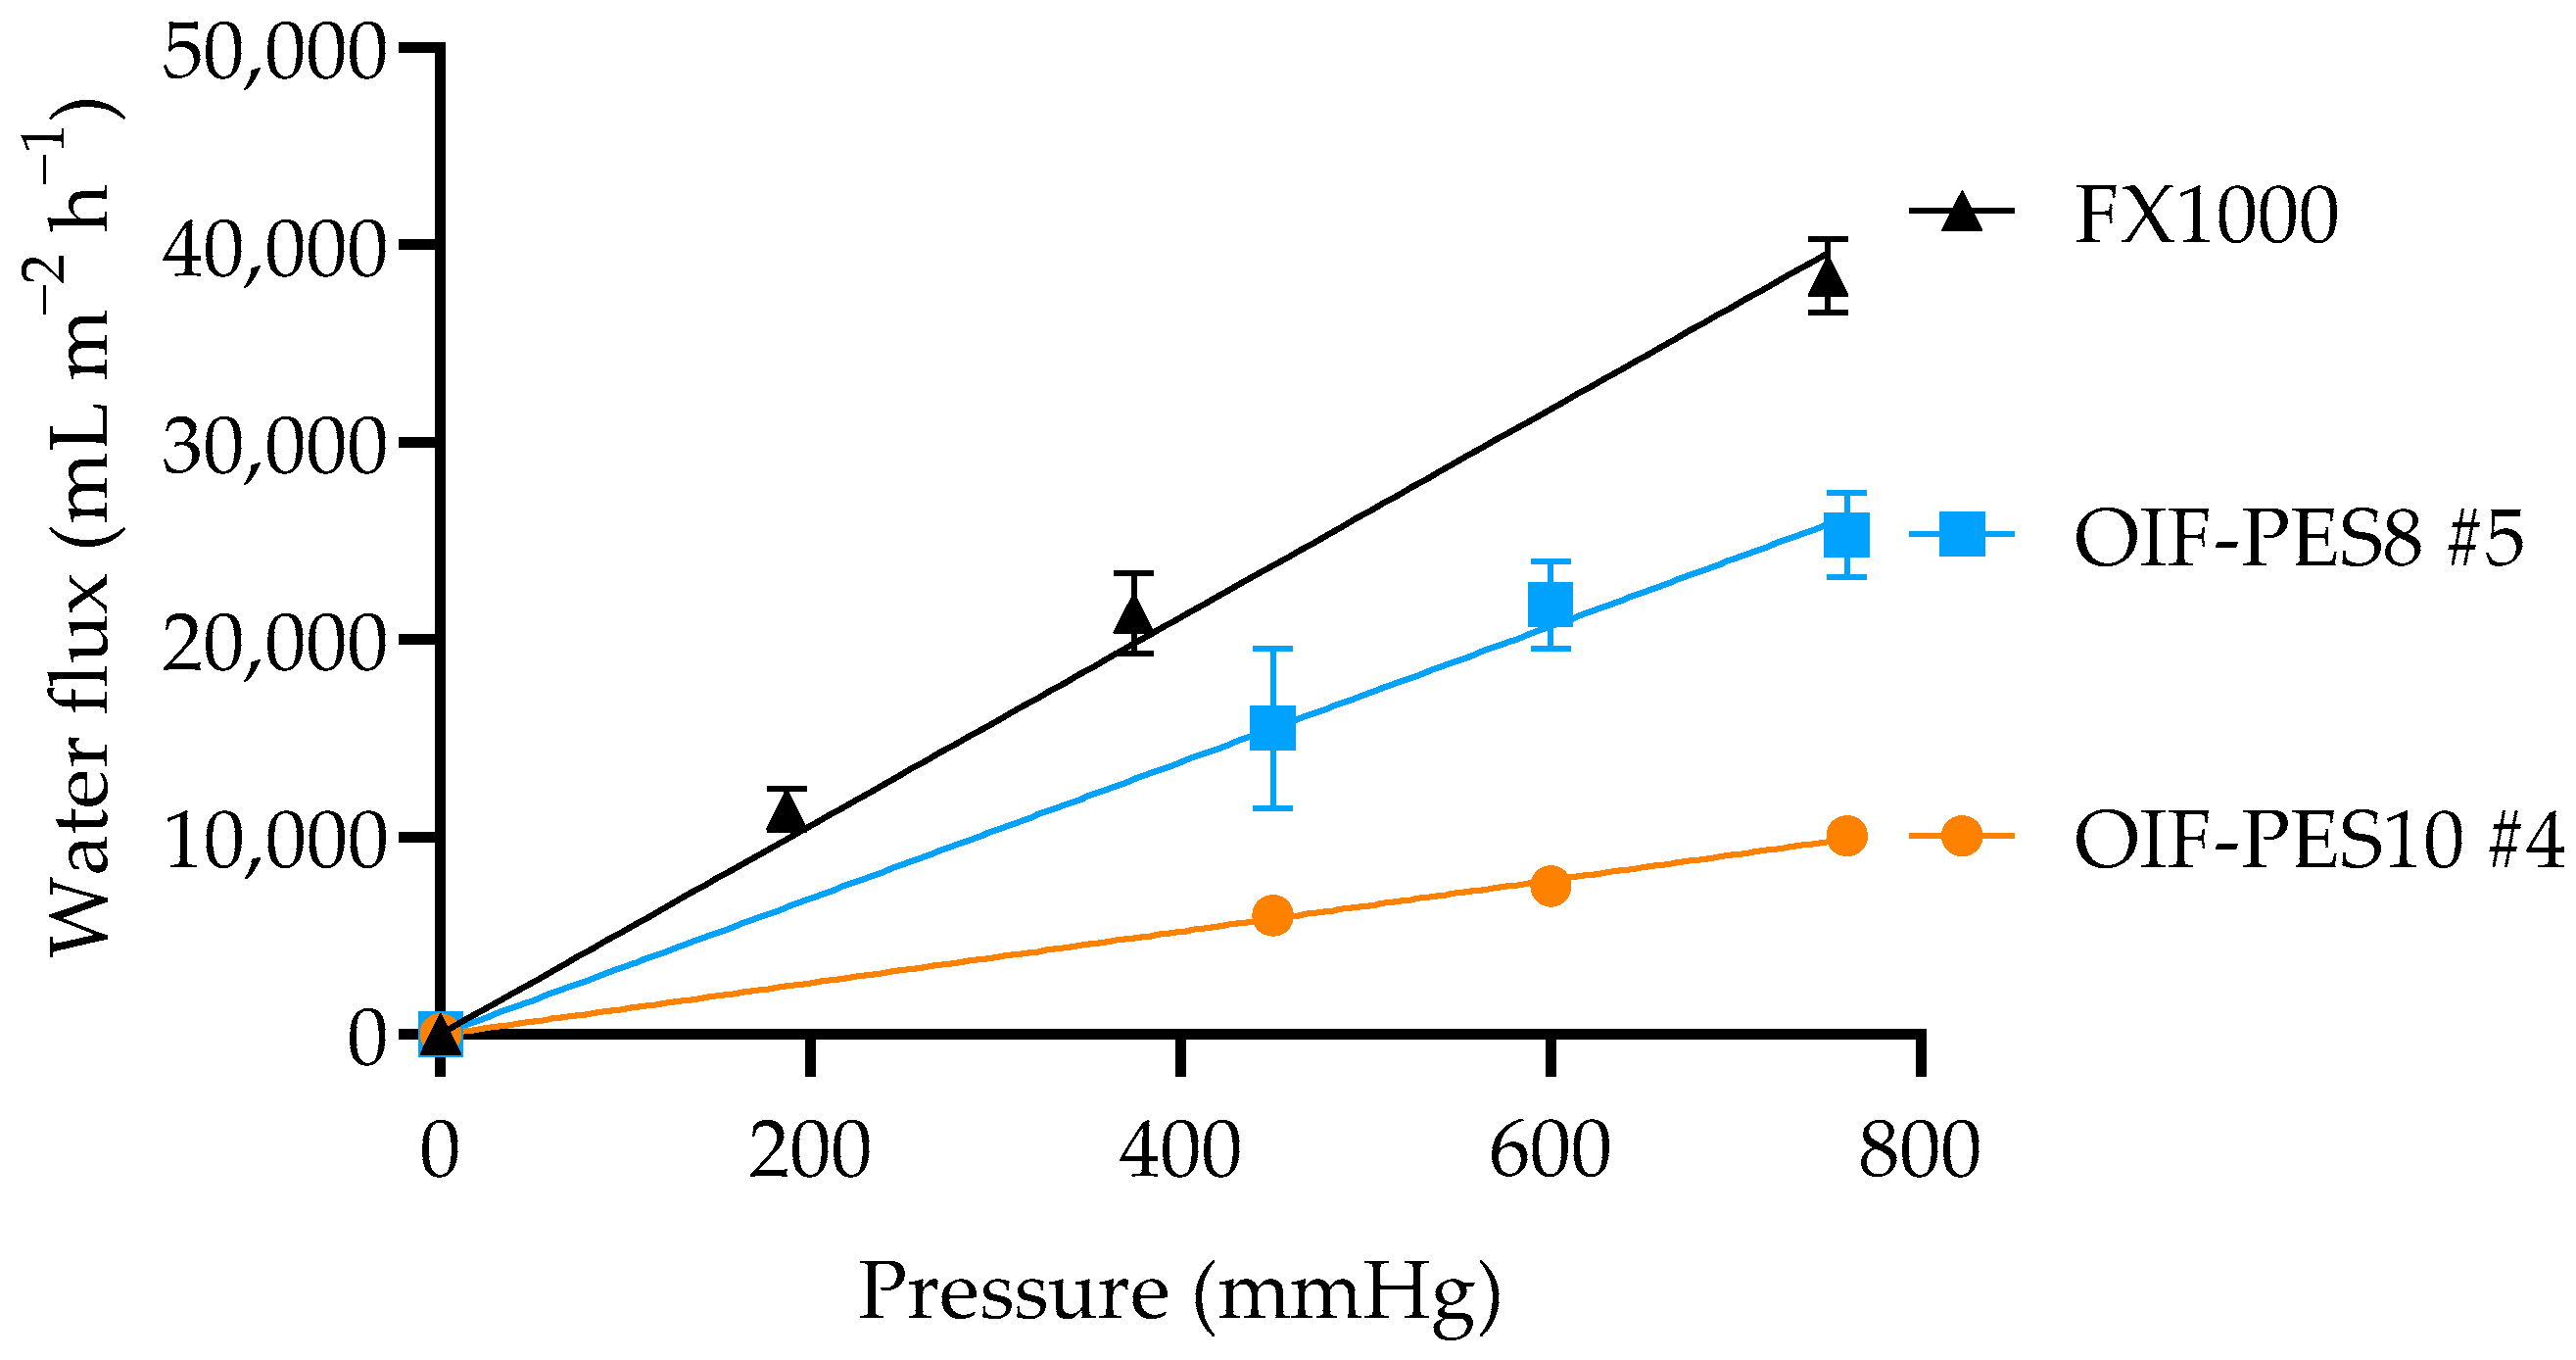
Clean Water Transport Study
Membrane Sieving Coefficient
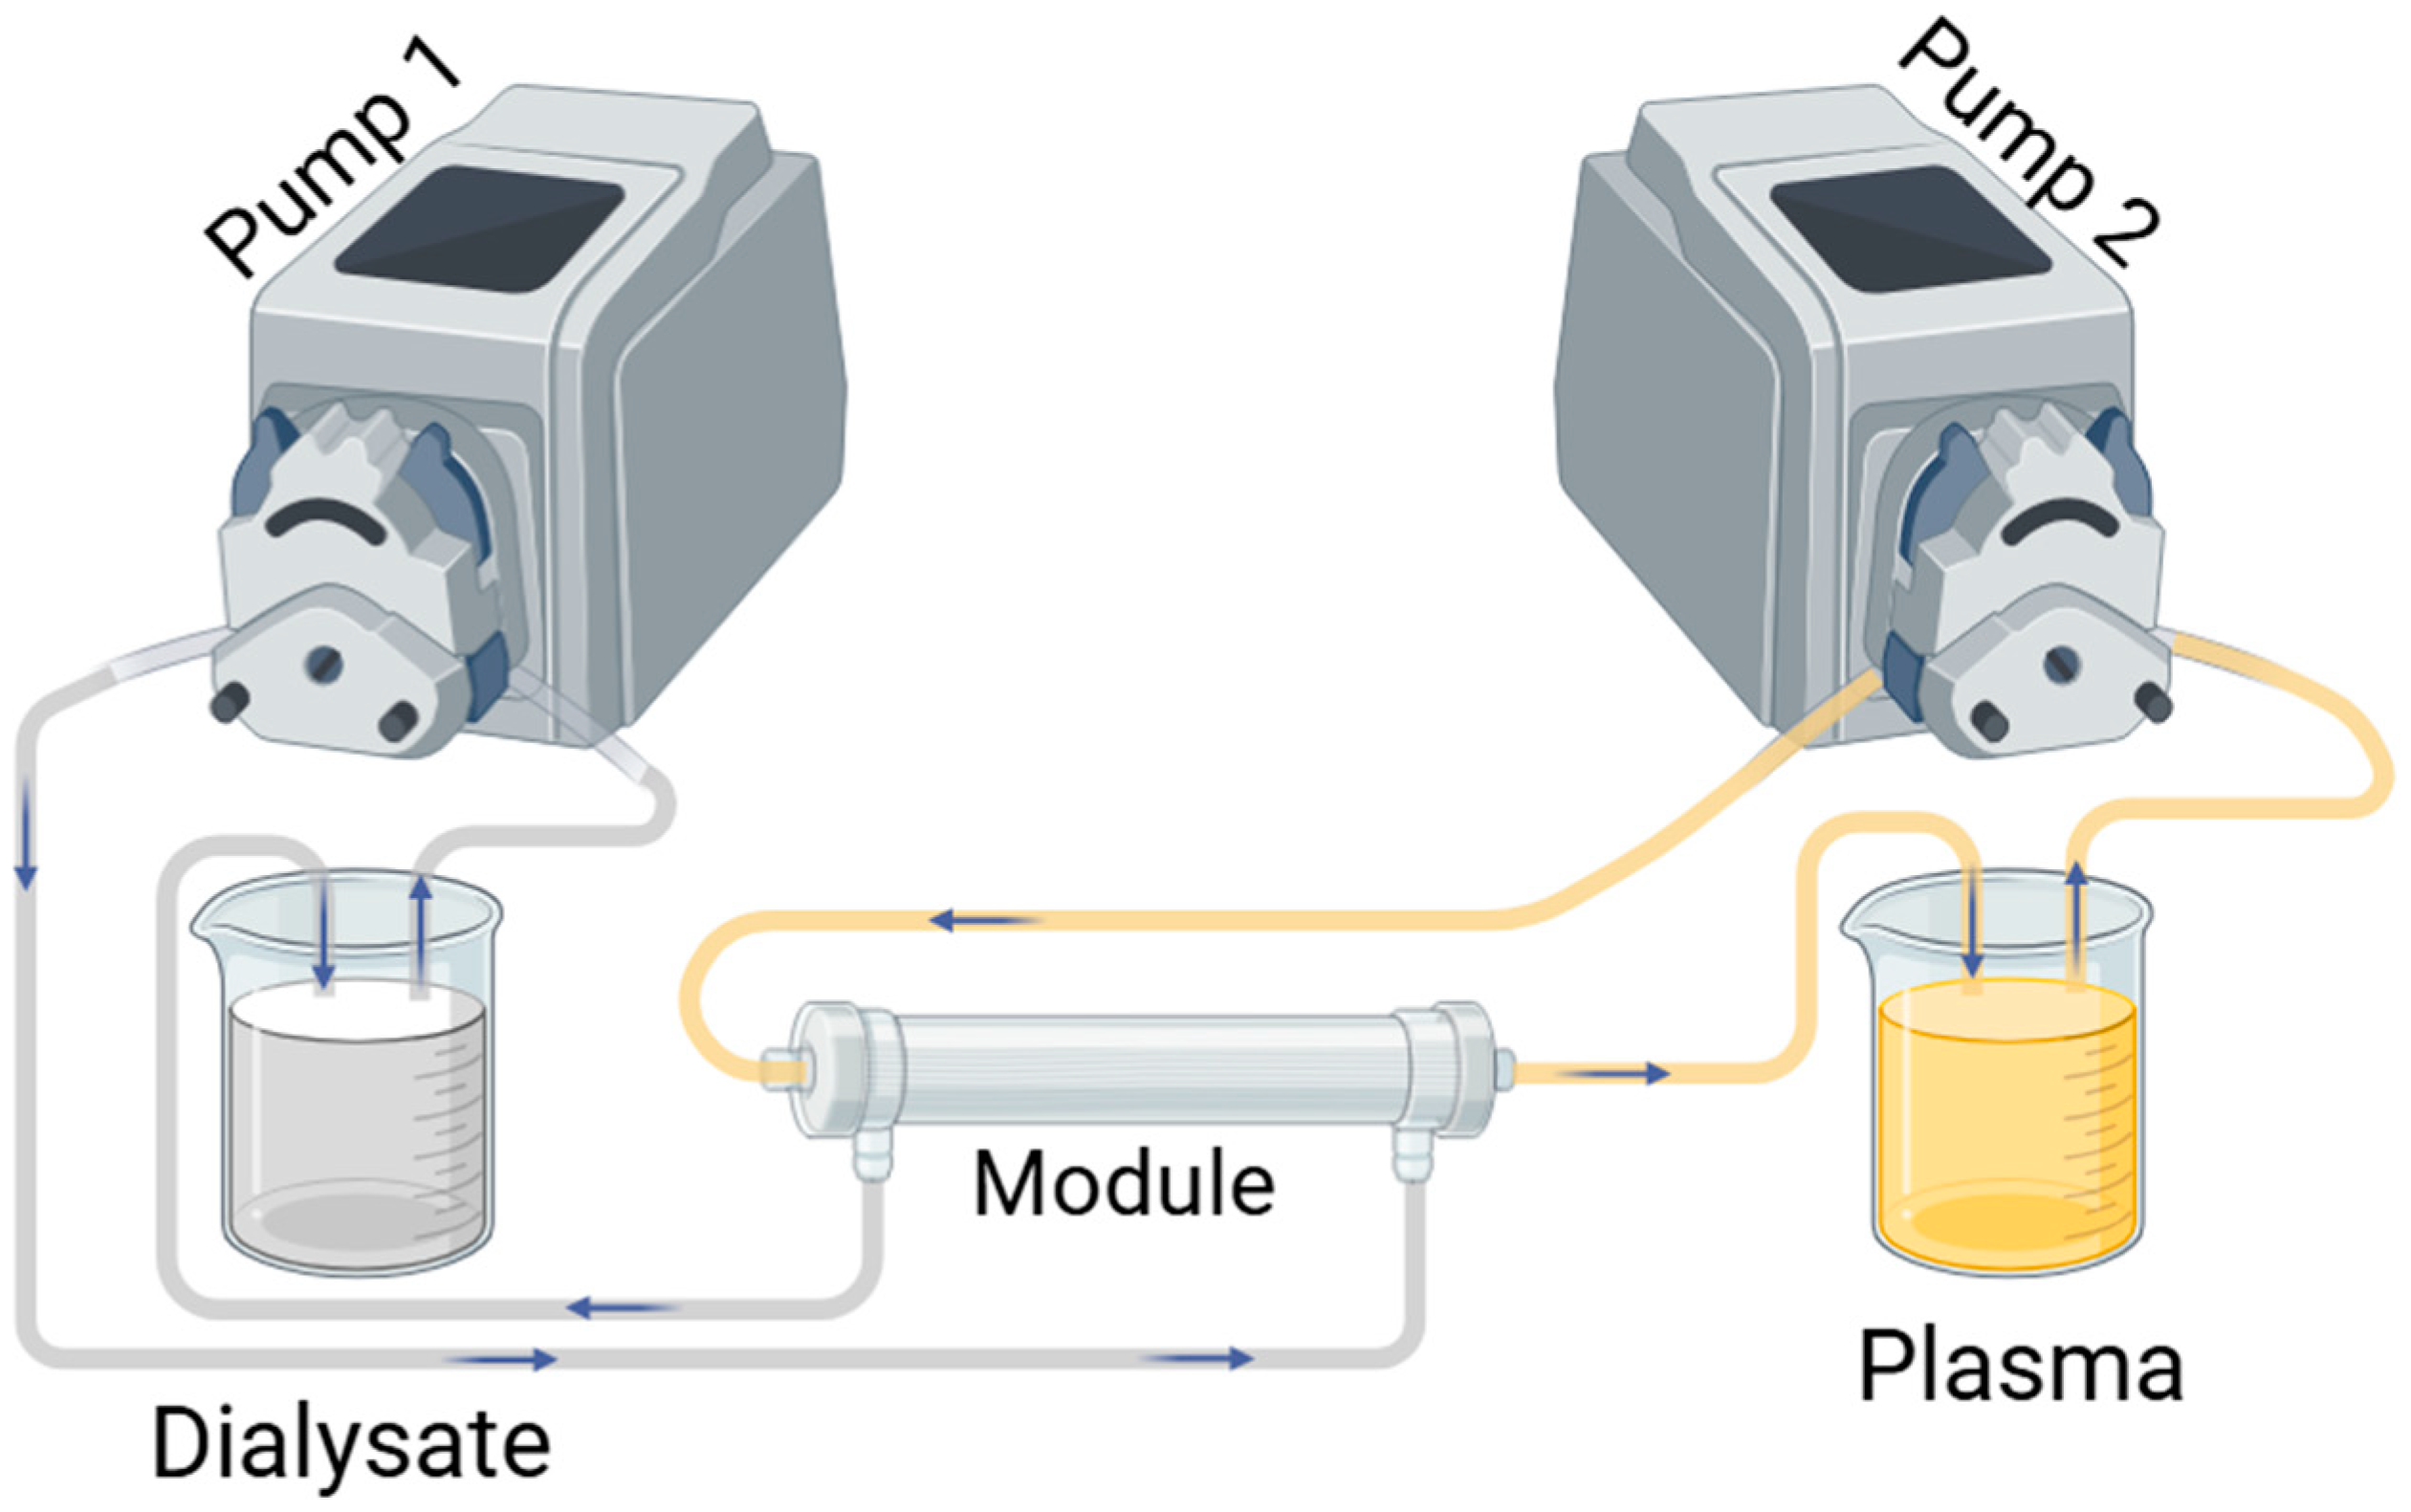
Uremic Toxin Removal
Protein Transport
2.3. Statistics
3. Results and Discussion
3.1. Membrane Fabrication and Morphology
3.2. Surface Chemistry (ATR-FTIR and XPS)
3.3. Membrane Properties
3.3.1. KUF, SC, and Mechanical Properties
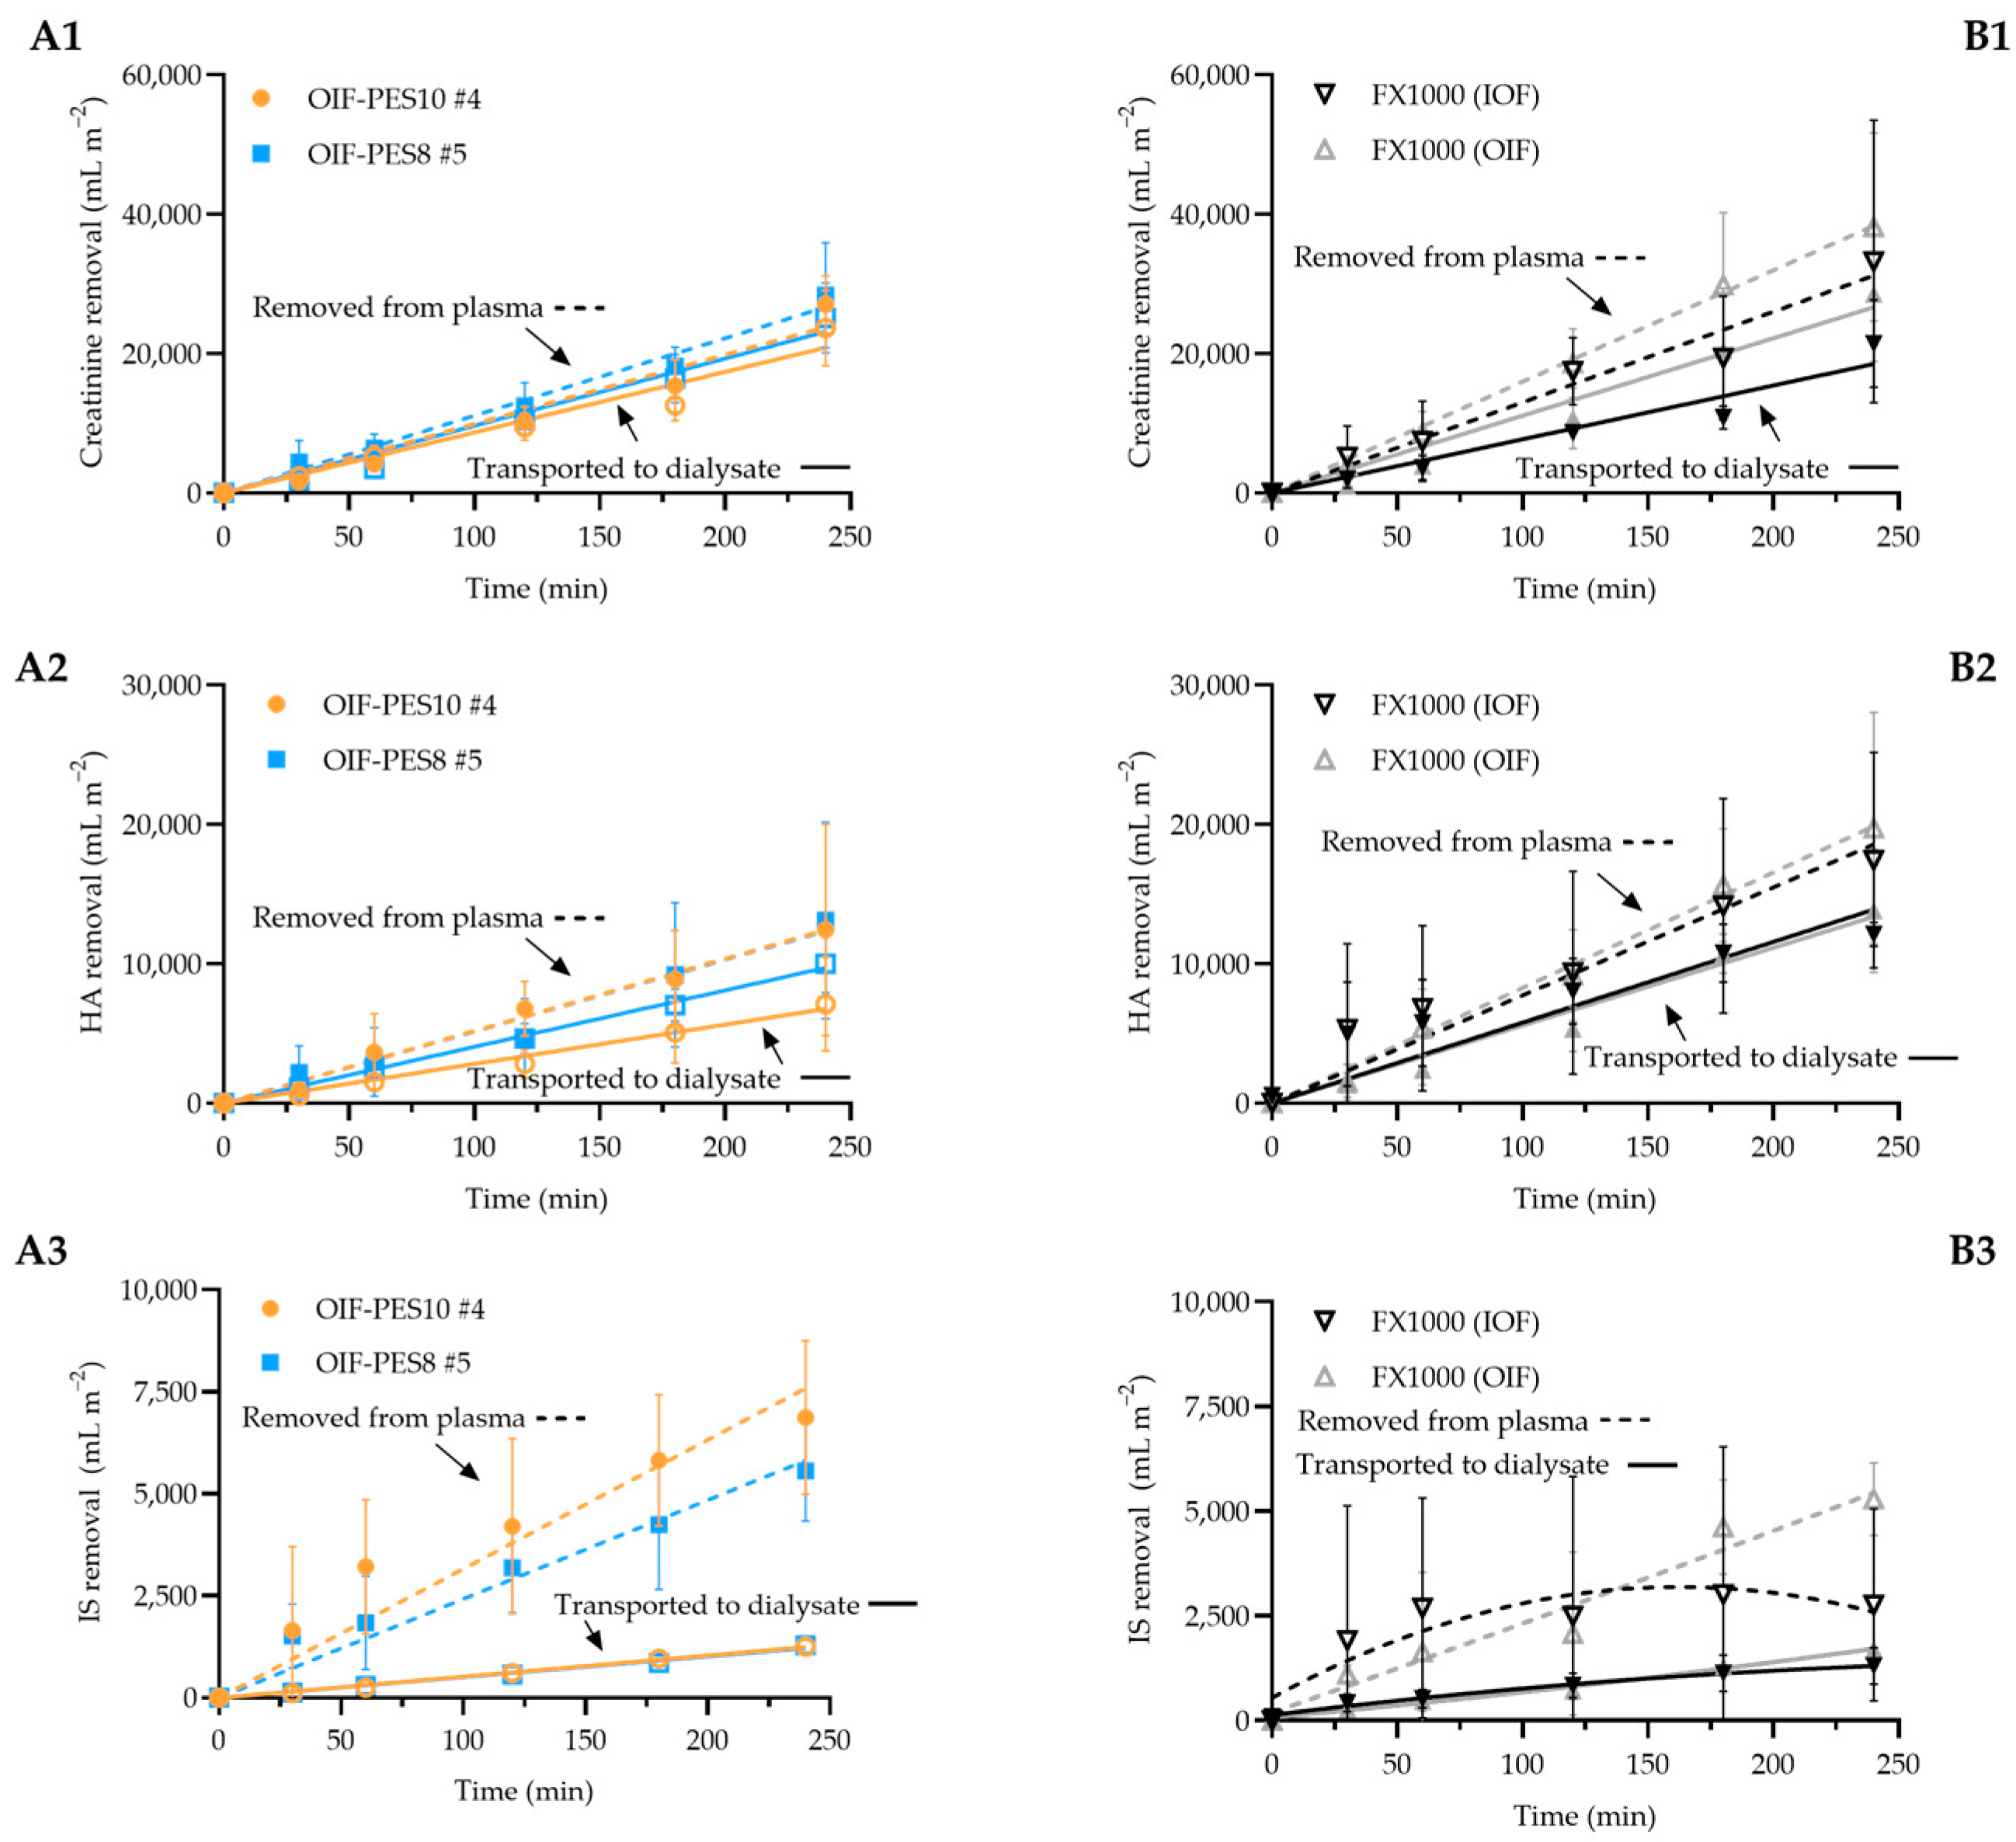
3.3.2. Uremic Toxin Removal Experiments
4. Conclusions
Author Contributions
Funding
Institutional Review Board Statement
Data Availability Statement
Acknowledgments
Conflicts of Interest
Appendix A

| Inner diameter needle (mm) | 0.11 mm |
| Outer diameter needle (mm) | 0.2 mm |
| Inner diameter first orifice (mm) | 0.5 mm |
| Outer diameter first orifice (mm) | 0.8 mm |
| Inner diameter second orifice (mm) | 1 mm |


| Membrane Type | Fiber ID | Outer Diameter (µm) | Inner Diameter (µm) | Wall Thickness (µm) |
|---|---|---|---|---|
| 12 wt% PES, 4 wt% PVP (OIF-PES12) | #1 | 596 ± 3 | 310 ± 5 | 150 ± 3 |
| #2 | 576 ± 1 | 278 ± 4 | 143 ± 0 | |
| #3 | 530 ± 4 | 309 ± 7 | 119 ± 1 | |
| #4 | 440 ± 1 | 300 ± 3 | 80 ± 2 | |
| 10 wt% PES, 4 wt% PVP (OIF-PES10) | #1 | 540 ± 2 | 290 ± 2 | 121 ± 9 |
| #2 | 509 ± 8 | 300 ± 2 | 110 ± 4 | |
| #3 | 450 ± 1 | 300 ± 4 | 85 ± 2 | |
| #4 | 440 ± 3 | 280 ± 1 | 95 ± 1 | |
| #5 | 409 ± 2 | 273 ± 4 | 75 ± 3 | |
| 8 wt% PES, 4 wt% PVP (OIF-PES8) | #1 | 550 ± 1 | 263 ± 1 | 94 ± 4 |
| #2 | 490 ± 5 | 280 ± 1 | 95 ± 4 | |
| #3 | 450 ± 1 | 296 ± 2 | 84 ± 1 | |
| #4 | 470 ± 8 | 270 ± 1 | 116 ± 3 | |
| #5 | 409 ± 3 | 240 ± 2 | 101 ± 2 | |
| Fresenius | FX1000 | 266 ± 3 | 189 ± 5 | 44 ± 2 |
| Membrane Type | Fiber Type | Ultrafiltration Coefficient (mL m−2 h−1 mmHg−1) |
|---|---|---|
| 12 wt% PES, 4 wt% PVP (OIF-PES12) | #1 | 0.7 |
| #2 | 5.9 | |
| #3 | 7.1 | |
| #4 | 6.8 | |
| 10 wt% PES, 4 wt% PVP (OIF-PES10) | #1 | 13.8 |
| #2 | 7.7 | |
| #3 | 10.9 | |
| #4 | 13 ± 0.8 (n = 3) | |
| #5 | 14.2 | |
| 8 wt% PES, 4 wt% PVP (OIF-PES8) | #1 | 23.9 |
| #2 | 17.2 | |
| #3 | 20.6 | |
| #4 | 25 | |
| #5 | 34 ± 2.5 (n = 3) | |
| FX1000 | 136 [43] 52 ± 3 (this study, n = 3) |
| Membrane Type | Fiber Type | Outer Diameter (µm) | Young’s Modulus (MPa) | Max. Force Before Break (MPa) | Max. Elongation Before Break (%) |
|---|---|---|---|---|---|
| 12 wt% PES, 4 wt% PVP (OIF-PES12) | #1 | 596 ± 3 | 33 ± 3 | 1.4 ± 0.1 | 5.2 ± 0.6 |
| #2 | 576 ± 1 | 21 ± 2 | 1.0 ± 0.1 | 3.0 ± 0.1 | |
| #3 | 530 ± 4 | 28 ± 2 | 1.5 ± 0.1 | 3.5 ± 0.4 | |
| #4 | 440 ± 1 | 21 ± 1 | 1.4 ± 0.5 | 2.6 ± 0.3 | |
| 10 wt% PES, 4 wt% PVP (OIF-PES10) | #1 | 540 ± 2 | 39 ± 2 | 0.8 ± 0.1 | 4.0 ± 1.1 |
| #2 | 509 ± 8 | 45 ± 2 | 0.8 ± 0.0 | 2.6 ± 0.3 | |
| #3 | 450 ± 1 | 40 ± 4 | 0.8 ± 0.2 | 2.7 ± 0.8 | |
| #4 | 440 ± 3 | 50 ± 1 | 0.9 ± 0.1 | 1.9 ± 0.3 | |
| #5 | 409 ± 2 | 40 ± 4 | 0.7 ± 0.1 | 2.3 ± 0.3 | |
| 8 wt% PES, 4 wt% PVP (OIF-PES8) | #1 | 550 ± 1 | 29 ± 2 | 0.5 ± 0.0 | 3.3 ± 0.2 |
| #2 | 490 ± 5 | 33 ± 1 | 0.5 ± 0.0 | 1.7 ± 0.1 | |
| #3 | 450 ± 1 | 23 ± 3 | 0.4 ± 0.1 | 2.3 ± 0.9 | |
| #4 | 470 ± 8 | 23 ± 1 | 0.5 ± 0.1 | 2.7 ± 1.0 | |
| #5 | 409 ± 3 | 20 ± 4 | 0.3 ± 0.0 | 2.1 ± 0.3 | |
| FX1000 | 266 ± 3 | 38 ± 4 | 2.3 ± 0.2 | 34 ± 7 |
| Mini-Dialyzer Parameters | OIF-PES10 #4 | OIF-PES8 #5 |
|---|---|---|
| Inner housing diameter (Dhousing) | 6 mm = 6 × 10⁻³ m | 6 mm = 6 × 10⁻³ m |
| Length of fibers | 9 cm | 9 cm |
| Number of fibers (n) | 9 fibers | 9 fibers |
| Fiber Dimensions | ||
| Outer diameter (Douter) | 440 μm = 440 × 10−6 m | 409 μm = 409 × 10−6 m |
| Inner diameter (Dinner) | 280 μm = 280 × 10−6 m | 240 μm = 240 × 10−6 m |
| Flow Rates | ||
| Plasma flow rate (Qplasma) | 25 mL min−1 = 4.2 × 10⁻⁷ m3 s−1 | 25 mL min−1 = 4.2 × 10⁻⁷ m3 s−1 |
| Dialysate flow rate (Qdialysate) | 0.5 mL min−1 = 8.3 × 10⁻⁹ m3 s−1 | 0.5 mL min−1 = 8.3 × 10⁻⁹ m3 s−1 |
| Plasma flow velocity () | 18,040 mm s−1 | 17,500 mm s−1 |
| Dialysate flow velocity () | 15 mm s−1 | 13 mm s−1 |
- A.
- Cross-Section Areas
- Plasma flow (annular space):
- Dialysate flow (lumen of 9 fibers):
- B.
- Flow velocities
- Plasma velocity:
- Dialysate velocity:
References
- Ciceri, P.; Cozzolino, M. Expanded Haemodialysis as a Current Strategy to Remove Uremic Toxins. Toxins 2021, 13, 380. [Google Scholar] [CrossRef] [PubMed]
- Fathima, N.; Kashif, T.; Janapala, R.N.; Jayaraj, J.S.; Qaseem, A. Single-best Choice Between Intermittent Versus Continuous Renal Replacement Therapy: A Review. Cureus 2019, 11, e5558. [Google Scholar] [CrossRef]
- Kohlová, M.; Rocha, S.; Amorim, C.G.; Araújo, A.d.N.; Santos-Silva, A.; Solich, P.; Montenegro, M.C.B.d.S. Doping Polysulfone Membrane with Alpha-Tocopherol and Alpha-Lipoic Acid for Suppressing Oxidative Stress Induced by Hemodialysis Treatment. Macromol. Biosci. 2020, 20, e2000046. [Google Scholar] [CrossRef]
- Irfan, M.; Idris, A. Overview of PES biocompatible/hemodialysis membranes: PES–blood interactions and modification techniques. Mater. Sci. Eng. C 2015, 56, 574–592. [Google Scholar] [CrossRef]
- Bacal, C.J.O.; Munro, C.J.; Tardy, B.; Maina, J.W.; Sharp, J.A.; Razal, J.M.; Greene, G.W.; Nandurkar, H.H.; Dwyer, K.M.; Dumée, L.F. Fouling during hemodialysis—Influence of module design and membrane surface chemistry. Adv. Membr. 2024, 4. [Google Scholar] [CrossRef]
- Morti, S.; Shao, J.; Zydney, A.L. Importance of asymmetric structure in determining mass transport characteristics of hollow fiber hemodialyzers. J. Membr. Sci. 2003, 224, 39–49. [Google Scholar] [CrossRef]
- Yamashita, A.C.; Kakee, T.; Ono, T.; Motegi, J.; Yamaguchi, S.; Sunohara, T. Semi-Quantitative Evaluation of Asymmetricity of Dialysis Membrane Using Forward and Backward Ultrafiltration. Membranes 2022, 12, 624. [Google Scholar] [CrossRef] [PubMed]
- Maruyama, O.; Numata, Y.; Nishida, M.; Yamane, T.; Oshima, I.; Adachi, Y.; Masuzawa, T. Hemolysis caused by surface roughness under shear flow. J. Artif. Organs 2005, 8, 228–236. [Google Scholar] [CrossRef] [PubMed]
- Westphalen, H.; Saadati, S.; Eduok, U.; Abdelrasoul, A.; Shoker, A.; Choi, P.; Doan, H.; Ein-Mozaffari, F. Case studies of clinical hemodialysis membranes: Influences of membrane morphology and biocompatibility on uremic blood-membrane interactions and inflammatory biomarkers. Sci. Rep. 2020, 10, 1–18. [Google Scholar] [CrossRef] [PubMed]
- Uchino, S.; Fealy, N.; Baldwin, I.; Morimatsu, H.; Bellomo, R. Continuous is not continuous: The incidence and impact of circuit "down-time" on uraemic control during continuous veno-venous haemofiltration. Intensiv. Care Med. 2003, 29, 575–578. [Google Scholar] [CrossRef]
- Bowry, S.K.; Kircelli, F.; Himmele, R.; Nigwekar, S.U. Blood-incompatibility in haemodialysis: Alleviating inflammation and effects of coagulation. Clin. Kidney J. 2021, 14, i59–i71. [Google Scholar] [CrossRef] [PubMed]
- Brophy, P.D.; Somers, M.J.G.; Baum, M.A.; Symons, J.M.; McAfee, N.; Fortenberry, J.D.; Rogers, K.; Barnett, J.; Blowey, D.; Baker, C.; et al. Multi-centre evaluation of anticoagulation in patients receiving continuous renal replacement therapy (CRRT). Nephrol. Dial. Transplant. 2005, 20, 1416–1421. [Google Scholar] [CrossRef]
- Mollahosseini, A.; Abdelrasoul, A.; Shoker, A. A critical review of recent advances in hemodialysis membranes hemocompatibility and guidelines for future development. Mater. Chem. Phys. 2020, 248, 122911. [Google Scholar] [CrossRef]
- Zawada, A.M.; Lang, T.; Ottillinger, B.; Kircelli, F.; Stauss-Grabo, M.; Kennedy, J.P. Impact of Hydrophilic Modification of Synthetic Dialysis Membranes on Hemocompatibility and Performance. Membranes 2022, 12, 932. [Google Scholar] [CrossRef] [PubMed]
- Radu, E.R.; Voicu, S.I. Functionalized Hemodialysis Polysulfone Membranes with Improved Hemocompatibility. Polymers 2022, 14, 1130. [Google Scholar] [CrossRef]
- Qi, X.; Yang, N.; Luo, Y.; Jia, X.; Zhao, J.; Feng, X.; Chen, L.; Zhao, Y. Resveratrol as a plant type antioxidant modifier for polysulfone membranes to improve hemodialysis-induced oxidative stress. Mater. Sci. Eng. C 2021, 123, 111953. [Google Scholar] [CrossRef] [PubMed]
- Bergdahl, M.E.; Bergdahl, L.A. A comparison of flat-sheet and hollow-fiber membrane oxygenators: The Shiley M-2000 vs. the Bentley BOS-CM 40. Tex. Heart Inst. J. 1989, 16, 27–31. [Google Scholar] [PubMed]
- Mostafavi, A.H.; Mishra, A.K.; Ulbricht, M.; Denayer, J.; Hosseini, S.S. Oxygenation and Membrane Oxygenators: Emergence, Evolution and Progress in Material Development and Process Enhancement for Biomedical Applications. J. Membr. Sci. Res. 2021, 7, 230–259. [Google Scholar] [CrossRef]
- Soltys, P.J.; Zydney, A.; Leypoldt, J.K.; Henderson, L.W.; Ofsthun, N.J. Potential of dual-skinned, high-flux membranes to reduce backtransport in hemodialysis. Kidney Int. 2000, 58, 818–828. [Google Scholar] [CrossRef] [PubMed]
- Mohajerani, F.; Clark, W.R.; Ronco, C.; Narsimhan, V. Mass Transport in High-Flux Hemodialysis. Clin. J. Am. Soc. Nephrol. 2022, 17, 749–756. [Google Scholar] [CrossRef] [PubMed]
- Dukhin, S.S.; Tabani, Y.; Lai, R.; Labib, O.A.; Zydney, A.L.; Labib, M.E. Outside-in hemofiltration for prolonged operation without clogging. J. Membr. Sci. 2014, 464, 173–178. [Google Scholar] [CrossRef] [PubMed]
- Ter Beek, O.E.M.; van Gelder, M.K.; Lokhorst, C.; Hazenbrink, D.H.M.; Lentferink, B.H.; Gerritsen, K.G.F.; Stamatialis, D. In vitro study of dual layer mixed matrix hollow fiber membranes for outside-in filtration of human blood plasma. Acta Biomater. 2021, 123, 244–253. [Google Scholar] [CrossRef] [PubMed]
- Geremia, I.; Stamatialis, D.; Labib, M.; Materna, P.M. Hollow Fibers for Outside-In Dialysis Applications. U.S. Patent Application No. 17/339,116, 4 June 2021. [Google Scholar]
- Geremia, I. New Membrane Strategies for Improved Artificial Kidney Devices. Ph.D. Thesis, University of Twente, Enschede, The Netherlands, 2021. [Google Scholar]
- Duranton, F.; Cohen, G.; De Smet, R.; Rodriguez, M.; Jankowski, J.; Vanholder, R.; Argiles, A.; European Uremic Toxin Work Group. Normal and Pathologic Concentrations of Uremic Toxins. J. Am. Soc. Nephrol. 2012, 23, 1258–1270. [Google Scholar] [CrossRef]
- Eloot, S. Experimental and Numerical Modeling of Dialysis; Ghent University: Gent, Belgium, 2004. [Google Scholar]
- Radjabian, M.; Koll, J.; Buhr, K.; Handge, U.A.; Abetz, V. Hollow fiber spinning of block copolymers: Influence of spinning conditions on morphological properties. Polymer 2013, 54, 1803–1812. [Google Scholar] [CrossRef]
- Zhang, X.G.; Li, J.; Miao, Z.L. Effect of Spinning Conditions on the Morphology of Polyacrylonitrile Hollow Fiber Membranes. Adv. Mater. Res. 2011, 221, 146–151. [Google Scholar] [CrossRef]
- Simone, S.; Figoli, A.; Criscuoli, A.; Carnevale, M.; Alfadul, S.; Al-Romaih, H.; Al Shabouna, F.; Al-Harbi, O.; Drioli, E. Effect of selected spinning parameters on PVDF hollow fiber morphology for potential application in desalination by VMD. Desalination 2014, 344, 28–35. [Google Scholar] [CrossRef]
- Chung, T.-S.; Teoh, S.K.; Lau, W.W.Y.; Srinivasan, M.P. Effect of Shear Stress within the Spinneret on Hollow Fiber Membrane Morphology and Separation Performance. Ind. Eng. Chem. Res. 1998, 37, 3930–3938. [Google Scholar] [CrossRef]
- Shieh, J.-J.; Chung, T.S. Effect of liquid-liquid demixing on the membrane morphology, gas permeation, thermal and mechanical properties of cellulose acetate hollow fibers. J. Membr. Sci. 1998, 140, 67–79. [Google Scholar] [CrossRef]
- Zidan, H.M.; Abdelrazek, E.M.; Abdelghany, A.M.; Tarabiah, A.E. Characterization and some physical studies of PVA/PVP filled with MWCNTs. J. Mater. Res. Technol. 2018, 8, 904–913. [Google Scholar] [CrossRef]
- Care, F.M. FX Classix Dialyzers. Available online: https://www.freseniusmedicalcare.com/en/healthcare-professionals/hemodialysis/dialyzers/fx-classix-dialyzers (accessed on 30 November 2024).
- Bowry, S.; Ronco, C. Surface Topography and Surface Elemental Composition Analysis of Helixone®, a New High-Flux Polysulfone Dialysis Membrane. Int. J. Artif. Organs 2001, 24, 757–764. [Google Scholar] [CrossRef]
- Tattersall, J.; Martin-Malo, A.; Pedrini, L.; Basci, A.; Canaud, B.; Fouque, D.; Haage, P.; Konner, K.; Kooman, J.; Pizzarelli, F.; et al. EBPG guideline on dialysis strategies. Nephrol. Dial. Transplant. 2007, 22, ii5–ii21. [Google Scholar] [CrossRef]
- Yu, D.-G.; Chou, W.-L.; Yang, M.-C. Effect of bore liquid temperature and dope concentration on mechanical properties and permeation performance of polyacrylonitrile hollow fibers. Sep. Purif. Technol. 2006, 51, 1–9. [Google Scholar] [CrossRef]
- Alsalhy, Q.F. Influence of Spinning Conditions on the Morphology, Pore Size, Pore Size Distribution, Mechanical Properties, and Performance of PVC Hollow Fiber Membranes. Sep. Sci. Technol. 2013, 48, 234–245. [Google Scholar] [CrossRef]
- Quan, Q.; Xiao, C.; Liu, H.; Zhao, W.; Hu, X.Y.; Huan, G. Preparation and Properties of Two-Dimensional Braid Heteroge-neous-Reinforced Polyvinylidene Fluoride Hollow Fiber Membrane. Adv. Mater. Res. 2014, 936, 218–225. [Google Scholar] [CrossRef]
- Rovère, A.D.; Grady, B.P.; Shambaugh, R.L. The influence of processing parameters on the properties of melt-spun poly-propylene hollow fibers. J. Appl. Polym. Sci. 2002, 83, 1759–1772. [Google Scholar] [CrossRef]
- Kagramanov, G.; Gurkin, V.; Farnosova, E. Physical and Mechanical Properties of Hollow Fiber Membranes and Technological Parameters of the Gas Separation Process. Membranes 2021, 11, 583. [Google Scholar] [CrossRef]
- Kim, D.; Margalef, M.; Maciej-Hulme, M.; Kellenbach, E.; de Graaf, M.; Stamatialis, D.; van der Vlag, J. Mixed matrix membranes with incorporated glycosaminoglycans have good blood biocompatibility combined to high toxin removal. J. Membr. Sci. 2024, 699. [Google Scholar] [CrossRef]
- Costa, A.M.; Halfwerk, F.R.; Thiel, J.-N.; Wiegmann, B.; Neidlin, M.; Arens, J. Influence of utilizing hemodialysis membranes outside-in on solute clearance and filtration efficiency – One step towards a novel combined lung and kidney support device. J. Membr. Sci. 2024, 698. [Google Scholar] [CrossRef]
- Kim, D.; Stamatialis, D. High flux mixed matrix membrane with low albumin leakage for blood plasma detoxification. J. Membr. Sci. 2020, 609, 118187. [Google Scholar] [CrossRef]
| Membrane Type ↓ | Fiber Type | Polymer FR (mL min−1) | Bore FR (mL min−1) | Shower FR (mL min−1) | Air Gap (cm) | PS (m min−1) |
|---|---|---|---|---|---|---|
| 12 wt% PES, 4 wt% PVP (OIF-PES12) | #1 | 1.0 | 0.2 | 0.4 | 1.5 | 9 |
| #2 | 1.0 | 0.2 | 0.4 | 1.5 | 12 | |
| #3 | 0.8 | 0.2 | 0.4 | 1.5 | 12 | |
| #4 | 0.7 | 0.2 | 0.4 | 1.5 | 14 | |
| 10 wt% PES, 4 wt% PVP (OIF-PES10) | #1 | 1.0 | 0.2 | 0.4 | 1.5 | 12 |
| #2 | 0.8 | 0.2 | 0.4 | 1.5 | 12 | |
| #3 | 0.6 | 0.2 | 0.4 | 1.5 | 12 | |
| #4 | 0.8 | 0.2 | 0.4 | 1.5 | 15 | |
| #5 | 0.7 | 0.2 | 0.4 | 1.5 | 15 | |
| 8 wt% PES, 4 wt% PVP (OIF-PES8) | #1 | 1.0 | 0.2 | 0.4 | 1.5 | 12 |
| #2 | 0.8 | 0.2 | 0.4 | 1.5 | 12 | |
| #3 | 0.6 | 0.2 | 0.4 | 1.5 | 12 | |
| #4 | 0.8 | 0.2 | 0.4 | 1.5 | 15 | |
| #5 | 0.7 | 0.2 | 0.4 | 1.5 | 15 |
| Fiber → | OIF-PES10 | OIF-PES8 | FX1000 | |||
|---|---|---|---|---|---|---|
| Element ↓ | Outer Layer | Lumen | Outer Layer | Lumen | Outer Layer | Lumen |
| C (%) | 73 ± 1 | 79 ± 2 | 73 ± 5 | 73 ± 2 | 81 ± 1 | 75 ± 2 |
| N (%) | 10 ± 2 | 4 ± 1 | 8 ± 4 | 5 ± 3 | 4 ± 1 | 6 ± 2 |
| O (%) | 13 ± 1 | 15 ± 1 | 16 ± 3 | 18 ± 3 | 13 ± 1 | 17 ± 1 |
| S (%) | 3 ± 1 | 2 ± 0.2 | 2 ± 0.1 | 3 ± 0.2 | 2 ± 0.2 | 2 ± 1 |
| Membrane ↓ | ID (µm) | OD (µm) | Young’s Modulus (MPa) | Max. Force Before Break (MPa) | Max. Elongation Before Break (%) |
|---|---|---|---|---|---|
| OIF-PES10 #4 | 280 ± 1 | 440 ± 3 | 50 ± 1 | 0.9 ± 0.1 | 1.9 ± 0.3 |
| OIF-PES8 #5 | 240 ± 2 | 409 ± 3 | 20 ± 4 | 0.3 ± 0.0 | 2.1 ± 0.3 |
| FX1000 | 189 ± 5 | 266 ± 3 | 38 ± 4 | 2.3 ± 0.2 | 34 ± 7 |
| Sieving Coefficient | ||||||
|---|---|---|---|---|---|---|
| Membrane ↓ | Creatinine (0.11 KDa) | Myoglobulin (17 KDa) | BSA (66 KDa) | γ-Globulin (150 KDa) | Thyroglobulin (670 KDa) | KUF (mL m−2 h−1 mmHg−1) |
| OIF-PES10 #4 | 0.95 ± 0.01 | 0.89 ± 0.04 | 0.03 ± 0.02 | 0.05 ± 0.02 | 0.06 ± 0.03 | 13 ± 1 |
| OIF-PES8 #5 | 0.92 ± 0.08 | 0.83 ± 0.02 | 0.03 ± 0.01 | 0.02 ± 0.01 | 0.07 ± 0.04 | 34 ± 3 |
| FX1000 | - | - | 0.03 ± 0.03 | - | - | 52 ± 3 |
| OIF-PES10 #4 | OIF-PES8 #5 | FX1000 (OIF) | FX1000 (IOF) | |
|---|---|---|---|---|
| KUF (mL m−2 h−1 mmHg−1) | 13 ± 1 | 34 ± 3 | 52 ± 3 | 52 ± 3 |
| Total creatinine removal (mg m−2) at 4 h | 1026 ± 43 | 1140 ± 187 | 1196 ± 149 | 1061 ± 274 |
| DLp creatinine (mL min−1 m−2) | 82 ± 15 | 108 ± 20 | 162 ± 39 | 133 ± 49 |
| DLd creatinine (mL min−1 m−2) | 99 ± 14 | 96 ± 15 | 111 ± 34 | 77 ± 14 |
| DLp/ DLd ratio | 0.8 ± 0.03 | 1.1 ± 0.1 | 1.5 ± 0.1 | 1.7 ± 0.6 |
| Protein loss in plasma (Cr, %) at 4 h | 6 ± 2 | 11 ± 2 | 30 ± 12 | 49 ± 10 |
| Protein gained in dialysate (Cr, %) at 4 h | 1 ± 0.2 | 1 ± 0.02 | 13 ± 7 | 17 ± 4 |
| Total HA removal (mg m−2) at 4 h | 920 ± 282 | 837 ± 264 | 933 ± 166 | 897 ± 261 |
| DLp HA (mL min−1 m−2) | 55 ± 20 | 48 ± 26 | 79 ± 14 | 76 ± 36 |
| DLd HA (mL min−1 m−2) | 27 ± 10 | 40 ± 6 | 54 ± 8 | 56 ± 8 |
| DLp/ DLd ratio | 2.4 ± 1.2 | 1.3 ± 0.8 | 1.5 ± 0.1 | 1.3 ± 0.5 |
| Total IS removal (mg m−2) at 4 h | 236 ± 47 * | 191 ± 33 | 166 ± 27 | 91 ± 54 * |
| DLp IS (mL min−1 m−2) | 34 ± 11 | 24 ± 6 | 22 ± 5 | 16 ± 14 |
| DLd IS (mL min−1 m−2) | 5 ± 1 | 5 ± 0.0 | 7 ± 1 | 6 ± 2 |
| DLp/ DLd ratio | 6.5 ± 2.5 | 4.8 ± 1.2 | 3.2 ± 0.6 | 2.6 ± 1.9 |
| Protein Loss in plasma (HA + IS, %) at 4 h | 3 ± 2 | 9 ± 5 | 25 ± 11 | 19 ± 5 |
| Protein gained in dialysate (HA + IS, %) at 4 h | 2 ± 0.2 | 2 ± 1 | 17 ± 4 | 21 ± 4 |
Disclaimer/Publisher’s Note: The statements, opinions and data contained in all publications are solely those of the individual author(s) and contributor(s) and not of MDPI and/or the editor(s). MDPI and/or the editor(s) disclaim responsibility for any injury to people or property resulting from any ideas, methods, instructions or products referred to in the content. |
© 2025 by the authors. Licensee MDPI, Basel, Switzerland. This article is an open access article distributed under the terms and conditions of the Creative Commons Attribution (CC BY) license (https://creativecommons.org/licenses/by/4.0/).
Share and Cite
Ramada, D.; Adema, B.; Labib, M.; ter Beek, O.; Stamatialis, D. Development of Hollow Fiber Membranes Suitable for Outside-In Filtration of Human Blood Plasma. Membranes 2025, 15, 16. https://doi.org/10.3390/membranes15010016
Ramada D, Adema B, Labib M, ter Beek O, Stamatialis D. Development of Hollow Fiber Membranes Suitable for Outside-In Filtration of Human Blood Plasma. Membranes. 2025; 15(1):16. https://doi.org/10.3390/membranes15010016
Chicago/Turabian StyleRamada, David, Bente Adema, Mohamed Labib, Odyl ter Beek, and Dimitrios Stamatialis. 2025. "Development of Hollow Fiber Membranes Suitable for Outside-In Filtration of Human Blood Plasma" Membranes 15, no. 1: 16. https://doi.org/10.3390/membranes15010016
APA StyleRamada, D., Adema, B., Labib, M., ter Beek, O., & Stamatialis, D. (2025). Development of Hollow Fiber Membranes Suitable for Outside-In Filtration of Human Blood Plasma. Membranes, 15(1), 16. https://doi.org/10.3390/membranes15010016