Article

Impacts of Organic Emerging Contaminants (Erythromycin, Ibuprofen, and Diclofenac) on the Performance of a Membrane Bioreactor Treating Urban Wastewater: A Heterotrophic Kinetic Investigation

by
Laura Antiñolo Bermúdez
1,†,
Elena María Martínez Sánchez
1,†,
Juan Carlos Leyva Díaz
1,
María del Mar Muñio Martínez
2,
Jose Manuel Poyatos Capilla
1 and
Jaime Martín Pascual
1,*
1
Department of Civil Engineering, Institute of Water Research, University of Granada, 18071 Granada, Spain
2
Department of Chemical Engineering, University of Granada, 18071 Granada, Spain
*
Author to whom correspondence should be addressed.
These authors contributed equally to this work.
Membranes 2023, 13(8), 697; https://doi.org/10.3390/membranes13080697
Submission received: 26 May 2023 / Revised: 25 July 2023 / Accepted: 25 July 2023 / Published: 27 July 2023
(This article belongs to the Special Issue Development and Application of Membrane Separation Processes)

Abstract

:
The occurrence of emerging organic contaminants, such as pharmaceuticals, is a growing global concern. In this research, for a membrane bioreactor (MBR) laboratory plant operating at a hydraulic retention time (HRT) of 24 h, fed with real urban wastewater, the heterotrophic biomass behaviour was analysed for two concentrations of erythromycin, ibuprofen, and diclofenac. The concentrations studied for the first phase were erythromycin 0.576 mg L−1, ibuprofen 0.056 mg L−1, and diclofenac 0.948 mg L−1. For Phase 2, the concentrations were increased to erythromycin 1.440 mg L−1, ibuprofen 0.140 mg L−1, and diclofenac 2.370 mg L−1. Heterotrophic biomass was affected and inhibited by the presence of pharmaceutical compounds in both phases. The system response to low concentrations of pharmaceutical compounds occurred in the initial phase of plant doping. Under these operating conditions, there was a gradual decrease in the concentration of mixed liquor suspended solids and the removal of chemical oxygen demand of the system, as it was not able to absorb the effect produced by the pharmaceutical compounds added in both phases.

1. Introduction

The occurrence of emerging organic contaminants (EOCs), such as chemicals in pharmaceuticals, plasticisers, and personal care products, in surface waters is an increasing global concern [1]. Pharmaceuticals represent one of the main groups of EOCs with adverse effects on living organisms, even at extremely low concentrations [2].
These pharmaceuticals are excreted as conjugates, but during treatment in wastewater treatment plants (WWTPs), the active moiety can be released by cleavage [3]. These compounds can be recognised as pseudo-persistent contaminants due to their repeated introduction into the environment through wastewater [4], and they can produce adverse effects in both animals and humans due to the presence of EOCs, among others, in water bodies [5]. Moreover, an additional concern for environmental and human health is related to the release of EOCs into soils, as well as their absorption by crops [6]. This makes it important to develop effective treatment strategies for the removal of EOCs.
According to Gros et al., the most frequently detected compounds in the basins of some rivers analysed in Spain are antibiotics (trimethoprim, sulfamethoxazole, erythromycin, and azithromycin), analgesics (ibuprofen, diclofenac, and naproxen), the antiepileptic carbamazepine, lipid regulators (bezafibrate and gemfibrozil), the blockers atenolol and sotalol, and the antihistamine ranitidine [4]. The total loads detected in river water concentration and in both the influent and the effluent are similar to those reported in other monitoring campaigns carried out in several countries such as Italy, Germany, Sweden, Canada, the United States, and Brazil [7,8].
The pharmaceuticals erythromycin, ibuprofen, and diclofenac were selected as focal compounds for this study. Notably, two of these compounds are on the EU watch list of emerging concern, namely erythromycin as an antibiotic compound and diclofenac as an anti-inflammatory compound. Furthermore, ibuprofen was included because of its widespread usage among the population.
Erythromycin (CAS 114-07-8) is a generic and inexpensive antibiotic of the macrolide family that inhibits bacterial protein synthesis. It is used as an alternative to penicillin for the treatment of infections caused by sensitive organisms [9]. Erythromycin molecules are resistant in the environment due to the structure of their aromatic ring, impeding their degradation or removal. At present, the presence of erythromycin in water and wastewater is above the standard level [10,11]. The effectiveness of the elimination of erythromycin in conventional wastewater treatment plants is 65.6% [12].
Ibuprofen (CAS 15687-27-1) is an anti-inflammatory pharmaceutical with an estimated annual global production of several kilotons; it has been identified in surface and wastewater (ng L−1), probably due to its stability regarding biodegradation and photolysis, associated with its hydrophobicity and low solubility in water (21 mg L−1) [13]. Ibuprofen has a 75% to 90% disposal rate in conventional wastewater treatment plants, one of the highest rates compared to those of other emerging contaminants [14].
Diclofenac (CAS 15307-79-6) is one of the most frequently detected pharmaceuticals in the aquatic environment. It is non-steroidal and anti-inflammatory, widely used as an antirheumatic, analgesic, and antiarthritic [15]. Because diclofenac biodegradation is limited, diclofenac removal rates in conventional WWTPs usually range from 21% to 40%, which results in the presence of diclofenac in aquatic organisms [16].
Generally, WWTPs for urban wastewater are based on conventional activated sludge. However, their ability to remove some of these compounds is discussed. Alternative technologies, such as the membrane bioreactor (MBR), are under extensive research, as they are presented as satisfactory treatment methods to improve the elimination of these compounds compared to conventional technologies in WWTPs [17]. The MBRs produce a higher effluent quality compared to conventional activated sludge systems, have a smaller ecological footprint, and can operate with a higher biomass concentration and sludge retention time (SRT) [18,19]. The MBR is an efficient technology for the treatment of urban wastewater because microfiltration or ultrafiltration membranes are used for biomass separation [20]. It has many advantages over the traditional activated sludge process for wastewater treatment, both in terms of process control and treatment effectiveness [21]. Other studies have focused on the degradation and removal of compounds of emerging concern (CEC) in different wastewater treatments, but there is little evidence of the effects of these compounds on heterotrophic biomass from MBR. Knowledge of this could improve the implementation of systems to obtain efficient degradation results [22]. Consequently, comprehending the distinct reaction patterns of heterotrophic biomass to pharmaceuticals holds potential for advancing the development of precise models and predictive tools [23,24,25]. Such advancements would facilitate the mitigation of pharmaceutical spill events and seasonal fluctuations in wastewater.
The aim of this study was to evaluate the effect of a mix of compounds of emerging concern (erythromycin, ibuprofen, and diclofenac) on an MBR with a hydraulic retention time (HRT) of 24 h and treating real urban wastewater, with the aim to determine the adaptive capacity of the biomass. For this purpose, the heterotrophic kinetics and organic matter removal efficiency were determined with two different concentrations of pharmaceuticals to evaluate the changes in the heterotrophic biomass.

2. Materials and Methods

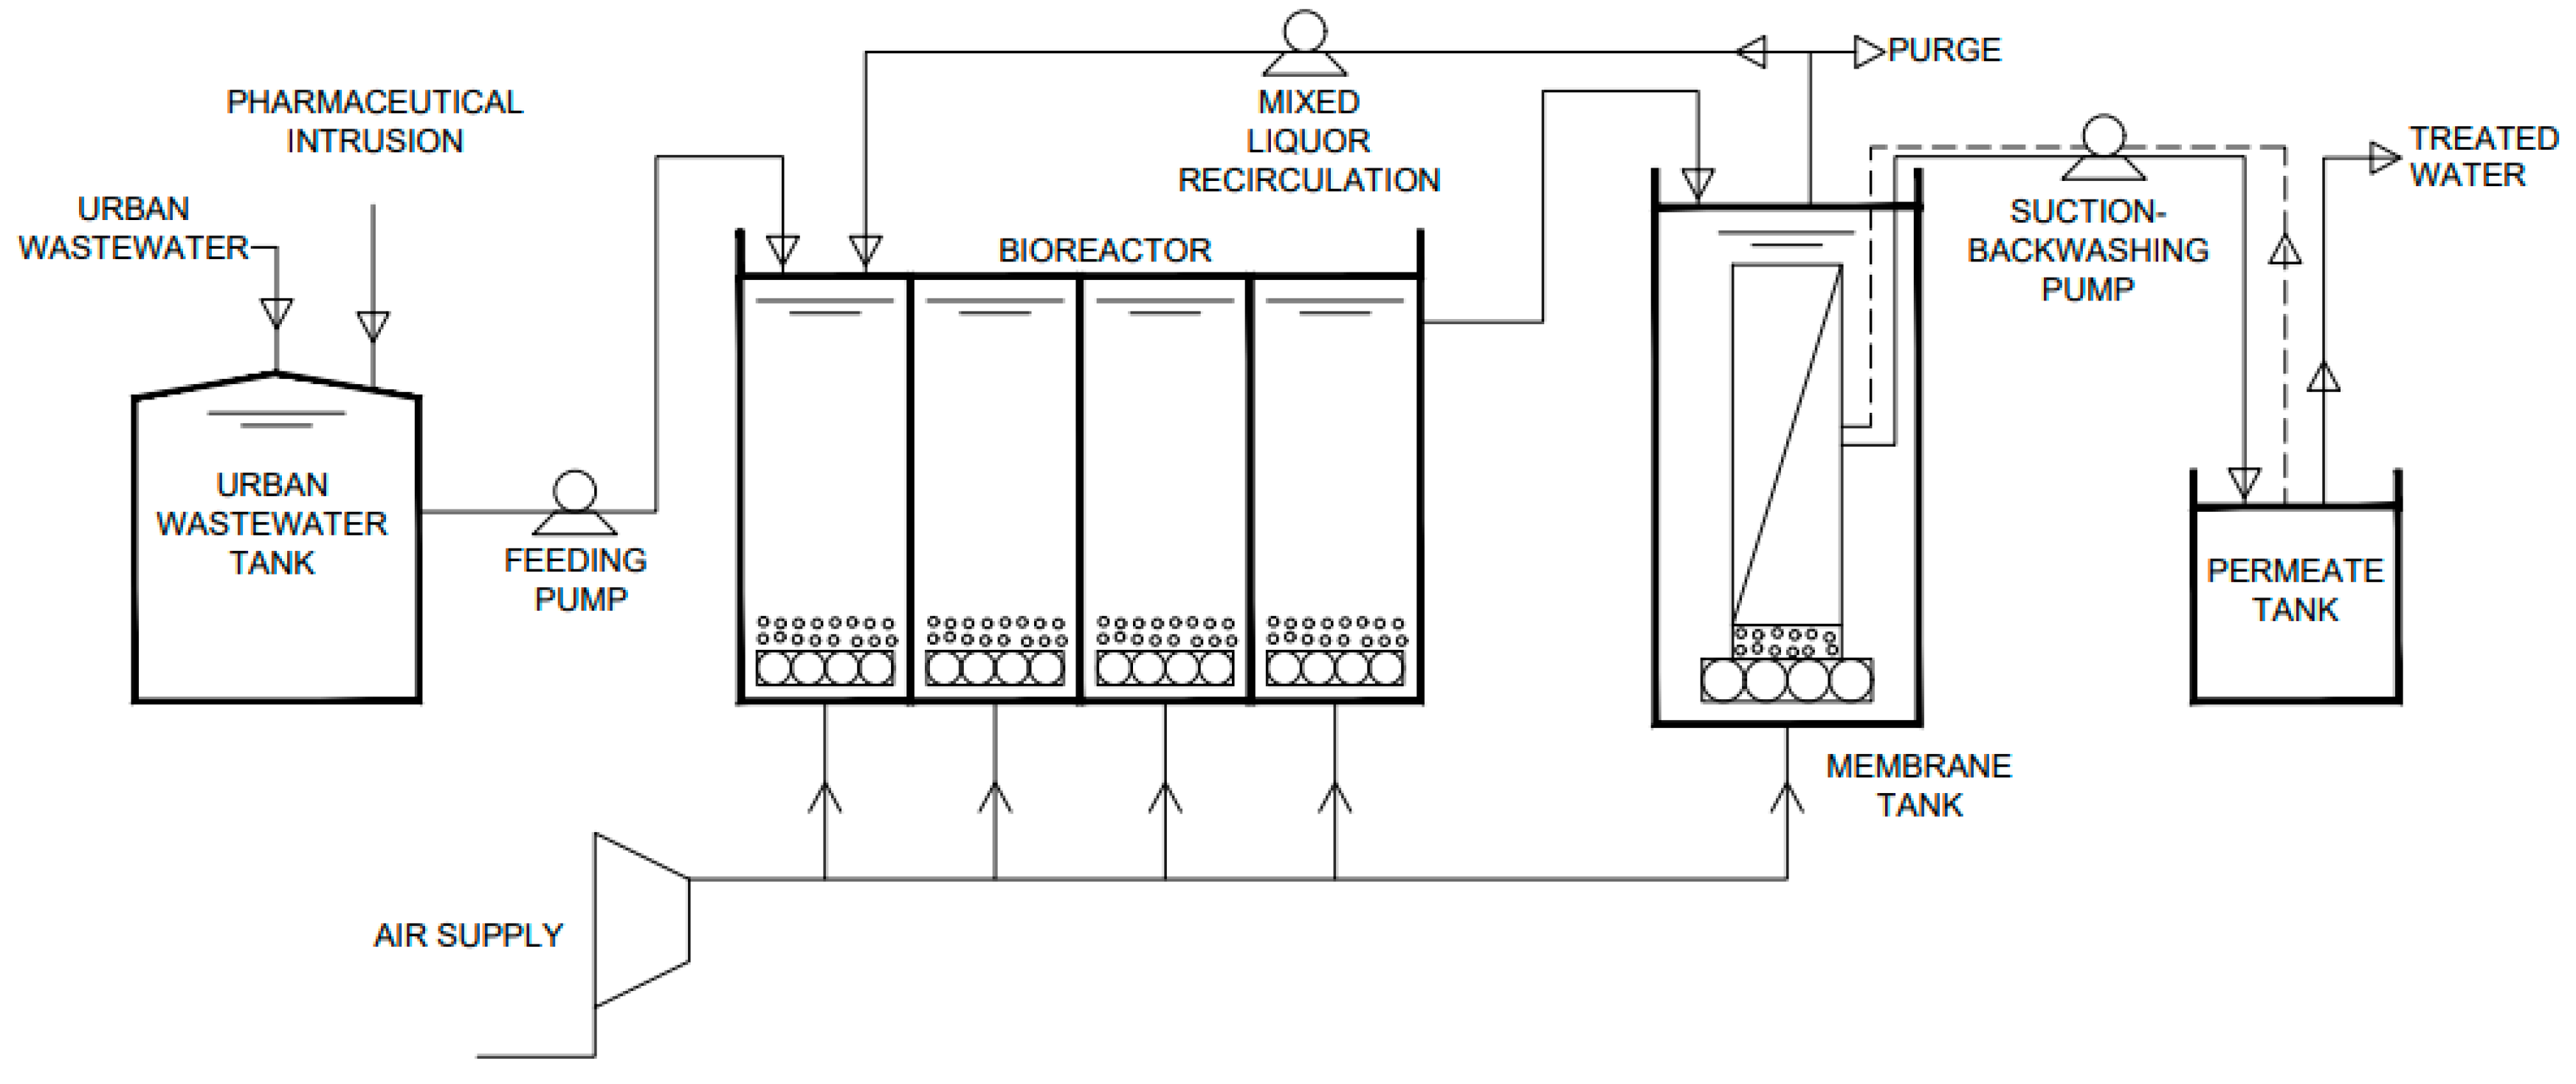
2.1. The Laboratory Plant of the Membrane Bioreactor

The laboratory plant was located in the Laboratory of Environmental Technologies of the University of Granada (Granada, Spain). To start the assays, the bioreactor was inoculated with mixed liquor from the Sur WWTP (Granada, Spain); the plant was fed with urban real wastewater from the primary settling tank of the Sur WWTP. The system is schematically represented in Figure 1.
The MBR consisted of an aerated rectangular bioreactor of four modules of 6 L each, which communicated with each other and worked as one through communicating vessels, with a total volume of 24 L and the following dimensions: 50 cm long, 12 cm wide, and 60 cm high. In the first model, the mixed liquor from the membrane tank was recirculated to keep the concentration of suspended solids inside the reactor constant. This module also contained a level probe to ensure that the volume in the bioreactor remained constant. The bioreactor outlet was connected to the cylindrical membrane tank with a diameter of 10 cm and a height of 65 cm, resulting in a total volume of 6.7 L and an effective volume of 4.32 L. It consisted of a vertically oriented module of hollow fibre microfiltration membranes. The total area of the membrane was 0.10 m2. The hollow fibres were made of polyvinylidene fluoride with a braided polyester inner reinforcement. They had an outer diameter of 2.45 mm, an inner diameter of 1.10 mm, and a pore size of 0.4 μm. The membrane tank was also connected to the aeration system, which constantly supplied a tangential air stream to prevent any organic or inorganic solids from depositing on its surface. Aeration was maintained at a constant rate to maintain a dissolved oxygen concentration of 2 mg/L.

2.2. Influent Characteristics

The laboratory plant was fed continuously with real urban wastewater from the Sur WWTP (Granada, Spain). After 13 days, the pharmaceuticals erythromycin, diclofenac, and ibuprofen were added to the feed tank.
For this research, different pharmaceutical compounds were added to the system in two different phases. For the first phase, a value 2.5 times lower than the water solubility value of erythromycin and diclofenac was established as a criterion for the amounts to be added. In the case of ibuprofen, due to its high solubility in water, the criterion established was a value 2.5 times lower than the maximum value detected in the wastewater in different areas of the world [26]. For the second phase, the criterion used to establish the amounts of the pharmaceuticals erythromycin and diclofenac was their water solubility value. In the case of ibuprofen, the maximum value detected in the wastewater was 55.97 µg/L [26]; this value was selected as the reference criterion for determining the minimum doping concentration of ibuprofen. Table 1 shows the concentrations used in this study.

2.3. Operation Conditions

The temperature at the laboratory plant was maintained at ±5 °C during the tests (15.5–20.5 °C) because the plant was located in the laboratory. The HRT was 24 h and remained constant throughout the phases. Under the plant operation conditions, cleaning and recovery of the membrane module with cyclic periods of filtration (9 min) and backwashing (1 min) were combined. A recirculation stream of activated sludge from the membrane chamber to the biological reactor was established to maintain the concentration of the heterotrophic biomass. This stream had a flow rate 50% higher than the influent stream. No increase in membrane module fouling and transmembrane pressure was observed. Consequently, there was no need for a cleaning and recovery cycle for the membrane modules. The membranes functioned efficiently and demonstrated a favourable level of permeability during operation. The working permeability values were maintained at 1.32–2.36 L/(m2 h bar). This working pressure is in the range of other studies working with membrane bioreactors in wastewater treatment with pharmaceuticals [27,28]. Table 2 shows the working permeability values.
The start-up of the laboratory plant, both in Phase 1 and Phase 2, was carried out by inoculating the plant with activated sludge from the Sur WWTP (Granada, Spain). For 13 days, the activated sludge was adapted to the new operation conditions. In both phases, the addition of the pharmaceutical mixture to the plant inlet water started on the 13th day of operation.

2.4. Analytical Determination

Samples from the influent, effluent, and bioreactor were periodically collected from the laboratory plant to characterise the wastewater. The tested properties were chemical oxygen demand (COD), biochemical oxygen demand on the fifth day (BOD5), pH, conductivity, and mixed liquor suspended solids (MLSS). The pH measurement was carried out with a Crison pH 25® meter (Barcelona, Spain). Conductivity measurements were carried out with a Crison CM 35® meter (Barcelona, Spain). Control analyses for BOD5, COD, and total suspended solids (TSS) were performed according to the standard methods [29].

2.5. Kinetic Analysis

For the study of the kinetic parameters of the heterotrophic biomass of the plant, respirometric tests were carried out in a BM-Advance respirometer of Surcis S.L. (Barcelona, Spain) The respirometer works at a stable temperature of 20.0 ± 1.0 °C, an aeration flow rate of 0.906 ± 0.001 L min−1, a pH of 7.25 ± 0.50, and a stirring speed of 2000 rpm. In addition, a recirculation stream was provided to ensure homogenisation of the sample in the respirometer.
One litre of heterotrophic biomass was taken from the laboratory plant for each of the assay pairs. This sample was homogenised by aeration for 24 h to ensure endogenous conditions. Once the biomass was homogenised, it was introduced into the respirometer, and two assays were carried out. The first one was the dynamic test with constant oxygen supply, where three additions of a 200 mg L−1 sodium acetate solution were made at increasing volumes (5, 10, and 15 mL). The second test was the static test in the absence of oxygen. These tests were carried out as described elsewhere [30].
For each litre of mixed liquor that contained the heterotrophic microorganisms, two respirometries were carried out consecutively. The first one was taken as a control to estimate the kinetic constants of the microorganisms. In the second respirometry, the mixture of pharmaceuticals was added to the sample in the concentrations that had been established for each phase. The aim of this was to determine the kinetic behaviour of the heterotrophic microorganisms in the mixed liquor and to check whether they have been able to adapt to the dodoping situation to which the laboratory plant was subjected by comparing the results obtained with those from the control respirometry. Table 3 lists the respirometric tests carried out for Phases 1 and 2.
To determine the kinetics of the analysed biomass, the kinetic constants were calculated as the yield coefficient of heterotrophic biomass (YH), the maximum specific growth rate of heterotrophic biomass (µmax), the half-saturation coefficient of organic matter (KM), and the decay coefficient of heterotrophic biomass (bH). These constants were calculated following the kinetic parameter estimation of heterotrophic biomass described elsewhere [30]. The time, Rs values and OUR values were obtained for the different tests. Rs parameters provide insights into the aerobic capacity of microorganisms, allowing researchers to assess the respiratory performance and activity of biological systems, such as activated sludge used in this study. Monitoring and analysing the Rs in the respirometer can aid in evaluating treatment performance and understanding the kinetics of oxygen-consuming reactions in various biological systems. Unlike the Rs, the OUR parameter measures the rate of oxygen consumption by the biomass under static conditions. Subsequently, all kinetic constants were calculated, using the following equations:
-
Oxygen consumption (OC) for each addition of sodium acetate:
OC = ti tf Rs   dt   ,   ( mg   O 2 L 1 )
-
Yield coefficient for heterotrophic biomass (YH):
Y H = S OC S   ·   fcv   ( mgVSS mgCOD )
where: fcv: 1.48 mg COD/mg VSS (conversion factor)
S: substrate concentration (mgO2 L−1)
-
Empirical specific growth rate for heterotrophic biomass (μemp):
μ emp = Y H   ·   Rs ( 1     Y H   ·   fcv )   ·   X H   ( h 1 )
where: XH: concentration of heterotrophic biomass (mg VSS L−1)
-
Linearisation of the Monod model:
1 μ emp = 1 μ m + K M μ m · 1 S   ( h )
where: KM: half-saturation coefficient of organic matter (mg O2/L)
-
Decay coefficient of heterotrophic biomass (bH):
b H = OURend 1.42   ·   X T   ·   [ 1   Y H ( 1     fp ) ]   ( day 1 )
where: XT: total biomass concentration biomass (mg VSS L−1)
(1 − fp): fraction of volatile biomass (mg VSS mg TSS−1)
-
Substrate degradation rate of organic matter removal (rsu):
r su = μ m   ·   S   ·   X H Y H ( K M + S )   mgO 2 L   ·   h

3. Results and Discussion

Table 4 shows the results obtained for the laboratory plant.
For the influent, the total nitrogen values were 104.30 ± 29.84 mg N L−1, and the total phosphorus values were 11.42 ± 5.35 mg P L−1, given that the influent originated from a wastewater treatment plant with well-established stability previously analysed in other studies [30,31,32].
During both Phases 1 and 2, the MLSS values exhibited a declining trend. In Phase 1, the MLSS concentration showed a progressive increase from day 17 until day 30, followed by a distinct decrease of MLSS. Throughout Phase 1, the concentrations of pharmaceutical compounds remained lower compared to Phase 2, suggesting a lesser impact on the system. However, in Phase 2, the MLSS concentration decreased to 500 mg L−1 on day 35. Due to the operational characteristics of the system, there was no purge stream, and this caused the pharmaceuticals to bioaccumulate in the bioreactor as they were added to the particles of the mixed liquor, subjecting the biomass to considerable stress. Due to this, bulking of the heterotrophic biomass was observed, which led to a sharp decrease in the concentration of MLSS from day 30 onwards in Phase 1. The membrane exhibited optimal functionality throughout the two experimental phases, even during the bulking episodes. The loss of biomass from the system occurred as a result of tank overflow caused by bulking phenomena. This problem present in the laboratory plant is continued in the operation of wastewater treatment plants, not only in membrane bioreactor technology, but also in other configurations [33,34,35,36,37,38]. In Phase 2, the decrease in the MLSS concentration was due to pharmaceutical intrusion, where the system was not able to absorb the effect on the MLSS. Across the majority of experiments, it was observed that with increasing concentrations of pharmaceuticals, there was a corresponding rise in foam formation within the biological reactor. This phenomenon signifies the gradual impact of pharmaceuticals on the biomass. Nonetheless, a significant portion of the biomass became concentrated in the bulk. Consequently, the organic matter removal yields and the microbial kinetics exhibit this effect.
The COD removal capacity decreased in both phases of the study. The activity of the heterotrophic biomass decreased over time when the laboratory plant was fed with wastewater containing the pharmaceuticals. The performance decreased to values below 30% efficiency because only the COD fraction corresponding to the particulate COD was removed. This behaviour is likewise observed in the BOD5 removal rate. Upon the addition of pharmaceutical dosages to the plant, the microbial activity becomes constrained, leading to a reduction in BOD5 removal efficiency to 21% during Phase 1 and 14% during Phase 2. As Phase 2 involves higher pharmaceutical dosages, the overall performance experiences a more significant decline when compared to Phase 1.
Figure 2 and Figure 3 show the results of the respirometric tests (exogenous respiration) performed for the two phases.
As seen in Figure 2, the amounts of the pharmaceuticals decreased during the respirometric tests, except during respirometric test 5 (Figure 2c), where it increased from 0.63 to 1.01 h. In general, the presence of this mixture of pharmaceuticals reduced the three maximum values of Rs (Figure 2b,d and Figure 3b), regardless of the pharmaceutical concentration and the method of compound addition (influent of the laboratory plant or in the respirometer), except for respirometric test 5 (Figure 2c).
Regarding endogenous respiration, the results of the respirometric tests performed for the two phases are shown in Figure 4 and Figure 5.
In Phase 1, the presence of pharmaceutical compounds did not produce a notable variation of the maximum static oxygen uptake rate (OURend) (Figure 4c,d), except for respirometric test 3 (Figure 4b), where a notable increase in this parameter was observed, with a change from 3.595 to 6.747 mg L−1 h−1. However, when the pharmaceutical concentration increased in Phase 2, a decrease in this parameter was observed (Figure 2b). This may have been caused by the effects of the pharmaceuticals on the heterotrophic biomass. Other authors studied the kinetic behaviour of MBR biomass against the compound erythromycin and found that the rates of oxygen consumption OUR and Rs decreased with increasing pharmaceutical concentration [39].
The variables Rs and OUR represented accelerated biochemical reactions. These trends were considered to evaluate the kinetic parameters, i.e., YH, µmax, KM, and bH. Table 5 shows the kinetic parameters obtained for the respirometries during the two phases.
In Phase 1, with a lower pharmaceutical concentration, YH increased by 8.78% from control respirometry 1 to 0.6353 mg VSS mgDQO−1 in respirometry 2. When performing the pharmaceutical shock in respirometry 3, the amount of the heterotrophic biomass produced by oxidised substrate increased by 4.93%. The performance of YH with pharmaceutical intrusion was stable in the tests where no heterotrophic biomass was destroyed (0.64 ± 0.02 mg VSS mgCOD−1) (respirometries 3, 5, 7, and 13), which indicates that there was no statistically significant difference among the yield coefficients of the heterotrophic biomass. Other authors obtained YH values close to those obtained in this study for a kinetic study of MBR without the presence of pharmaceuticals [40].
In Phase 2 tests with higher concentrations of pharmaceuticals, the control respirometric tests 10 and 12 presented approximate values.
However, when the pharmaceuticals were added (respirometry 11), the system was inhibited. Nevertheless, upon the addition of pharmaceutical compounds (respirometry 11), the system encountered inhibition. However, in respirometry 13, the heterotrophic biomass demonstrated activity, likely due to prolonged exposure to the pharmaceutical compounds. However, starting from day 24 in phase 2, the system reached a point where it could no longer effectively withstand the impact of the pharmaceutical compounds, resulting in the cessation of its activity.
The adaptation of the plant was considered good because the determined values of YH did not present drastic decreases. Furthermore, when assessing the effects of the various concentrations of the studied pharmaceuticals, it was observed that lower concentrations exhibited comparatively lesser impacts, as evidenced by respirometries 3 and 7. In contrast, higher concentrations appeared to exert a more pronounced effect leading to a decline in the YH values, although this was not significant.
The substrate degradation rate of organic matter removal rsu,H decreased with pharmaceutical compound addition by 82.23% in Phase 2 (respirometric test 13) compared with the control value (respirometric test 12). There was also a decrease of 60.46% in Phase 1 respirometry 5 compared to respirometry 4. Therefore, degradation was slower in the presence of erythromycin, ibuprofen, and diclofenac in both phases.
The rsu,H value reported for respirometry 3, with the addition of pharmaceuticals, can be explained by the evolution of the dynamic oxygen consumption rate; the duration of the respirometric test was short (0.2 h). When comparing the two phases, it was observed that the reduction in rsu,H in Phase 1, characterized by lower pharmaceutical concentrations, was comparatively smaller following doping in the respirometer. This finding suggests a more favourable adaptation of the biomass to the conditions in Phase 1. Other authors studied the effects of ibuprofen and other compounds, one of an antibiotic nature, such as erythromycin, on the heterotrophic biomass of an MBR, also obtaining decreasing rsu,H values in the presence of these compounds [41].
Concerning the maximum specific growth rate μmax, for the shock at a high concentration of pharmaceuticals (Phase 2), there was a decrease in this parameter (respirometries 10, 12, 13, and 14). However, comparing respirometric tests 12 and 14, with 0.0732 and 0.0090 h−1, respectively, reductions in the maximum specific growth rate were also observed (pharmaceuticals at these higher concentrations can considerably affect the heterotrophic biomass). At more moderate concentrations of pharmaceuticals, a decrease in μmax generally occurred from the third day of continuous doping onwards, reaching a value of 0.0101 h−1 at 17 days of doping (Phase 1, respirometry 6). Furthermore, in general, pharmaceutical shock also reduced the μmax value. For respirometries 1 and 2, the μmax decreased by 19.42%, from 0.0324 h−1 to 0.0272 h−1. When performing the pharmaceutical shock in respirometry 3, the maximum specific growth rate increased by 76.72%, reaching a value of 0.1167 h−1. In the subsequent respirometric tests 5 and 7, the μmax value decreased again due to the addition of the pharmaceuticals.
The maximum specific growth rate μmax followed a trend similar to that presented for rsu,H, decreasing with the addition of pharmaceuticals, irrespective of the concentration and except for respirometry 3. In general, it progressively decreased in the presence of a mixture of pharmaceuticals in the urban wastewater. Whilst a more pronounced decrease was observed for higher pharmaceutical concentrations (respirometries 12, 13, and 14), the decrease in μmax was less pronounced when the concentrations were lower.
Regarding the half-saturation coefficient of organic matter KM, the presence of pharmaceutical compounds caused a decrease in KM and a progressive decrease in the constant in both tests for pharmaceutical concentrations corresponding to Phases 1 and 2, except for the respirometry control test 6, where there was an increase in 73.19% compared to the control. This decrease was again more pronounced in the trials with high pharmaceutical concentrations in the MBR.
These findings suggest that the presence of the pharmaceutical mixture implied a lower half-saturation of organic matter in urban wastewater treatment in the MBR, with this effect being more noticeable for high pharmaceutical concentrations. This indicates that less available substrate was required to reach μmax, suggesting that the MBR was not inhibited by the substrate but by the mix of the pharmaceuticals.
In the Phase 1 tests, a decrease in bH was observed between respirometries 1 and 2, from 0.0725 to 0.0418 day−1, with a decrease in 73.60%. With respect to respirometry 3, when the pharmaceuticals were added to the respirometer, the bH increased by 48.42%, reaching a value of 0.0825 day−1. This increase would justify the decrease in MLSS from 5633.33 to 3200 mg L−1. When the pharmaceutical shock occurred in respirometry 5, the bH decreased by 4.82%. For respirometry 6, this trend was in line with a more pronounced reduction; immediately after the addition of the pharmaceuticals, it continued to decrease, reaching a value of 0.0346 day−1.
For Phase 2, in respirometries 10 and 12, the bH value decreased from 0.1701 to 0.1389 day−1 by 22.40% and by an additional 18.79% in the presence of pharmaceutical compounds in respirometry 13, reaching a value of 0.1170 day−1, although in experiment 14, a slight increase in the coefficient was observed. This might explain the decrease in MLSS from day 17 (2433.33 mg L−1) to day 24 (1433.33 mg L−1). Other authors reported decreases in bH values ranging from 24.76% to 66.51% in the kinetics of heterotrophic biomass in a membrane bioreactor against pharmaceutical compounds such as ciprofloxacin and carbamazepine [28]. Other authors conclude that heterotrophic biomass evolves and adapts to CECs at low concentrations [42], resulting in a kinetic response as in this study [43]. Consequently, it is of paramount importance to develop predictive models capable of mitigating elevated residual concentrations of pharmaceuticals prior to their discharge. This measure could effectively mitigate issues associated with the presence of pharmaceuticals compounds in WWTP and sludge-attaching compounds characterized by notably low biodegradability, such as diclofenac [16]. This proactive approach ensures proper treatment and prevents the release of these compounds into the environment.

4. Conclusions

In an MBR laboratory plant operating at an HRT of 24 h, fed with real urban wastewater, the heterotrophic biomass behaviour was analysed for two concentrations of the contaminants erythromycin, ibuprofen, and diclofenac. The concentrations studied for the first phase were erythromycin 0.576 mg L−1, ibuprofen 0.056 mg L−1, and diclofenac 0.948 mg L−1. For phase 2, the concentrations were increased to erythromycin 1.440 mg L−1, ibuprofen 0.140 mg L−1, and diclofenac 2.370 mg L−1. The conclusions were as follows:
-
Heterotrophic biomass was affected and inhibited by the presence of pharmaceutical drugs in both phases of the operation. The system response to low concentrations of pharmaceutical compounds occurred in the initial phase. However, after 22 days of doping, the system response was inhibited. At the highest concentrations of pharmaceuticals, the system was not able to react, and the response was not activated; activity was completely inhibited after 11 days of doping.
-
Under the operating conditions of this study, there was a gradual decrease in the concentration of MLSS (from 5633 to 2133 mg L−1 for Phase 1 and from 2400 to 500 mg L−1 for Phase 2) and in the removal of COD (from 87% to 28% in Phase 1 and from 65% to 20% in Phase 2) in the system as it was not able to absorb the effect produced by the pharmaceutical compounds added in both phases.
-
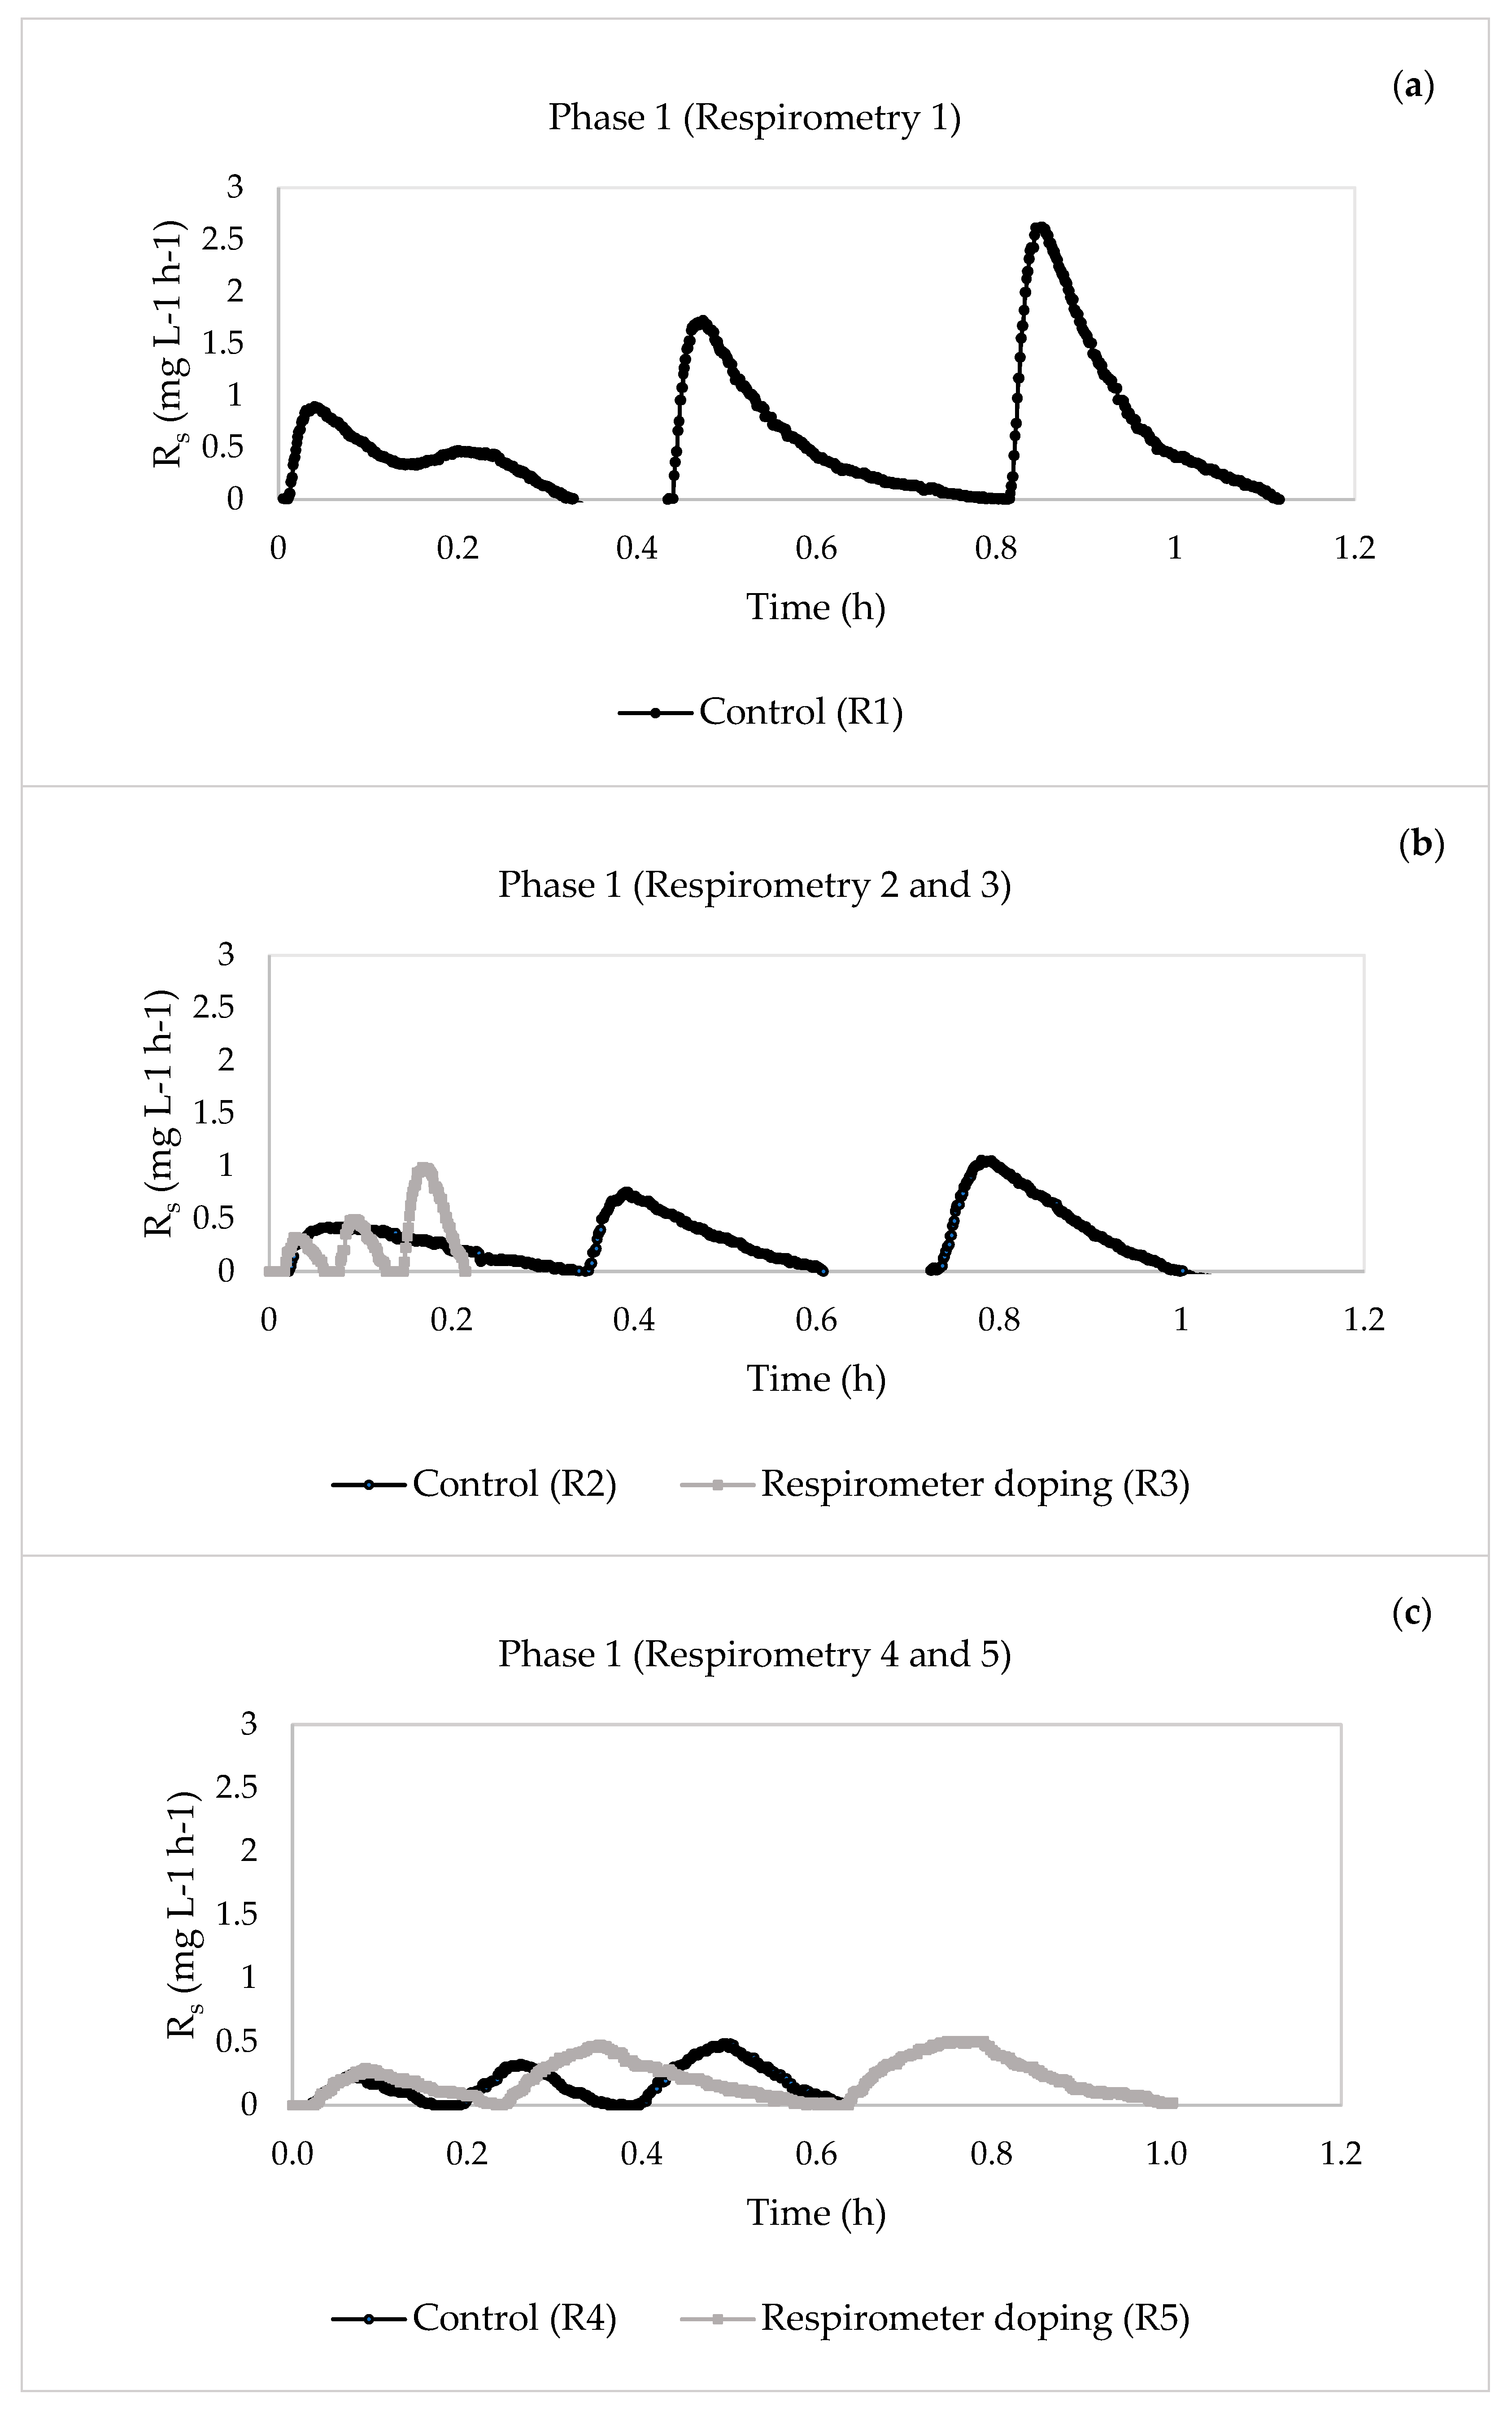
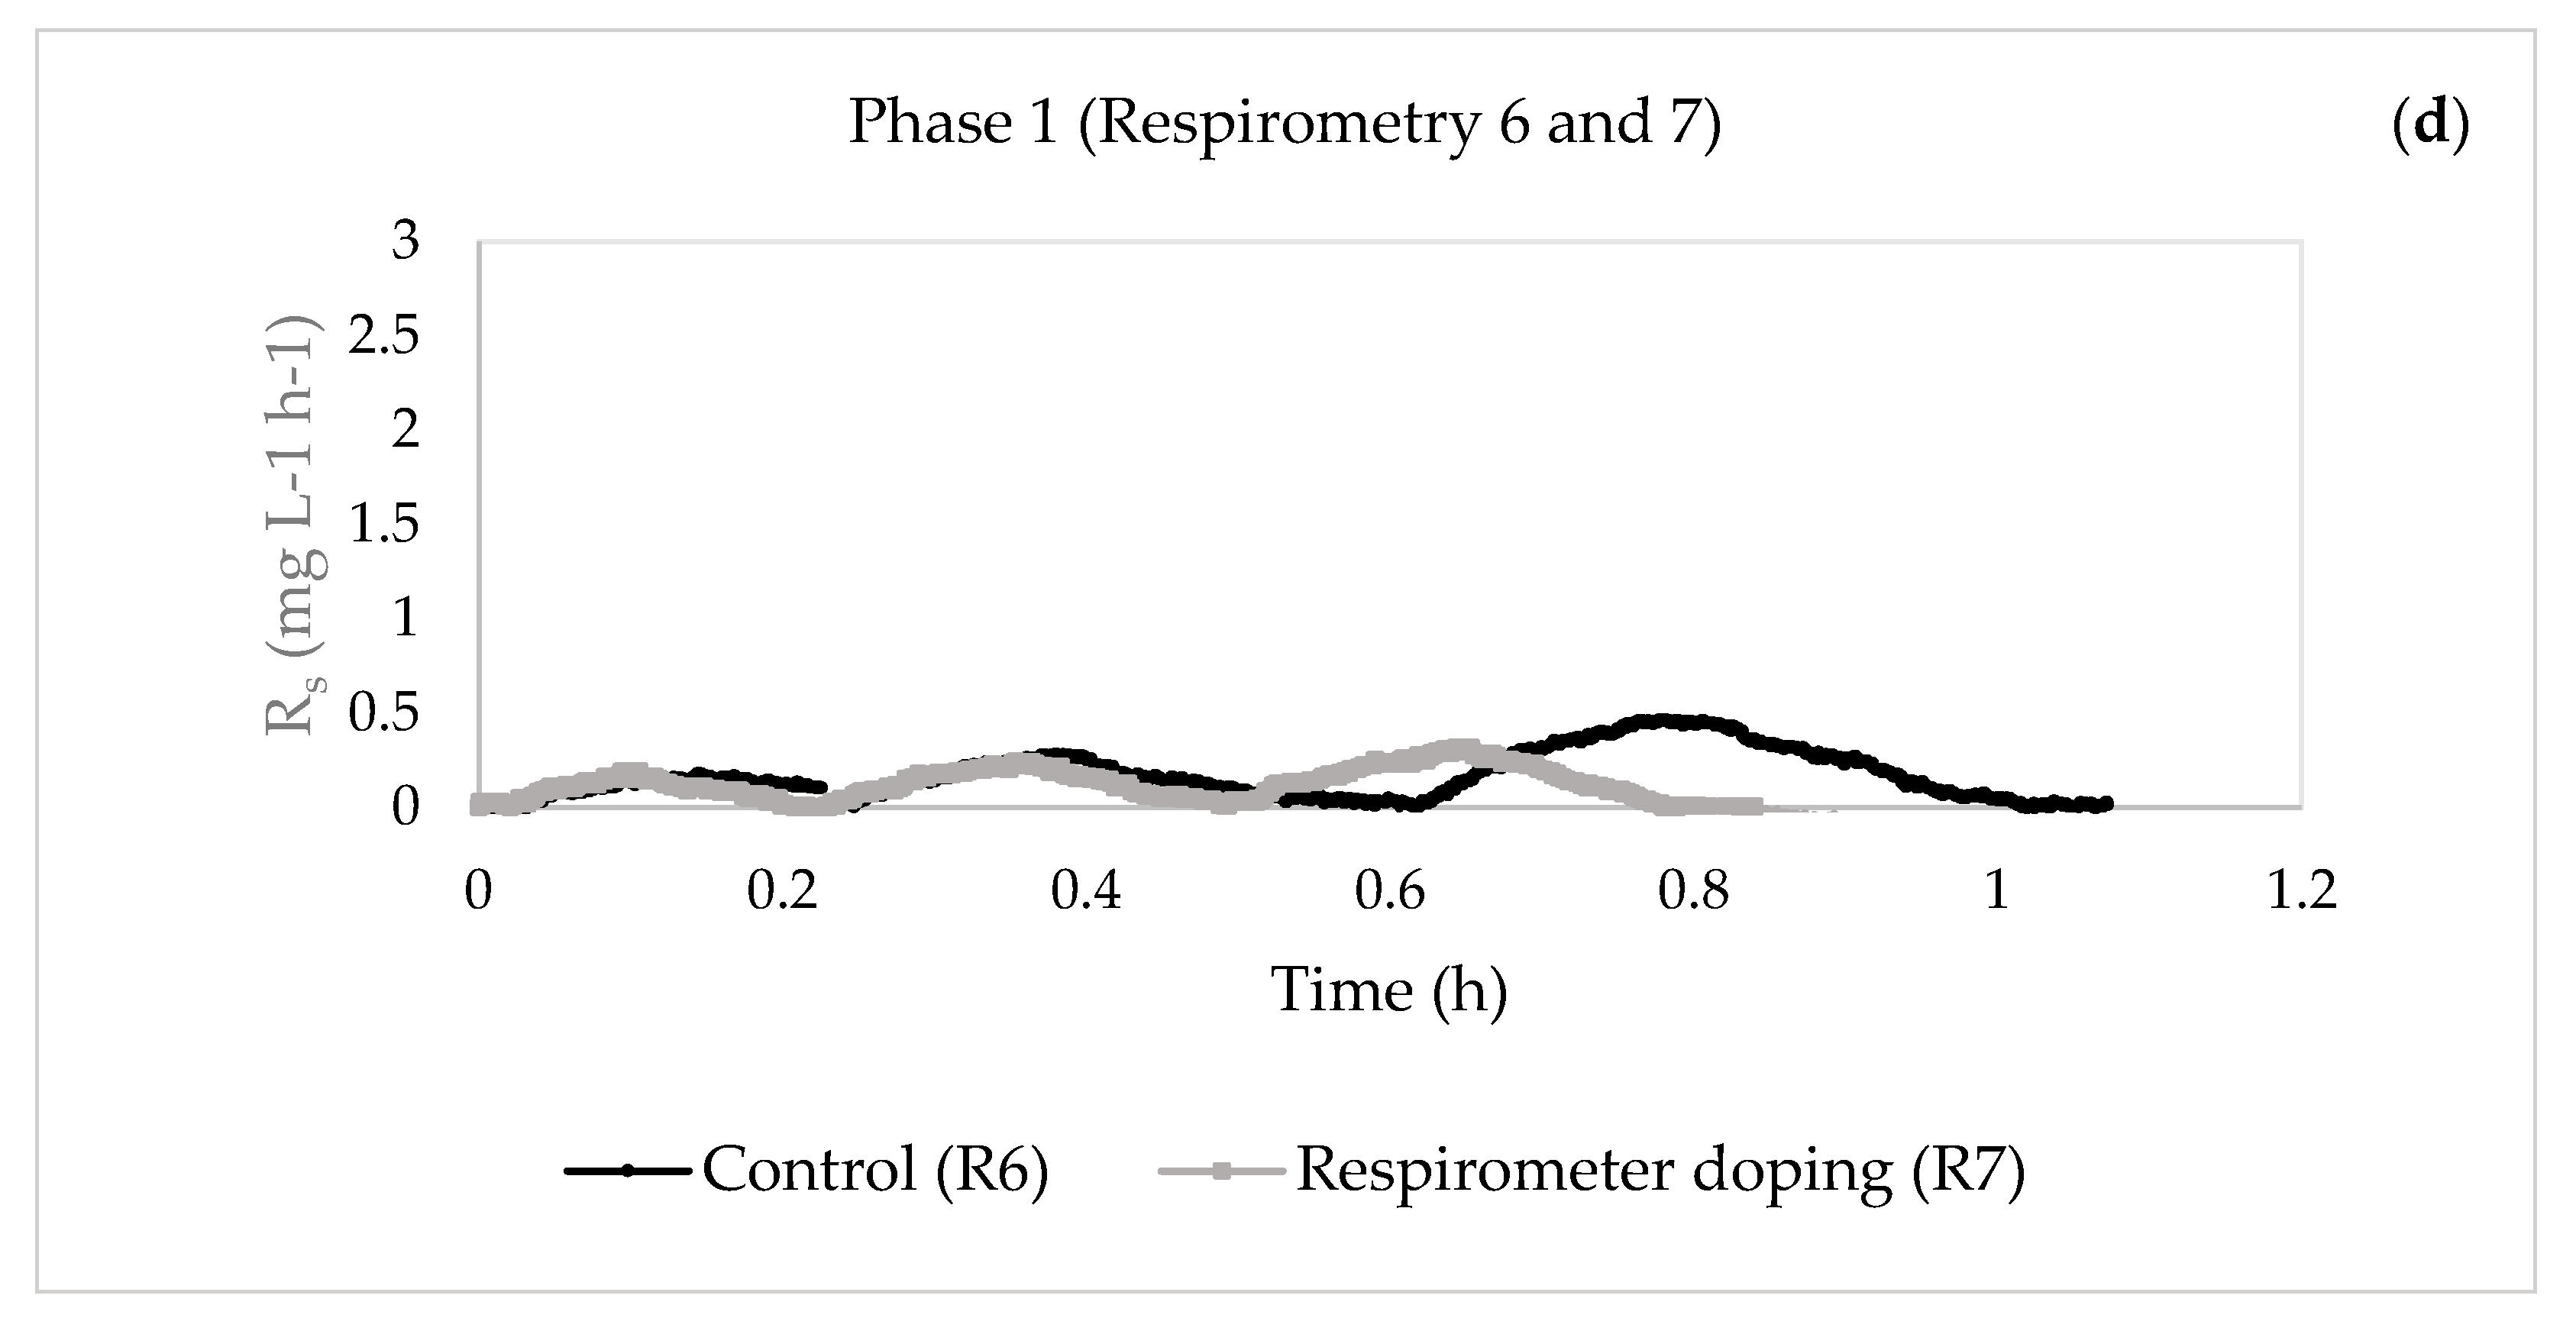
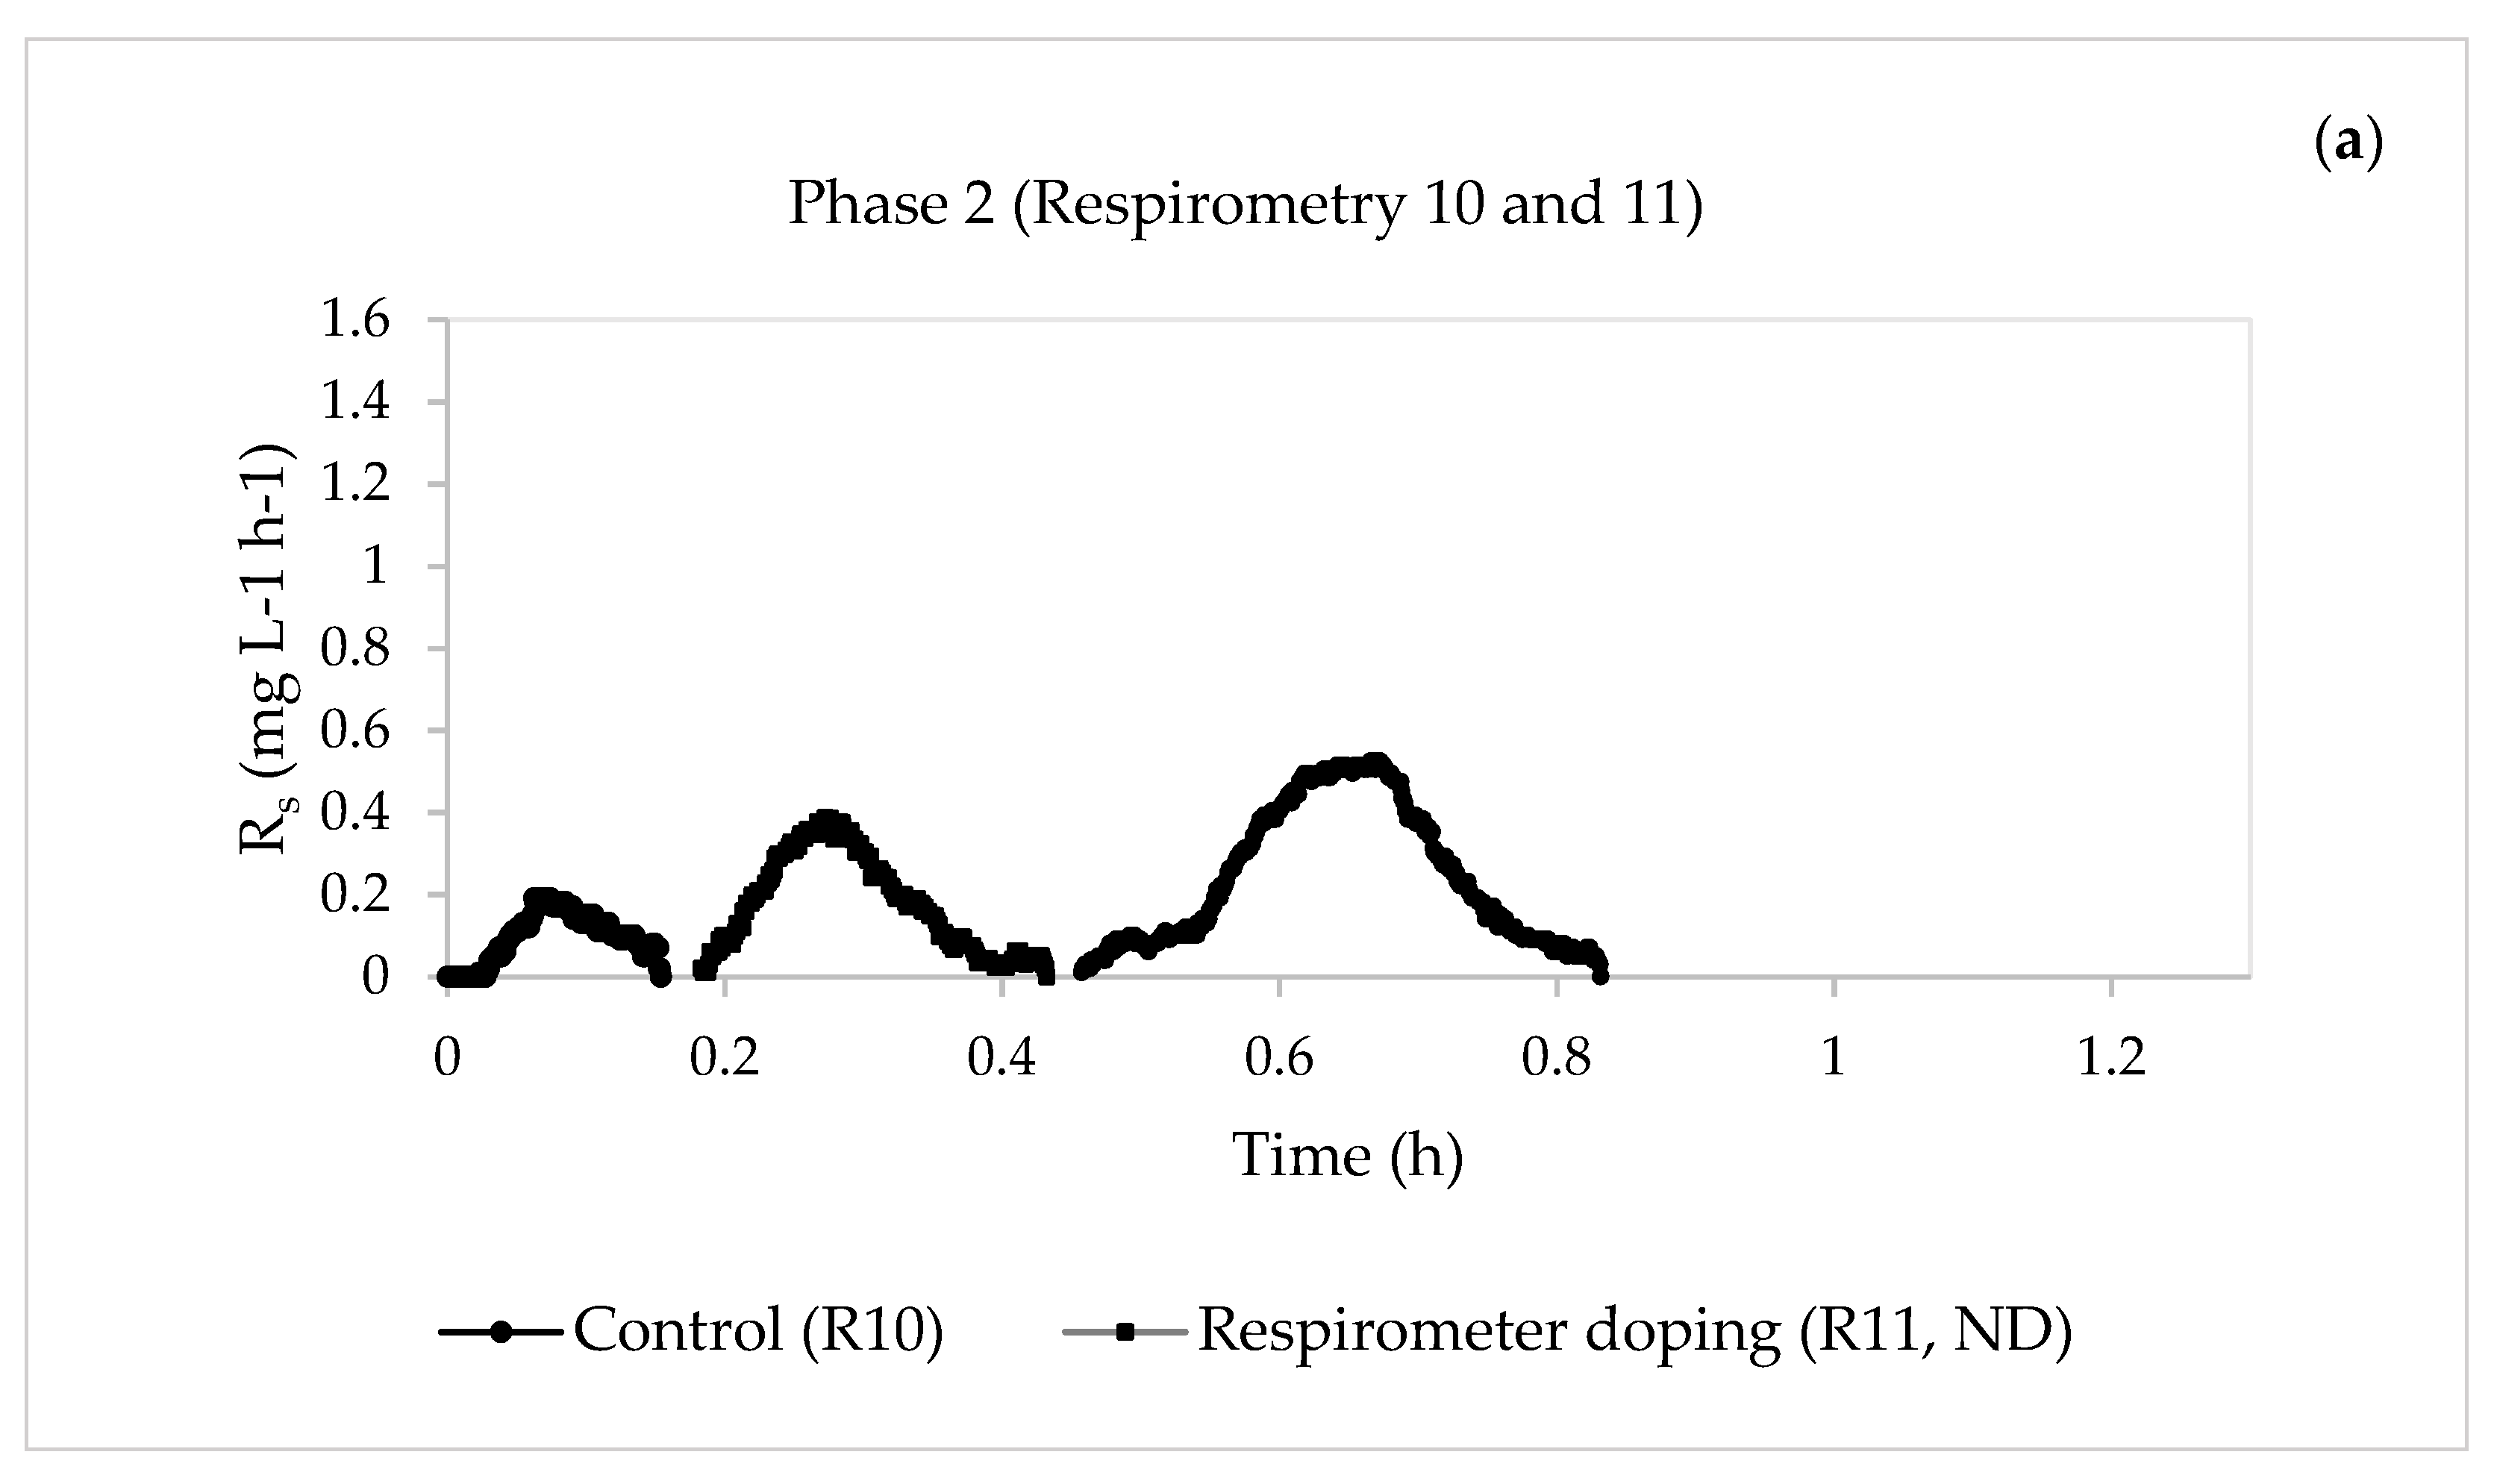
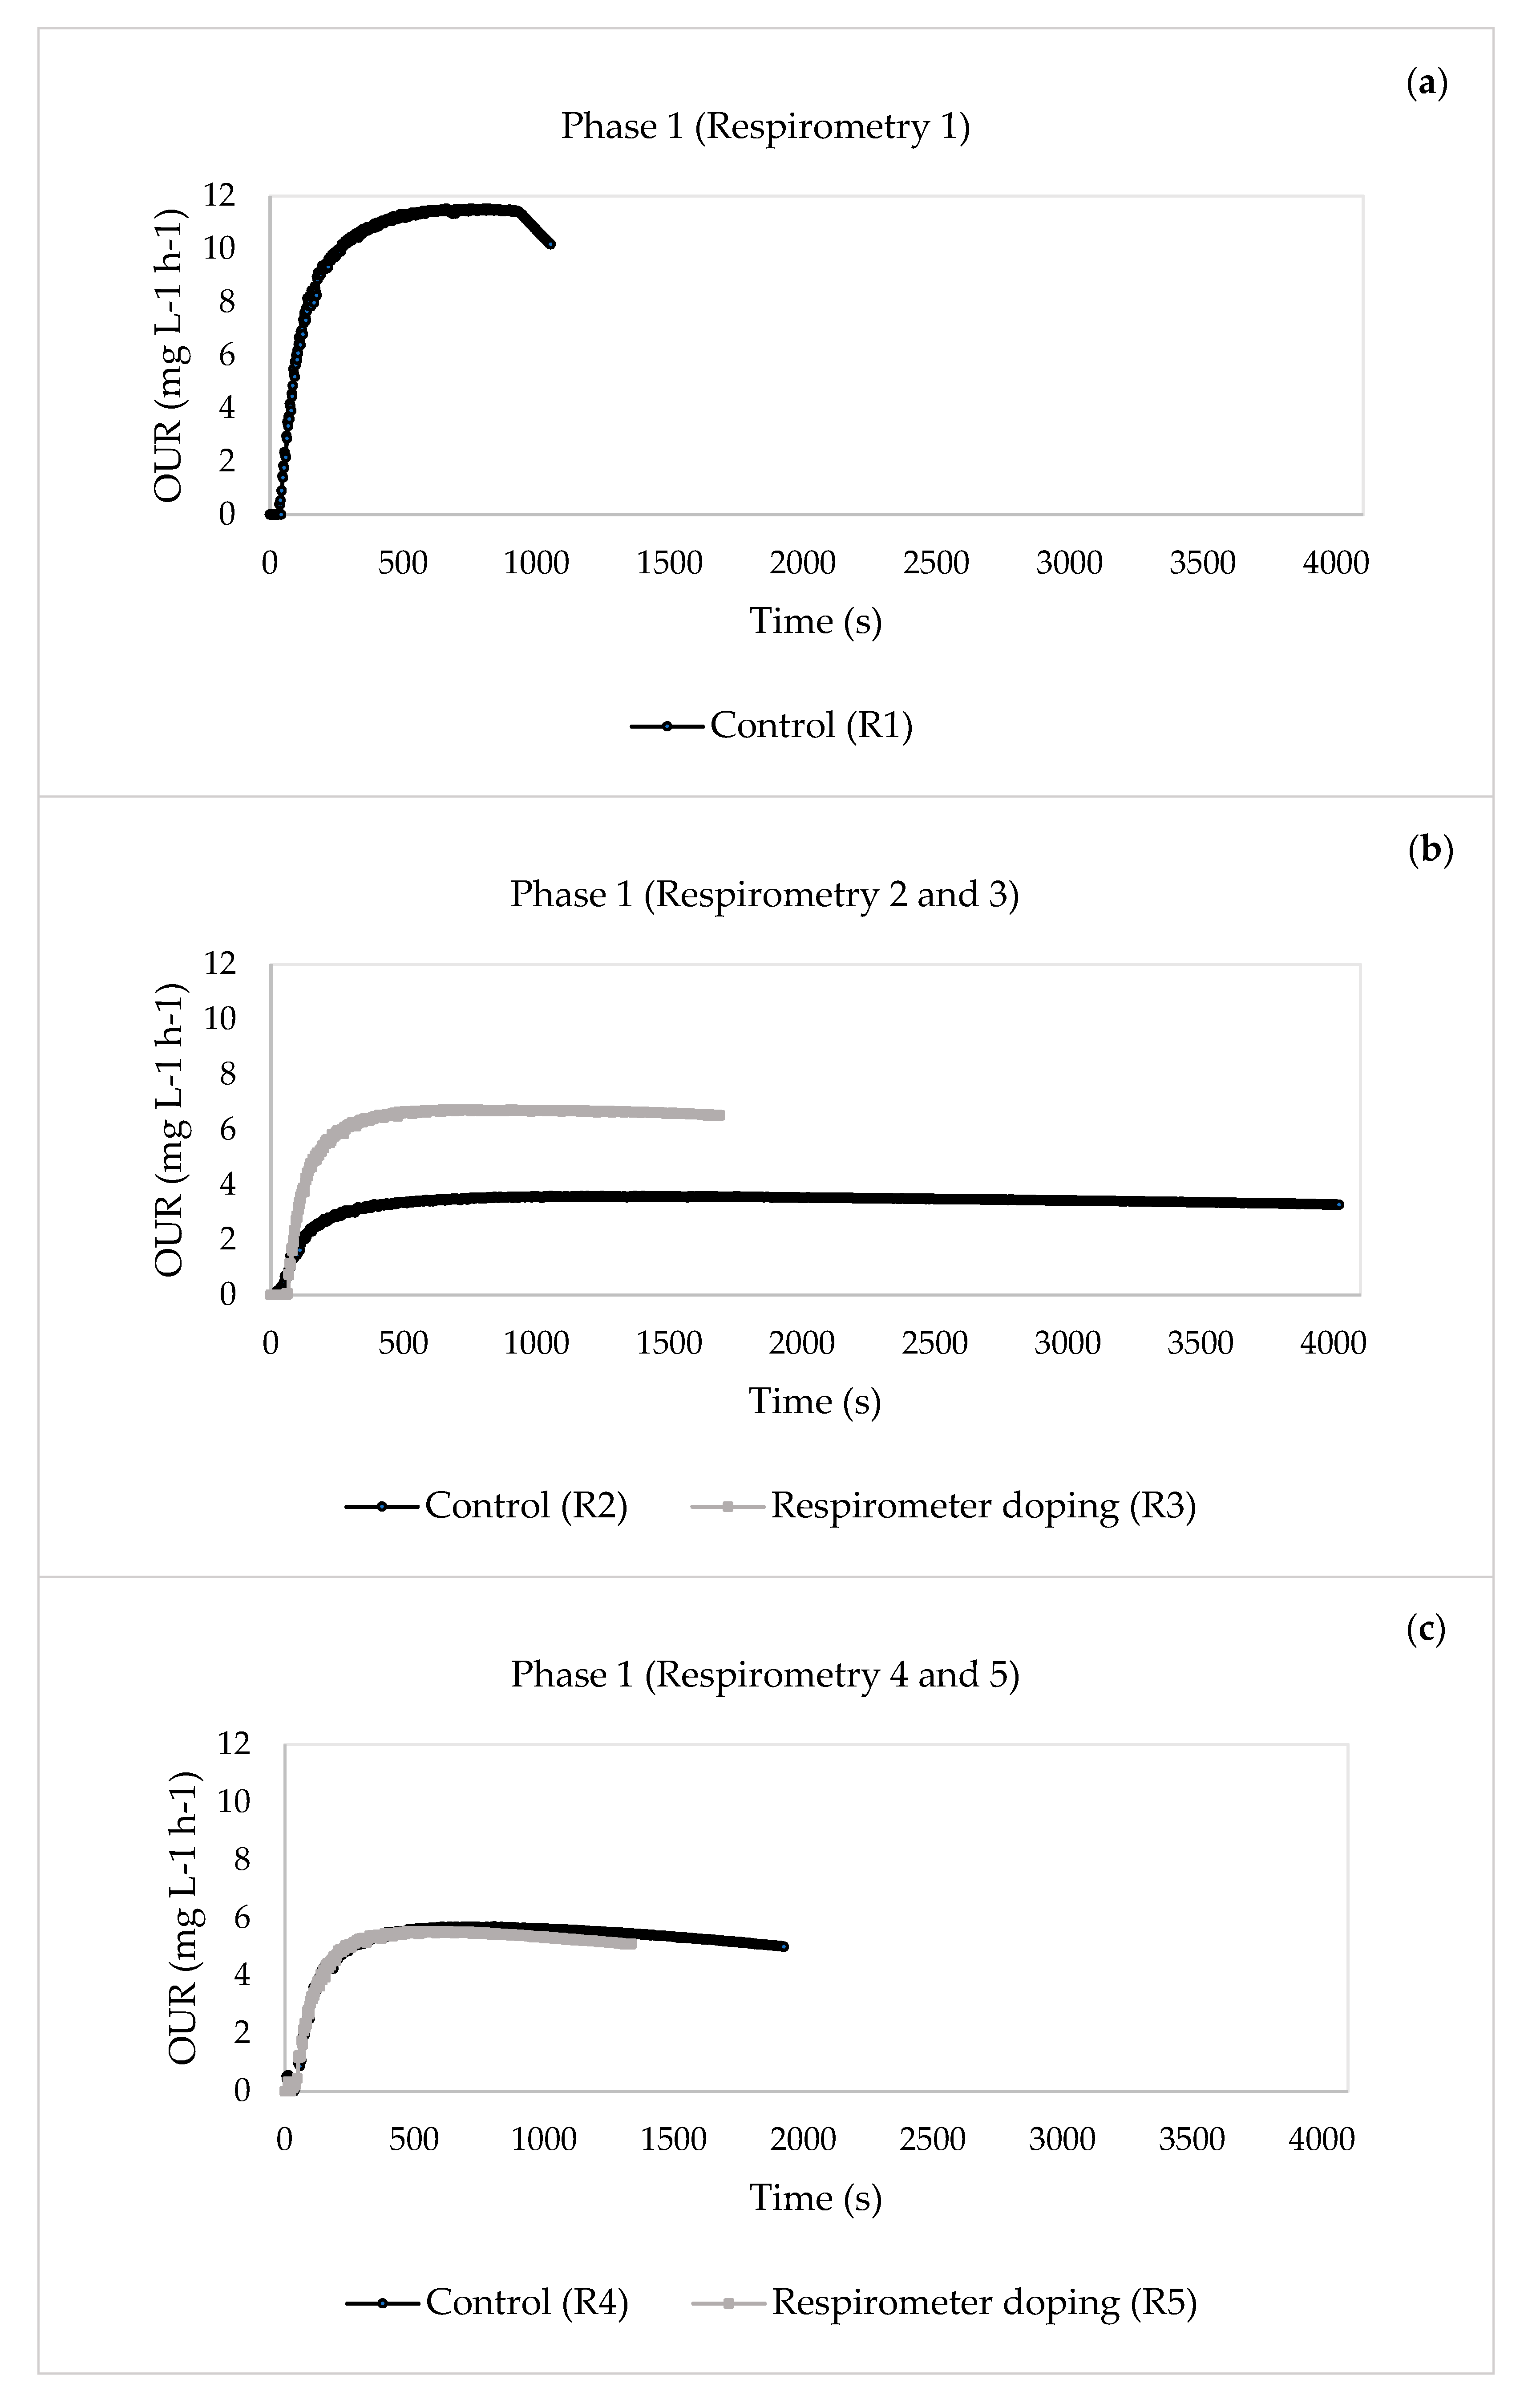
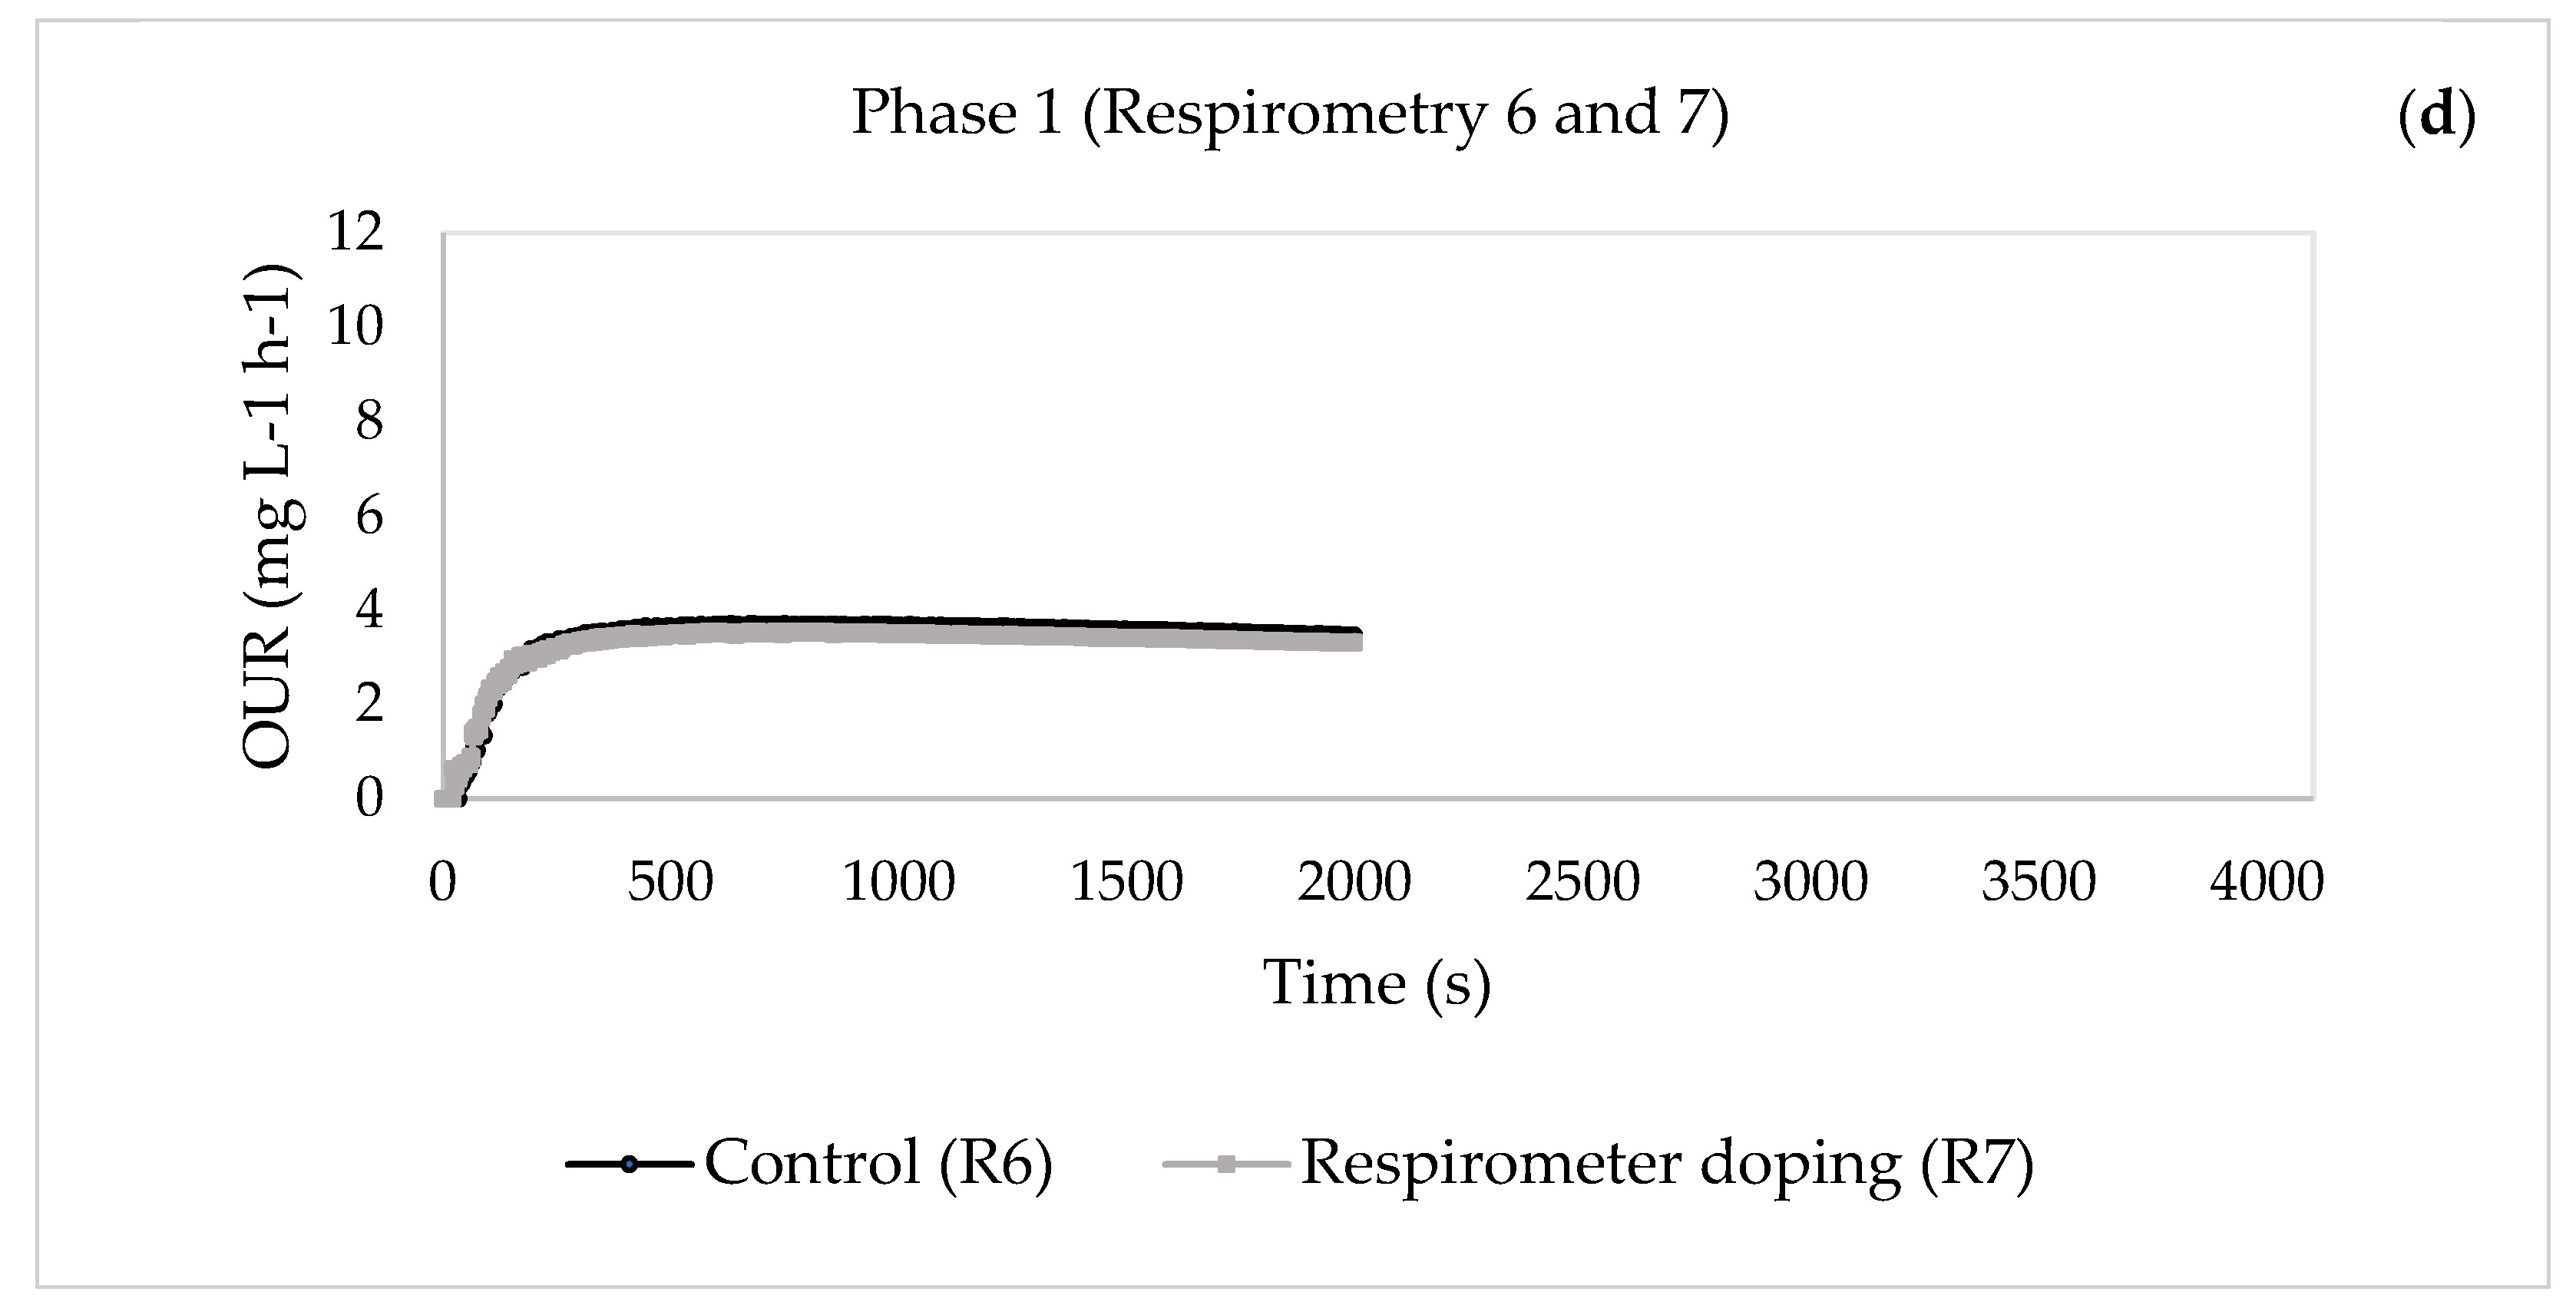
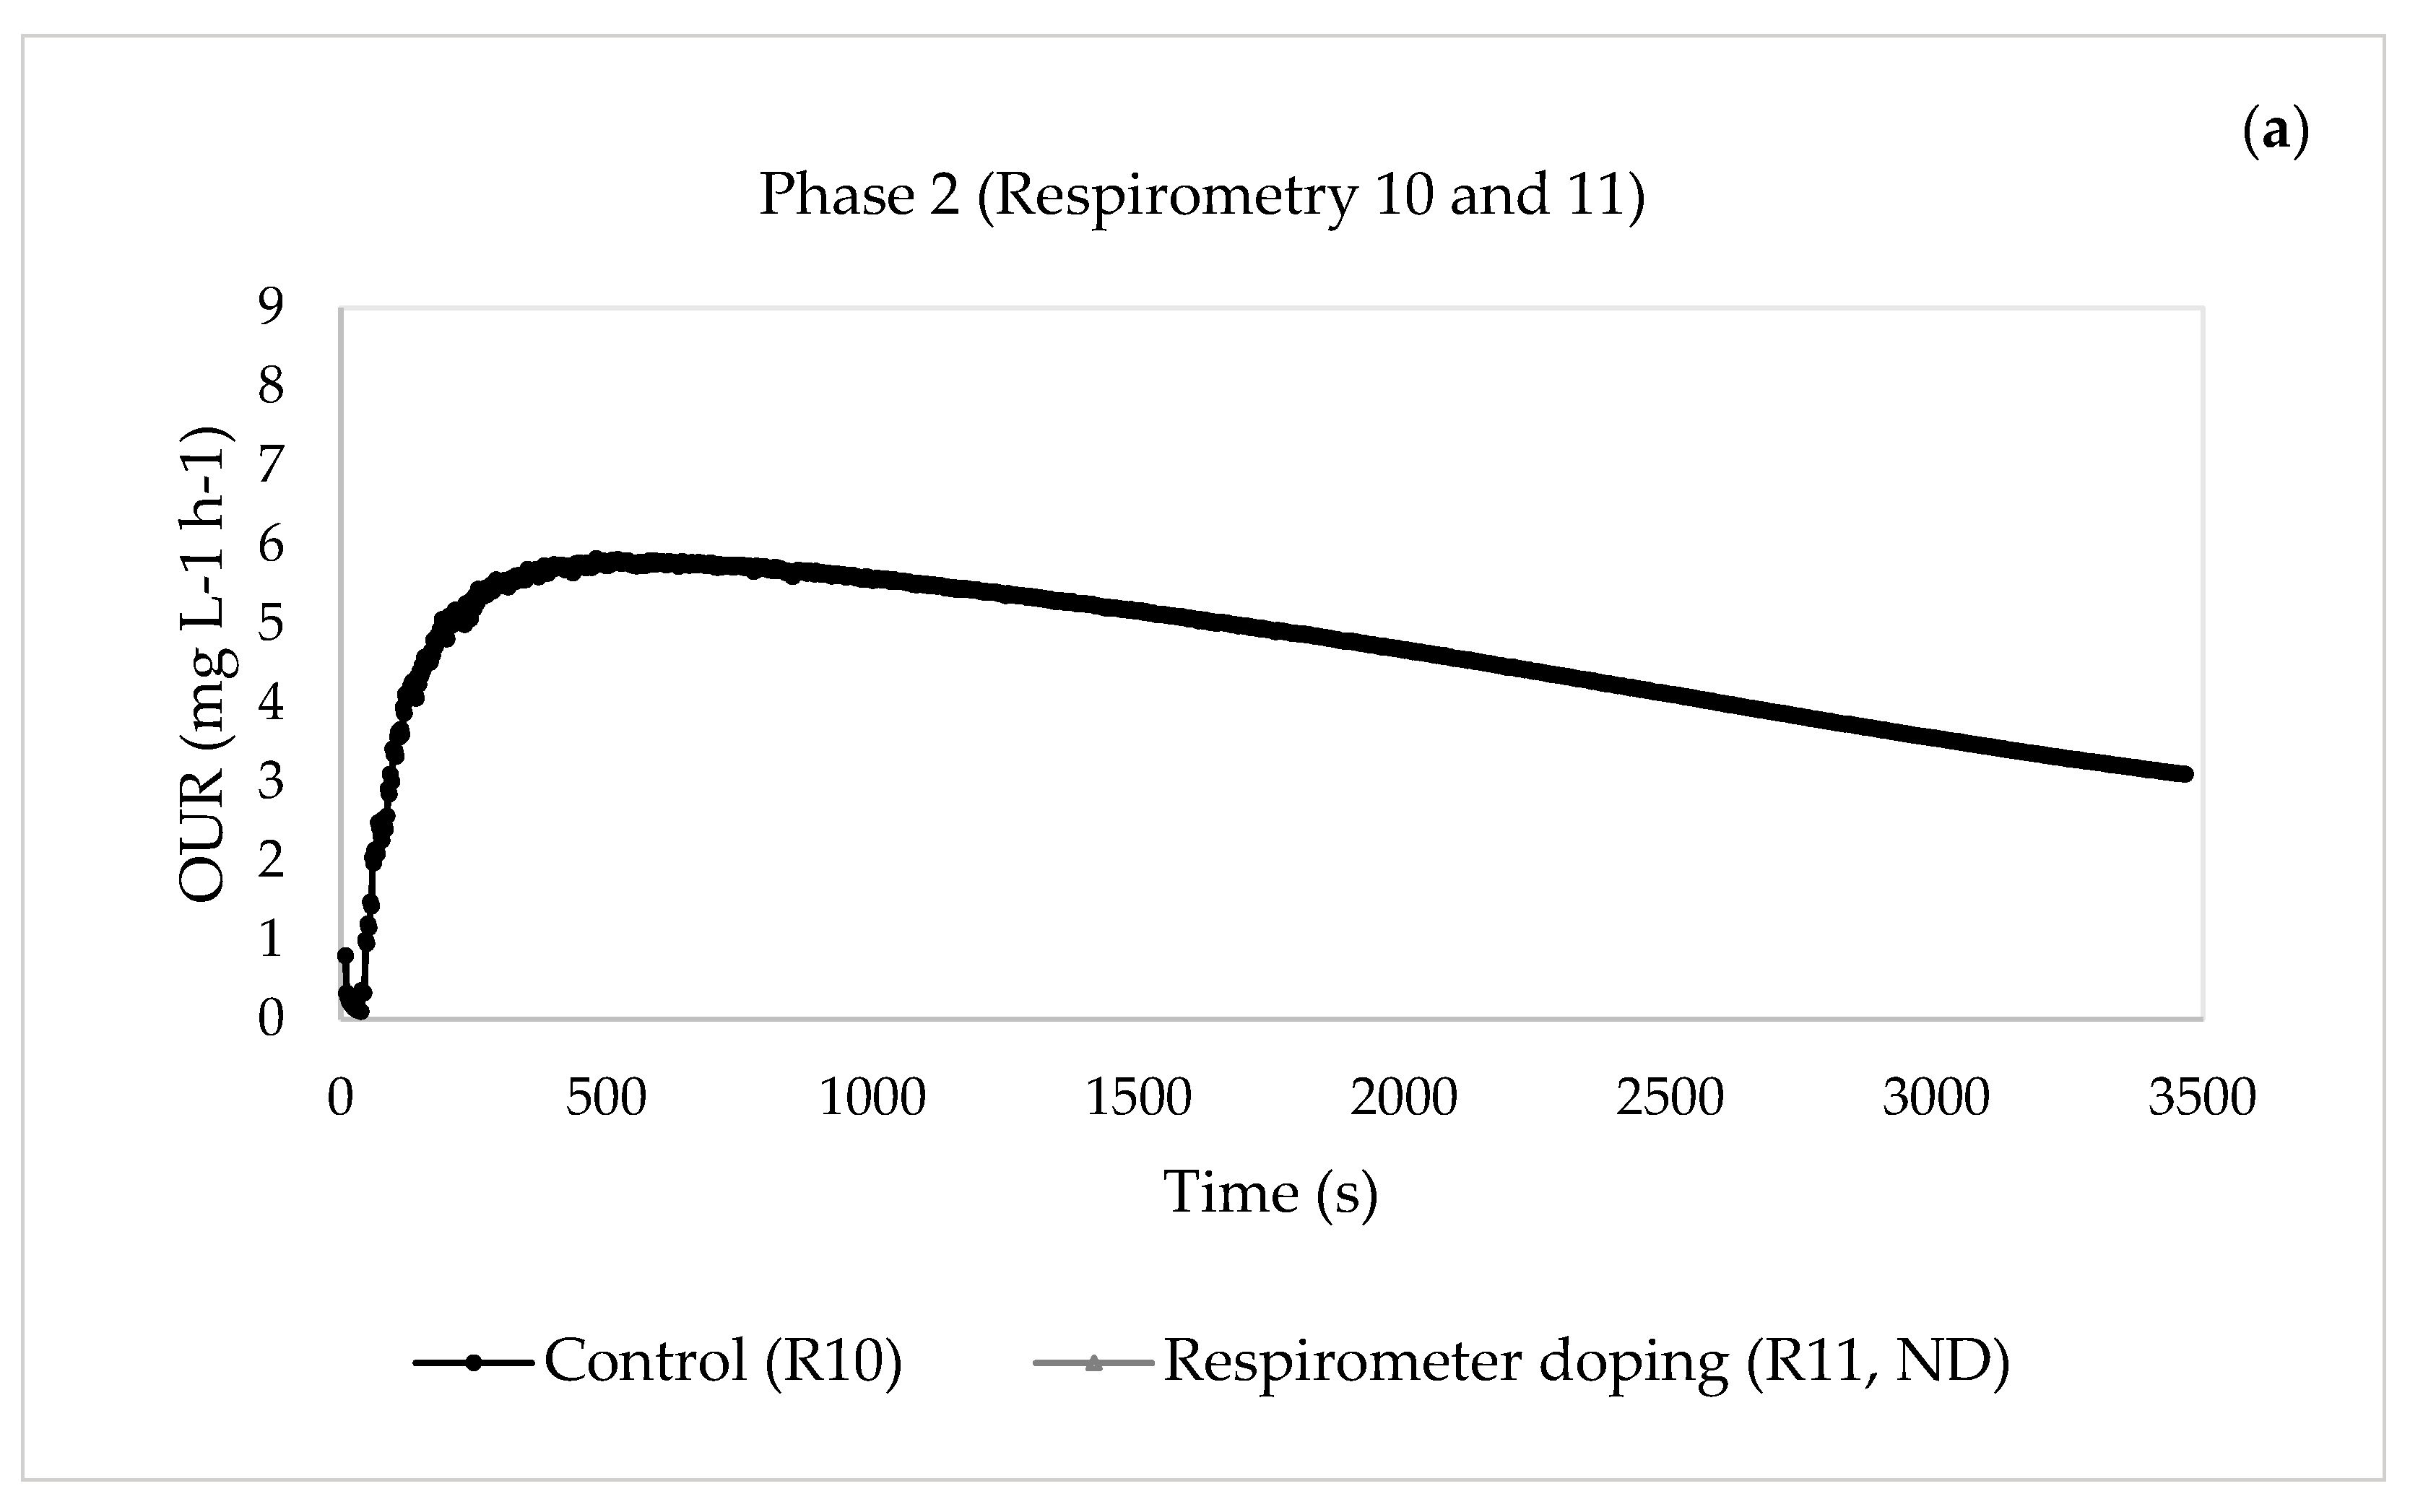
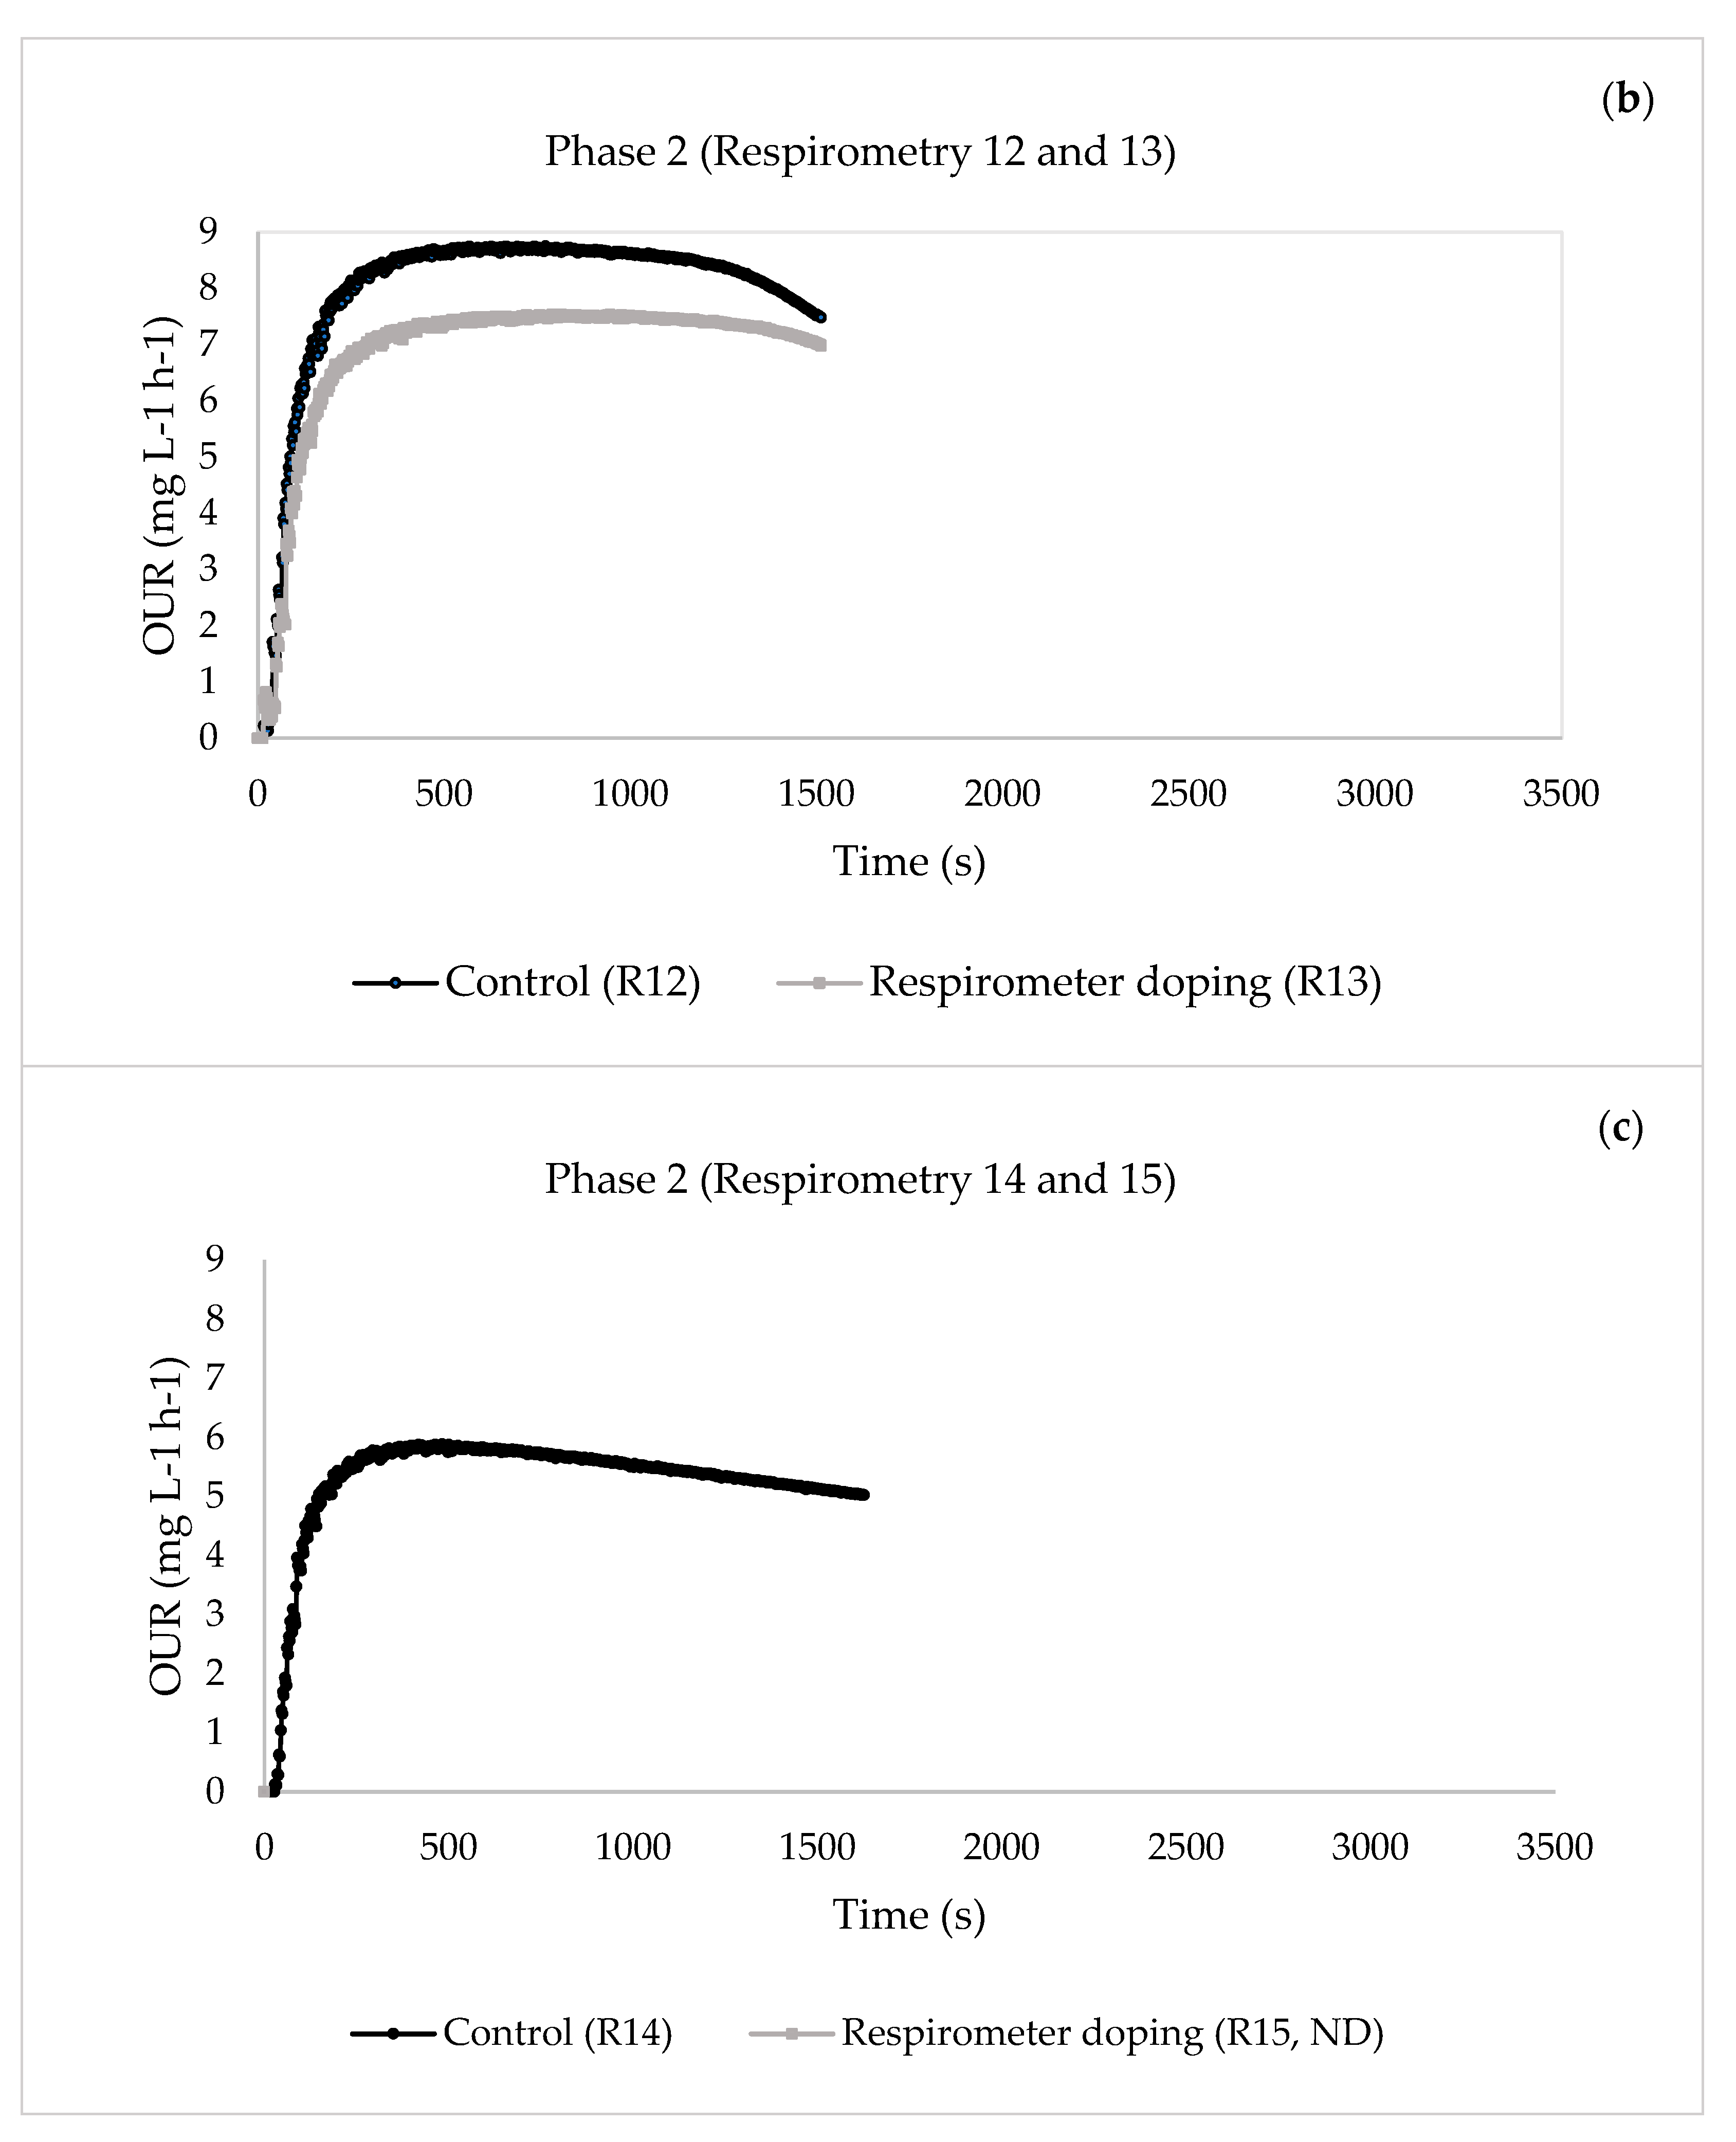
For Phase 1, when the concentrations of the pharmaceuticals were lower, the substrate degradation rate of organic matter removal rsu,H increased from 11.4626 to 44.7977 mg O2 L−1 h−1 after four days of continuous doping, indicating that the system could actively mitigate the impact of the pharmaceuticals. However, the value decreased from day 5 of doping until the system was inhibited. This inactivation of the heterotrophic biomass was seen in the reduction of the percentage of COD elimination, which decreased from an initial 92% to 28%. The same behaviour was observed for Phase 2, where inhibition of the system occurred earlier than in Phase 1 because the pharmaceutical compounds had a greater effect on the heterotrophic biomass due to their higher concentrations.
-
For future investigations, it is advisable to incorporate the assessment of the removal performance of the dosed pharmaceuticals in the laboratory plant, along with the monitoring of phosphorus in its different forms and nitrogen removal, as well as the corresponding related compounds. Such comprehensive analyses would contribute to a more comprehensive understanding of the overall treatment efficiency and environmental impact of the pharmaceutical compounds in the system.

Author Contributions

Conceptualization, J.M.P.C., M.d.M.M.M., J.M.P. and J.C.L.D.; methodology, J.M.P.C. and M.d.M.M.M.; validation, J.M.P., J.C.L.D. and M.d.M.M.M.; formal analysis, J.M.P., J.M.P.C., J.C.L.D., M.d.M.M.M., L.A.B. and E.M.M.S.; investigation, J.M.P.C., J.M.P., J.C.L.D., M.d.M.M.M., L.A.B. and E.M.M.S.; data curation, L.A.B. and E.M.M.S.; writing—original draft preparation, L.A.B. and E.M.M.S.; writing—review and editing, J.M.P.C., J.M.P., J.C.L.D., M.d.M.M.M., L.A.B. and E.M.M.S.; visualization, L.A.B. and E.M.M.S.; supervision, J.M.P.C., J.M.P., J.C.L.D. and M.d.M.M.M.; project administration, J.M.P.C. All authors have read and agreed to the published version of the manuscript.

Funding

This research received no external funding.

Institutional Review Board Statement

Not applicable.

Data Availability Statement

Not applicable.

Acknowledgments

Project PID2021-124740NB-I00 financed by MCIN/AEI/10.13039/501100011033/ and by FEDER A way of doing Europe.

Conflicts of Interest

The authors declare no conflict of interest. The funders had no role in the design of the study; in the collection, analyses, or interpretation of data; in the writing of the manuscript; or in the decision to publish the results.

References

  1. Mitra, D.; Zhou, C.; Bin Hashim, M.H.; Hang, T.M.; Gin, K.Y.-H.; Wang, C.-H.; Neoh, K.G. Emerging pharmaceutical and organic contaminants removal using carbonaceous waste from oil refineries. Chemosphere 2021, 271, 129542. [Google Scholar] [CrossRef] [PubMed]
  2. Samal, K.; Mahapatra, S.; Hibzur Ali, M. Pharmaceutical wastewater as Emerging Contaminants (EC): Treatment technologies, impact on environment and human health. Energy Nexus 2022, 6, 100076. [Google Scholar] [CrossRef]
  3. Ternes, T.A.; Stumpf, M.; Mueller, J.; Haberer, K.; Wilken, R.D.; Servos, M. Behavior and occurrence of estrogens in municipal sewage treatment plants—I. Investigations in Germany, Canada and Brazil. Sci. Total Environ. 1999, 225, 81–90. [Google Scholar] [CrossRef]
  4. Gros, M.; Petrovic, M.; Damia, B. Environmental Chemistry Wastewater Treatment Plants as a Pathway for Aquatic Contamination by Pharmaceuticals in the Ebro River Basin (Northeast Spain). Environ. Toxicol. Chem. 2007, 26, 1553–1562. [Google Scholar] [CrossRef] [PubMed]
  5. Patel, M.; Kumar, R.; Kishor, K.; Mlsna, T.; Pittman, C.U., Jr.; Mohan, D. Pharmaceuticals of Emerging Concern in Aquatic Systems: Chemistry, Occurrence, Effects, and Removal Methods Pharmaceuticals of Emerging Concern in Aquatic Systems: Chemistry, Occurrence, Effects, and Removal Methods. Chem. Rev. 2019, 119, 3510–3673. [Google Scholar] [CrossRef] [Green Version]
  6. Paz, A.; Tadmor, G.; Malchi, T.; Blotevogel, J.; Borch, T.; Polubesova, T.; Chefetz, B. Fate of carbamazepine, its metabolites, and lamotrigine in soils irrigated with reclaimed wastewater: Sorption, leaching and plant uptake. Chemosphere 2016, 160, 22–29. [Google Scholar] [CrossRef]
  7. Brown, K.D.; Kulis, J.; Thomson, B.; Chapman, T.H.; Mawhinney, D.B. Occurrence of antibiotics in hospital, residential, and dairy effluent, municipal wastewater, and the Rio Grande in New Mexico. Sci. Total Environ. 2006, 366, 772–783. [Google Scholar] [CrossRef]
  8. Bendz, D.; Paxéus, N.A.; Ginn, T.R.; Loge, F.J. Occurrence and fate of pharmaceutically active compounds in the environment, a case study: Höje River in Sweden. J. Hazard. Mater. 2005, 122, 195–204. [Google Scholar] [CrossRef]
  9. Vardanyan, R.S.; Hruby, V.J. Antibiotics. In Synthesis of Essential Drugs; Elsevier: Amsterdam, The Netherlands, 2006; pp. 425–498. [Google Scholar] [CrossRef]
  10. Kovalakova, P.; Cizmas, L.; McDonald, T.J.; Marsalek, B.; Feng, M.; Sharma, V.K. Occurrence and toxicity of antibiotics in the aquatic environment: A review. Chemosphere 2020, 251, 126351. [Google Scholar] [CrossRef]
  11. Gholamiyan, S.; Hamzehloo, M.; Farrokhnia, A. RSM optimized adsorptive removal of erythromycin using magnetic activated carbon: Adsorption isotherm, kinetic modeling and thermodynamic studies. Sustain. Chem. Pharm. 2020, 17, 100309. [Google Scholar] [CrossRef]
  12. Ping, Q.; Zhang, Z.; Ma, L.; Yan, T.; Wang, L.; Li, Y. The prevalence and removal of antibiotic resistance genes in full-scale wastewater treatment plants: Bacterial host, influencing factors and correlation with nitrogen metabolic pathway. Sci. Total Environ. 2022, 827, 154154. [Google Scholar] [CrossRef]
  13. Vieira, Y.; Pereira, H.A.; Leichtweis, J.; Mistura, C.M.; Foletto, E.L.; Oliveira, L.F.; Dotto, G.L. Effective treatment of hospital wastewater with high-concentration diclofenac and ibuprofen using a promising technology based on degradation reaction catalyzed by Fe0 under microwave irradiation. Sci. Total Environ. 2021, 783, 146991. [Google Scholar] [CrossRef] [PubMed]
  14. Tixier, C.; Singer, H.P.; Oellers, S.; Müller, S.R. Occurrence and Fate of Carbamazepine, Clofibric Acid, Diclofenac, Ibuprofen, Ketoprofen, and Naproxen in Surface Waters. Environ. Sci. Technol. 2003, 37, 1061–1068. [Google Scholar] [CrossRef] [PubMed]
  15. Chong, S.; Zhang, G.; Zhang, N.; Liu, Y.; Huang, T.; Chang, H. Diclofenac degradation in water by FeCeOx catalyzed H2O2: Influencing factors, mechanism and pathways. J. Hazard. Mater. 2017, 334, 150–159. [Google Scholar] [CrossRef] [PubMed]
  16. Zhang, Y.; Geißen, S.U.; Gal, C. Carbamazepine and diclofenac: Removal in wastewater treatment plants and occurrence in water bodies. Chemosphere 2008, 73, 1151–1161. [Google Scholar] [CrossRef]
  17. Alfonso-Muniozguren, P.; Serna-Galvis, E.A.; Bussemaker, M.; Torres-Palma, R.A.; Lee, J. A review on pharmaceuticals removal from waters by single and combined biological, membrane filtration and ultrasound systems. Ultrason. Sonochem. 2021, 76, 105656. [Google Scholar] [CrossRef]
  18. Ayyoub, H.; Kitanou, S.; Bachiri, B.; Tahaikt, M.; Taky, M.; Elmidaoui, A. Membrane bioreactor (MBR) performance in fish canning industrial wastewater treatment. Water Pract. Technol. 2022, 17, 1358–1368. [Google Scholar] [CrossRef]
  19. Nguyen, M.L.; Vo, T.-D.; Dat, N.D.; Nguyen, V.-T.; Tran, A.T.K.; Nguyen, P.-T.; Bui, X.-T. Performance of low flux sponge membrane bioreactor treating industrial wastewater for reuse purposes. Bioresour. Technol. Rep. 2023, 22, 101440. [Google Scholar] [CrossRef]
  20. Kim, M.J.; Sankararao, B.; Yoo, C.K. Determination of MBR fouling and chemical cleaning interval using statistical methods applied on dynamic index data. J. Membr. Sci. 2011, 375, 345–353. [Google Scholar] [CrossRef]
  21. Miura, Y.; Watanabe, Y.; Okabe, S. Membrane Biofouling in Pilot-Scale Membrane Bioreactors (MBRs) Treating Municipal Wastewater: Impact of Biofilm Formation. Environ. Sci. Technol. 2007, 41, 632–638. [Google Scholar] [CrossRef]
  22. Madan, R.; Madan, S.; Hussain, A. Kinetic Study for Startup of Aerobic Moving Bed Biofilm Reactor in Treatment of Textile Dye Wastewater. Appl. Biochem. Biotechnol. 2022. [Google Scholar] [CrossRef]
  23. Mannina, G.; Di Bella, G. Comparing two start-up strategies for MBRs: Experimental study and mathematical modelling. Biochem. Eng. J. 2012, 68, 91–103. [Google Scholar] [CrossRef]
  24. Cosenza, A.; Mannina, G.; Vanrolleghem, P.A.; Neumann, M.B. Global sensitivity analysis in wastewater applications: A comprehensive comparison of different methods. Environ. Model. Softw. 2013, 49, 40–52. [Google Scholar] [CrossRef]
  25. Trapani, D.D.; Mannina, G.; Viviani, G. Membrane Bioreactors for wastewater reuse: Respirometric assessment of biomass activity during a two year survey. J. Clean. Prod. 2018, 202, 311–320. [Google Scholar] [CrossRef]
  26. Tran, N.H.; Reinhard, M.; Gin, K.Y.H. Occurrence and fate of emerging contaminants in municipal wastewater treatment plants from different geographical regions-a review. Water Res. 2018, 133, 182–207. [Google Scholar] [CrossRef]
  27. Xu, H.; Deng, Y.; Li, M.; Zhang, K.; Zou, J.; Yang, Y.; Shi, P.; Feng, Y.; Hu, C.; Wang, Z. Removal of tetracycline in nitrification membrane bioreactors with different ammonia loading rates: Performance, metabolic pathway, and key contributors. Environ. Pollut. 2023, 332, 121922. [Google Scholar] [CrossRef] [PubMed]
  28. Antiñolo Bermúdez, L.; Martín-Luis, A.; Leyva Díaz, J.C.; Muñío Martínez, M.d.M.; Poyatos Capilla, J.M. Kinetic Effects of Ciprofloxacin, Carbamazepine, and Bisphenol on Biomass in Membrane Bioreactor System at Low Temperatures to Treat Urban Wastewater. Membranes 2023, 13, 419. [Google Scholar] [CrossRef]
  29. Metcalf, L.; Eddy, H.P.; Tchobanoglous, G. Wastewater Energy: Treatment and Reuse; McGraw-Hill: New York, NY, USA, 2004; Volume 1819. [Google Scholar]
  30. Leyva-Díaz, J.C.; Calderón, K.; Rodríguez, F.A.; González-López, J.; Hontoria, E.; Poyatos, J.M. Comparative kinetic study between moving bed biofilm reactor-membrane bioreactor and membrane bioreactor systems and their influence on organic matter and nutrients removal. Biochem. Eng. J. 2013, 77, 28–40. [Google Scholar] [CrossRef]
  31. Leyva-Díaz, J.C.; Martín-Pascual, J.; Poyatos, J.M. Moving bed biofilm reactor to treat wastewater. Int. J. Environ. Sci. Technol. 2016, 14, 881–910. [Google Scholar] [CrossRef]
  32. Leyva-Díaz, J.C.; Calero-Díaz, G.; López-López, C.; Martín-Pascual, J.; Torres, J.C.; Poyatos, J.M. Kinetic study of the effect of bisphenol A on the rates of organic matter removal, decay and biomass generation in a membrane bioreactor. Biochem. Eng. J. 2017, 128, 45–53. [Google Scholar] [CrossRef]
  33. Ma, Q.; Qu, Y.; Shen, W.; Zhang, Z.; Wang, J.; Liu, Z.; Li, D.; Li, H.; Zhou, J. Bacterial community compositions of coking wastewater treatment plants in steel industry revealed by Illumina high-throughput sequencing. Bioresour. Technol. 2015, 179, 436–443. [Google Scholar] [CrossRef]
  34. Cydzik-Kwiatkowska, A.; Zielińska, M. Bacterial communities in full-scale wastewater treatment systems. World J. Microbiol. Biotechnol. 2016, 32, 66. [Google Scholar] [CrossRef]
  35. Zhang, S.; Sheng, B.; Lin, W.; Meng, F. Day/night temperature differences (DNTD) trigger changes in nutrient removal and functional bacteria in membrane bioreactors. Sci. Total Environ. 2018, 636, 1202–1210. [Google Scholar] [CrossRef]
  36. Elnaker, N.A.; Elektorowicz, M.; Naddeo, V.; Hasan, S.W.; Yousef, A.F. Assessment of Microbial Community Structure and Function in Serially Passaged Wastewater Electro-Bioreactor Sludge: An Approach to Enhance Sludge Settleability. Sci. Rep. 2018, 8, 7013. [Google Scholar] [CrossRef]
  37. Wu, M.; Zhang, M.; Shen, L.; Wang, X.; Ying, D.; Lin, H.; Li, R.; Xu, Y.; Hong, H. High propensity of membrane fouling and the underlying mechanisms in a membrane bioreactor during occurrence of sludge bulking. Water Res. 2023, 229, 119456. [Google Scholar] [CrossRef]
  38. Martins, A.M.P.; Pagilla, K.; Heijnen, J.J.; Van Loosdrecht, M.C.M. Filamentous bulking sludge—A critical review. Water Res. 2004, 38, 793–817. [Google Scholar] [CrossRef]
  39. Aghili Dehnavi, H.; Amin, M.M.; Fatehizadeh, A.; Movahedian Attar, H.; Ebrahimpour, K.; Bina, B. Assessment of toxicity and kinetic effects of erythromycin on activated sludge consortium by fast respirometry method. Environ. Health Eng. Manag. J. 2021, 8, 205–214. [Google Scholar] [CrossRef]
  40. Xue, T.; Yu, K.-C.; Guan, J.; Huang, X.; Wen, X.-H.; Miao, X.-N.; Cui, Z.-G. Determination of kinetic parameters of activated sludge in an MBR wastewater treatment plant. Huanjing Kexue/Environ. Sci. 2011, 32, 1027–1033. [Google Scholar]
  41. Monteoliva-García, A.; Leyva-Díaz, J.C.; López-López, C.; Poyatos, J.M.; del Mar Muñío, M.; Martín-Pascual, J. Heterotrophic Kinetic Study and Nitrogen Removal of a Membrane Bioreactor System Treating Real Urban Wastewater under a Pharmaceutical Compounds Shock: Effect of the Operative Variables. Water 2019, 11, 1785. [Google Scholar] [CrossRef] [Green Version]
  42. Majewsky, M.; Gallé, T.; Yargeau, V.; Fischer, K. Active heterotrophic biomass and sludge retention time (SRT) as determining factors for biodegradation kinetics of pharmaceuticals in activated sludge. Bioresour. Technol. 2011, 102, 7415–7421. [Google Scholar] [CrossRef] [Green Version]
  43. Kraigher, B.; Kosjek, T.; Heath, E.; Kompare, B.; Mandic-Mulec, I. Influence of pharmaceutical residues on the structure of activated sludge bacterial communities in wastewater treatment bioreactors. Water Res. 2008, 42, 4578–4588. [Google Scholar] [CrossRef]
Figure 1. Flowchart of the implemented membrane bioreactor (MBR) system.
Membranes 13 00697 g001
Figure 2. Evolution of the dynamic oxygen uptake rate (Rs) in the respirometric experiments in Phase 1. (a) Phase 1: control (respirometric test 1). (b) Phase 1: control (respirometric test 2) and pharmaceutical compound addition in the respirometer (respirometric test 3). (c) Phase 1: control (respirometric test 4) and pharmaceutical compound addition in the respirometer (respirometric test 5). (d) Phase 1: control (respirometric test 6) and pharmaceutical compound addition in the respirometer (respirometric test 7).
Membranes 13 00697 g002aMembranes 13 00697 g002b
Figure 3. Evolution of the dynamic oxygen uptake rate (Rs) in the respirometric experiments in Phase 2. (a) Phase 2: control (respirometric test 10) and pharmaceutical compound addition in the respirometer (respirometric test 11, not detected). (b) Phase 2: control (respirometric test 12) and pharmaceutical compound addition in the respirometer (respirometric test 13). (c) Phase 2: control (respirometric test 14) and pharmaceutical compound addition in the respirometer (respirometric test 15, not detected).
Membranes 13 00697 g003aMembranes 13 00697 g003b
Figure 4. Evolution of the static oxygen uptake rate (OUR) in the respirometric experiments in Phase 1. (a) Phase 1: control (respirometric test 1). (b) Phase 1: control (respirometric test 2) and pharmaceutical compound addition in the respirometer (respirometric test 3). (c) Phase 1: control (respirometric test 4) and pharmaceutical compound addition in the respirometer (respirometric test 5). (d) Phase 1: control (respirometric test 6) and pharmaceutical compound addition in the respirometer (respirometric test 7).
Membranes 13 00697 g004aMembranes 13 00697 g004b
Figure 5. Evolution of the static oxygen uptake rate (OUR) in the respirometric experiments in Phase 2. (a) Phase 2: control (respirometric test 10) and pharmaceutical compound addition in the respirometer (respirometric test 11, not detected). (b) Phase 2: control (respirometric test 12) and pharmaceutical compound addition in the respirometer (respirometric test 13). (c) Phase 2: control (respirometric test 14) and pharmaceutical compound addition in the respirometer (respirometric test 15, not detected).
Membranes 13 00697 g005aMembranes 13 00697 g005b
Table 1. Concentrations of pharmaceuticals in both operation phases.
PharmaceuticalPhase 1 (mg L−1)Phase 2 (mg L−1)
Erythromycin0.5761.440
Diclofenac0.9482.370
Ibuprofen0.0560.140
Table 2. Permeability working values. TMP: transmembrane pressure.
Pressure
(bar)
∆TMPPermeability (m3/(m2 h bar))Permeability (L/(m2 h bar))
Phase 1Day
0–15
Suction0.080.930.0020392.04
Backwashing0.200.800.0023582.36
Day
16–35
Suction0.280.730.0026022.60
Backwashing0.200.800.0023582.36
Phase 2Day
0–15
Suction0.100.900.0013951.39
Backwashing0.300.700.0017931.79
Day
16–35
Suction0.050.950.0013211.32
Backwashing0.250.750.0016741.67
Table 3. Respirometric tests corresponding to Phases 1 and 2.
PhaseOperation Time (Day)Respirometric Test
1131—Control
172—Control
3—Respirometer doping
234—Control
5—Respirometer doping
306—Control
7—Respirometer doping
358—Control
9—Respirometer doping
21310—Control
11—Respirometer doping
1712—Control
13—Respirometer doping
2414—Control
15—Respirometer doping
3516—Control
17—Respirometer doping
Table 4. Water characterisation and organic matter removal. MLSS: mixed liquor suspended solids; COD: chemical oxygen demand.
PhaseDayMLSS
(mg/L)
COD
Influent
(mgO2/L)
COD
Removal
(%)
BOD5
Removal
(%)
pH
Influent
pH
Effluent
pH
Bioreactor
Conductivity
Influent
(µS/cm)
Conductivity
Effluent
(µS/cm)
Conductivity
Bioreactor
(µS/cm)
10–125394 ± 421483 ± 2292 ± 291 ± 1 7.86 ± 0.087.72 ± 0.327.63 ± 0.411306 ± 501223 ± 781295 ± 73
13563354987828.028.017.78148511381172
17320030681798.018.247.91150313701445
23390010080657.548.536.96151716011292
30393332966567.748.386.49137813641200
35213332328218.006.636.97131012871291
20–125145 ± 1286434 ± 872 ± 365 ± 47.70 ± 0.207.82 ± 0.697.7 ± 0.75791 ± 52662 ± 57705 ± 47
13240052465577.847.267.001071732826
17243353452448.067.908.15141012421268
20123334936298.316.786.93123910021016
22196730921158.215.886.311225966977
24143349622148.116.006.741174936968
3550042020147.387.258.26140810851220
Table 5. Kinetic parameters of the heterotrophic biomass. YH: yield coefficient of heterotrophic biomass; µmax: maximum specific growth rate of heterotrophic biomass; KM: half-saturation coefficient of organic matter (KM); bH: decay coefficient of heterotrophic biomass; rsu,H: substrate degradation rate of organic matter removal.
PhaseOperation Time
(Day)
Respirometric TestYH
(mgVSS/mgO2)
μmax
(h−1)
KM
(mgO2/L)
bH
(day−1)
rsu,H
(mgO2/Lh)
1131—Control0.59070.032420.55600.072511.4626
172—Control0.63530.027211.62920.041810.8555
3—Respirometer doping0.66830.116711.41020.082544.7977
234—Control0.65850.00901.50890.047512.7022
5—Respirometer doping0.64150.00521.37990.04537.9161
306—Control0.65410.01015.62850.03578.3688
7—Respirometer doping0.66240.00541.10720.034612.2834
358—ControlNDNDNDNDND
9—Respirometer dopingNDNDNDNDND
21310—Control0.66200.249238.99450.170115.3234
11—Respirometer dopingNDNDNDNDND
1712—Control0.64130.073213.96640.138917.4938
13—Respirometer doping0.62700.01524.63790.11709.5998
2414—Control0.64230.00901.00640.14115.5038
15—Respirometer dopingNDNDNDNDND
3516—ControlNDNDNDNDND
17—Respirometer dopingNDNDNDNDND
ND: not detected.
Disclaimer/Publisher’s Note: The statements, opinions and data contained in all publications are solely those of the individual author(s) and contributor(s) and not of MDPI and/or the editor(s). MDPI and/or the editor(s) disclaim responsibility for any injury to people or property resulting from any ideas, methods, instructions or products referred to in the content.

