
Boosting Power Density of Proton Exchange Membrane Fuel Cell Using Artificial Intelligence and Optimization Algorithms


Abstract
:1. Introduction
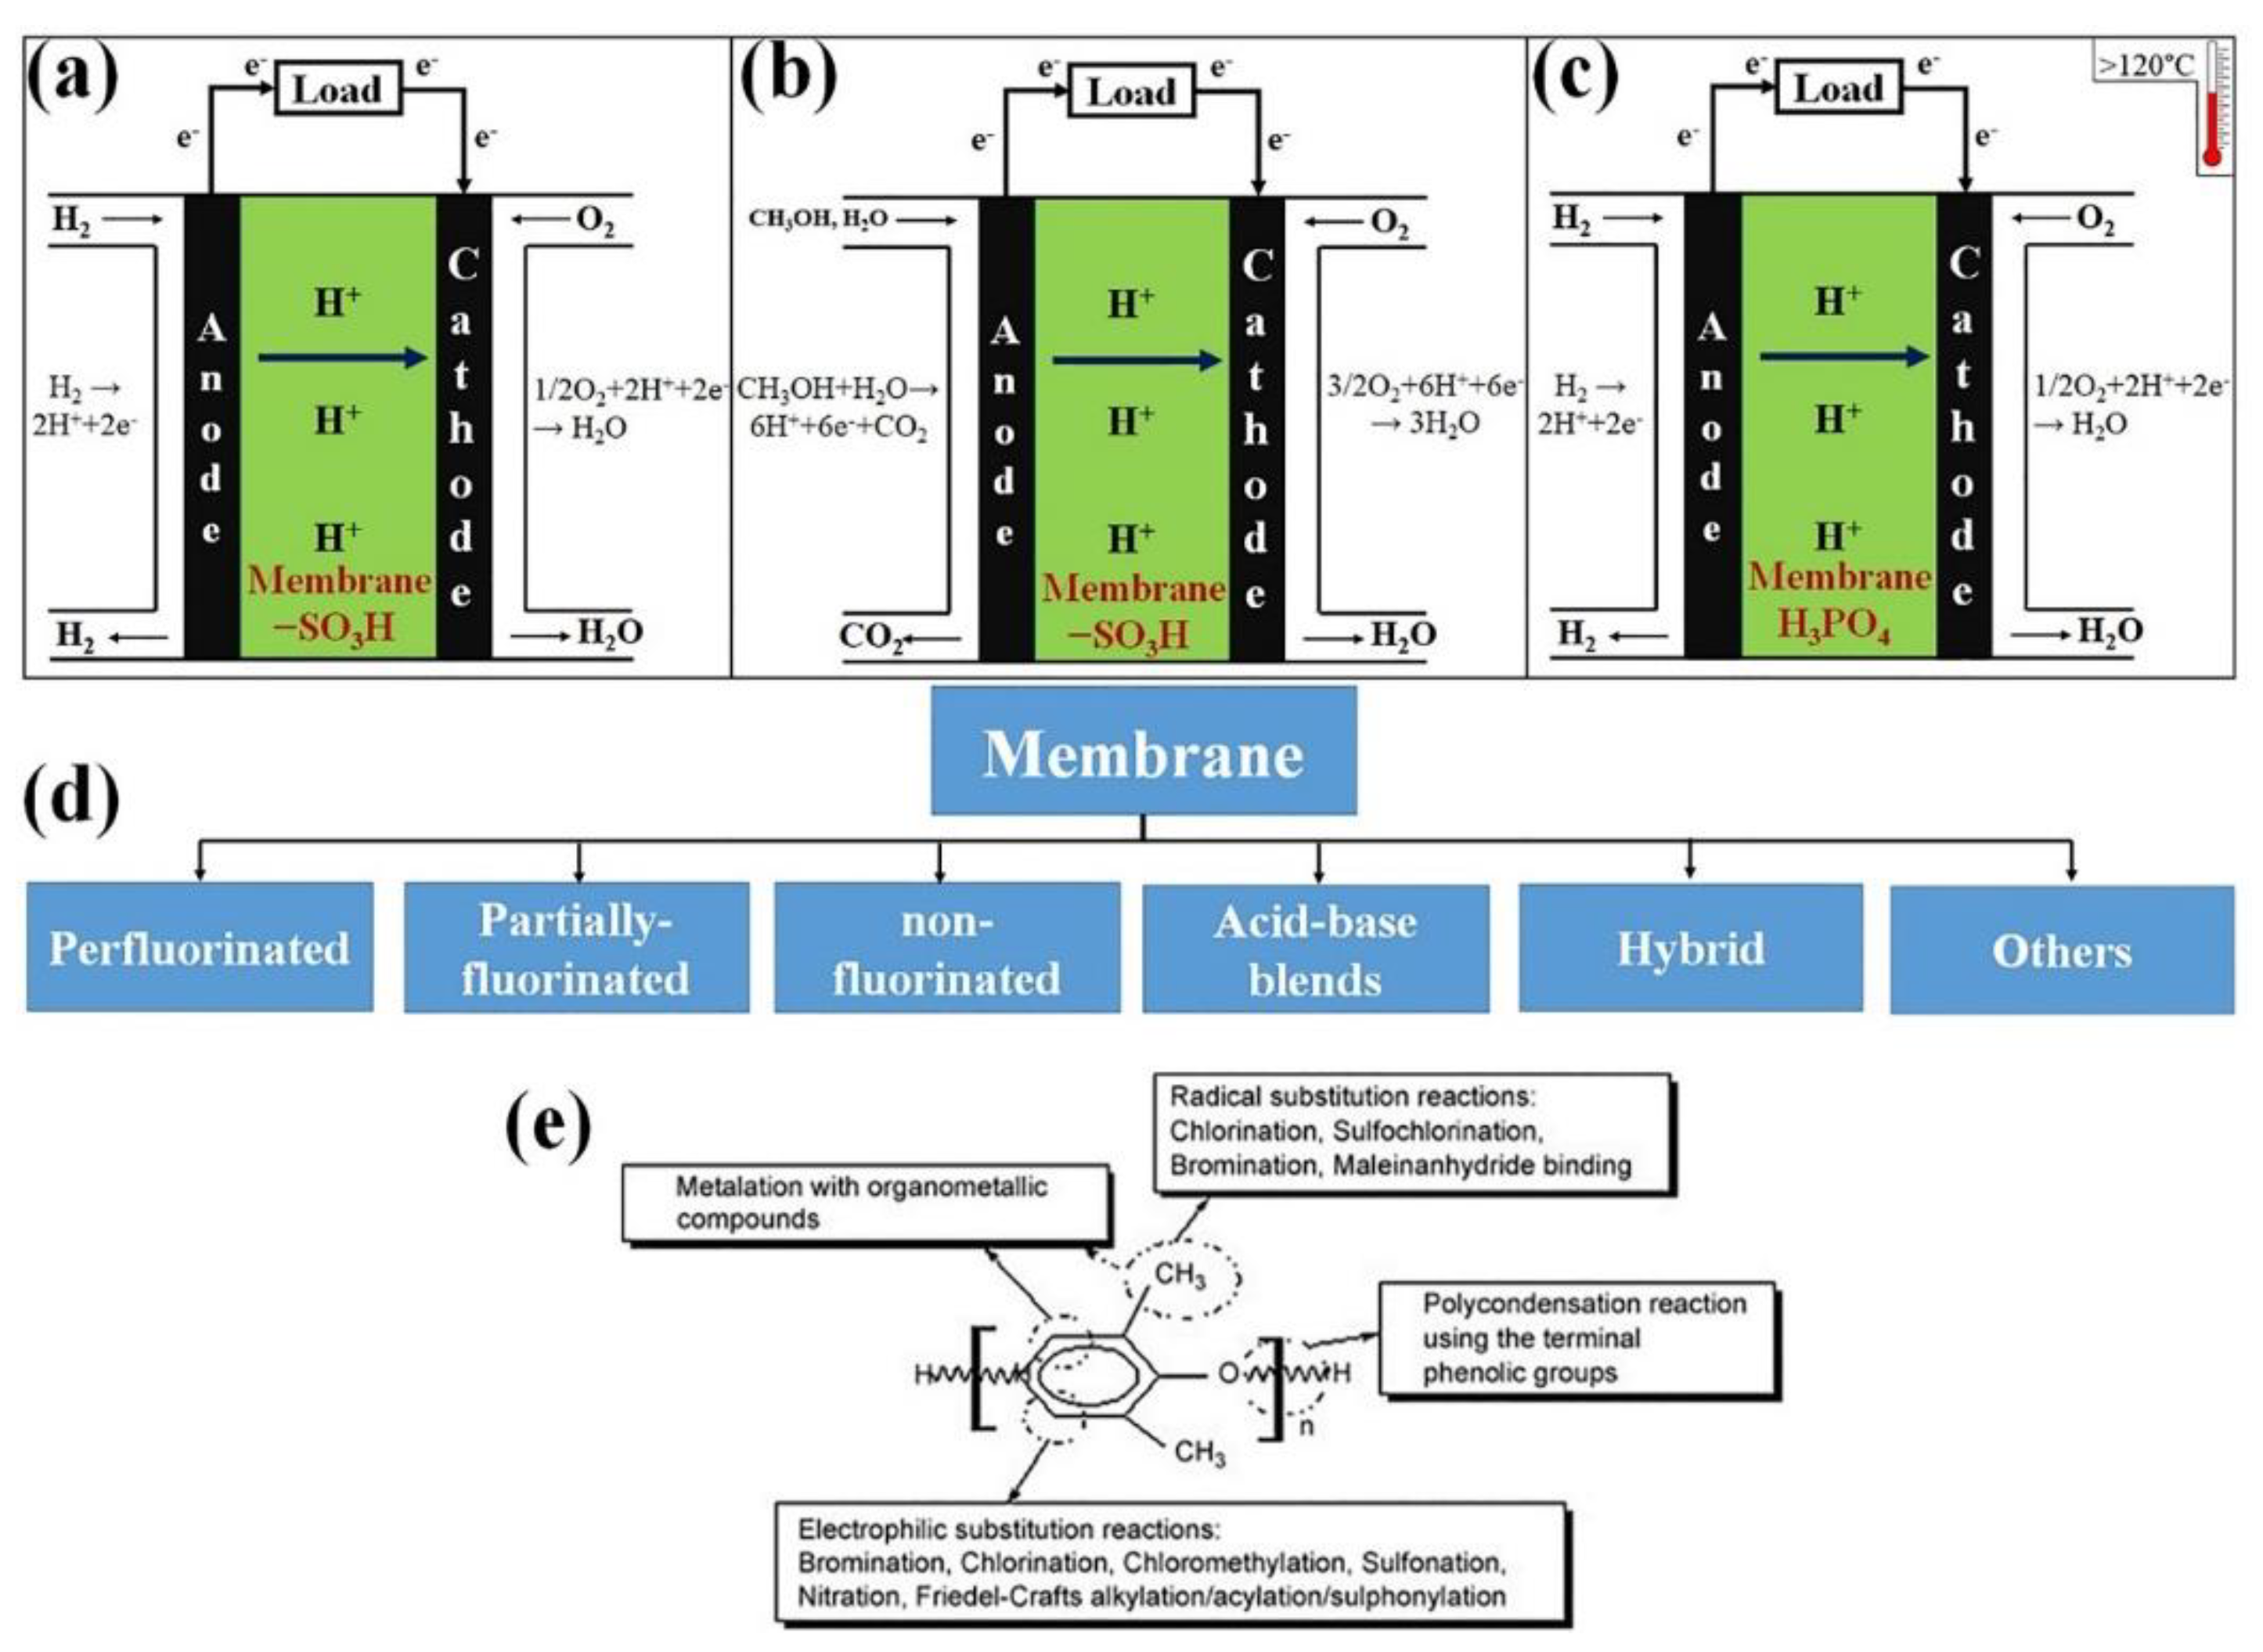
1.1. Principles and Literature Review of Proton Exchange Membrane Fuel Cells (PEM-FCs)
1.2. Research Gap, Objectives, and Originality
- Developing an ANFIS model based on empirical data to simulate the output power density of the PEM-FC.
- Applying the SSA to identify optimal values for the input control parameters.
- Treating the three input control parameters of the PEM-FC as decision variables during the optimization process.
- Maximizing the output power density of the PEM-FC.
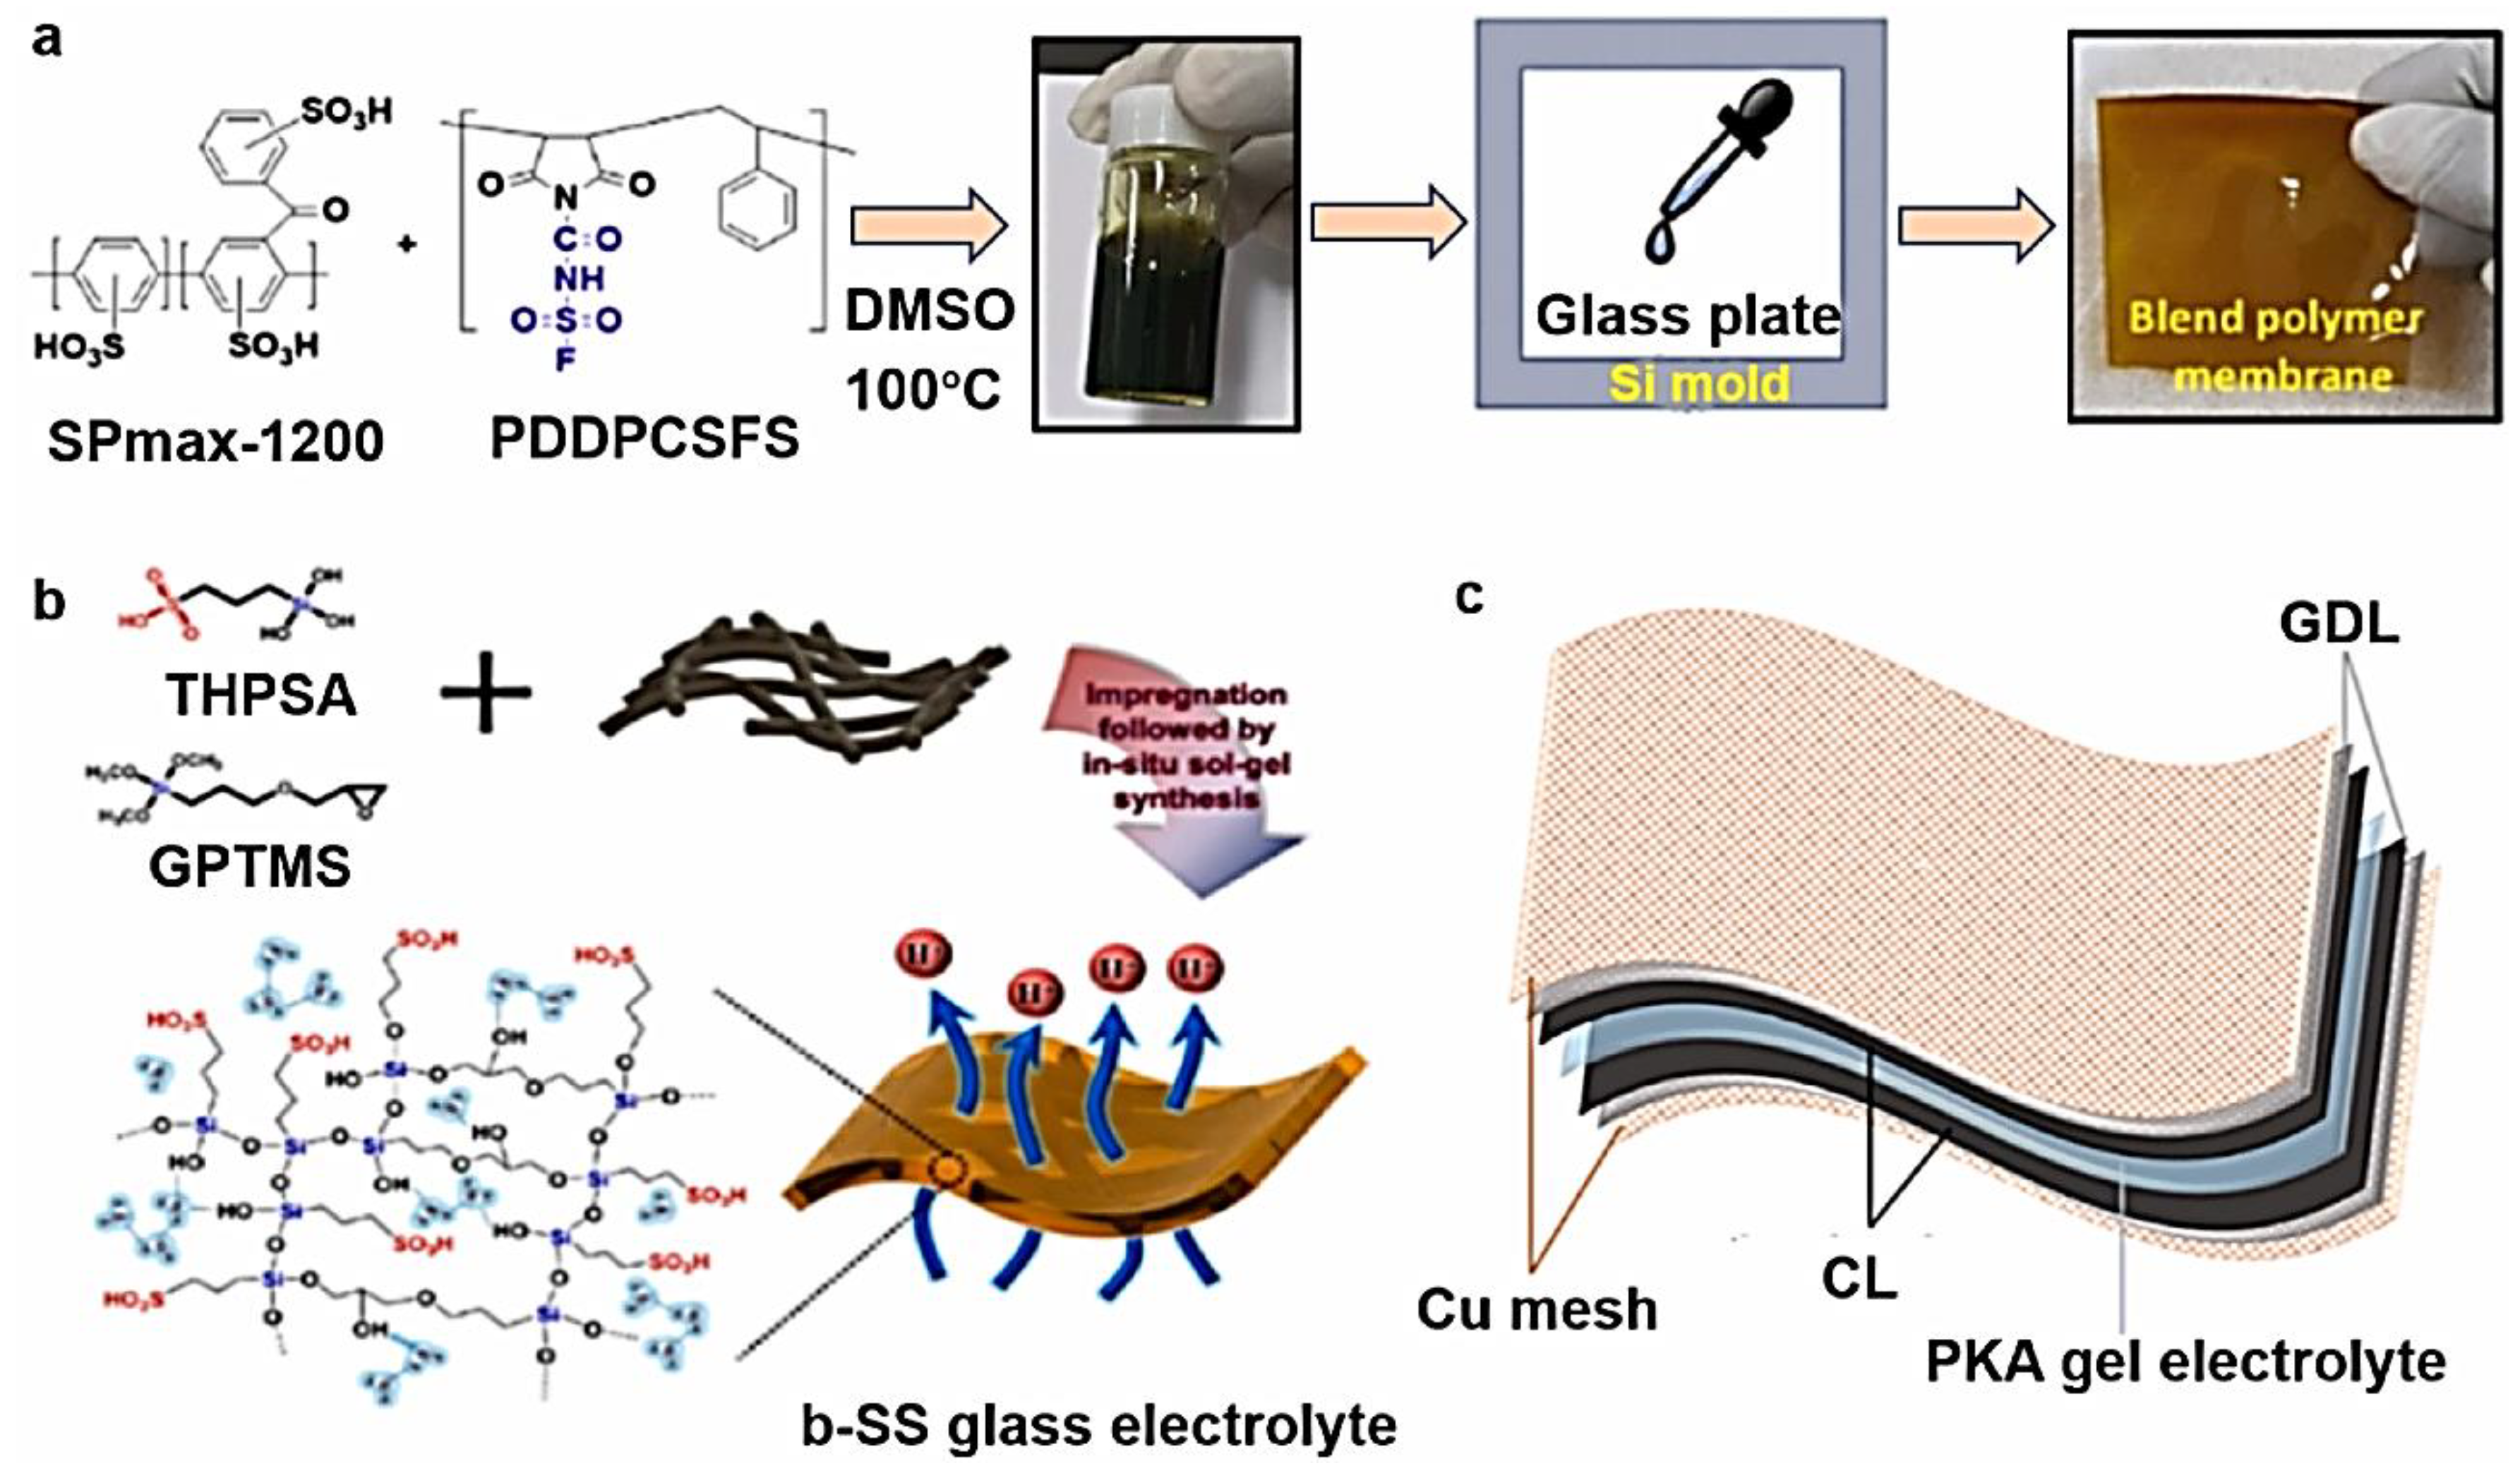
2. Experimental Approach
3. Methodology
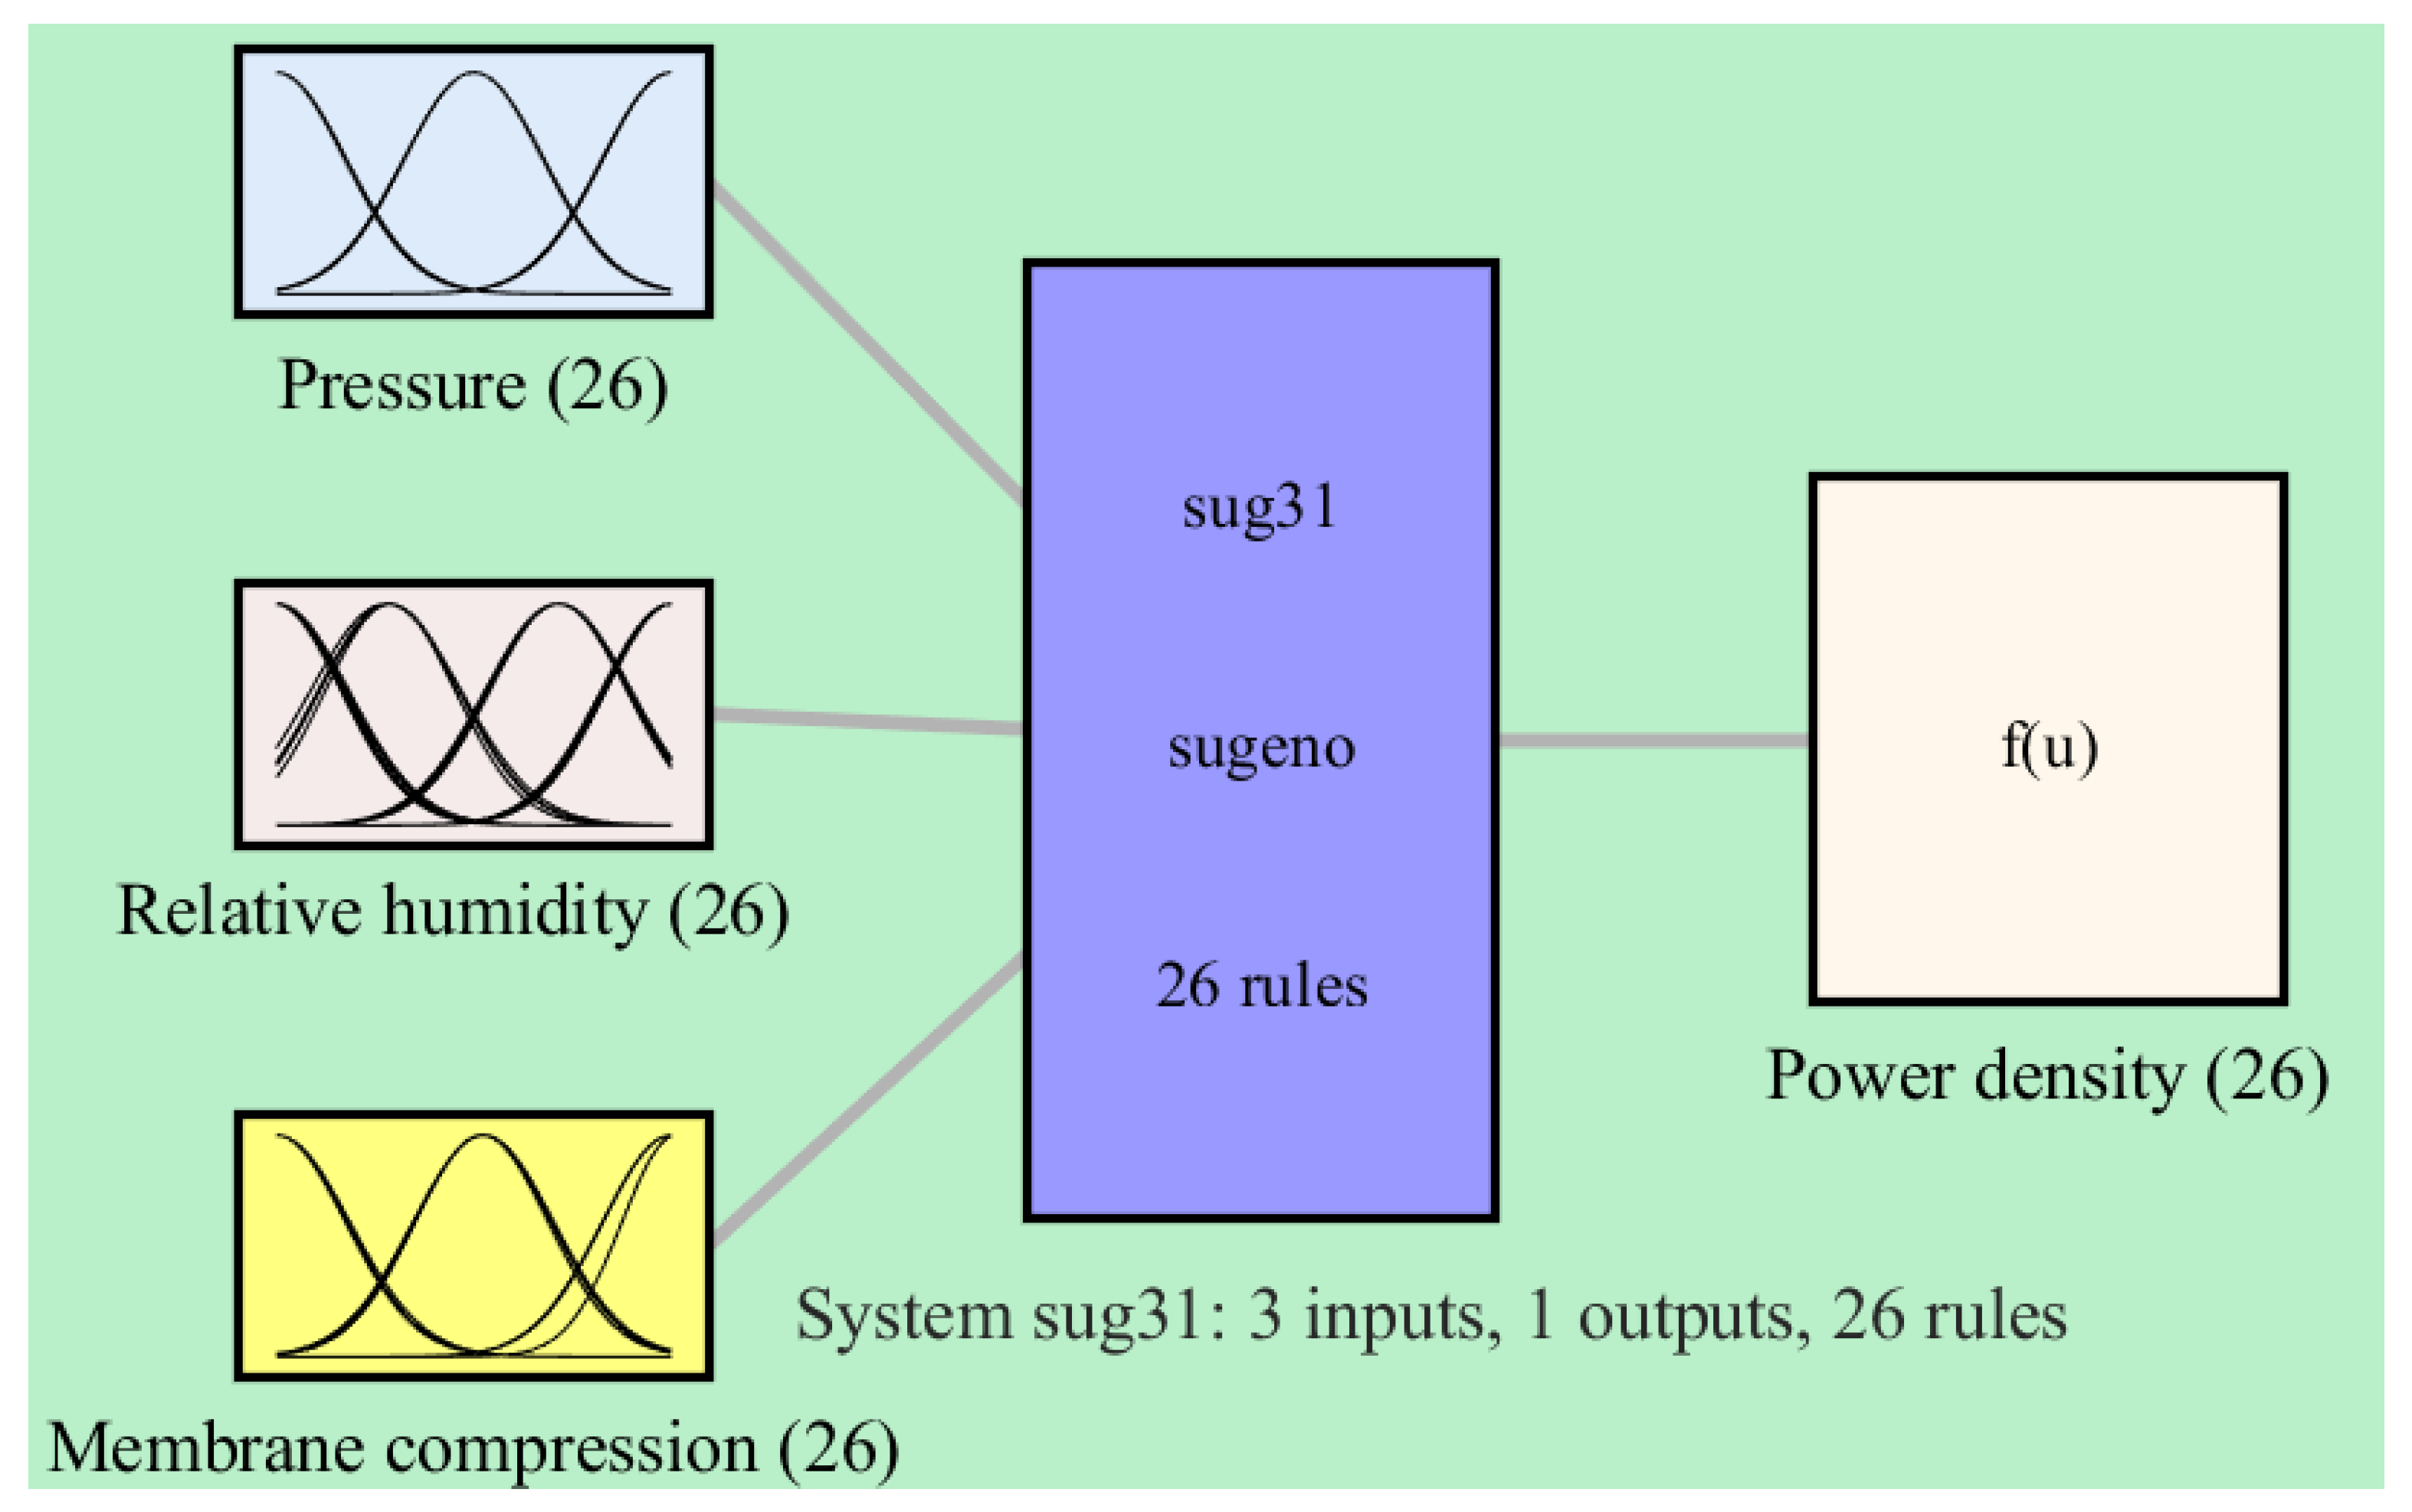
3.1. ANFIS Modeling
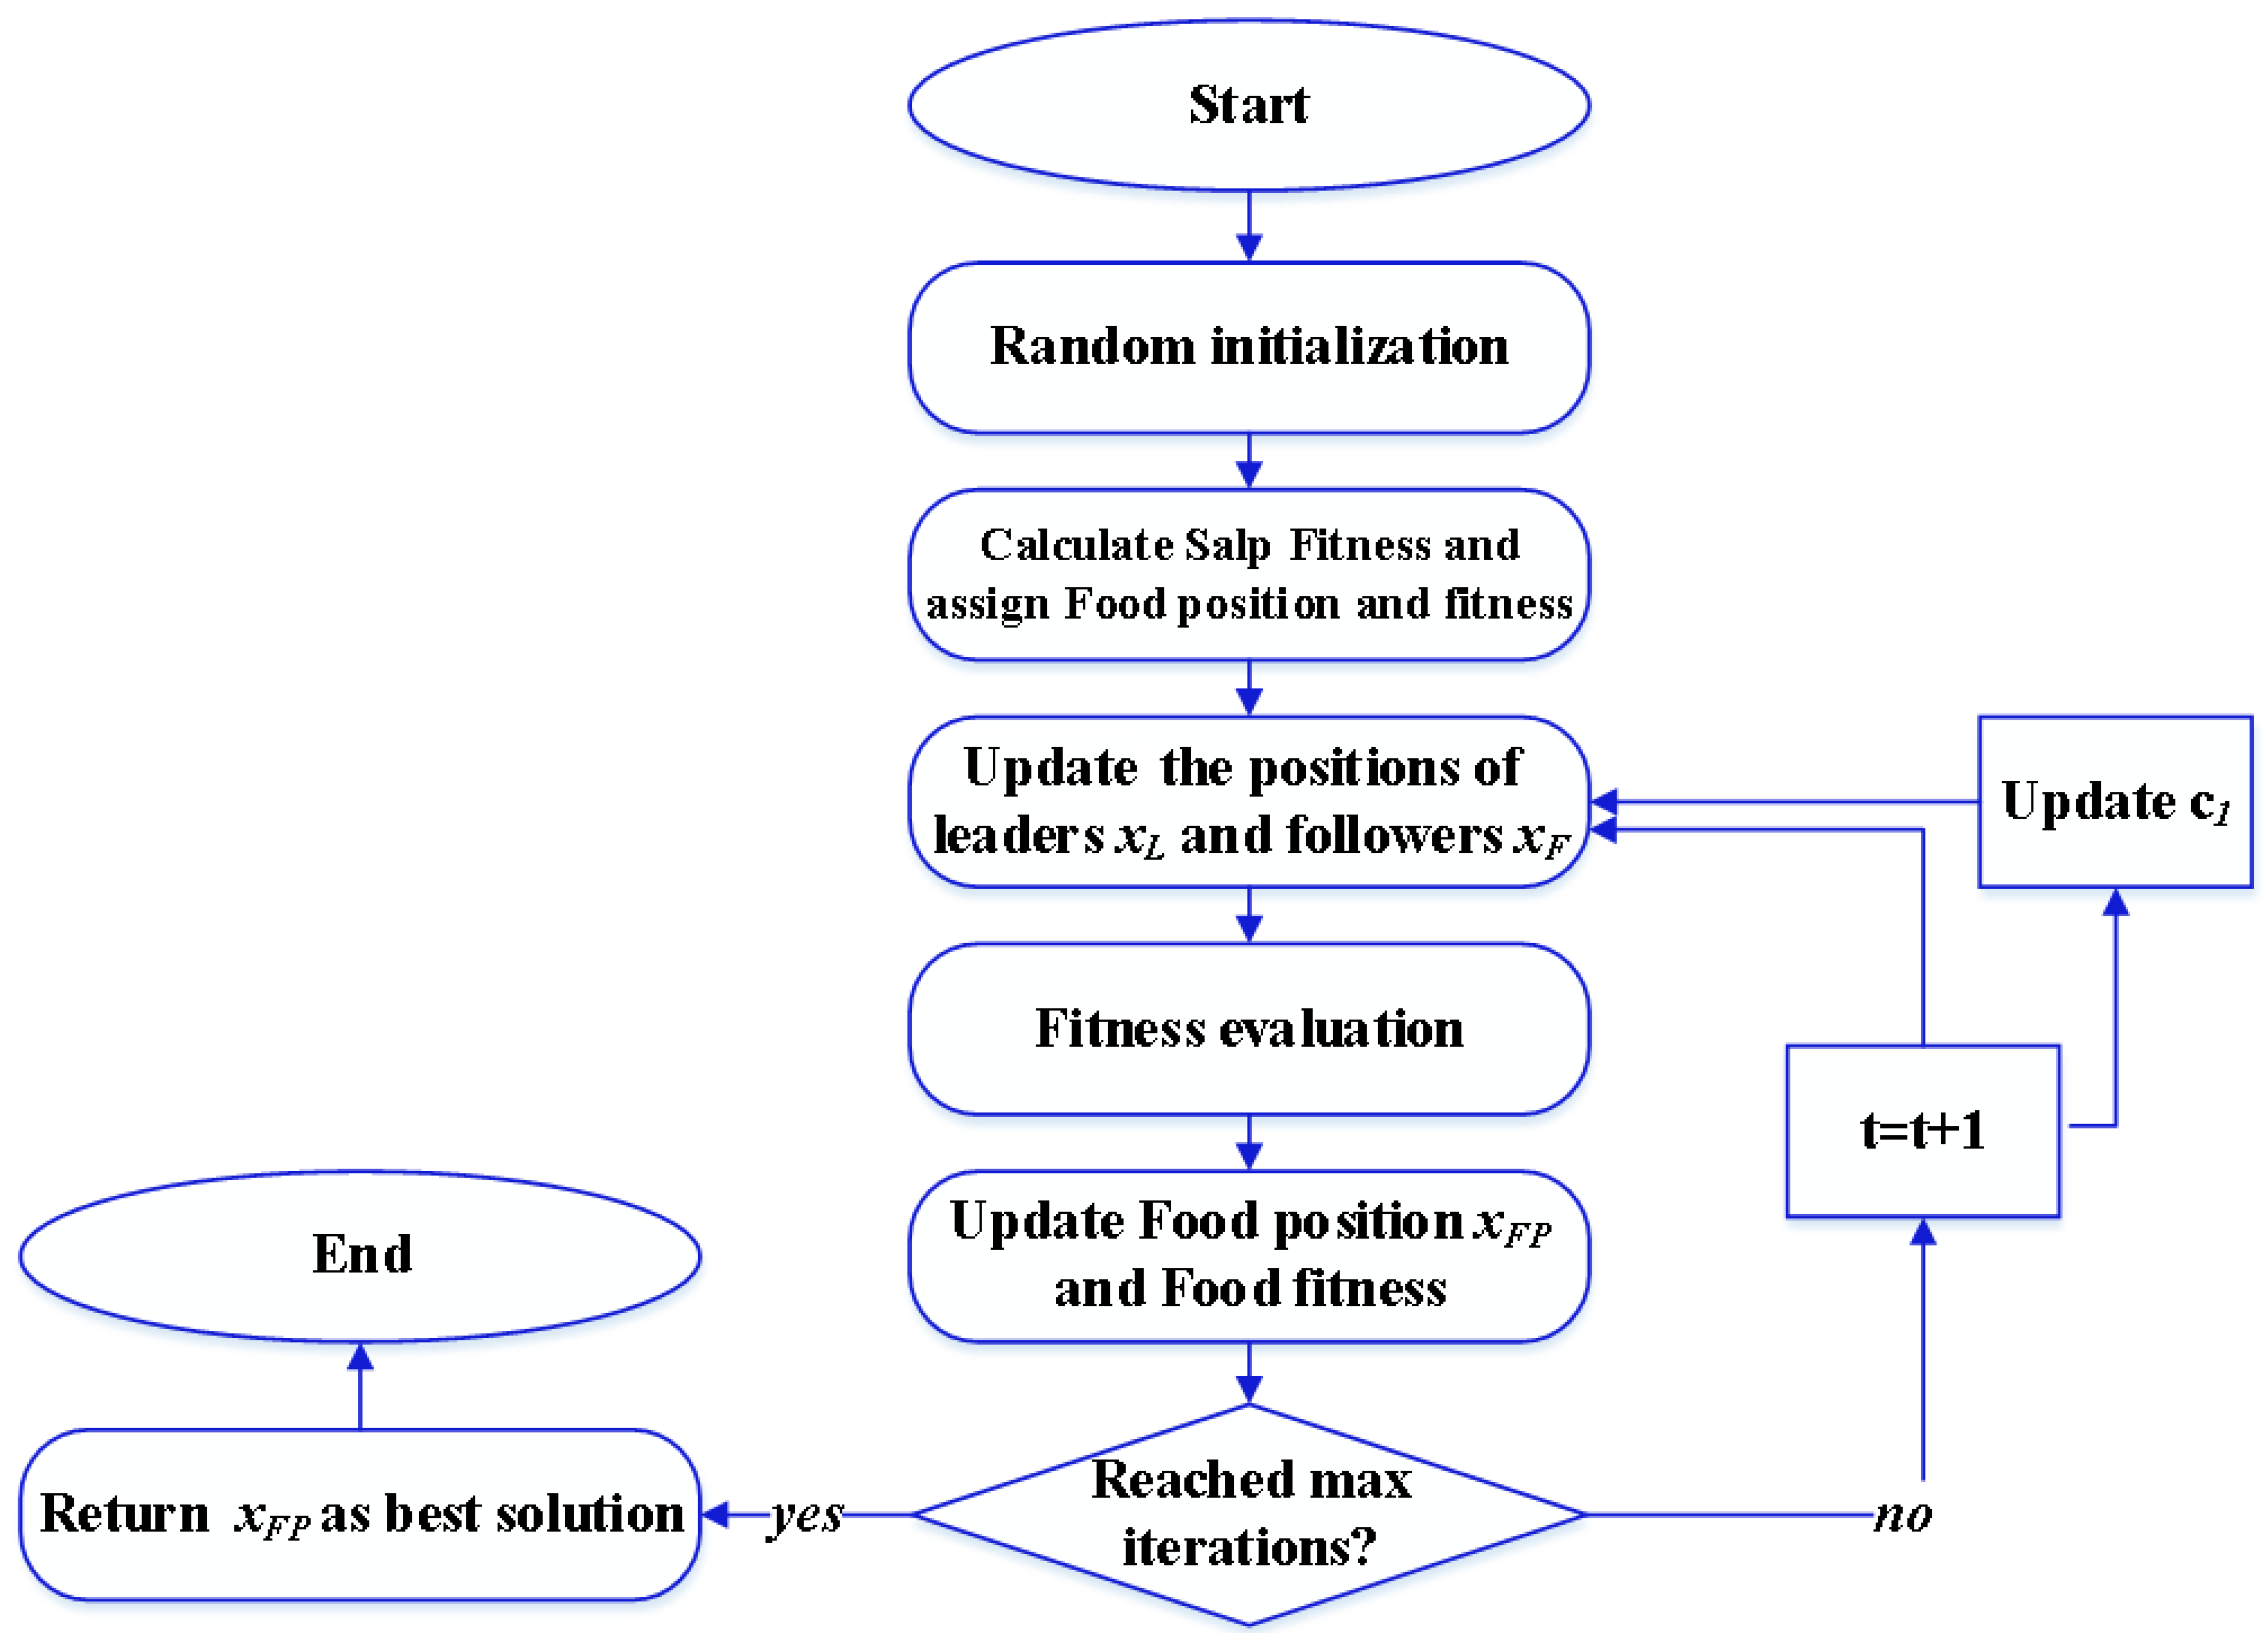
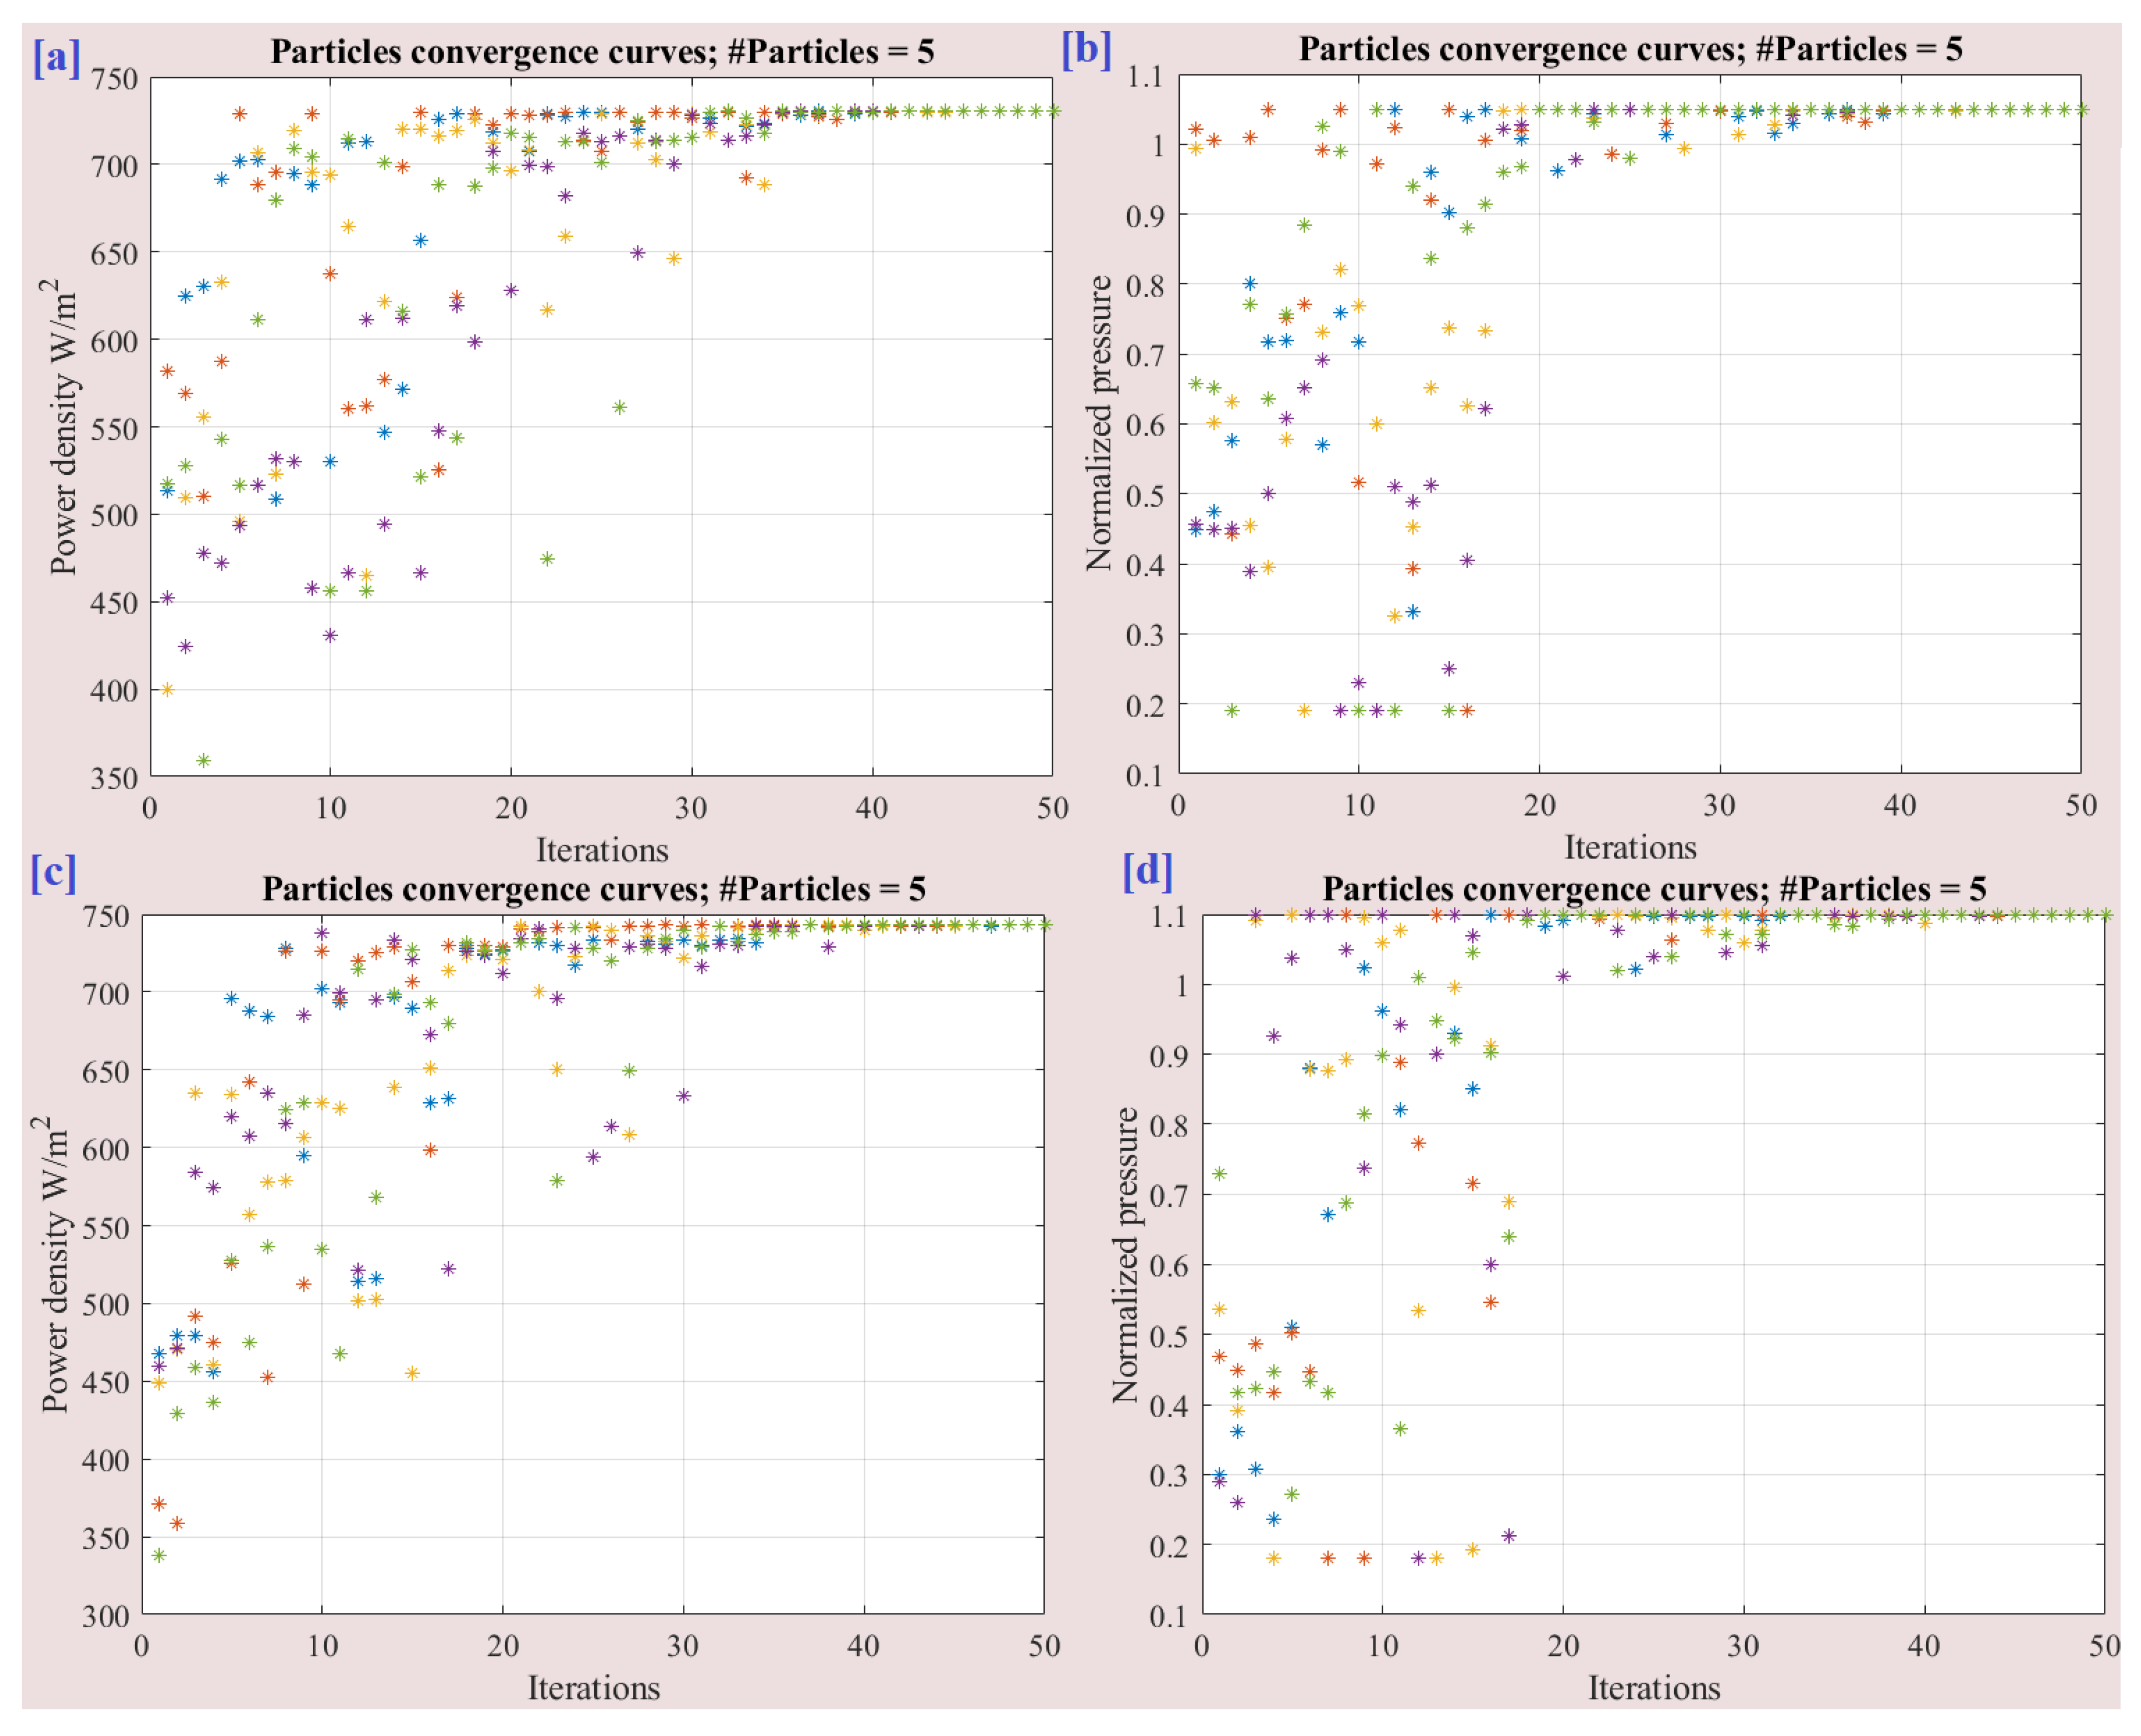
3.2. Salp Swarm Algorithm (SSA)
4. Results and Discussion
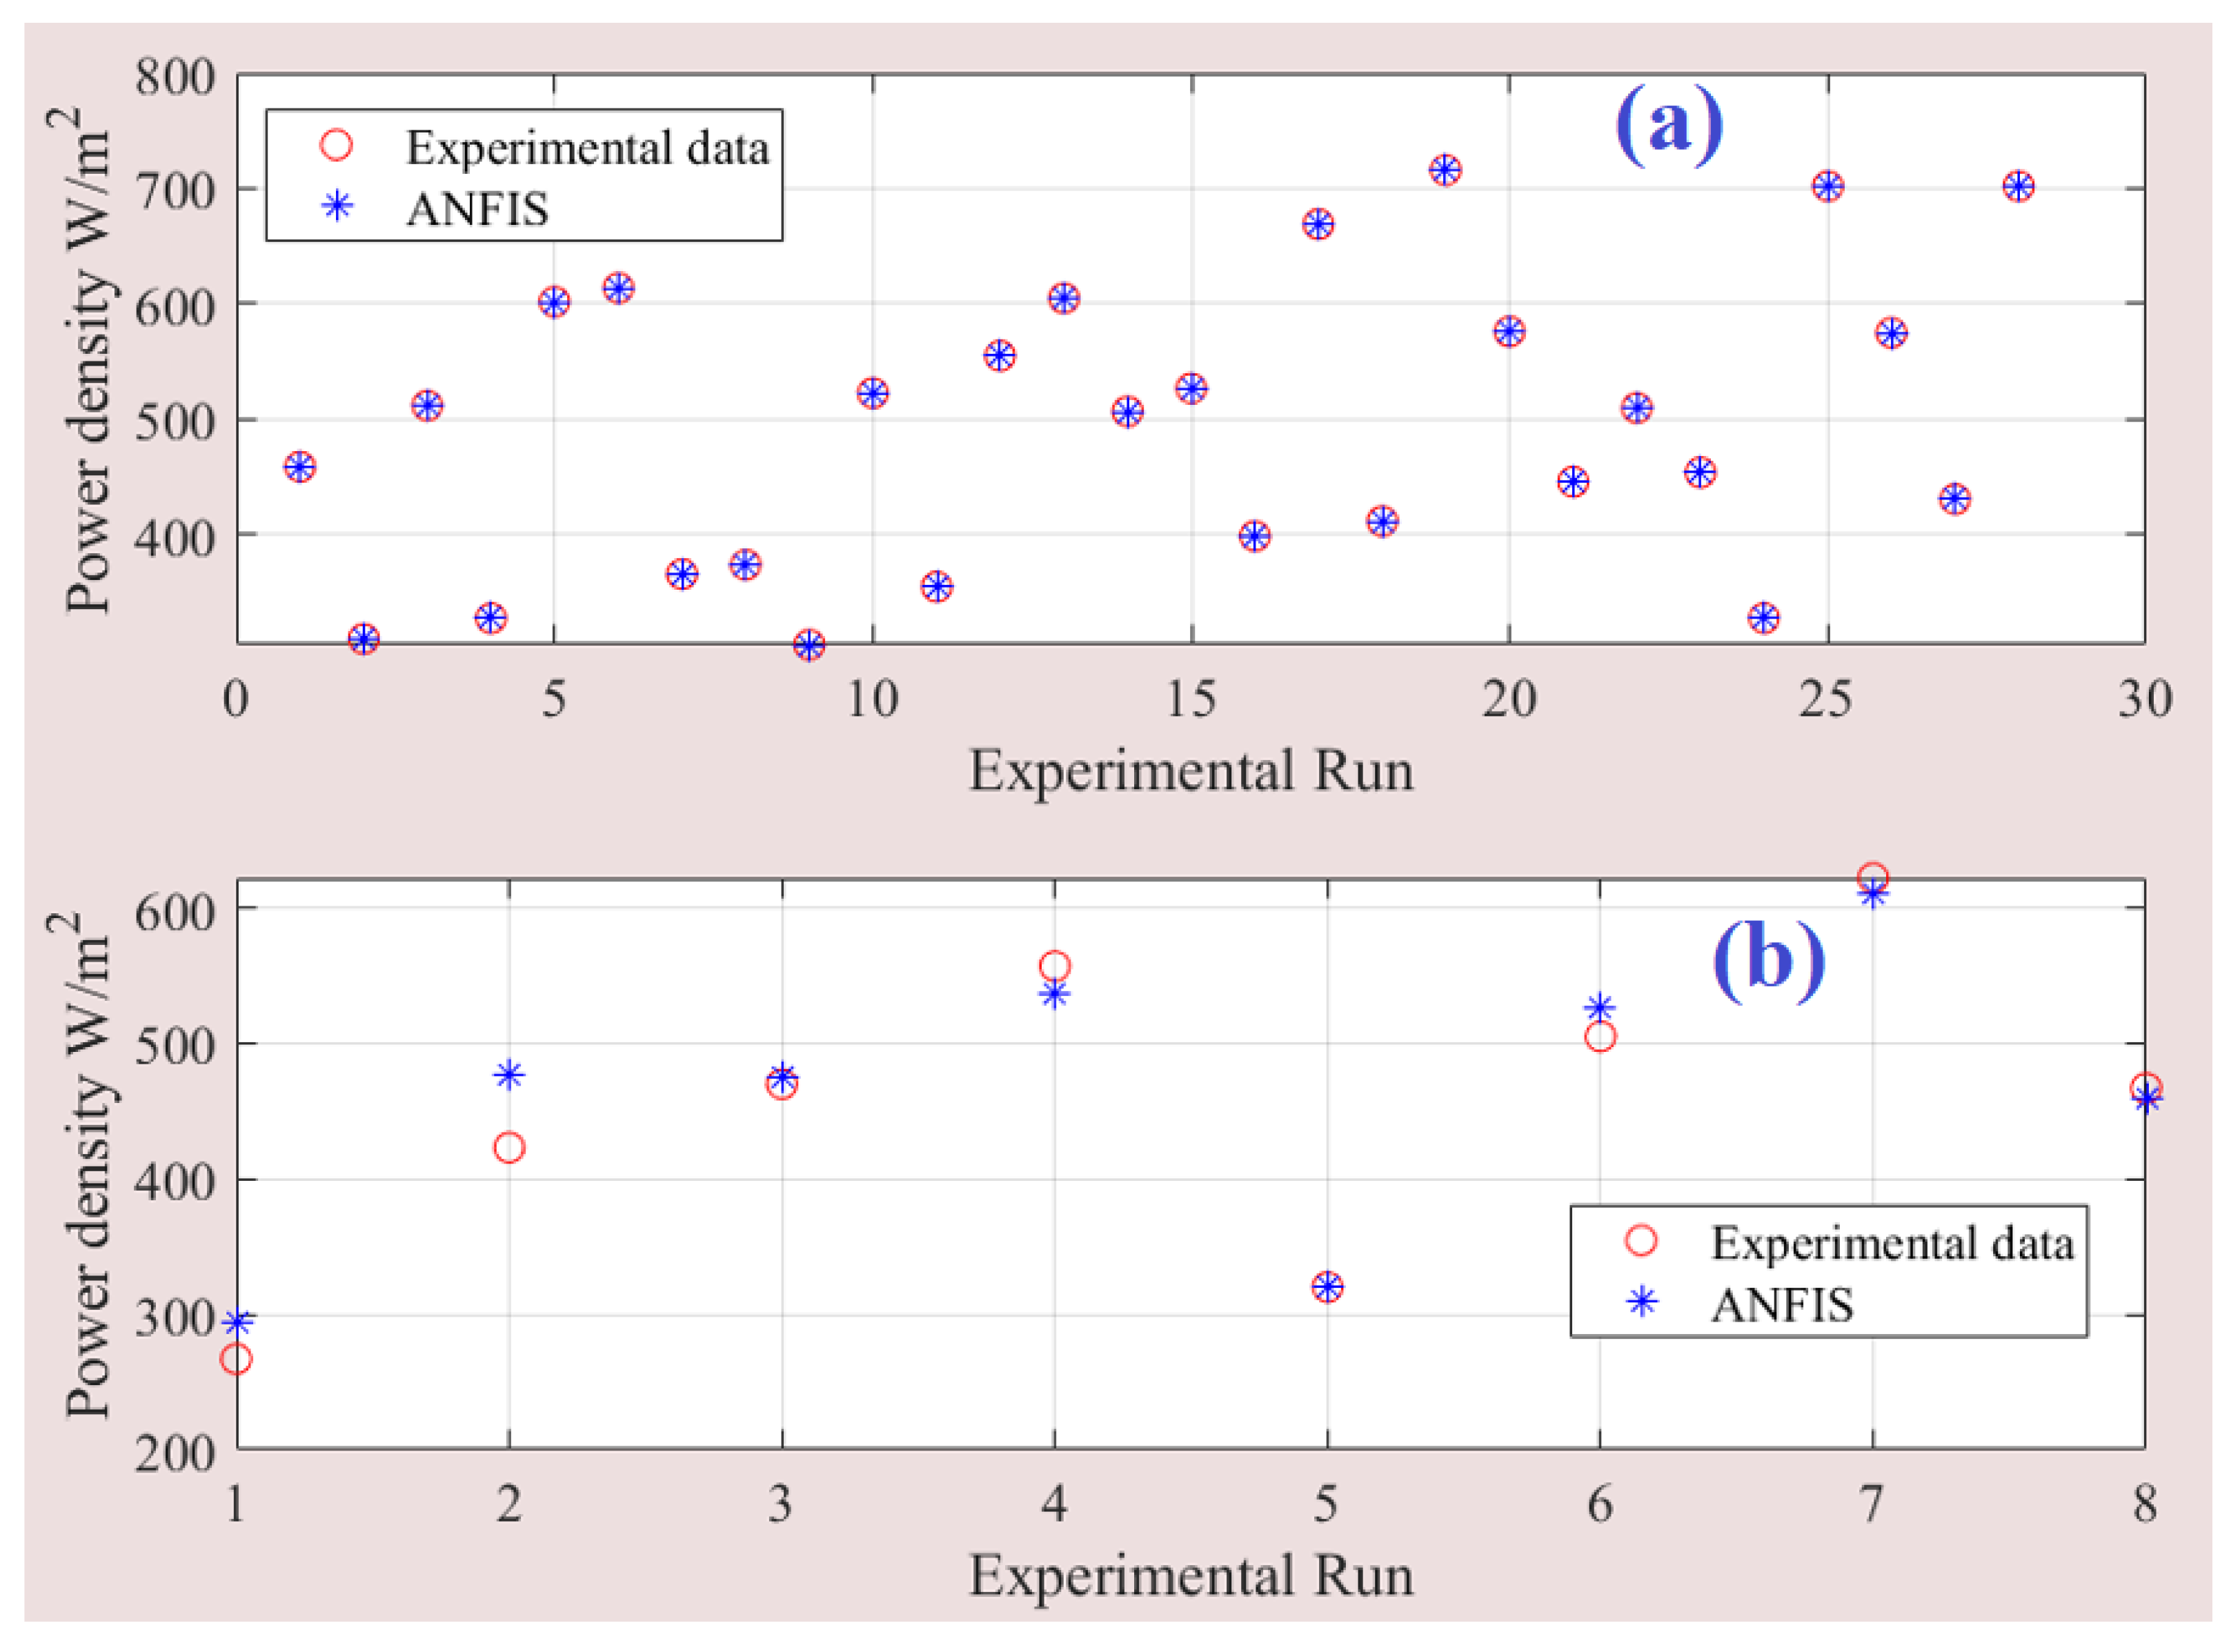
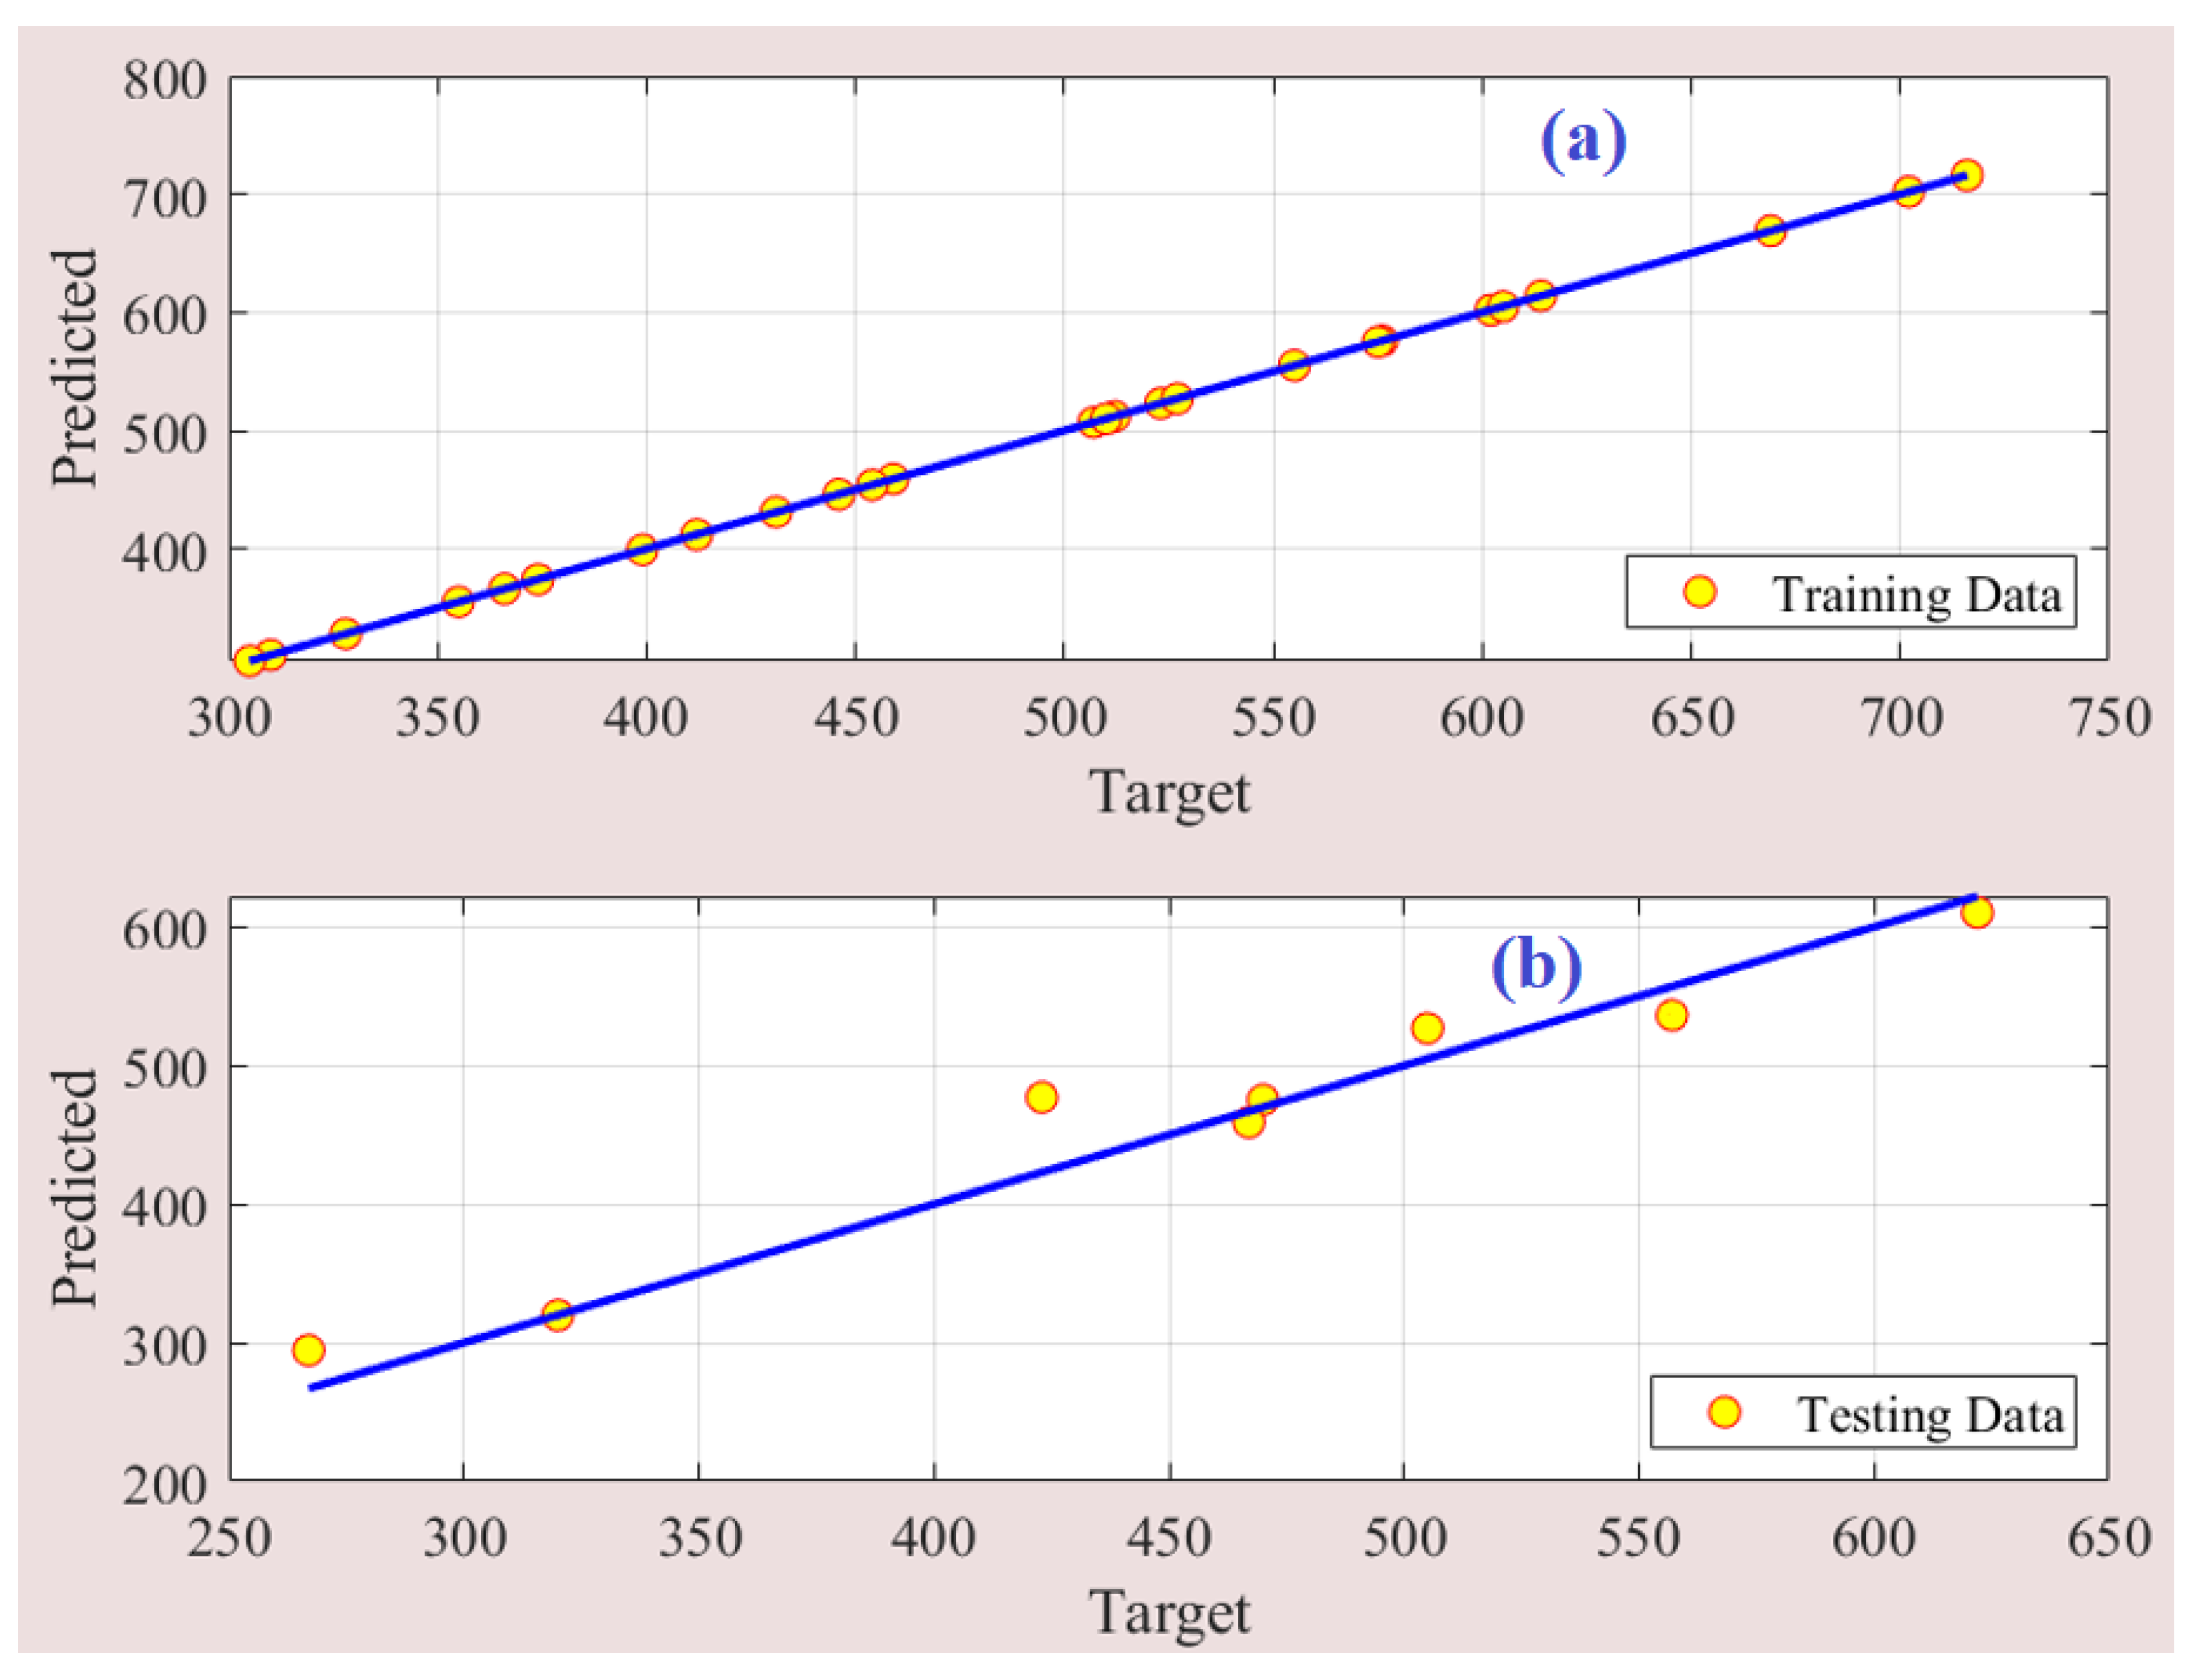
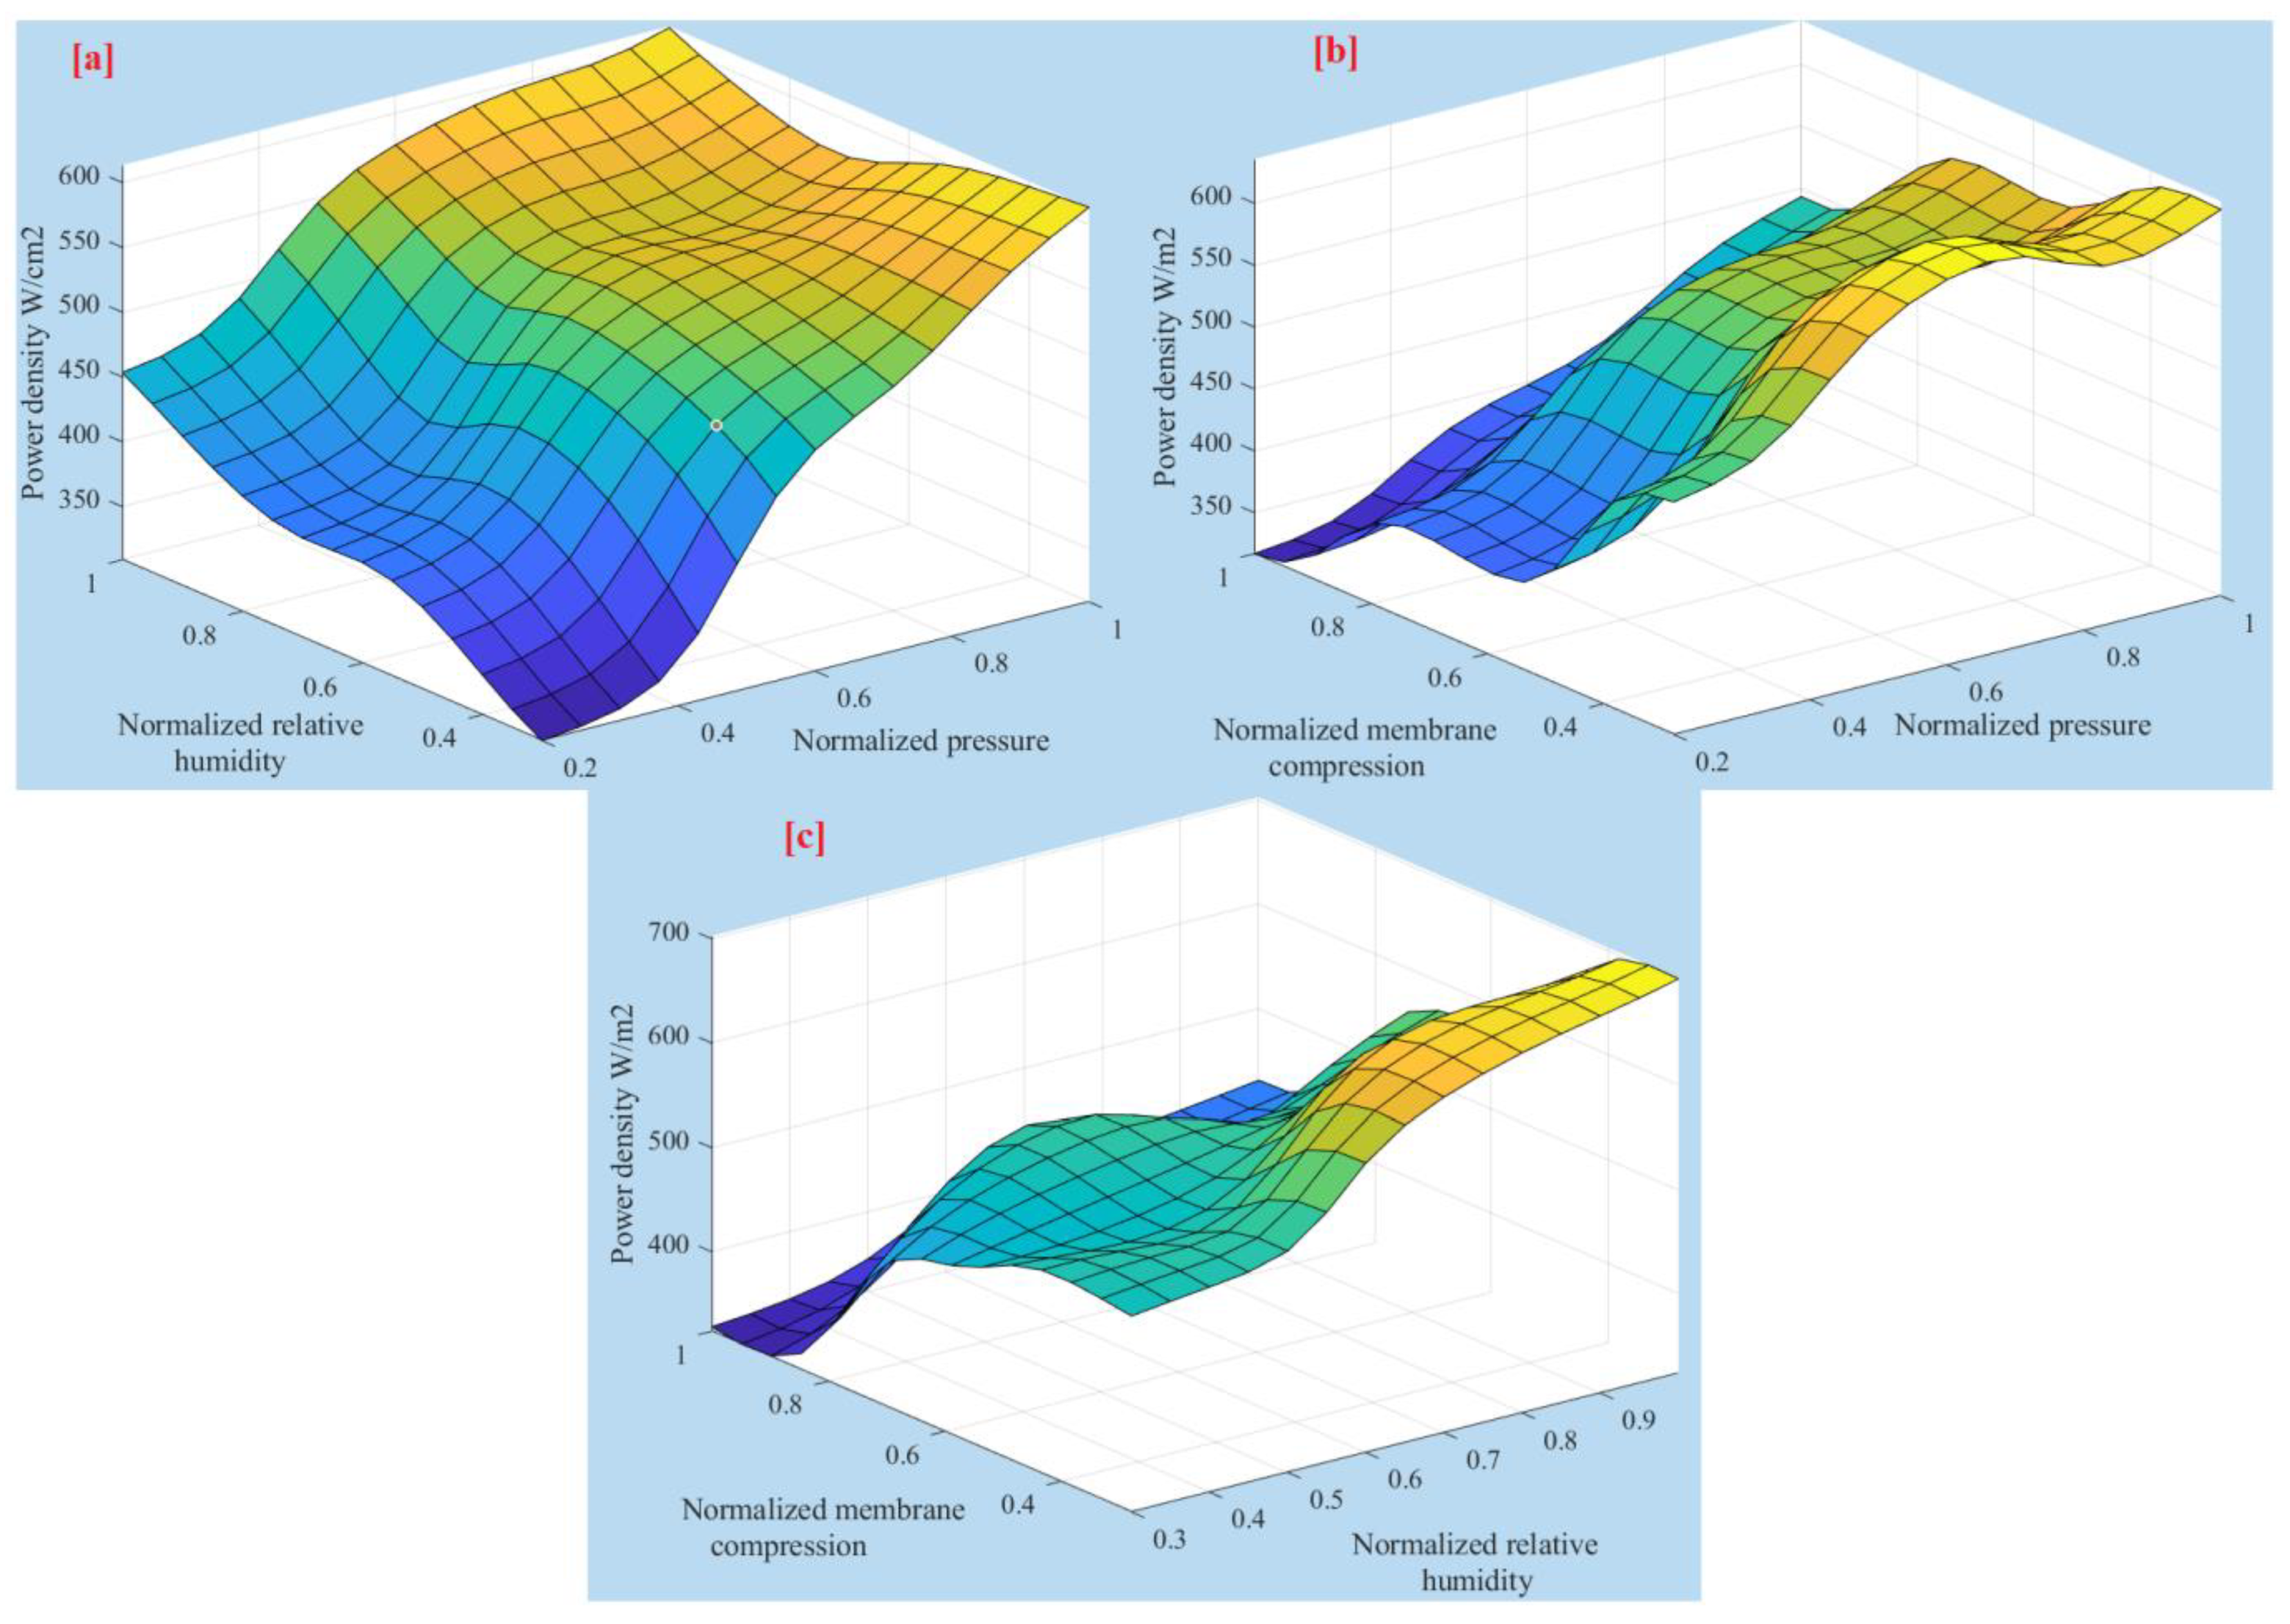
4.1. Modeling Phase
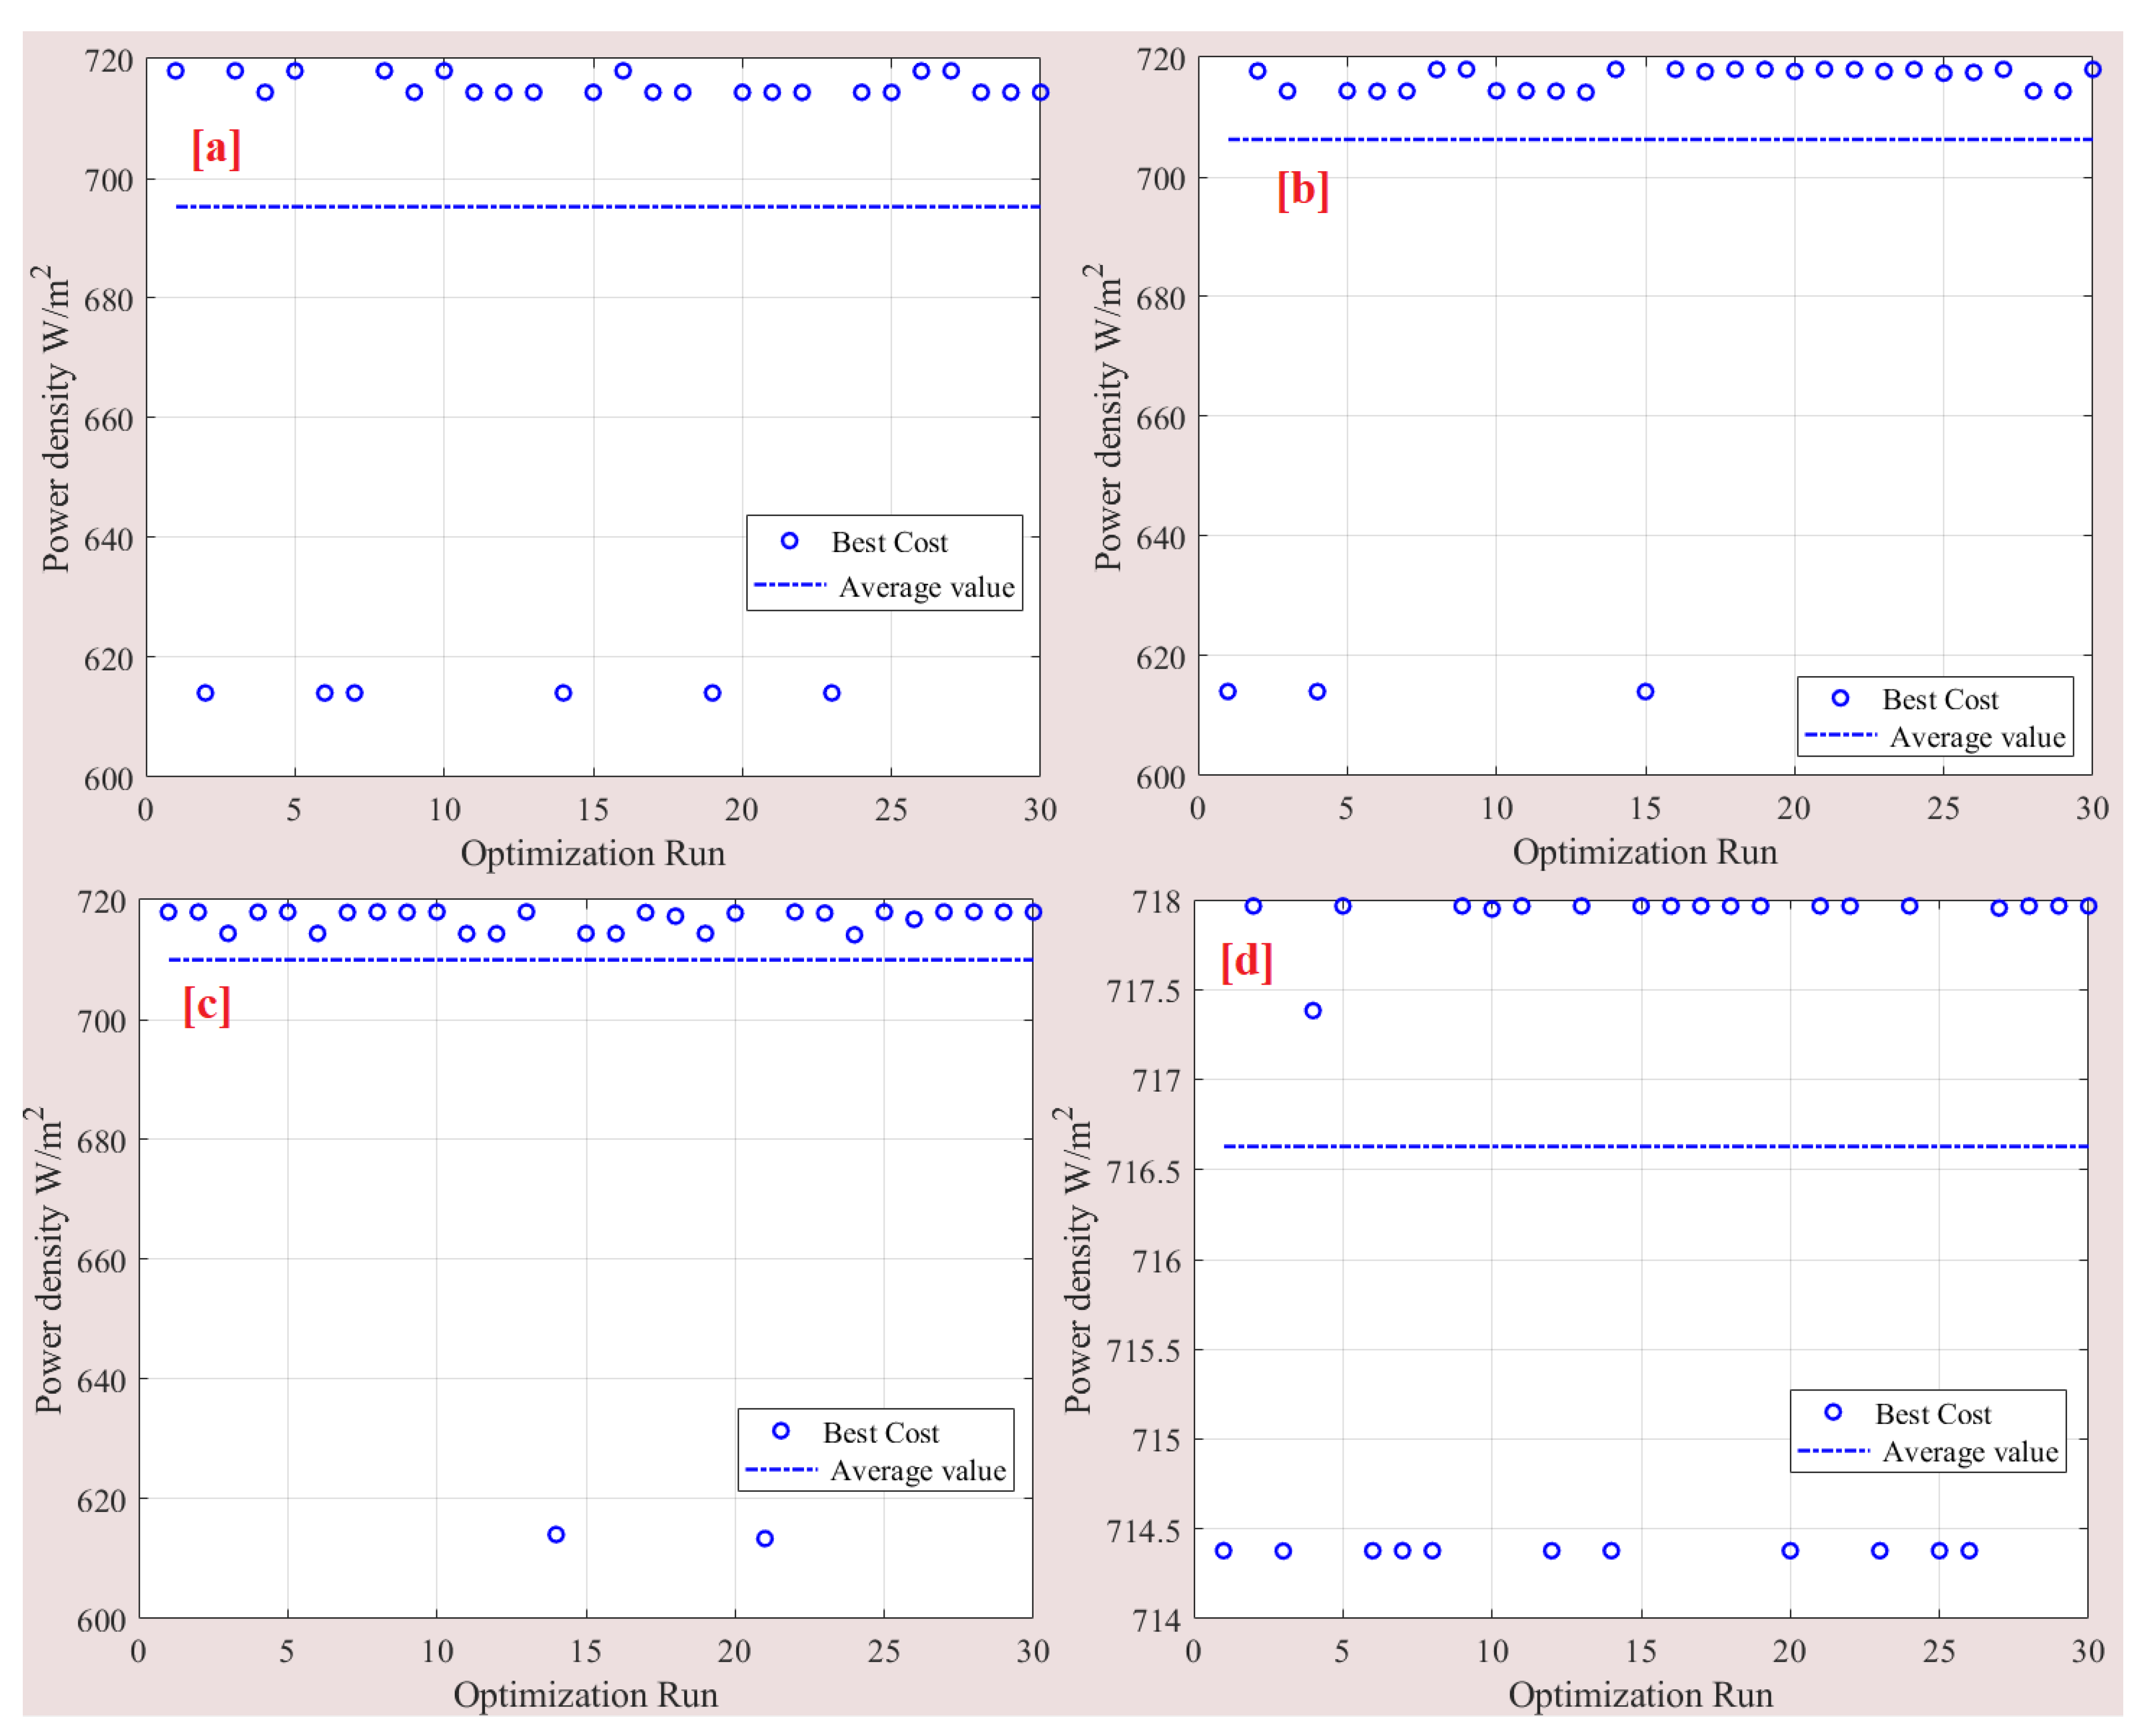
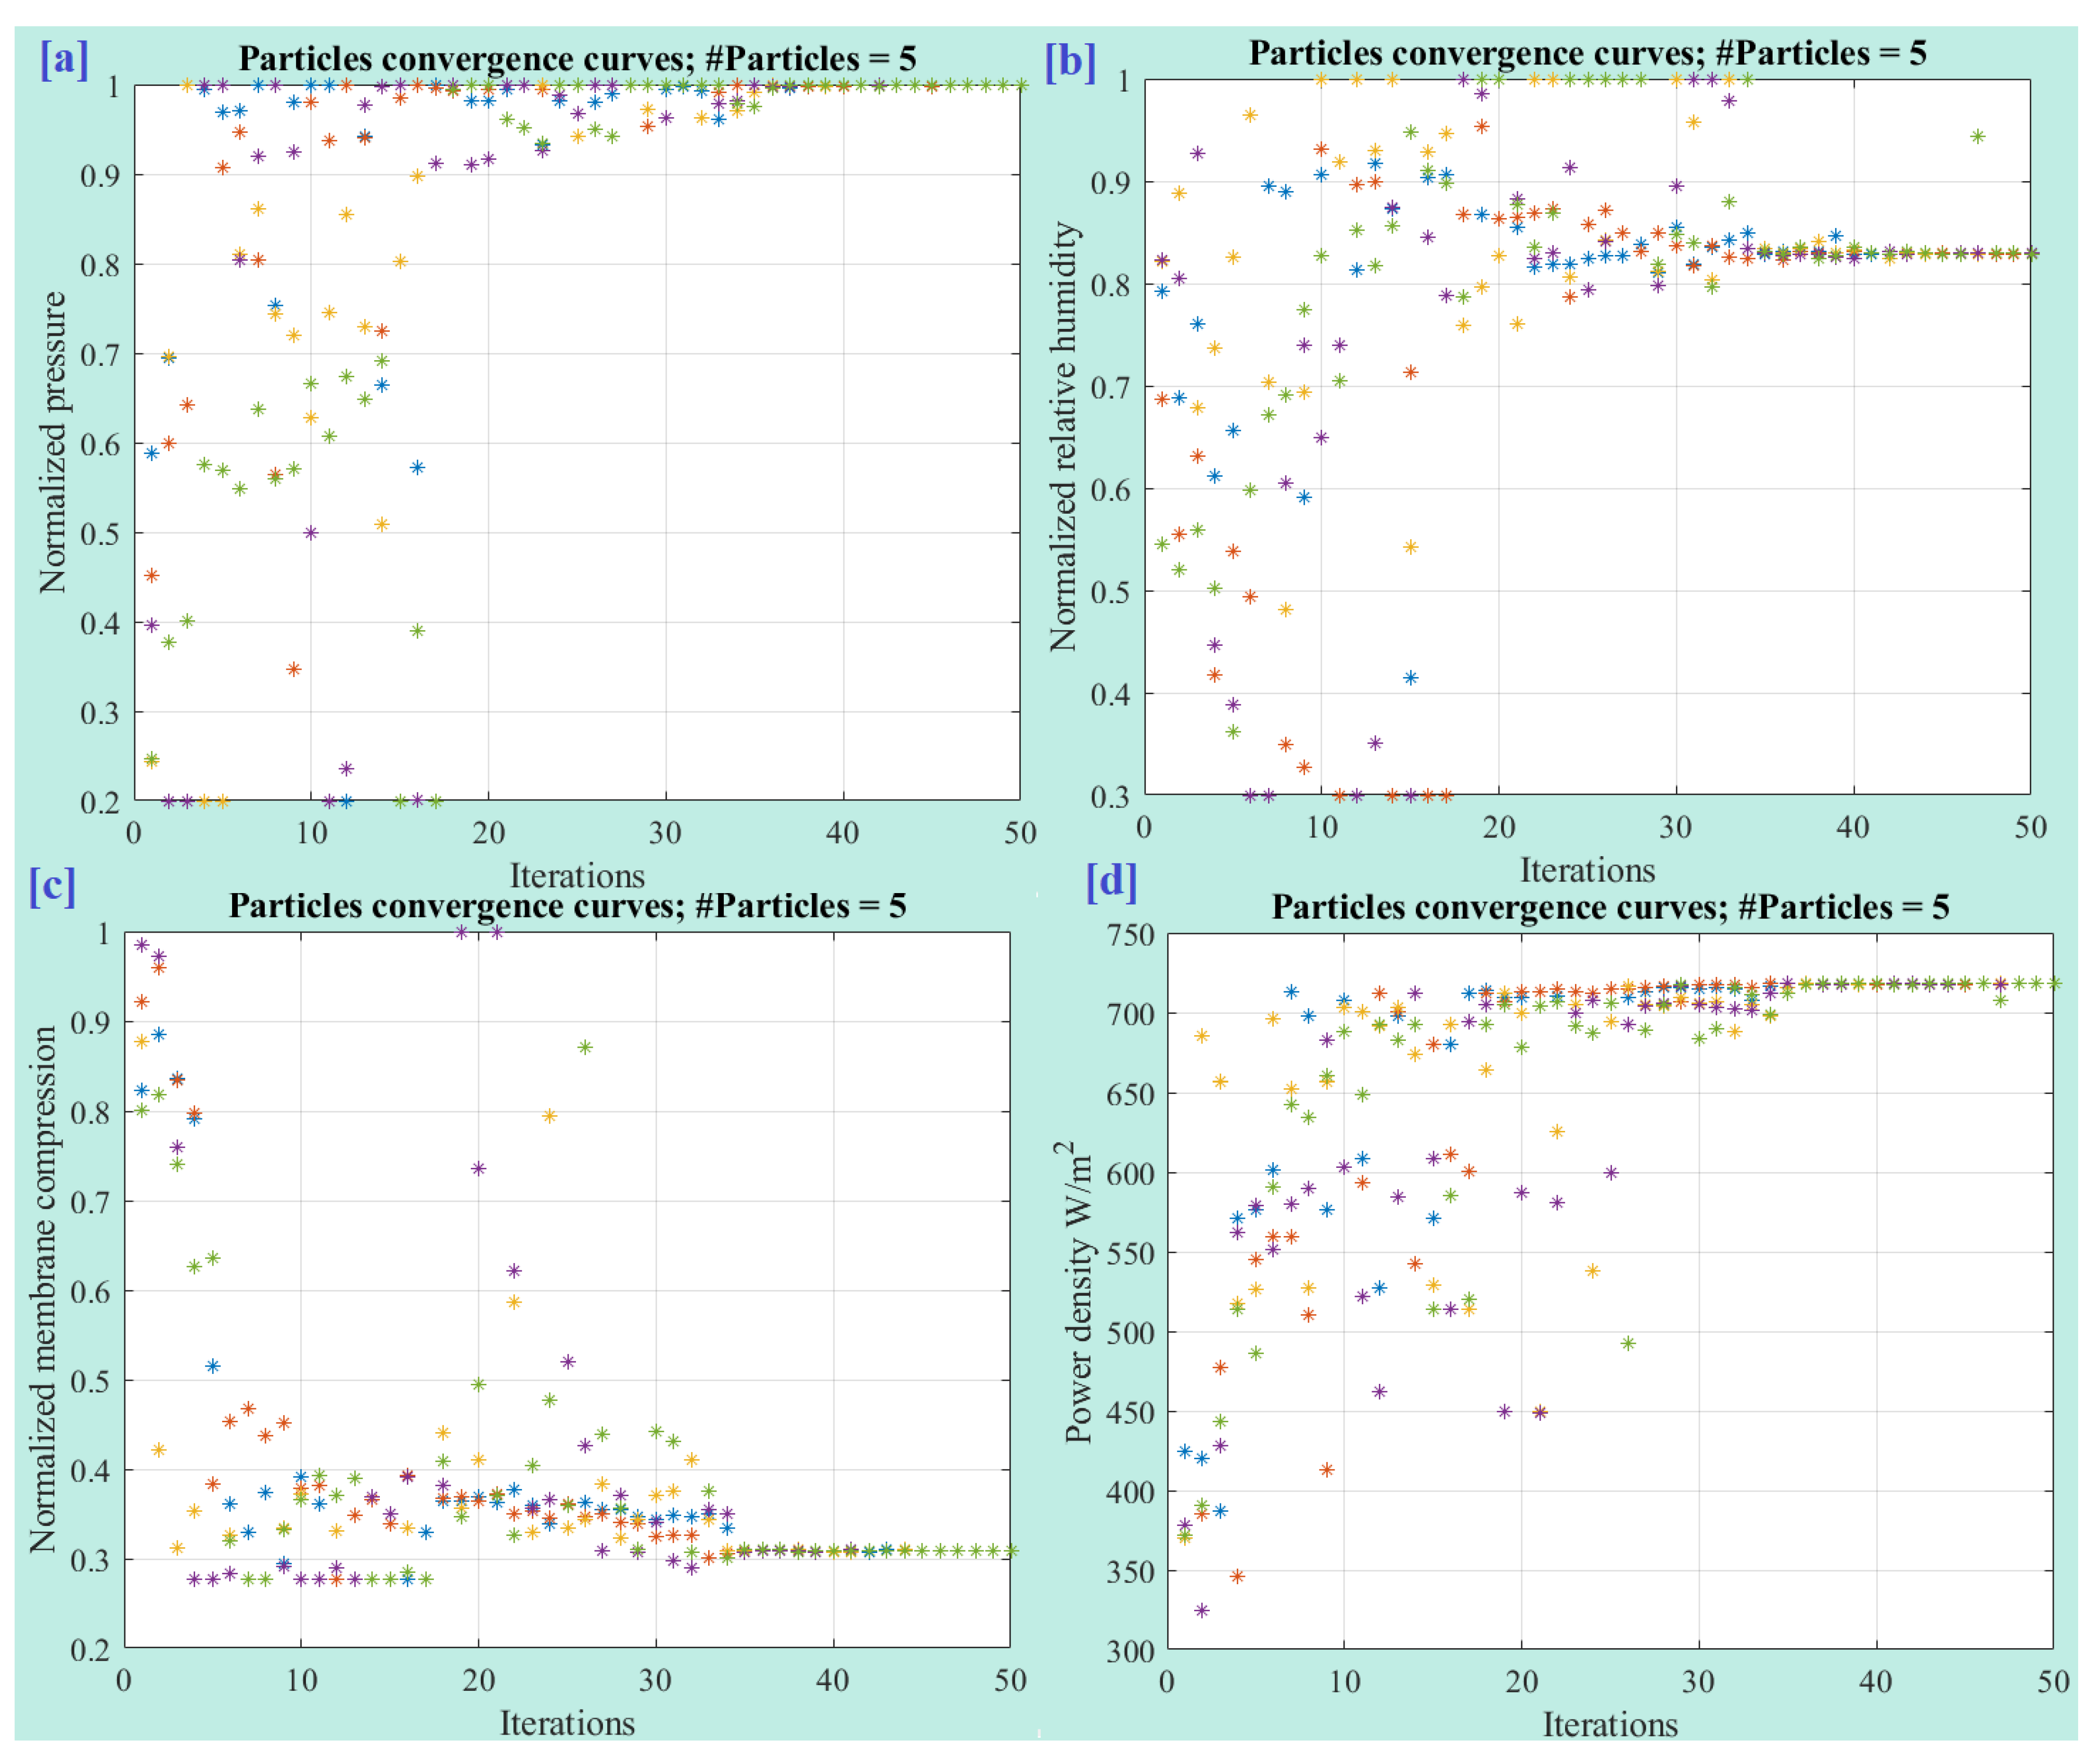
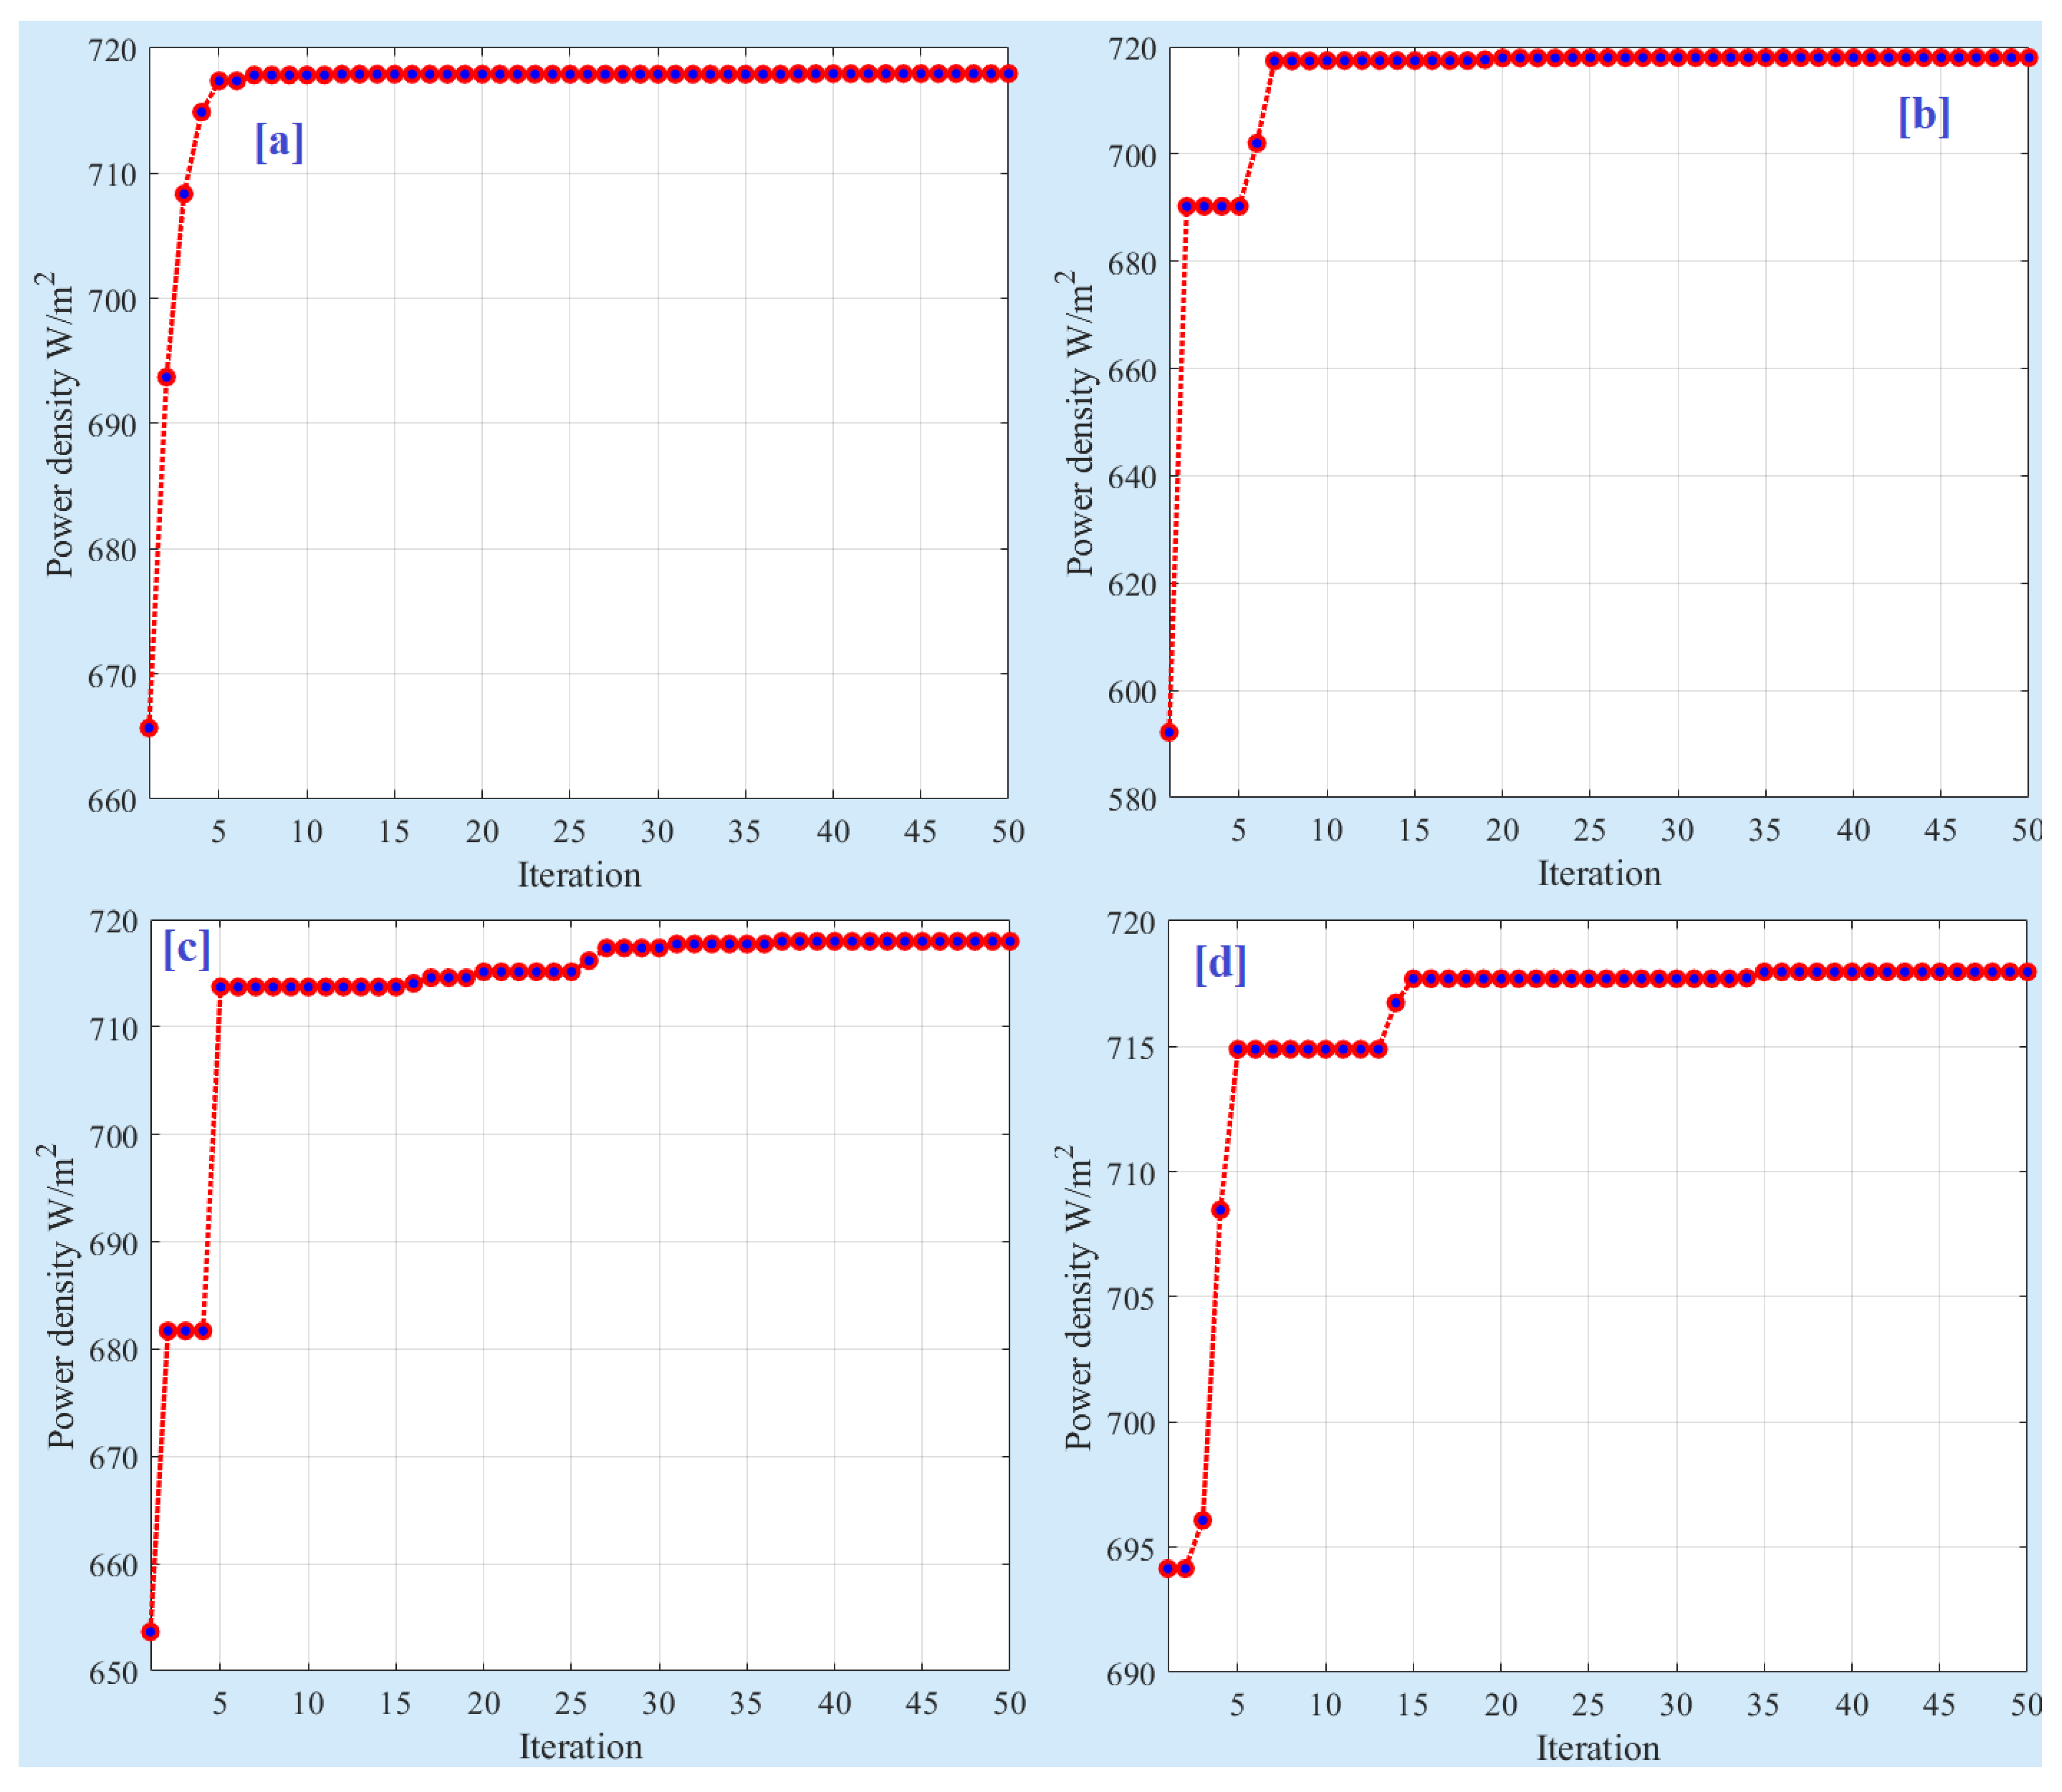
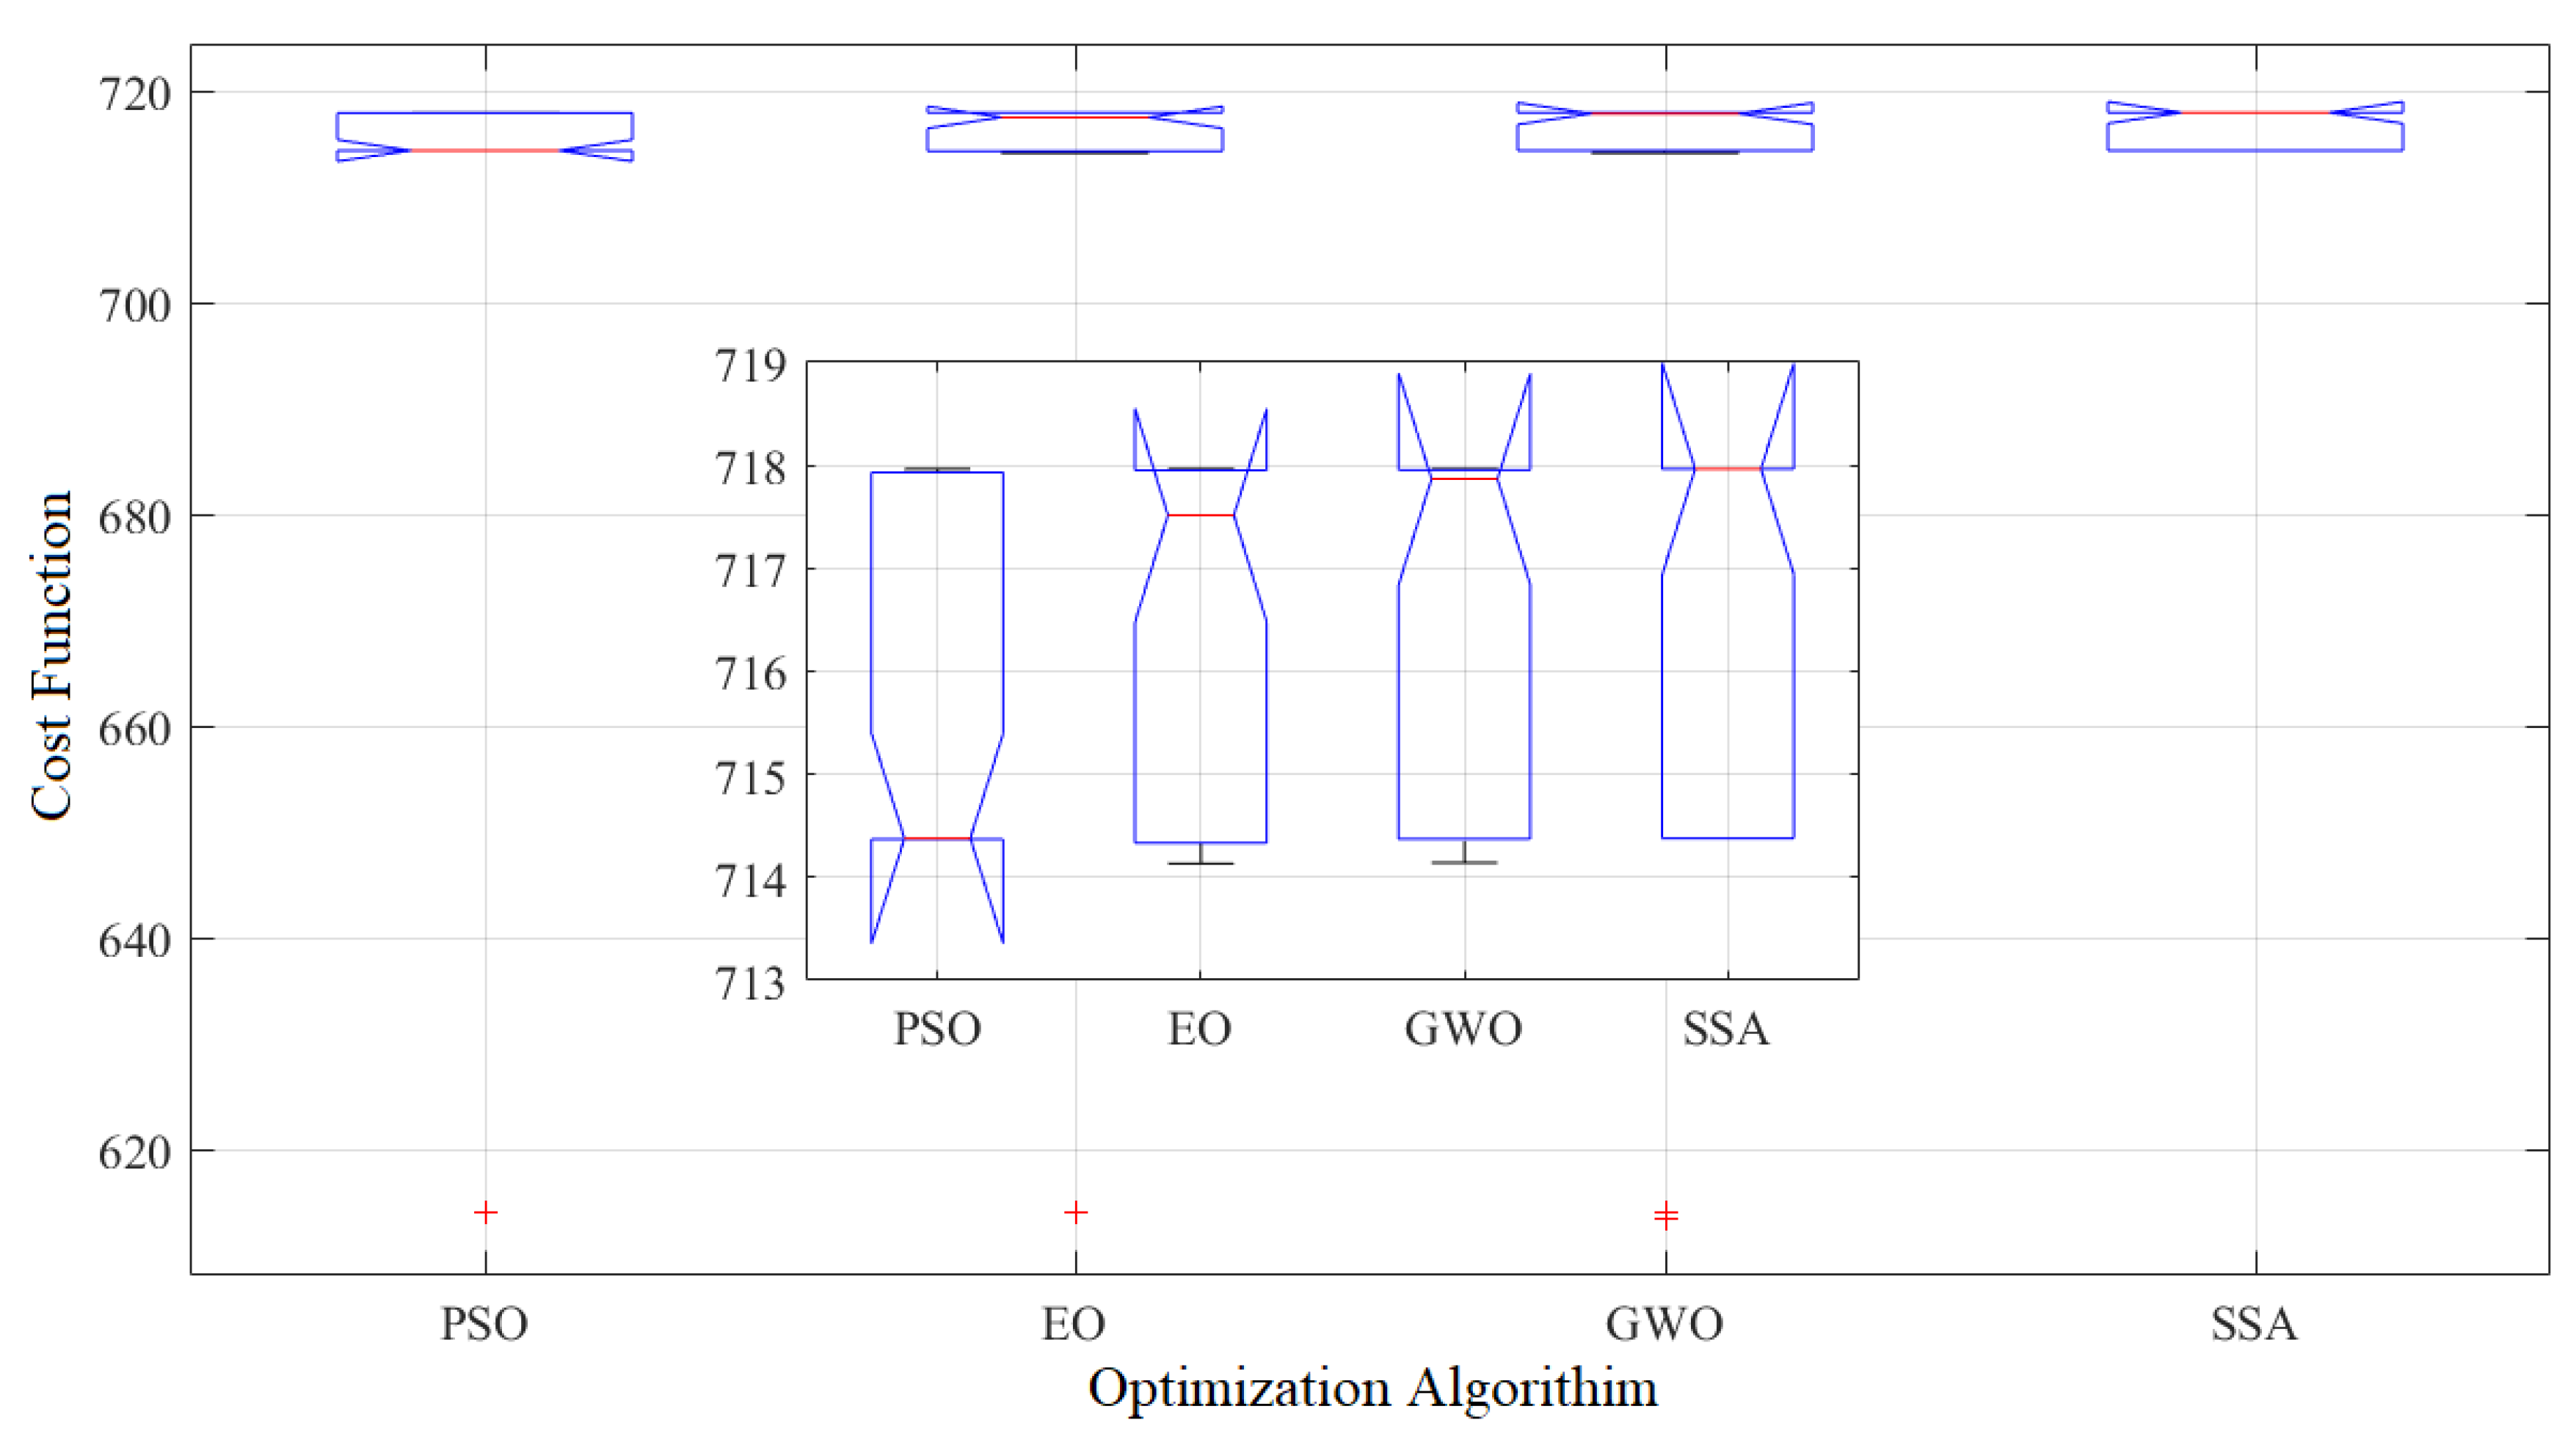
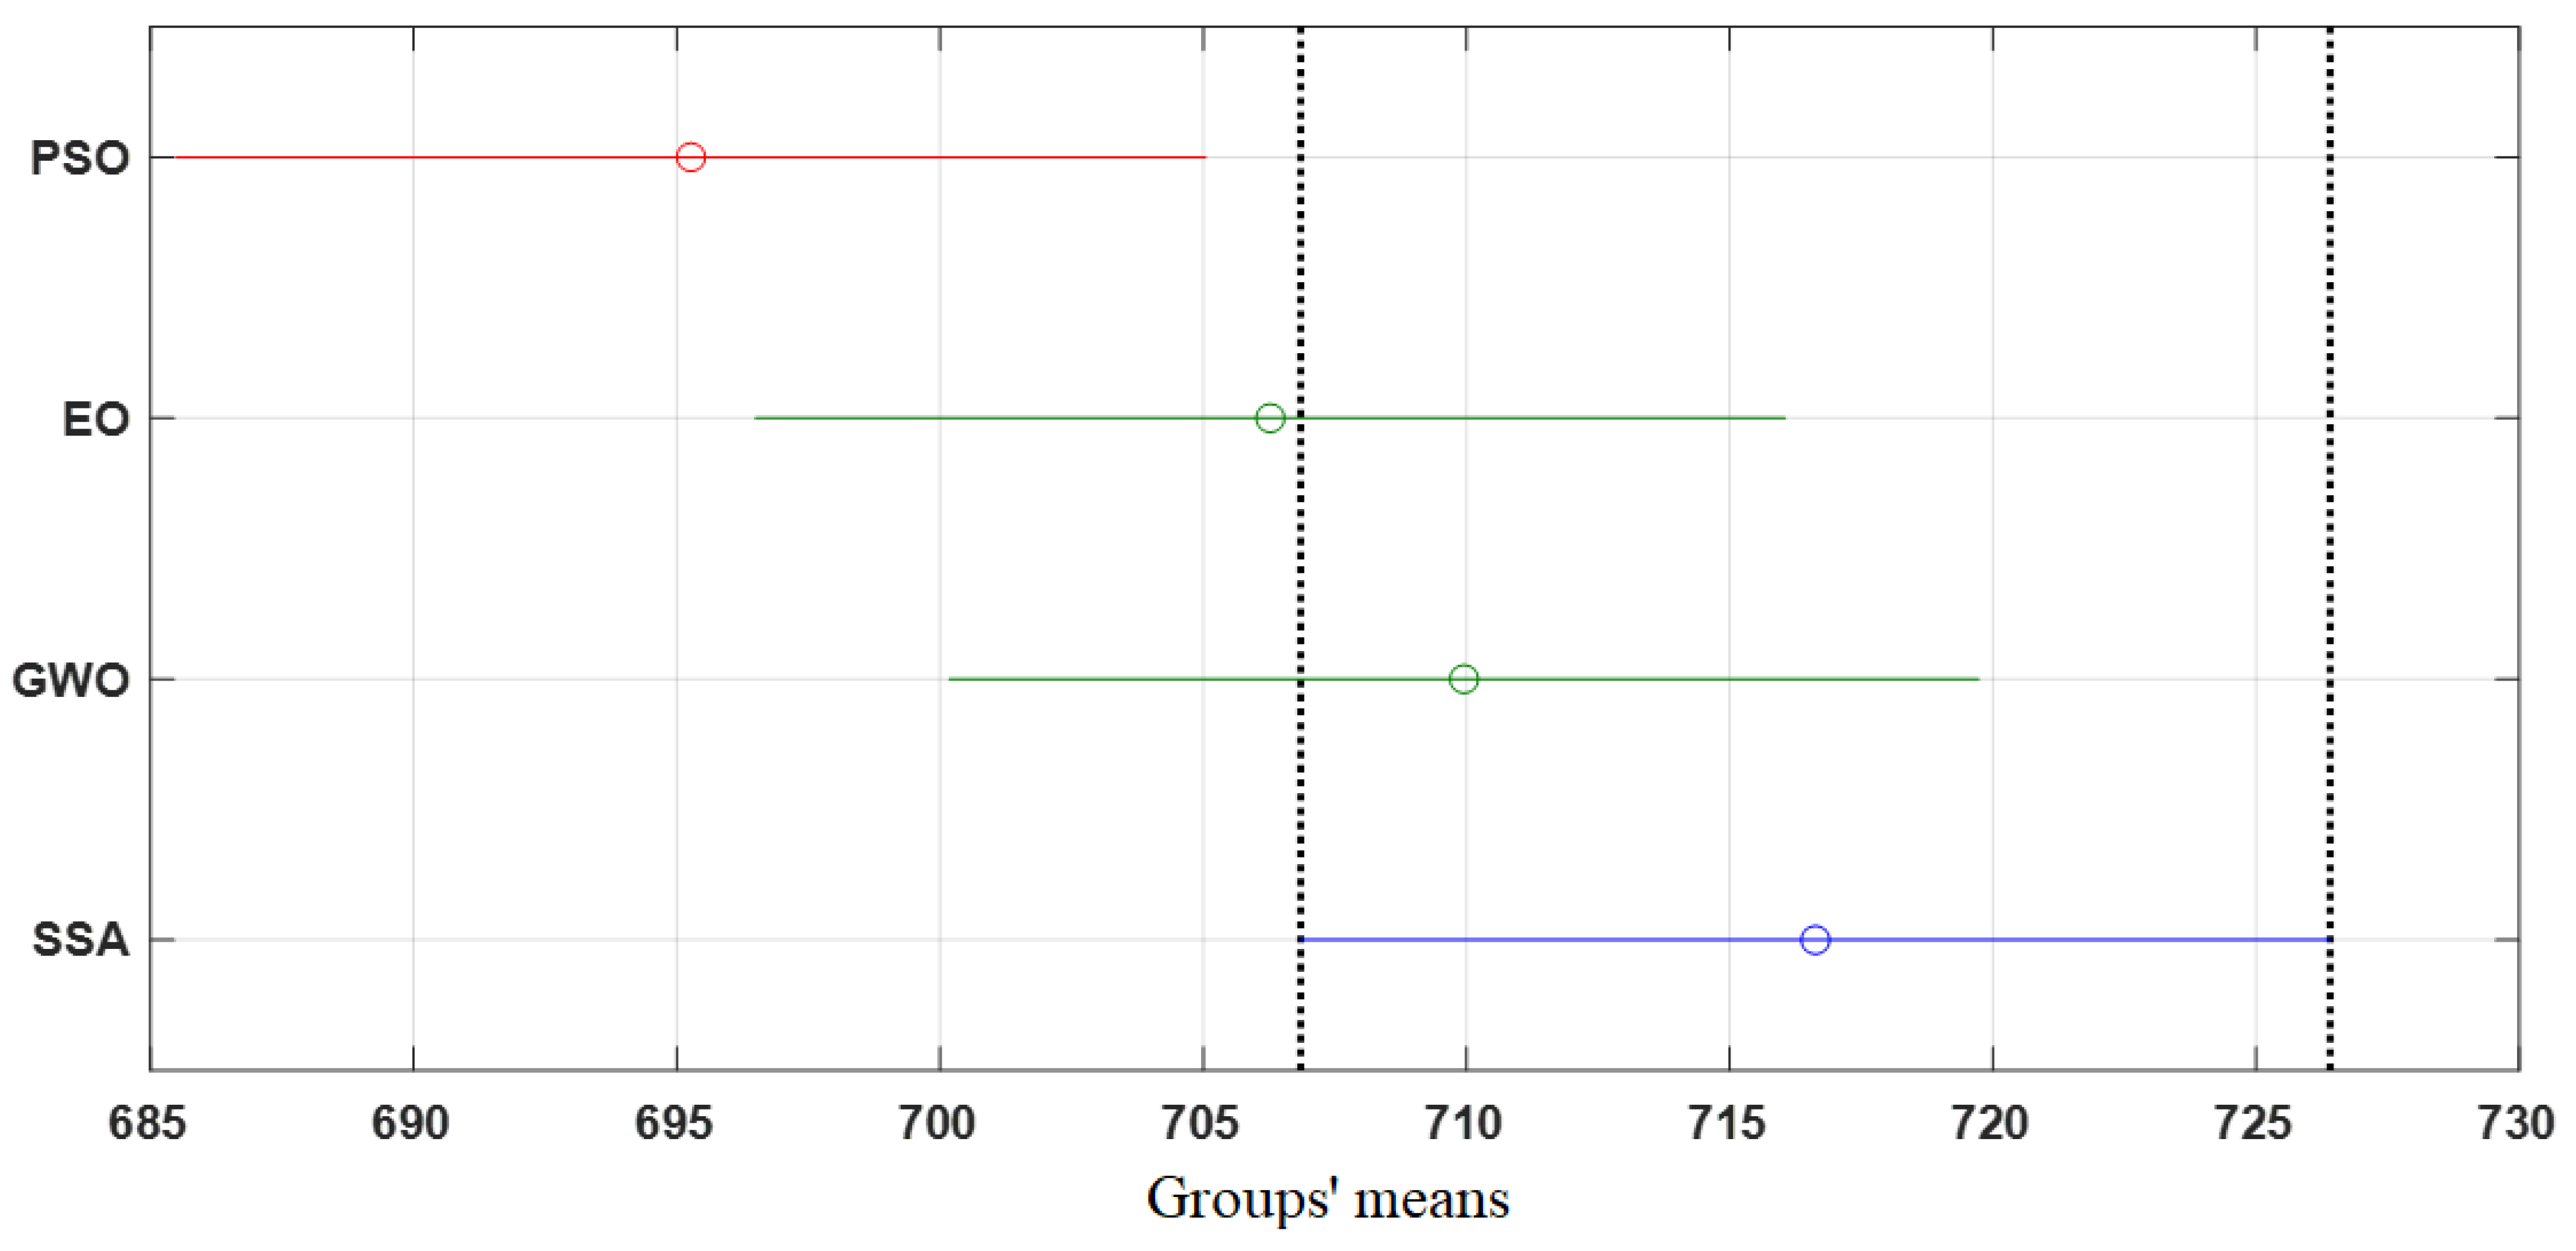
4.2. Parameter Identification Process
5. Conclusions
Author Contributions
Funding
Data Availability Statement
Acknowledgments
Conflicts of Interest
References
- Bhuiyan, M.R.A. Overcome the Future Environmental Challenges through Sustainable and Renewable Energy Resources. Micro Nano Lett. 2022, 17, 402–416. [Google Scholar] [CrossRef]
- Wang, Z.; Liu, Z.; Fan, L.; Du, Q.; Jiao, K. Application Progress of Small-Scale Proton Exchange Membrane Fuel Cell. Energy Rev. 2023, 2, 100017. [Google Scholar] [CrossRef]
- Al-Manea, A.; Al-Rbaihat, R.; Kadhim, H.T.; Alahmer, A.; Yusaf, T.; Egab, K. Experimental and Numerical Study to Develop TRANSYS Model for an Active Flat Plate Solar Collector with an Internally Serpentine Tube Receiver. Int. J. Thermofluids 2022, 15, 100189. [Google Scholar] [CrossRef]
- Zhang, H.; Sun, C.; Ge, M. Review of the Research Status of Cost-Effective Zinc–Iron Redox Flow Batteries. Batteries 2022, 8, 202. [Google Scholar] [CrossRef]
- Alahmer, A.; Ajib, S. Solar Cooling Technologies: State of Art and Perspectives. Energy Convers. Manag. 2020, 214, 112896. [Google Scholar] [CrossRef]
- Chen, L.; Xu, K.; Yang, Z.; Yan, Z.; Dong, Z. Optimal Design and Operation of Dual-Ejector PEMFC Hydrogen Supply and Circulation System. Energies 2022, 15, 5427. [Google Scholar] [CrossRef]
- Rezk, H.; Olabi, A.G.; Abdelkareem, M.A.; Alahmer, A.; Sayed, E.T. Maximizing Green Hydrogen Production from Water Electrocatalysis: Modeling and Optimization. J. Mar. Sci. Eng. 2023, 11, 617. [Google Scholar] [CrossRef]
- Wen, H.; Zhao, Z. How Does China’s Industrial Policy Affect Firms’ R&D Investment? Evidence from ‘Made in China 2025’. Appl. Econ. 2021, 53, 6333–6347. [Google Scholar]
- Behling, N.; Williams, M.C.; Managi, S. Fuel Cells and the Hydrogen Revolution: Analysis of a Strategic Plan in Japan. Econ. Anal. Policy 2015, 48, 204–221. [Google Scholar] [CrossRef]
- HAbIb, M.D.S.; Arefin, P.; Situmeang, R. Adoption of Hydrogen Fuel Cell Vehicles and Its Prospects for the Future. Orient. J. Chem. 2022, 38, 621. [Google Scholar] [CrossRef]
- Farghali, M.; Osman, A.I.; Mohamed, I.M.A.; Chen, Z.; Chen, L.; Ihara, I.; Yap, P.-S.; Rooney, D.W. Strategies to Save Energy in the Context of the Energy Crisis: A Review. Environ. Chem. Lett. 2023, 21, 2003–2039. [Google Scholar] [CrossRef] [PubMed]
- Wang, Y.; Yuan, H.; Martinez, A.; Hong, P.; Xu, H.; Bockmiller, F.R. Polymer Electrolyte Membrane Fuel Cell and Hydrogen Station Networks for Automobiles: Status, Technology, and Perspectives. Adv. Appl. Energy 2021, 2, 100011. [Google Scholar] [CrossRef]
- Benhammou, A.; Tedjini, H.; Hartani, M.A.; Ghoniem, R.M.; Alahmer, A. Accurate and Efficient Energy Management System of Fuel Cell/Battery/Supercapacitor/AC and DC Generators Hybrid Electric Vehicles. Sustainability 2023, 15, 10102. [Google Scholar] [CrossRef]
- Pramuanjaroenkij, A.; Kakaç, S. The Fuel Cell Electric Vehicles: The Highlight Review. Int. J. Hydrogen Energy 2023, 48, 9401–9425. [Google Scholar] [CrossRef]
- Mayyas, A.; Omar, M.; Pisu, P.; Mayyas, A.; Alahmer, A.; Montes, C. Thermal Modeling of an On-board Nickel-metal Hydride Pack in a Power-split Hybrid Configuration Using a Cell-based Resistance–Capacitance, Electro-thermal Model. Int. J. Energy Res. 2013, 37, 331–346. [Google Scholar] [CrossRef]
- Zhao, G.; Zhao, H.; Zhuang, X.; Shi, L.; Cheng, B.; Xu, X.; Yin, Y. Nanofiber Hybrid Membranes: Progress and Application in Proton Exchange Membranes. J. Mater. Chem. A 2021, 9, 3729–3766. [Google Scholar] [CrossRef]
- Sazali, N.; Wan Salleh, W.N.; Jamaludin, A.S.; Mhd Razali, M.N. New Perspectives on Fuel Cell Technology: A Brief Review. Membranes 2020, 10, 99. [Google Scholar] [CrossRef]
- Rasheed, R.K.A.; Liao, Q.; Caizhi, Z.; Chan, S.H. A Review on Modelling of High Temperature Proton Exchange Membrane Fuel Cells (HT-PEMFCs). Int. J. Hydrogen Energy 2017, 42, 3142–3165. [Google Scholar] [CrossRef]
- Mayyas, A.R.; Omar, M.; Pisu, P.; Al-Ahmer, A.; Mayyas, A.; Montes, C.; Dongri, S. Comprehensive Thermal Modeling of a Power-Split Hybrid Powertrain Using Battery Cell Model. J. Power Sources 2011, 196, 6588–6594. [Google Scholar] [CrossRef]
- Yang, Z.; Liu, Q.; Zhang, L.; Dai, J.; Razmjooy, N. Model Parameter Estimation of the PEMFCs Using Improved Barnacles Mating Optimization Algorithm. Energy 2020, 212, 118738. [Google Scholar] [CrossRef]
- Ghoniem, R.M.; Alahmer, A.; Rezk, H.; As’ad, S. Optimal Design and Sizing of Hybrid Photovoltaic/Fuel Cell Electrical Power System. Sustainability 2023, 15, 12026. [Google Scholar] [CrossRef]
- Thangarasu, S.; Oh, T.H. Progress in Poly (Phenylene Oxide) Based Cation Exchange Membranes for Fuel Cells and Redox Flow Batteries Applications. Int. J. Hydrogen Energy 2021, 46, 38381–38415. [Google Scholar] [CrossRef]
- Sadhasivam, T.; Palanisamy, G.; Roh, S.-H.; Kurkuri, M.D.; Kim, S.C.; Jung, H.-Y. Electro-Analytical Performance of Bifunctional Electrocatalyst Materials in Unitized Regenerative Fuel Cell System. Int. J. Hydrogen Energy 2018, 43, 18169–18184. [Google Scholar] [CrossRef]
- Liu, J.; Zhou, Z.; Yue, B.; Sun, Z.; Sun, Z. Chemical Looping Induced CH3OH–H2-PEMFC Scheme for Fuel Cell Vehicle: Parameter Optimization and Feasibility Analysis. J. Power Sources 2020, 479, 228790. [Google Scholar] [CrossRef]
- Li, S.; Peng, C.; Shen, Q.; Cheng, Y.; Wang, C.; Yang, G. Numerical Study on Thermal Stress of High Temperature Proton Exchange Membrane Fuel Cells during Start-Up Process. Membranes 2023, 13, 215. [Google Scholar] [CrossRef]
- Biswas, M.; Wilberforce, T. Dynamic Thermal Model Development of Direct Methanol Fuel Cell. Int. J. Thermofluids 2023, 17, 100294. [Google Scholar] [CrossRef]
- Zaffora, A.; Giordano, E.; Volanti, V.M.; Iannucci, L.; Grassini, S.; Gatto, I.; Santamaria, M. Effect of TiO2 and Al2O3 Addition on the Performance of Chitosan/Phosphotungstic Composite Membranes for Direct Methanol Fuel Cells. Membranes 2023, 13, 210. [Google Scholar] [CrossRef]
- Li, C.; He, Z.; Ban, X.; Li, N.; Chen, C.; Zhan, Z. Membrane-Based Catalytic Partial Oxidation of Ethanol Coupled with Steam Reforming for Solid Oxide Fuel Cells. J. Memb. Sci. 2021, 622, 119032. [Google Scholar] [CrossRef]
- Solovyev, A.; Shipilova, A.; Smolyanskiy, E. Solid Oxide Fuel Cells with Magnetron Sputtered Single-Layer SDC and Multilayer SDC/YSZ/SDC Electrolytes. Membranes 2023, 13, 585. [Google Scholar] [CrossRef]
- Hren, M.; Božič, M.; Fakin, D.; Kleinschek, K.S.; Gorgieva, S. Alkaline Membrane Fuel Cells: Anion Exchange Membranes and Fuels. Sustain. Energy Fuels 2021, 5, 604–637. [Google Scholar] [CrossRef]
- Vijayakumar, V.; Nam, S.Y. A Review of Recent Chitosan Anion Exchange Membranes for Polymer Electrolyte Membrane Fuel Cells. Membranes 2022, 12, 1265. [Google Scholar] [PubMed]
- Wilberforce, T.; Abdelkareem, M.A.; Elsaid, K.; Olabi, A.G.; Sayed, E.T. Role of Carbon-Based Nanomaterials in Improving the Performance of Microbial Fuel Cells. Energy 2022, 240, 122478. [Google Scholar]
- Roy, H.; Rahman, T.U.; Tasnim, N.; Arju, J.; Rafid, M.M.; Islam, M.R.; Pervez, M.N.; Cai, Y.; Naddeo, V.; Islam, M.S. Microbial Fuel Cell Construction Features and Application for Sustainable Wastewater Treatment. Membranes 2023, 13, 490. [Google Scholar]
- Dresch, M.A.; Matos, B.R.; Godoi, D.R.M.; Linardi, M.; Fonseca, F.C.; de las Mercedes Villullas, H.; Santiago, E.I. Advancing Direct Ethanol Fuel Cell Operation at Intermediate Temperature by Combining Nafion-Hybrid Electrolyte and Well-Alloyed PtSn/C Electrocatalyst. Int. J. Hydrogen Energy 2021, 46, 13252–13264. [Google Scholar]
- Herranz, D.; Coppola, R.E.; Escudero-Cid, R.; Ochoa-Romero, K.; D’Accorso, N.B.; Pérez-Flores, J.C.; Canales-Vázquez, J.; Palacio, C.; Abuin, G.C.; Ocón, P. Application of Crosslinked Polybenzimidazole-Poly (Vinyl Benzyl Chloride) Anion Exchange Membranes in Direct Ethanol Fuel Cells. Membranes 2020, 10, 349. [Google Scholar]
- Wilailak, S.; Yang, J.-H.; Heo, C.-G.; Kim, K.-S.; Bang, S.-K.; Seo, I.-H.; Zahid, U.; Lee, C.-J. Thermo-Economic Analysis of Phosphoric Acid Fuel-Cell (PAFC) Integrated with Organic Ranking Cycle (ORC). Energy 2021, 220, 119744. [Google Scholar]
- Sithambaranathan, P.; Nasef, M.M.; Ahmad, A.; Abbasi, A.; Ting, T.M. Composite Proton-Conducting Membrane with Enhanced Phosphoric Acid Doping of Basic Films Radiochemically Grafted with Binary Vinyl Heterocyclic Monomer Mixtures. Membranes 2023, 13, 105. [Google Scholar]
- Lysik, A.; Cwieka, K.; Wejrzanowski, T.; Skibinski, J.; Milewski, J.; Marques, F.M.B.; Norby, T.; Xing, W. Silver Coated Cathode for Molten Carbonate Fuel Cells. Int. J. Hydrogen Energy 2020, 45, 19847–19857. [Google Scholar]
- Regmi, Y.N.; Peng, X.; Fornaciari, J.C.; Wei, M.; Myers, D.J.; Weber, A.Z.; Danilovic, N. A Low Temperature Unitized Regenerative Fuel Cell Realizing 60% Round Trip Efficiency and 10000 Cycles of Durability for Energy Storage Applications. Energy Environ. Sci. 2020, 13, 2096–2105. [Google Scholar]
- Low, H.C.; Lim, B.H. Numerical Analysis of the Effect of Liquid Water during Switching Mode for Unitised Regenerative Proton Exchange Membrane Fuel Cell. Membranes 2023, 13, 391. [Google Scholar]
- Elsaid, K.; Abdelfatah, S.; Elabsir, A.M.A.; Hassiba, R.J.; Ghouri, Z.K.; Vechot, L. Direct Alcohol Fuel Cells: Assessment of the Fuel’s Safety and Health Aspects. Int. J. Hydrogen Energy 2021, 46, 30658–30668. [Google Scholar] [CrossRef]
- Fernández-Nieto, A.; Muñoz, S.; Barragán, V.M. Alcohol Diffusion in Alkali-Metal-Doped Polymeric Membranes for Using in Alkaline Direct Alcohol Fuel Cells. Membranes 2022, 12, 666. [Google Scholar] [CrossRef] [PubMed]
- Zhu, Z.; Ma, C.; Zhang, Y.-H.P. Co-Utilization of Mixed Sugars in an Enzymatic Fuel Cell Based on an in Vitro Enzymatic Pathway. Electrochim. Acta 2018, 263, 184–191. [Google Scholar] [CrossRef]
- Ferrari, I.V.; Pasquini, L.; Narducci, R.; Sgreccia, E.; Di Vona, M.L.; Knauth, P. A Short Overview of Biological Fuel Cells. Membranes 2022, 12, 427. [Google Scholar] [CrossRef]
- Baronia, R.; Goel, J.; Kataria, V.; Basu, S.; Singhal, S.K. Electro-Oxidation of Ethylene Glycol on PtCo Metal Synergy for Direct Ethylene Glycol Fuel Cells: Reduced Graphene Oxide Imparting a Notable Surface of Action. Int. J. Hydrogen Energy 2019, 44, 10023–10032. [Google Scholar] [CrossRef]
- Jafri, N.; Wong, W.Y.; Yoon, L.W.; Cheah, K.H. Pretreated Mesocarp Fibre Biochars as Carbon Fuel for Direct Carbon Fuel Cells. Int. J. Hydrogen Energy 2021, 46, 16762–16775. [Google Scholar] [CrossRef]
- Ng, W.W.; Thiam, H.S.; Pang, Y.L.; Chong, K.C.; Lai, S.O. A State-of-Art on the Development of Nafion-Based Membrane for Performance Improvement in Direct Methanol Fuel Cells. Membranes 2022, 12, 506. [Google Scholar] [CrossRef]
- Alaswad, A.; Omran, A.; Sodre, J.R.; Wilberforce, T.; Pignatelli, G.; Dassisti, M.; Baroutaji, A.; Olabi, A.G. Technical and Commercial Challenges of Proton-Exchange Membrane (PEM) Fuel Cells. Energies 2020, 14, 144. [Google Scholar] [CrossRef]
- Deluca, N.W.; Elabd, Y.A. Polymer Electrolyte Membranes for the Direct Methanol Fuel Cell: A Review. J. Polym. Sci. Part B Polym. Phys. 2006, 44, 2201–2225. [Google Scholar] [CrossRef]
- Pan, M.; Pan, C.; Li, C.; Zhao, J. A Review of Membranes in Proton Exchange Membrane Fuel Cells: Transport Phenomena, Performance and Durability. Renew. Sustain. Energy Rev. 2021, 141, 110771. [Google Scholar]
- Mariappan, R.P.; Liu, C.; Cao, G.; Manimuthu, R.P. Tailoring SPEEK/SPVdF-Co-HFP/La2Zr2O7 Ternary Composite Membrane for Cation Exchange Membrane Fuel Cells. Ind. Eng. Chem. Res. 2020, 59, 4881–4894. [Google Scholar] [CrossRef]
- Li, T.; Shen, J.; Chen, G.; Guo, S.; Xie, G. Performance Comparison of Proton Exchange Membrane Fuel Cells with Nafion and Aquivion Perfluorosulfonic Acids with Different Equivalent Weights as the Electrode Binders. ACS Omega 2020, 5, 17628–17636. [Google Scholar] [CrossRef] [PubMed]
- Ogungbemi, E.; Ijaodola, O.; Khatib, F.N.; Wilberforce, T.; El Hassan, Z.; Thompson, J.; Ramadan, M.; Olabi, A.G. Fuel cell membranes—Pros and cons. Energy 2019, 172, 155–172. [Google Scholar] [CrossRef]
- Yoon, S.; Ahmed, F.; Zhang, W.; Ryu, T.; Jin, L.; Kim, D.; Kim, W.; Jang, H. Flexible Blend Polymer Electrolyte Membranes with Excellent Conductivity for Fuel Cells. Int. J. Hydrogen Energy 2020, 45, 27611–27621. [Google Scholar] [CrossRef]
- Duan, Y.; Liu, H.; Zhang, W.; Khotseng, L.; Xu, Q.; Su, H. Materials, Components, Assembly and Performance of Flexible Polymer Electrolyte Membrane Fuel Cell: A Review. J. Power Sources 2023, 555, 232369. [Google Scholar] [CrossRef]
- Lee, H.-J.; Kim, J.-H.; Won, J.-H.; Lim, J.-M.; Hong, Y.T.; Lee, S.-Y. Highly Flexible, Proton-Conductive Silicate Glass Electrolytes for Medium-Temperature/Low-Humidity Proton Exchange Membrane Fuel Cells. ACS Appl. Mater. Interfaces 2013, 5, 5034–5043. [Google Scholar] [CrossRef] [PubMed]
- Li, X.; Chao, T.; Duan, Y.; Qu, Y.; Liu, Y.; Tan, Q. High-Performance, Stable, and Flexible Direct Methanol Fuel Cell Based on a Pre-Swelling Kalium Polyacrylate Gel Electrolyte and Single-Atom Cathode Catalyst. ACS Sustain. Chem. Eng. 2021, 9, 15138–15146. [Google Scholar] [CrossRef]
- Hamidi, S.; Haghighi, S.; Askari, K. Dataset of Standard Tests of Nafion 112 Membrane and Membrane Electrode Assembly (MEA) Activation Tests of Proton Exchange Membrane (PEM) Fuel Cell. ChemRxiv 2020. [Google Scholar] [CrossRef]
- Rezk, H.; Alahmer, A.; Ghoniem, R.M.; As’ad, S. Boosting CO2 Uptake from Waste Concrete Powder Using Artificial Intelligence and the Marine Predators Algorithm. Processes 2023, 11, 2655. [Google Scholar] [CrossRef]
- Mirjalili, S.; Gandomi, A.H.; Mirjalili, S.Z.; Saremi, S.; Faris, H.; Mirjalili, S.M. Salp Swarm Algorithm: A Bio-Inspired Optimizer for Engineering Design Problems. Adv. Eng. Softw. 2017, 114, 163–191. [Google Scholar] [CrossRef]
- Yan, S.; Yang, M.; Sun, C.; Xu, S. Liquid Water Characteristics in the Compressed Gradient Porosity Gas Diffusion Layer of Proton Exchange Membrane Fuel Cells Using the Lattice Boltzmann Method. Energies 2023, 16, 6010. [Google Scholar] [CrossRef]


| RMSE | Coefficient of Determination (R2) | ||||
|---|---|---|---|---|---|
| Train | Test | All | Train | Test | All |
| 0.0003 | 24.5 | 11.5535 | 1.0 | 0.9598 | 0.9914 |
| Method | Pressure | Relative Humidity | Membrane Compression | Power Density mW/cm2 |
|---|---|---|---|---|
| Measured | 25 | 80 | 5 | 716 |
| ANFIS and SSA | 1.0 (N *) | 0.82 (N *) | 0.308 (N *) | 717.96 |
| 25 | 82 | 5.544 |
| PSO | EO | GWO | SSA | |
|---|---|---|---|---|
| Maximum | 717.97 | 717.97 | 717.97 | 717.97 |
| Minimum | 614.05 | 614.04 | 613.39 | 714.38 |
| Average | 695.27 | 706.27 | 709.95 | 716.63 |
| STD | 40.63 | 30.78 | 25.77 | 1.72 |
| median | 714.38 | 717.51 | 717.87 | 717.97 |
| variance | 1651.05 | 947.67 | 663.86 | 2.94 |
| Run | PSO | EO | GWO | SSA | Run | PSO | EO | GWO | SSA |
|---|---|---|---|---|---|---|---|---|---|
| 1 | 717.96 | 614.06 | 717.94 | 714.38 | 16 | 717.96 | 717.96 | 714.34 | 717.97 |
| 2 | 614.06 | 717.7 | 717.95 | 717.97 | 17 | 714.38 | 717.58 | 717.87 | 717.97 |
| 3 | 717.97 | 714.33 | 714.38 | 714.38 | 18 | 714.38 | 717.96 | 717.26 | 717.97 |
| 4 | 714.38 | 614.04 | 717.93 | 717.38 | 19 | 614.06 | 717.95 | 714.38 | 717.97 |
| 5 | 717.95 | 714.36 | 717.95 | 717.97 | 20 | 714.38 | 717.63 | 717.76 | 714.38 |
| 6 | 614.05 | 714.3 | 714.37 | 714.38 | 21 | 714.38 | 717.96 | 613.39 | 717.97 |
| 7 | 614.06 | 714.33 | 717.87 | 714.38 | 22 | 714.37 | 717.93 | 717.96 | 717.97 |
| 8 | 717.96 | 717.94 | 717.96 | 714.38 | 23 | 614.06 | 717.65 | 717.78 | 714.38 |
| 9 | 714.38 | 717.97 | 717.9 | 717.97 | 24 | 714.38 | 717.94 | 714.14 | 717.97 |
| 10 | 717.97 | 714.38 | 717.97 | 717.95 | 25 | 714.37 | 717.33 | 717.97 | 714.38 |
| 11 | 714.38 | 714.37 | 714.34 | 717.97 | 26 | 717.93 | 717.45 | 716.73 | 714.38 |
| 12 | 714.38 | 714.33 | 714.33 | 714.38 | 27 | 717.97 | 717.96 | 717.95 | 717.95 |
| 13 | 714.38 | 714.14 | 717.96 | 717.97 | 28 | 714.38 | 714.34 | 717.97 | 717.97 |
| 14 | 614.06 | 717.96 | 614.06 | 714.38 | 29 | 714.38 | 714.35 | 717.94 | 717.97 |
| 15 | 714.37 | 614.04 | 714.37 | 717.97 | 30 | 714.38 | 717.96 | 717.94 | 717.97 |
| Source | df | SS | MS | F | Prob |
|---|---|---|---|---|---|
| Columns | 3 | 7188.6 | 2396.2 | 2.84 | 0.014 |
| Error | 116 | 97,965.7 | 844.5 | ||
| Total | 119 | 105,154.3 |
| Method | Pressure | Relative Humidity | Membrane Compression | Power Density W/cm2 |
|---|---|---|---|---|
| 5% | 1.05 | 0.82 (N *) | 0.308 (N *) | 730.27 |
| 26.5 | 82 | 5.544 | ||
| 10% | 1.1 | 0.82 (N *) | 0.308 (N *) | 742.93 |
| 27.5 | 82 | 5.544 |
Disclaimer/Publisher’s Note: The statements, opinions and data contained in all publications are solely those of the individual author(s) and contributor(s) and not of MDPI and/or the editor(s). MDPI and/or the editor(s) disclaim responsibility for any injury to people or property resulting from any ideas, methods, instructions or products referred to in the content. |
© 2023 by the authors. Licensee MDPI, Basel, Switzerland. This article is an open access article distributed under the terms and conditions of the Creative Commons Attribution (CC BY) license (https://creativecommons.org/licenses/by/4.0/).
Share and Cite
Ghoniem, R.M.; Wilberforce, T.; Rezk, H.; As’ad, S.; Alahmer, A. Boosting Power Density of Proton Exchange Membrane Fuel Cell Using Artificial Intelligence and Optimization Algorithms. Membranes 2023, 13, 817. https://doi.org/10.3390/membranes13100817
Ghoniem RM, Wilberforce T, Rezk H, As’ad S, Alahmer A. Boosting Power Density of Proton Exchange Membrane Fuel Cell Using Artificial Intelligence and Optimization Algorithms. Membranes. 2023; 13(10):817. https://doi.org/10.3390/membranes13100817
Chicago/Turabian StyleGhoniem, Rania M., Tabbi Wilberforce, Hegazy Rezk, Samer As’ad, and Ali Alahmer. 2023. "Boosting Power Density of Proton Exchange Membrane Fuel Cell Using Artificial Intelligence and Optimization Algorithms" Membranes 13, no. 10: 817. https://doi.org/10.3390/membranes13100817
APA StyleGhoniem, R. M., Wilberforce, T., Rezk, H., As’ad, S., & Alahmer, A. (2023). Boosting Power Density of Proton Exchange Membrane Fuel Cell Using Artificial Intelligence and Optimization Algorithms. Membranes, 13(10), 817. https://doi.org/10.3390/membranes13100817