
In Situ Generation of Fouling Resistant Ag/Pd Modified PES Membranes for Treatment of Pharmaceutical Wastewater


Abstract
:1. Introduction
2. Materials and Methods
2.1. Materials
2.2. Membrane Fabrication
2.3. Membrane Characterization
2.3.1. Scanning Electron Microscopy (SEM) and Energy Dispersive X-Ray Spectroscopy (EDS)
2.3.2. Atomic Force Microscopy (AFM)
2.3.3. Contact Angle (CA)
2.3.4. Transmission Electron Microscopy (TEM)
2.3.5. Thermo-Gravimetric Analysis (TGA)
2.3.6. Fourier Transform Infrared Spectroscopy (FTIR)
2.3.7. Zeta Potential Measurements
2.3.8. Measurement of Porosity and Mean Pore Radius
2.4. Filtration Experiments and EOC Rejection
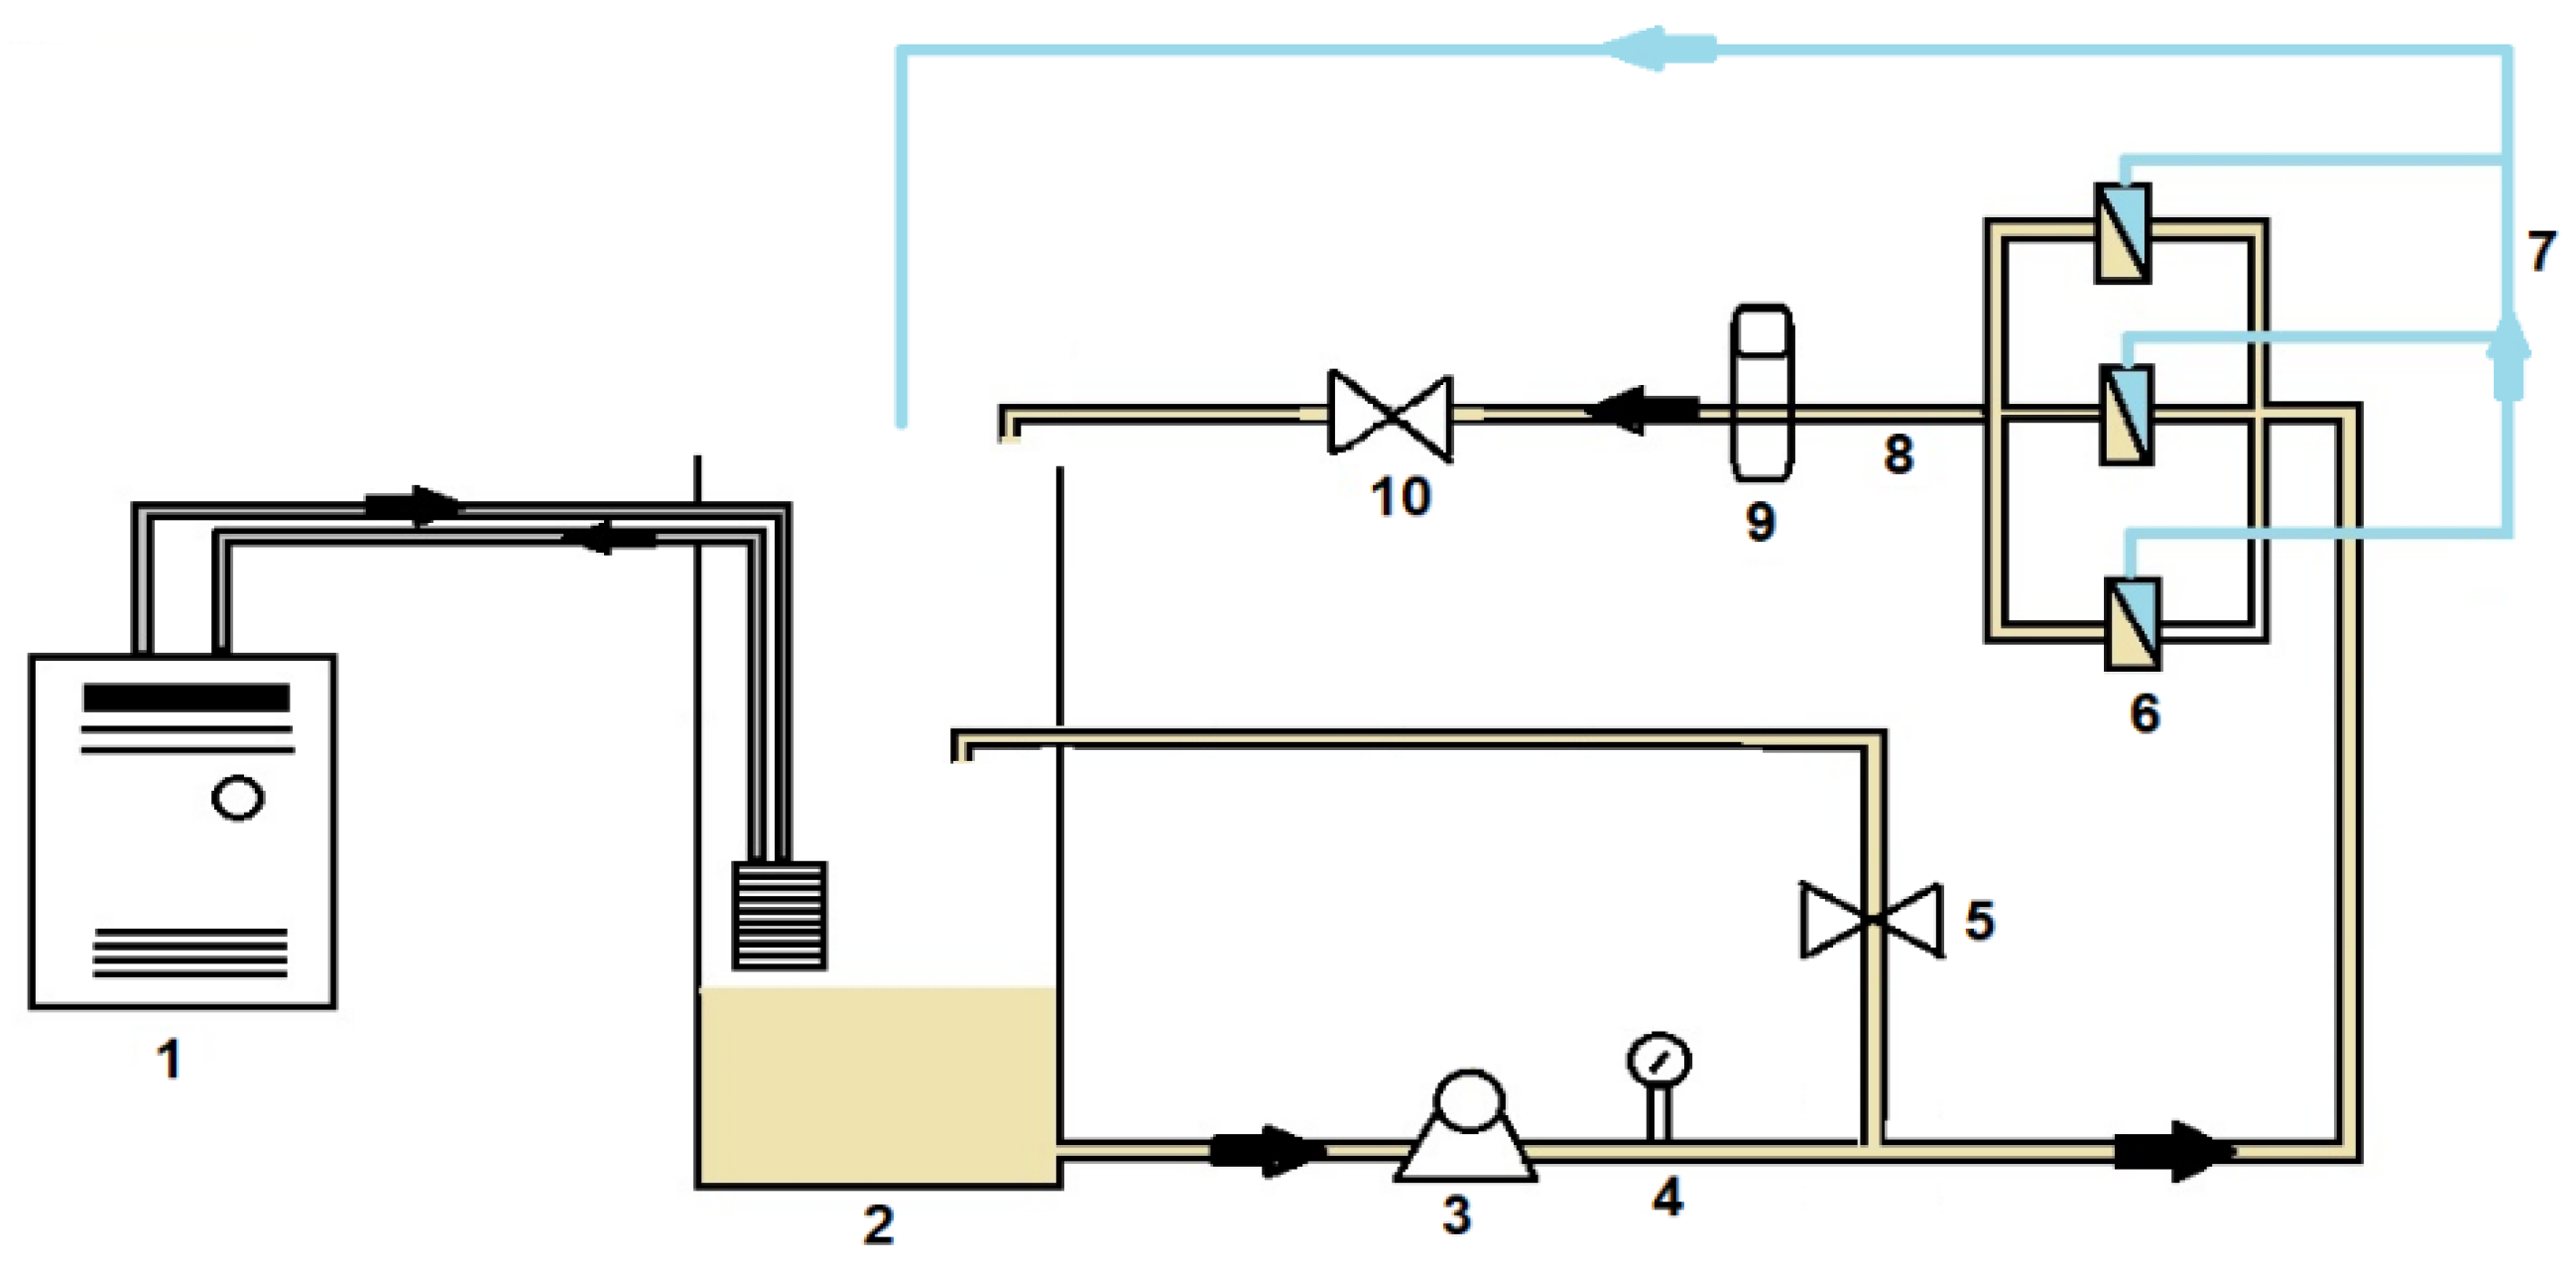
2.4.1. Filtration Setup
2.4.2. Selection of EOCs and Analysis
2.5. Fouling Experiments
2.6. Investigation of Nanoparticle Leaching
3. Results and Discussion
3.1. Membrane Characteristics
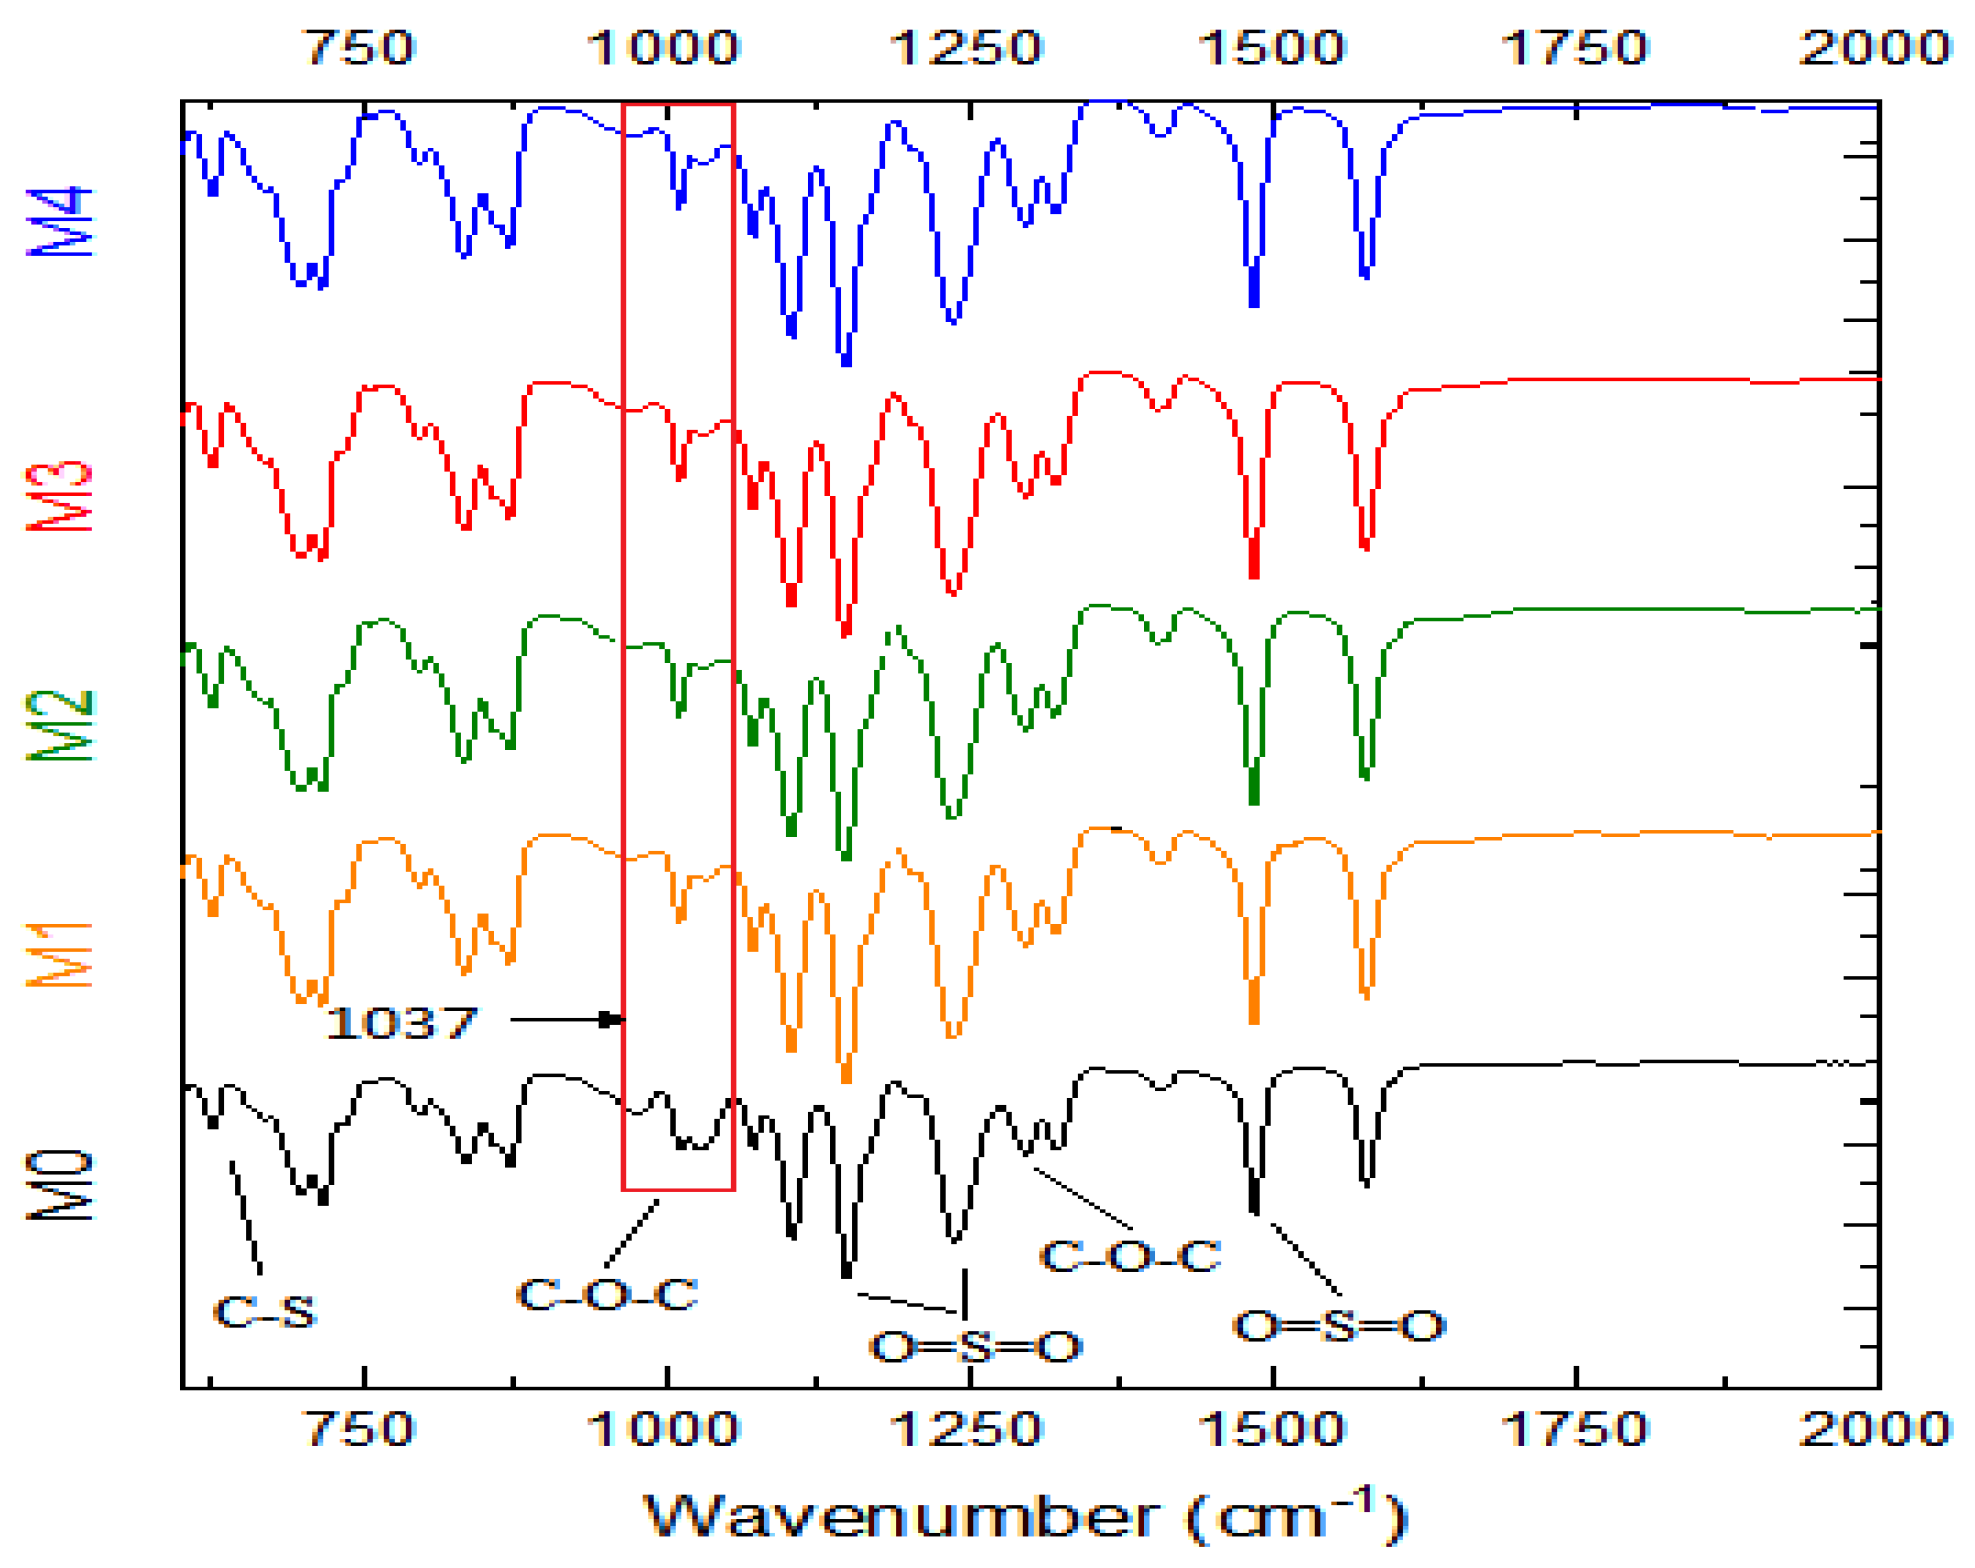
3.1.1. FTIR
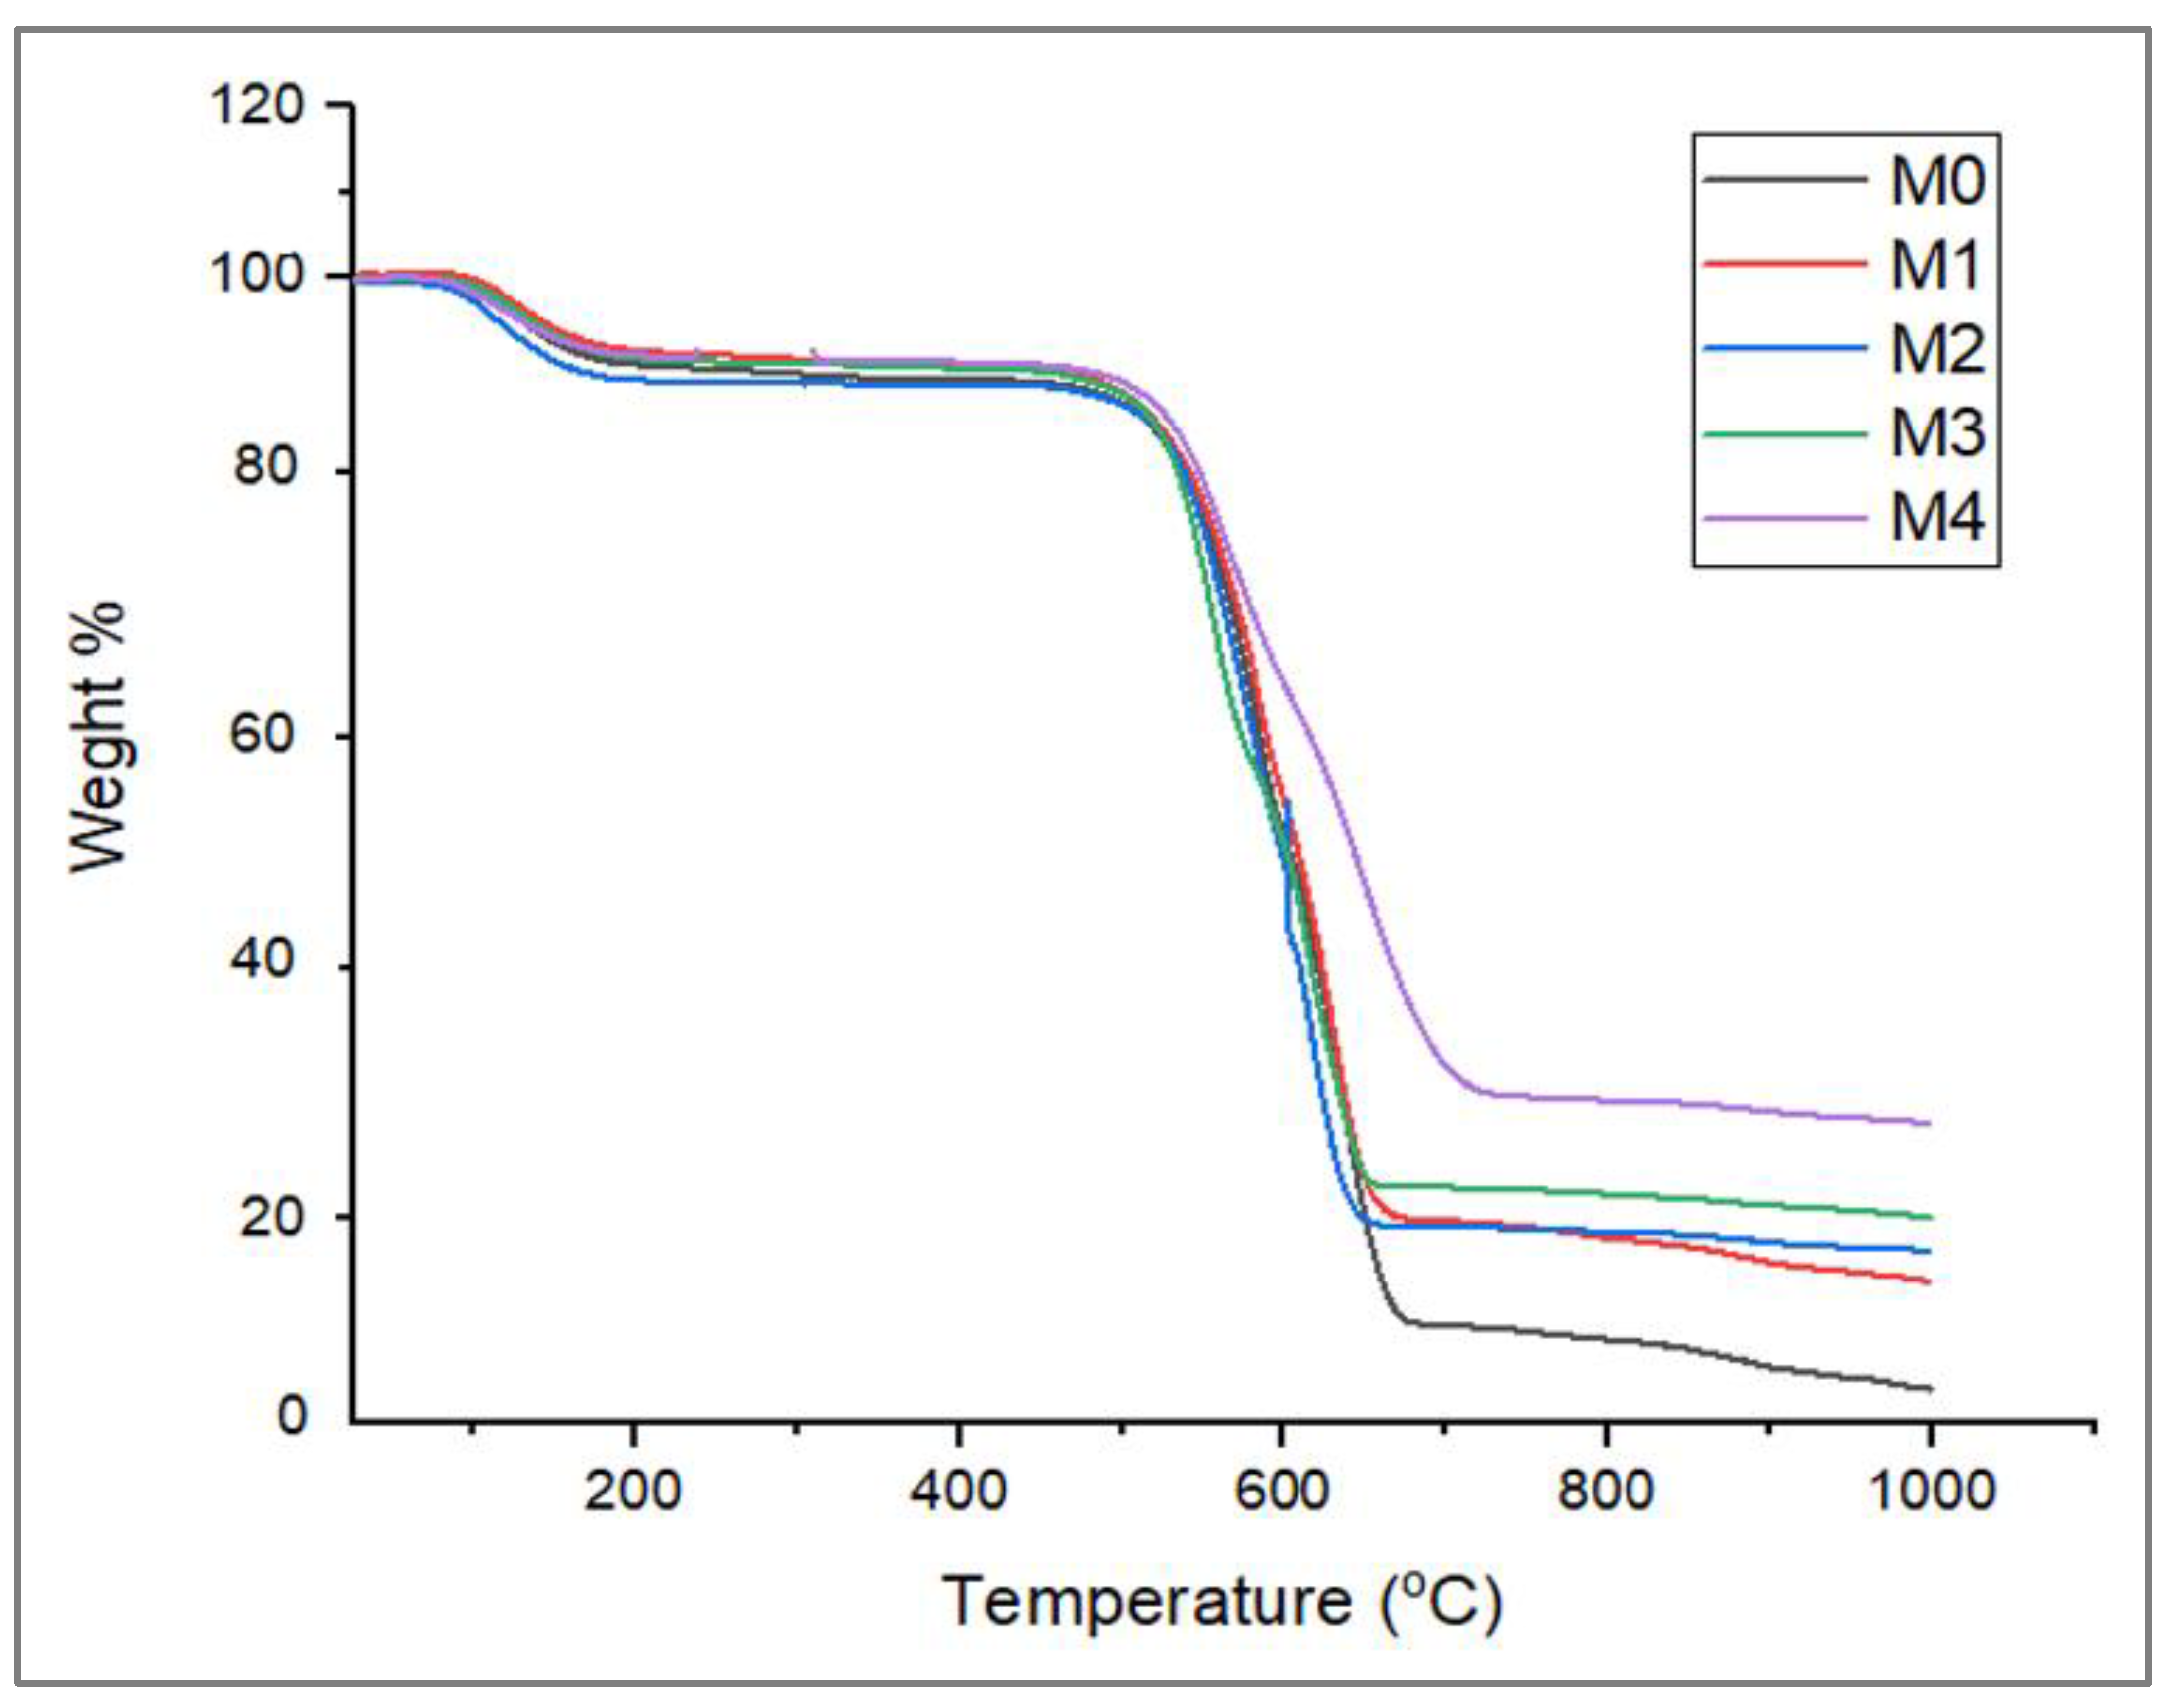
3.1.2. TGA
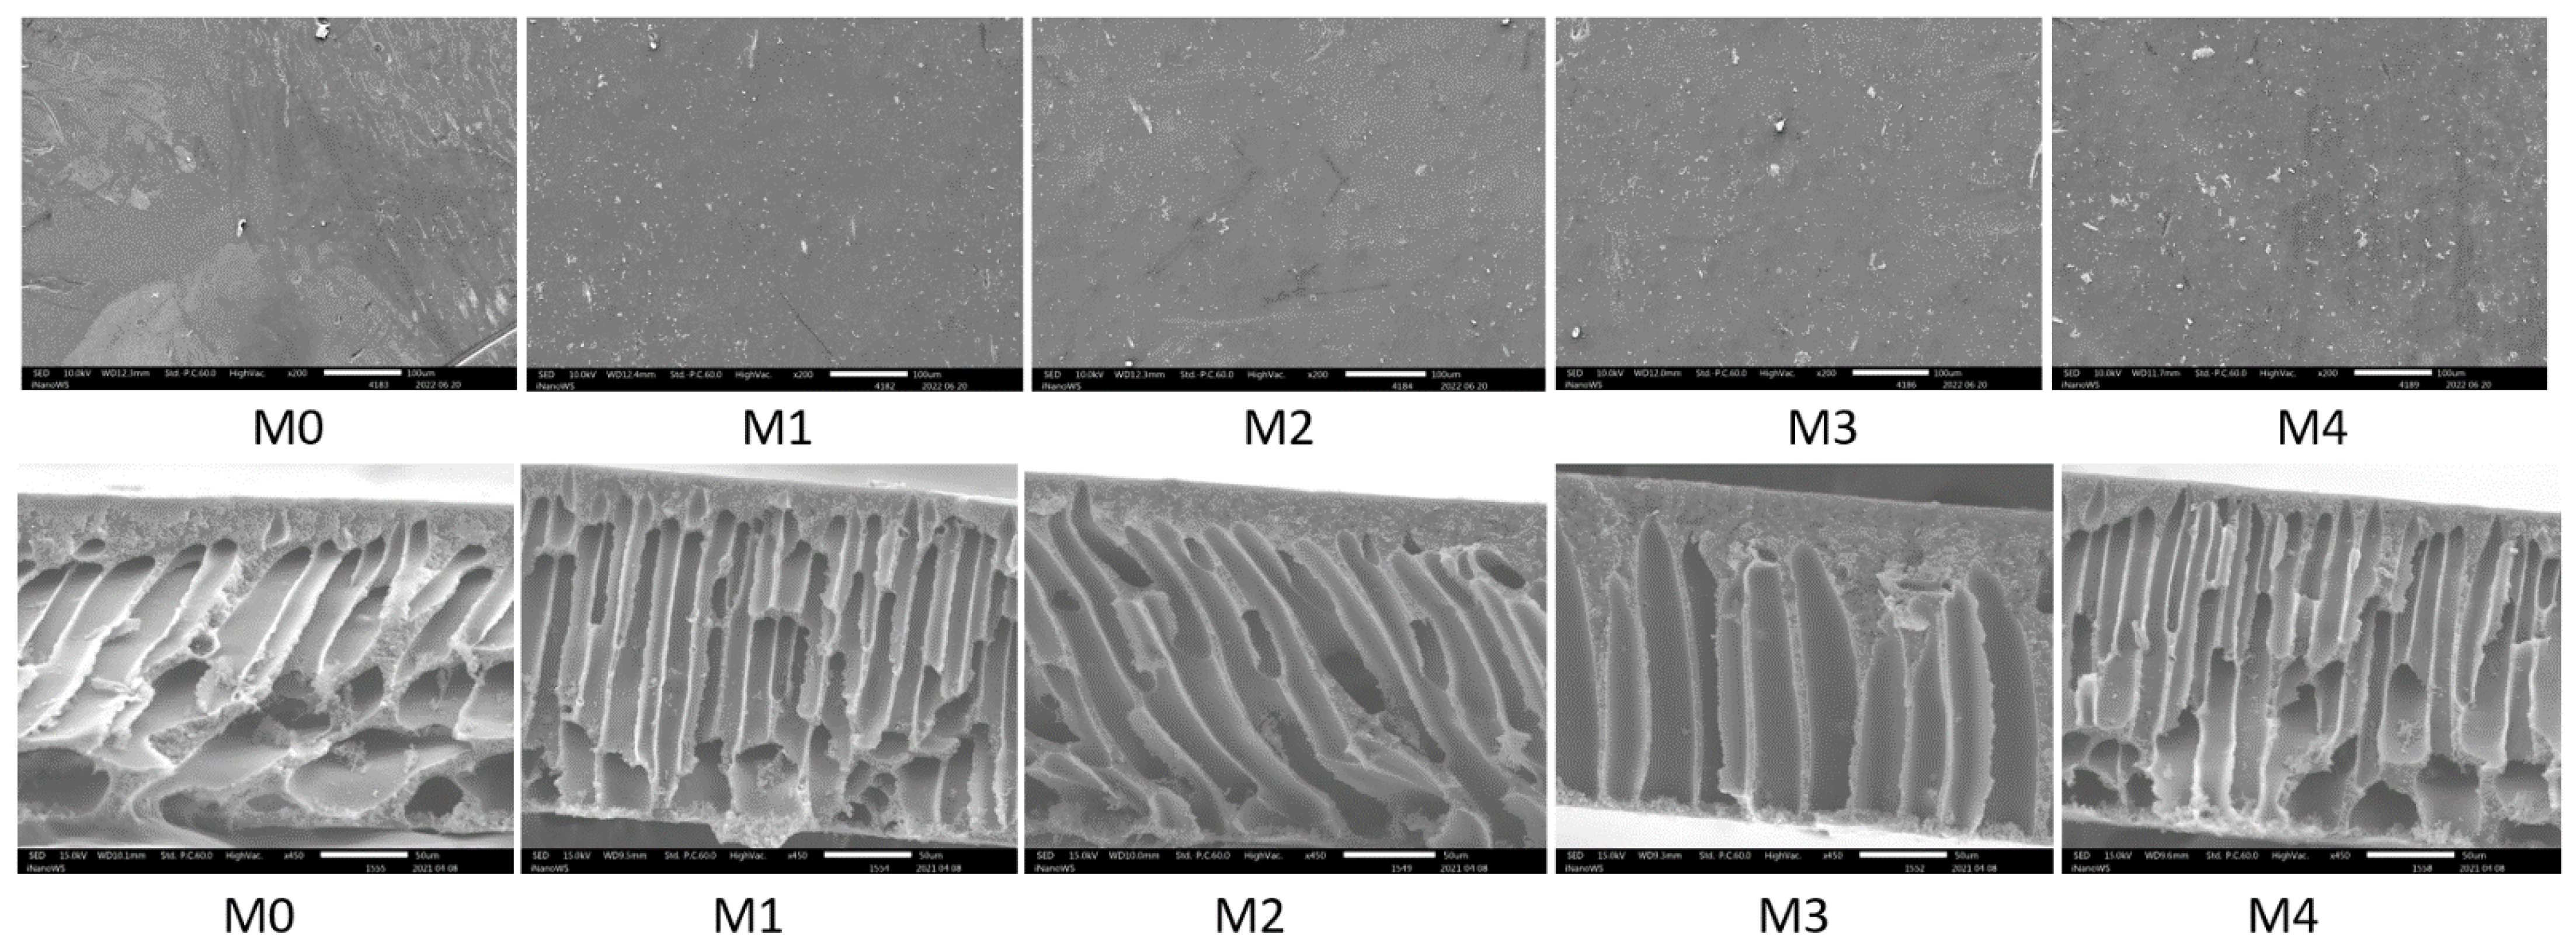
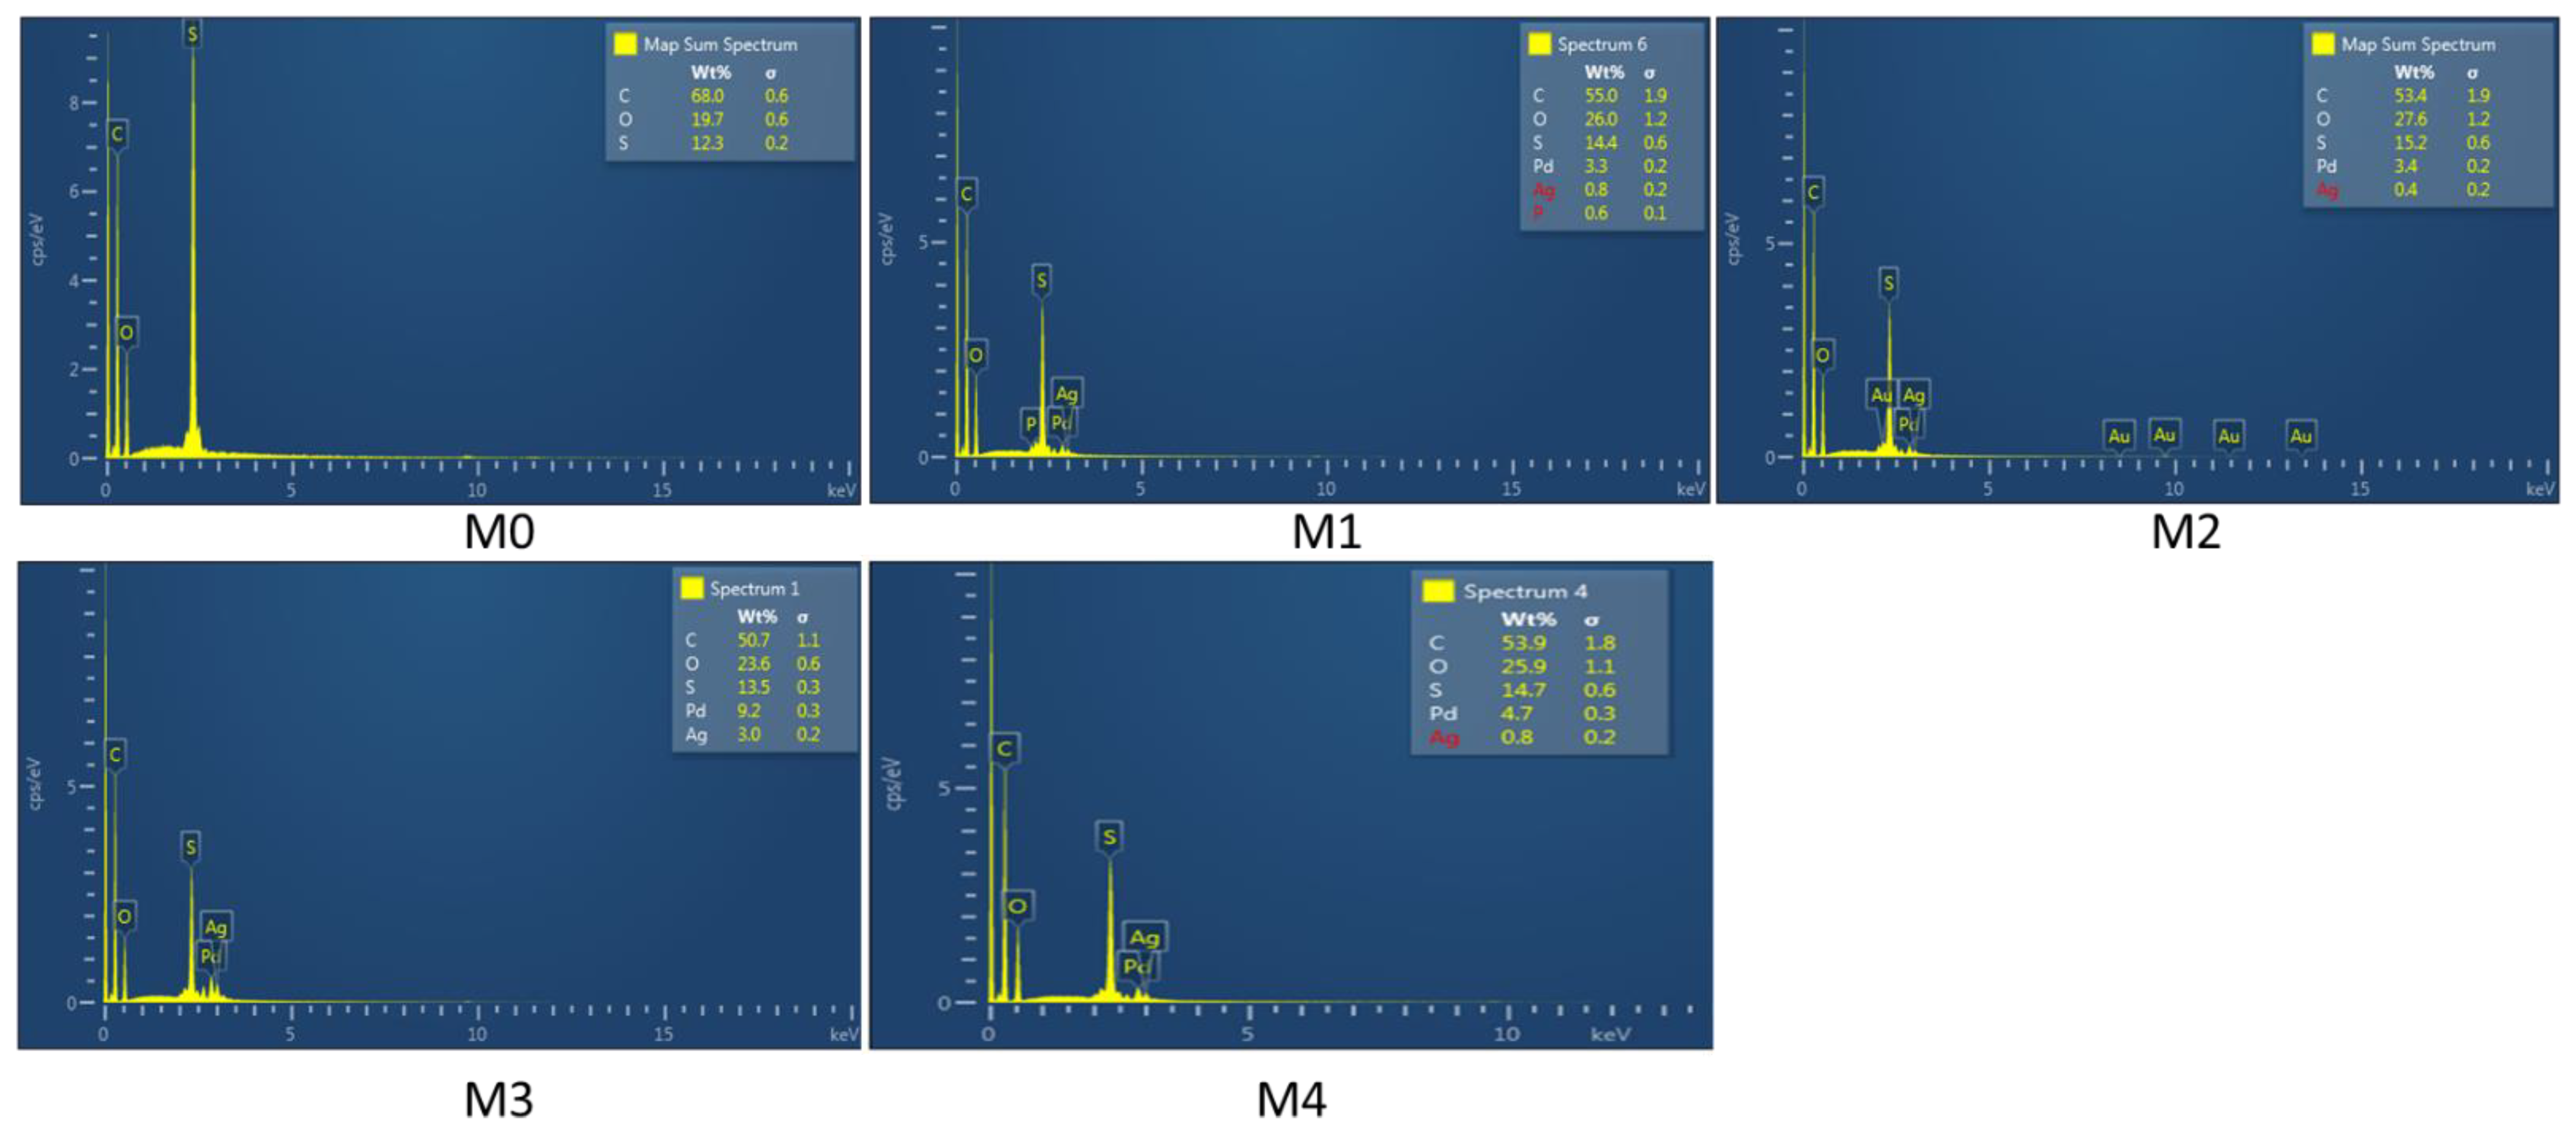
3.1.3. SEM and EDS
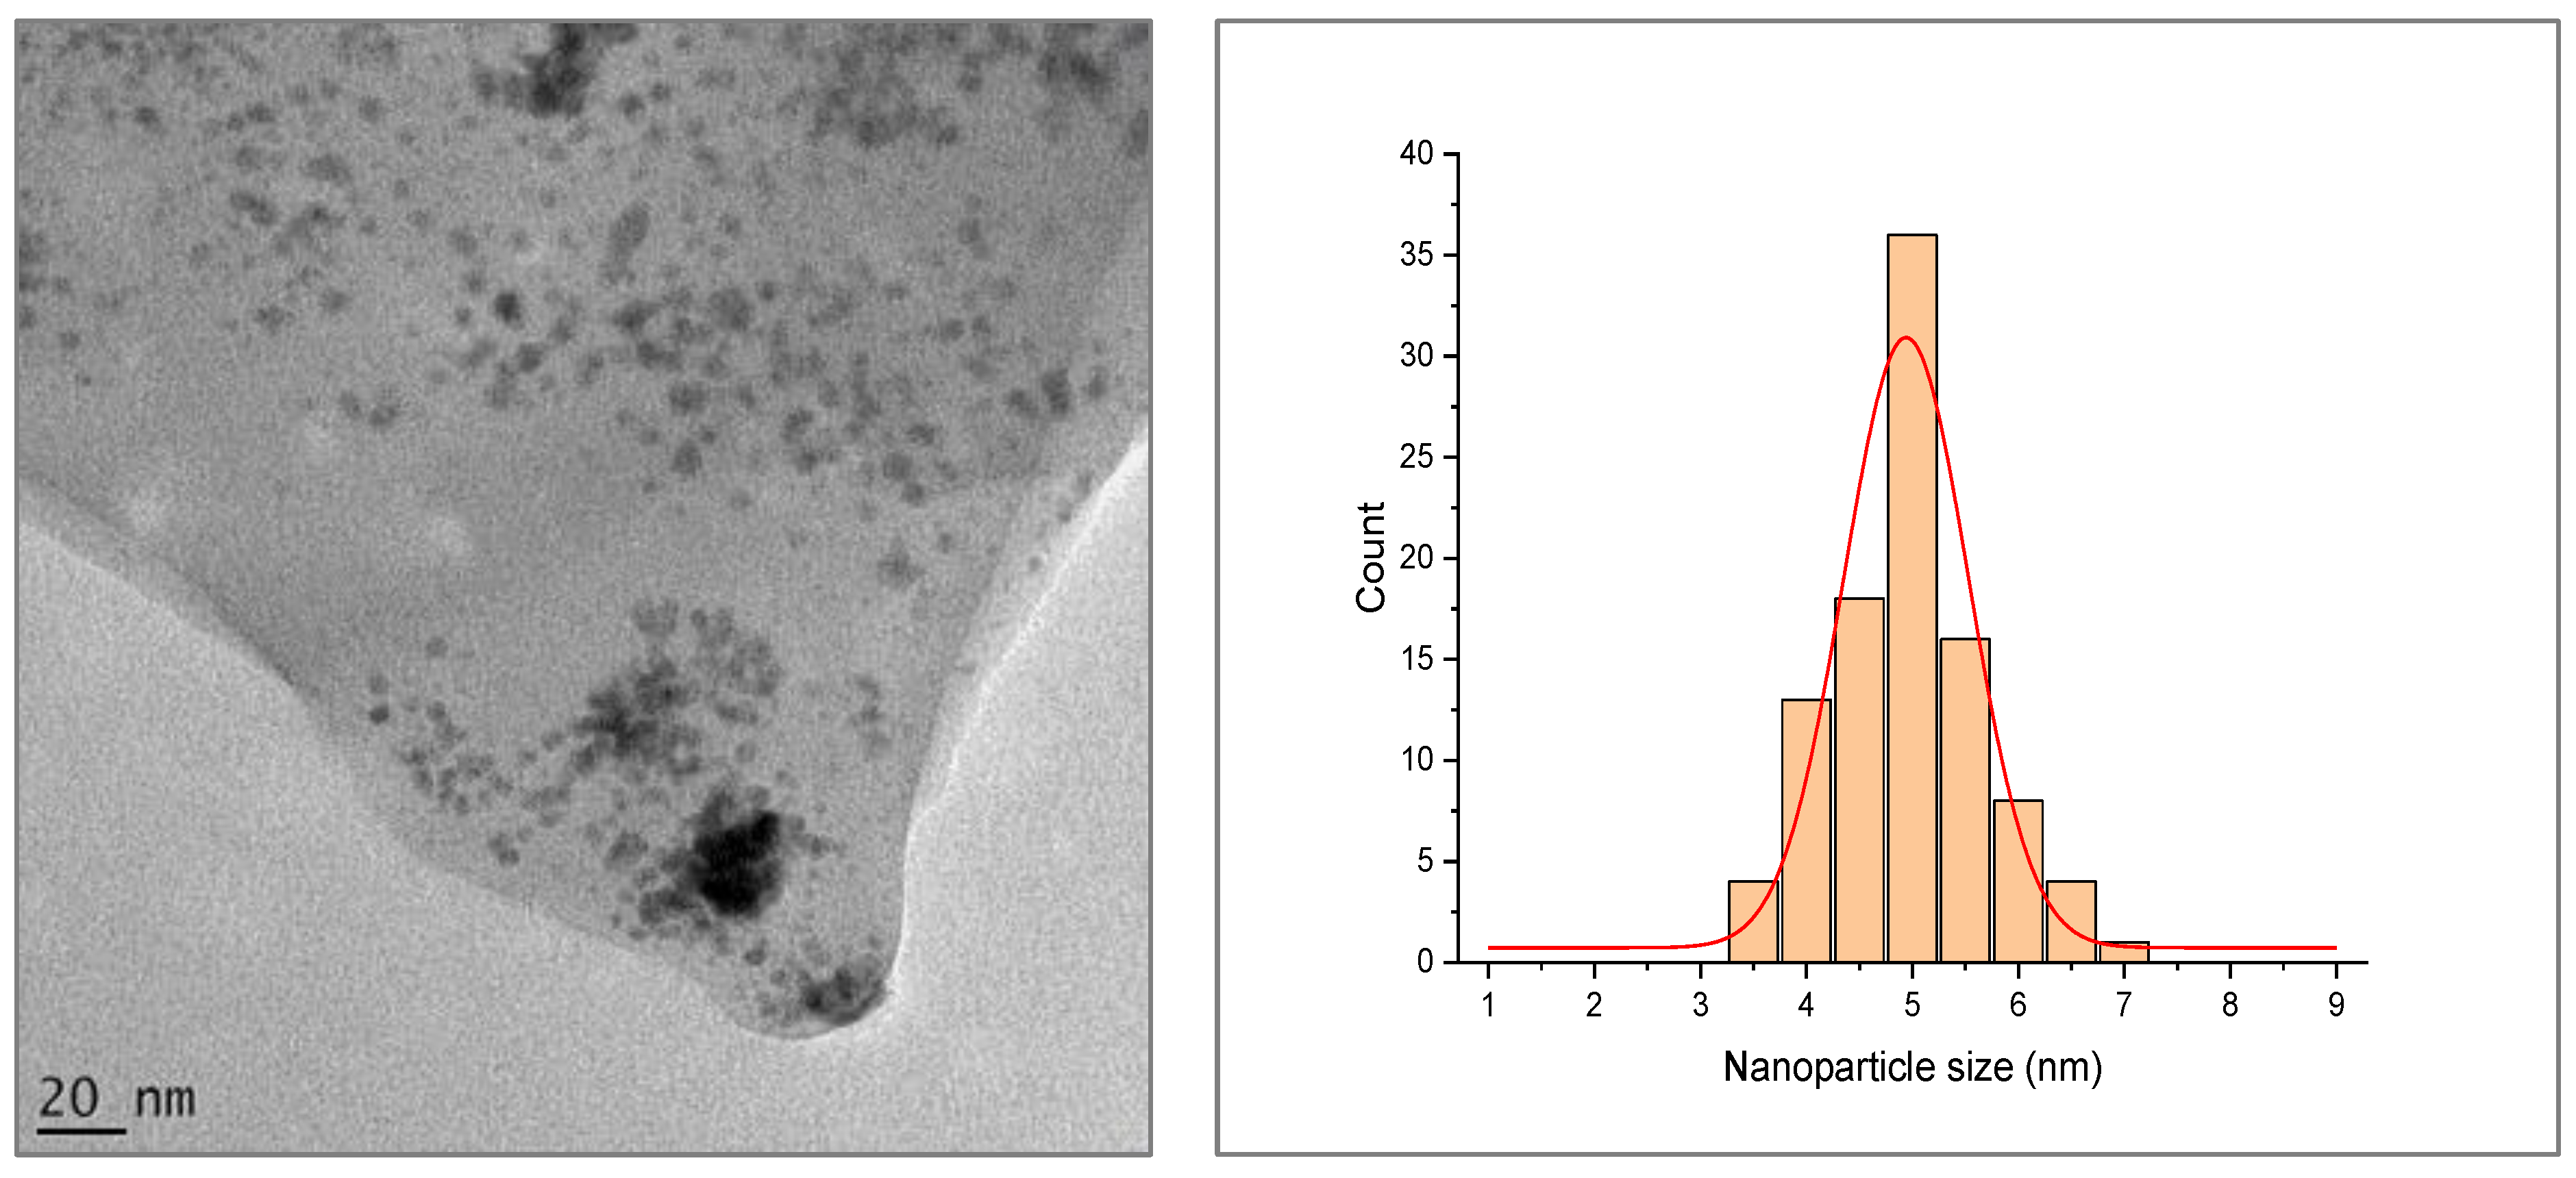
3.1.4. TEM Micrographs
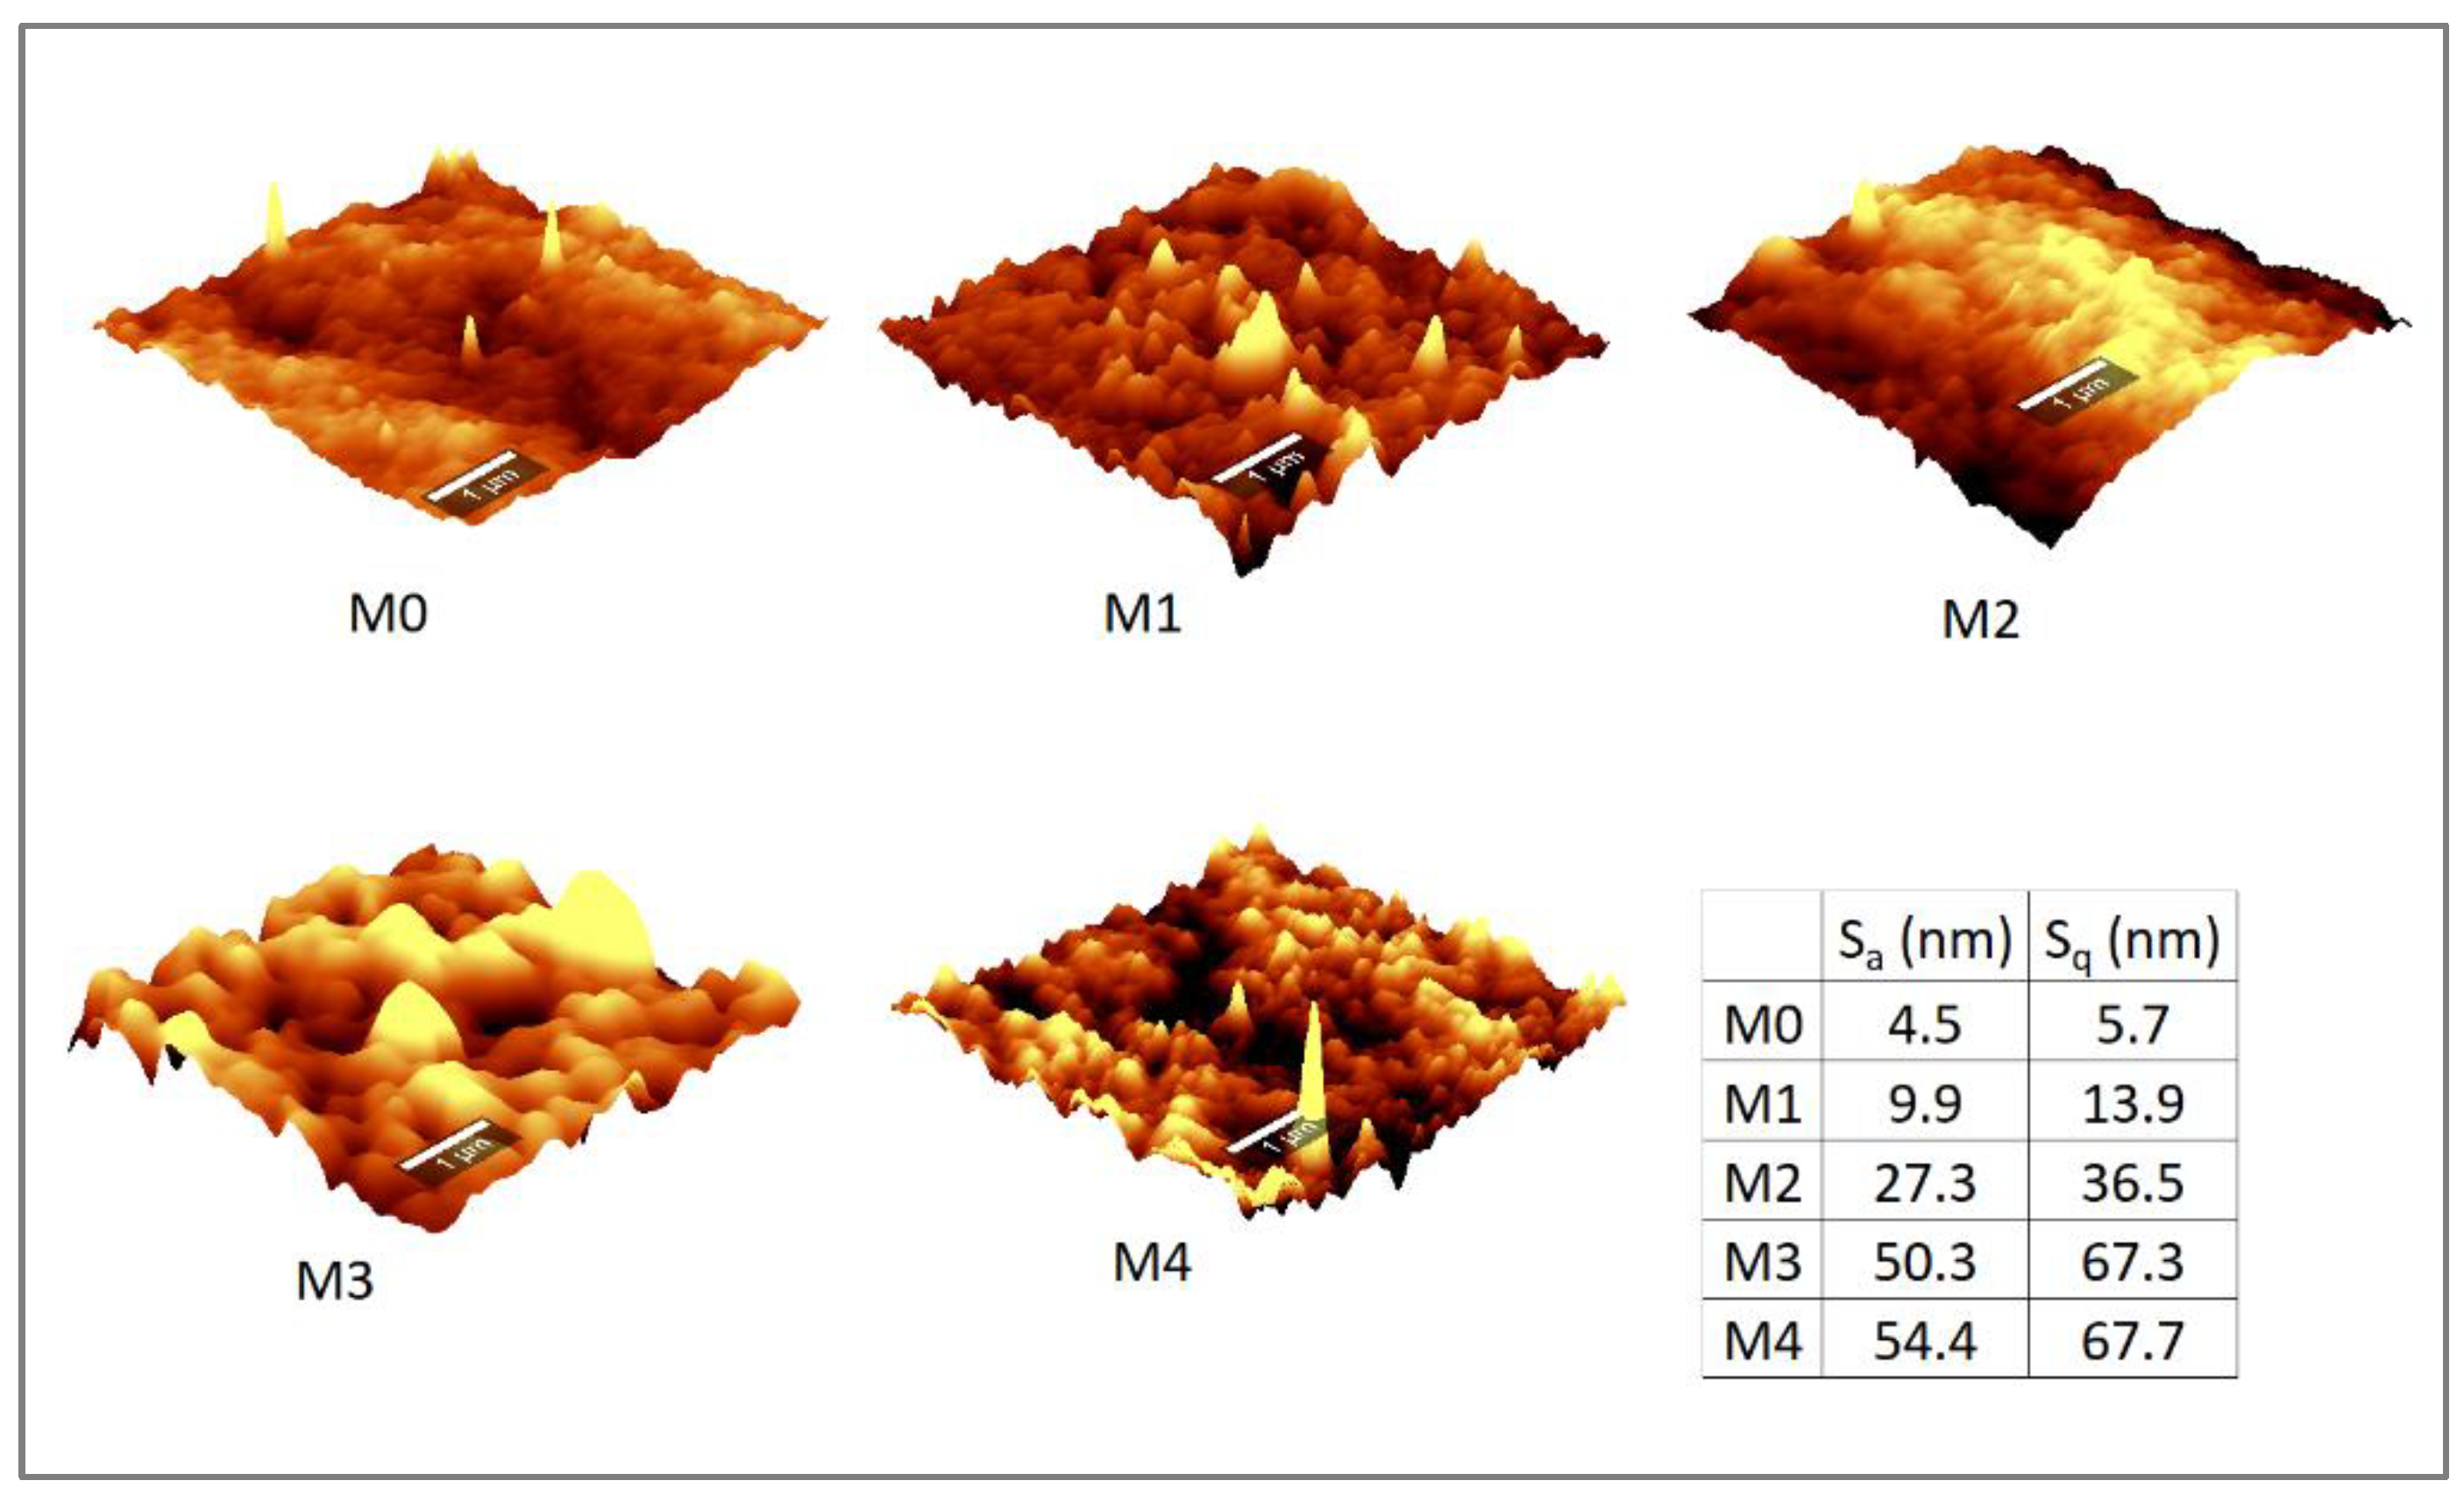
3.1.5. AFM Micrographs and Surface Roughness
3.1.6. Membrane Hydrophobicity, Fluxes, Porosity, Zeta Potential, Mean Pore Radius, and Salt Rejection Properties
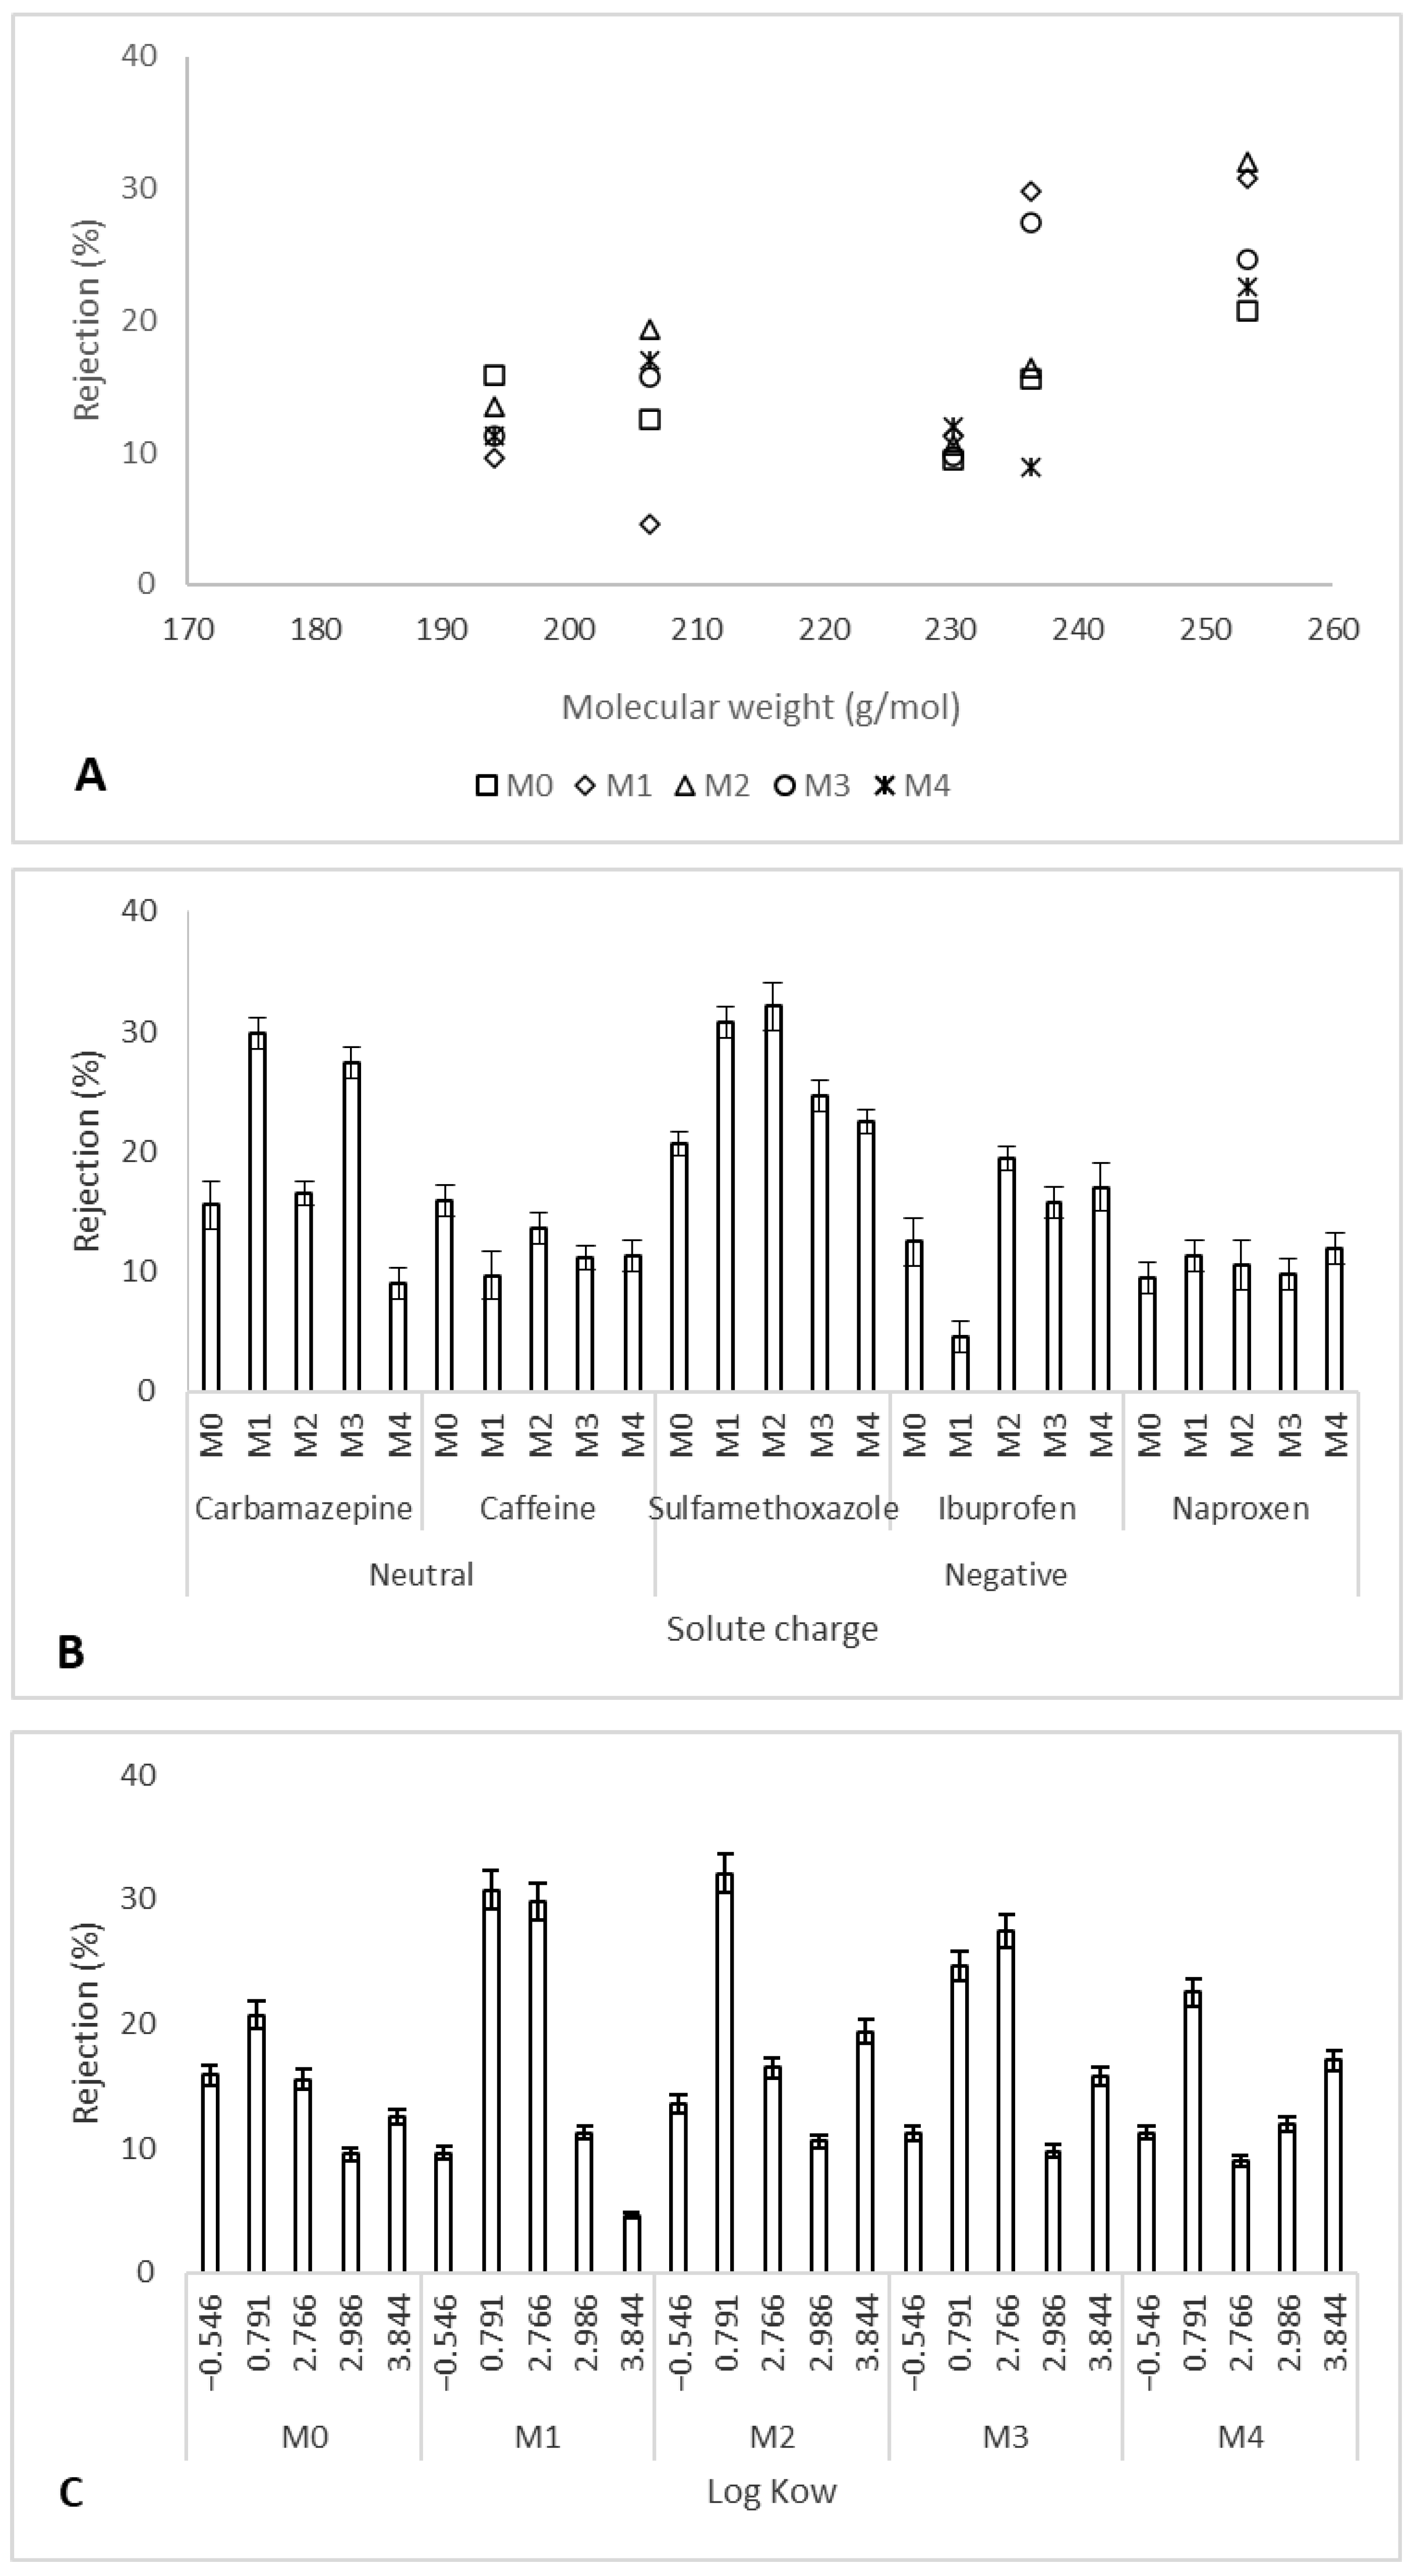
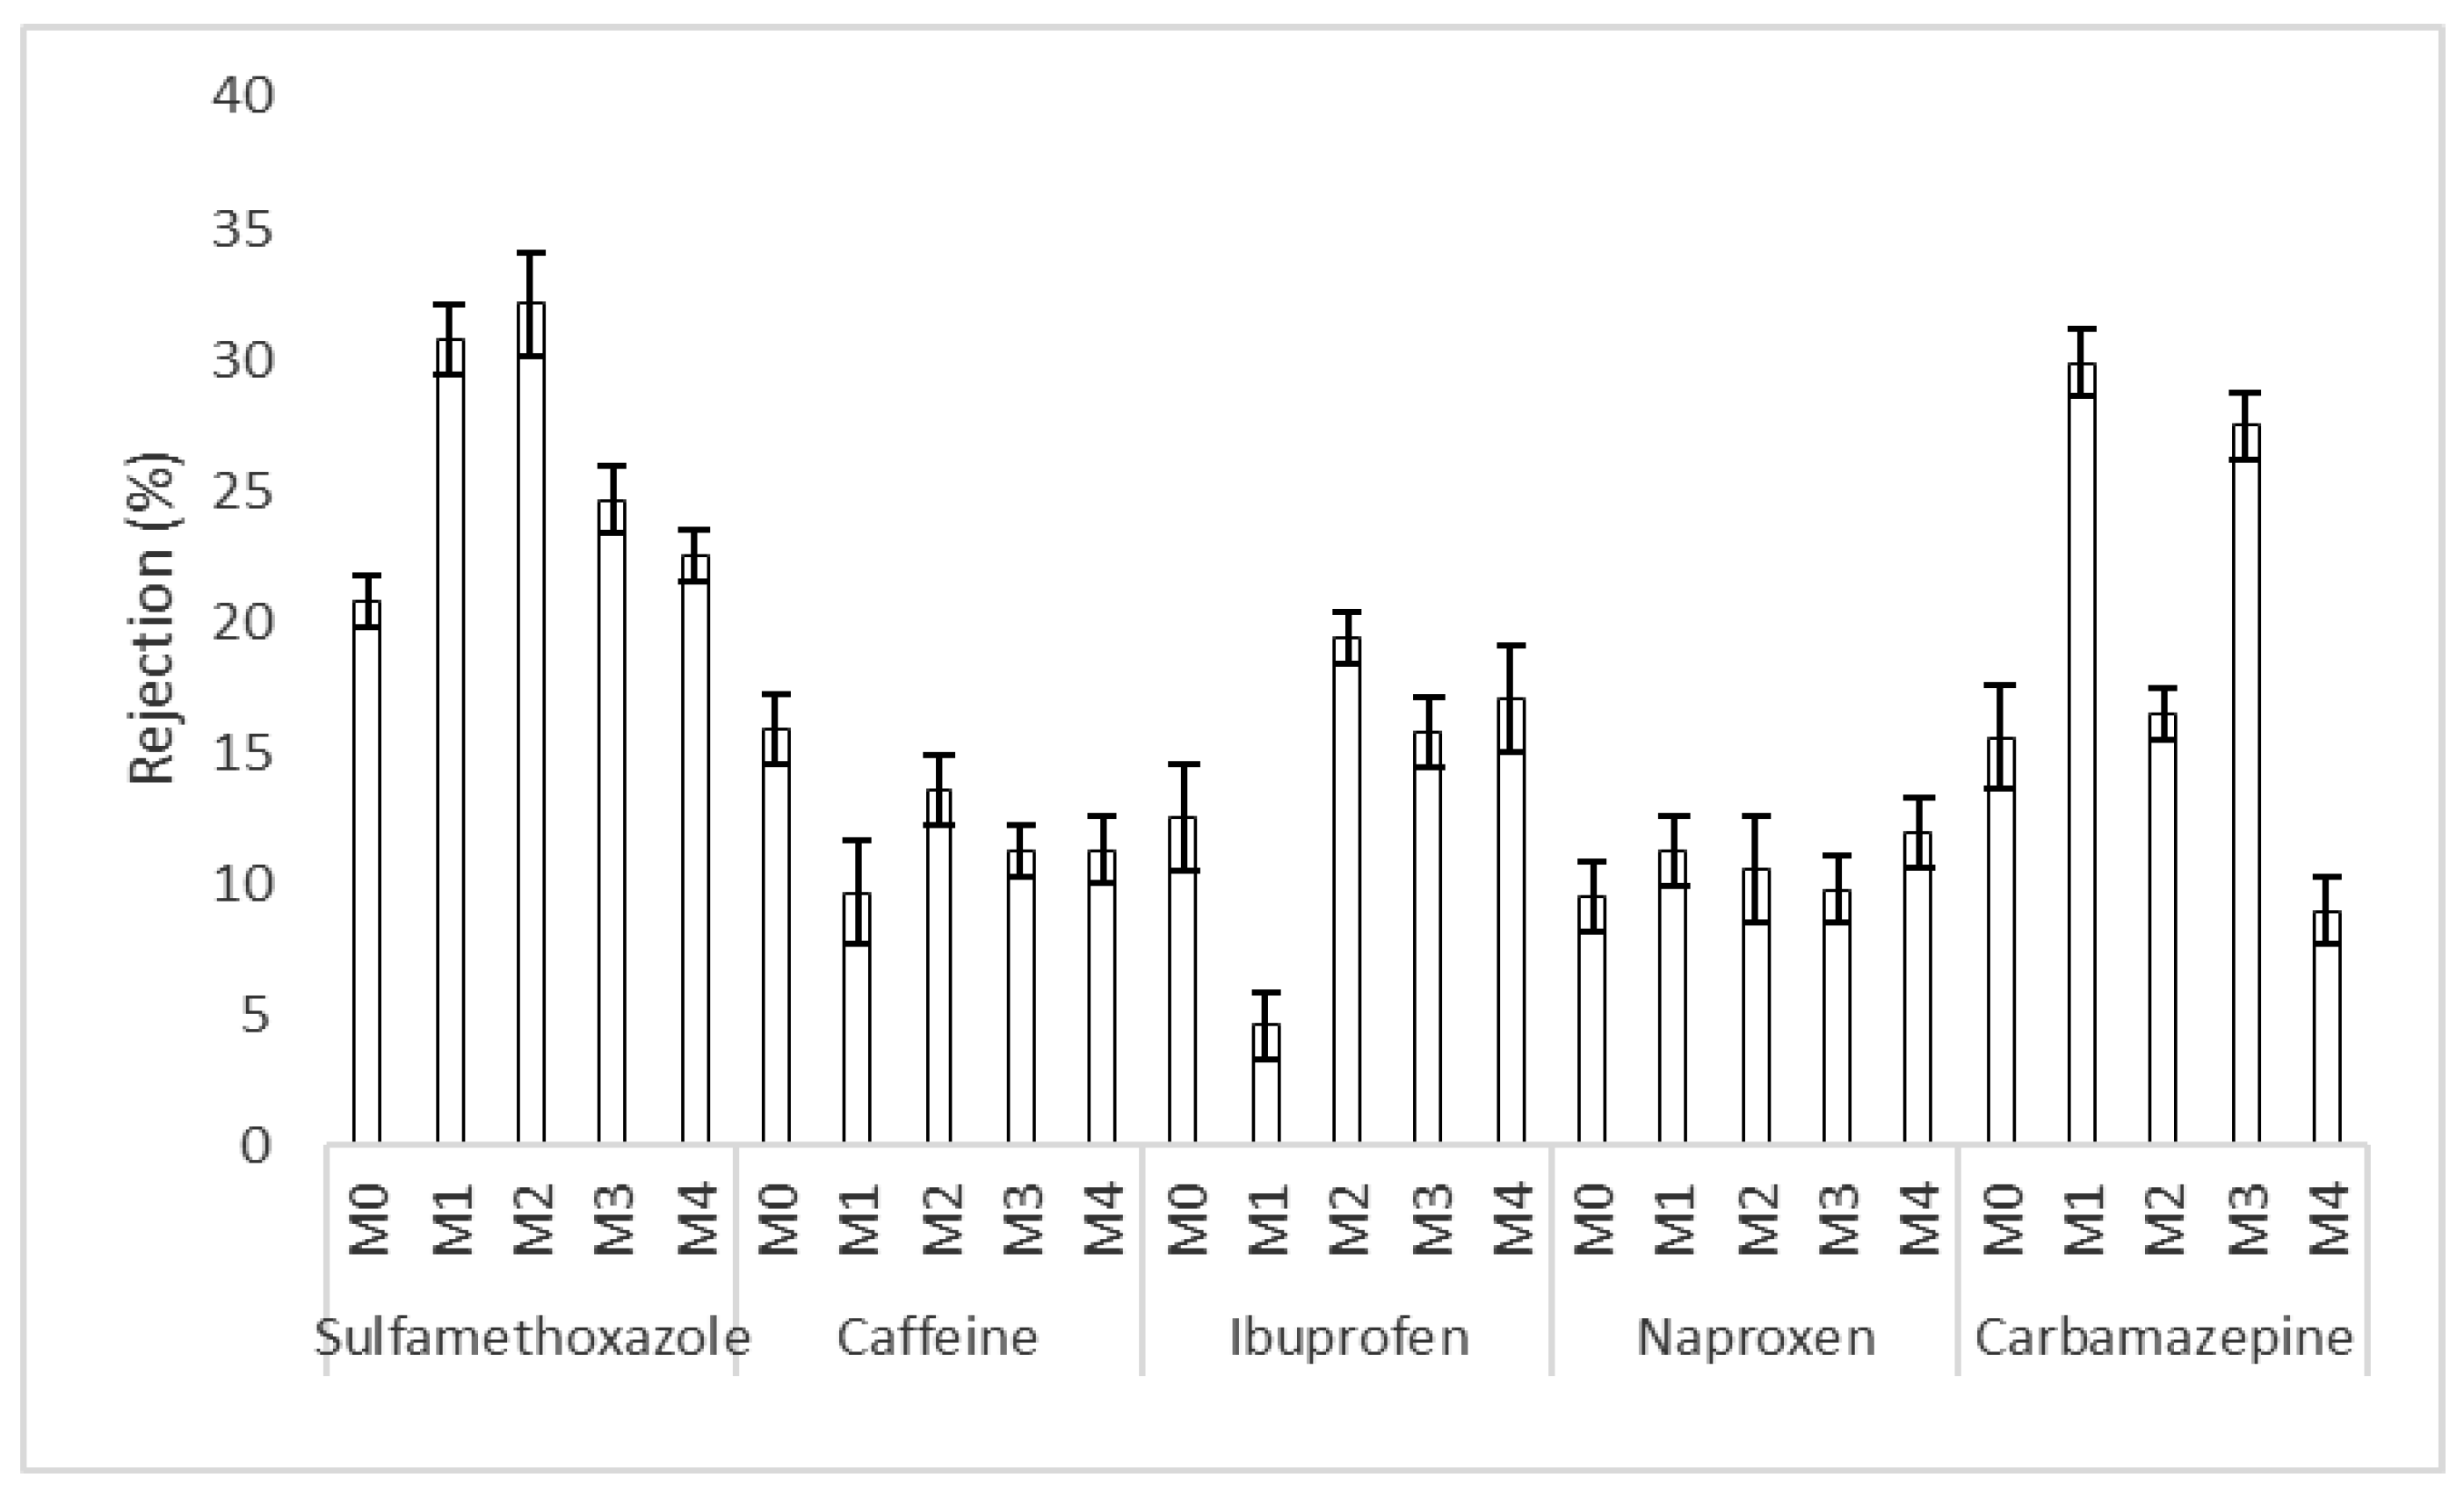
3.2. Trace Organic Compounds Rejection Properties
3.3. Solute Rejection Mechanisms by the Ag/Pd PES Membranes
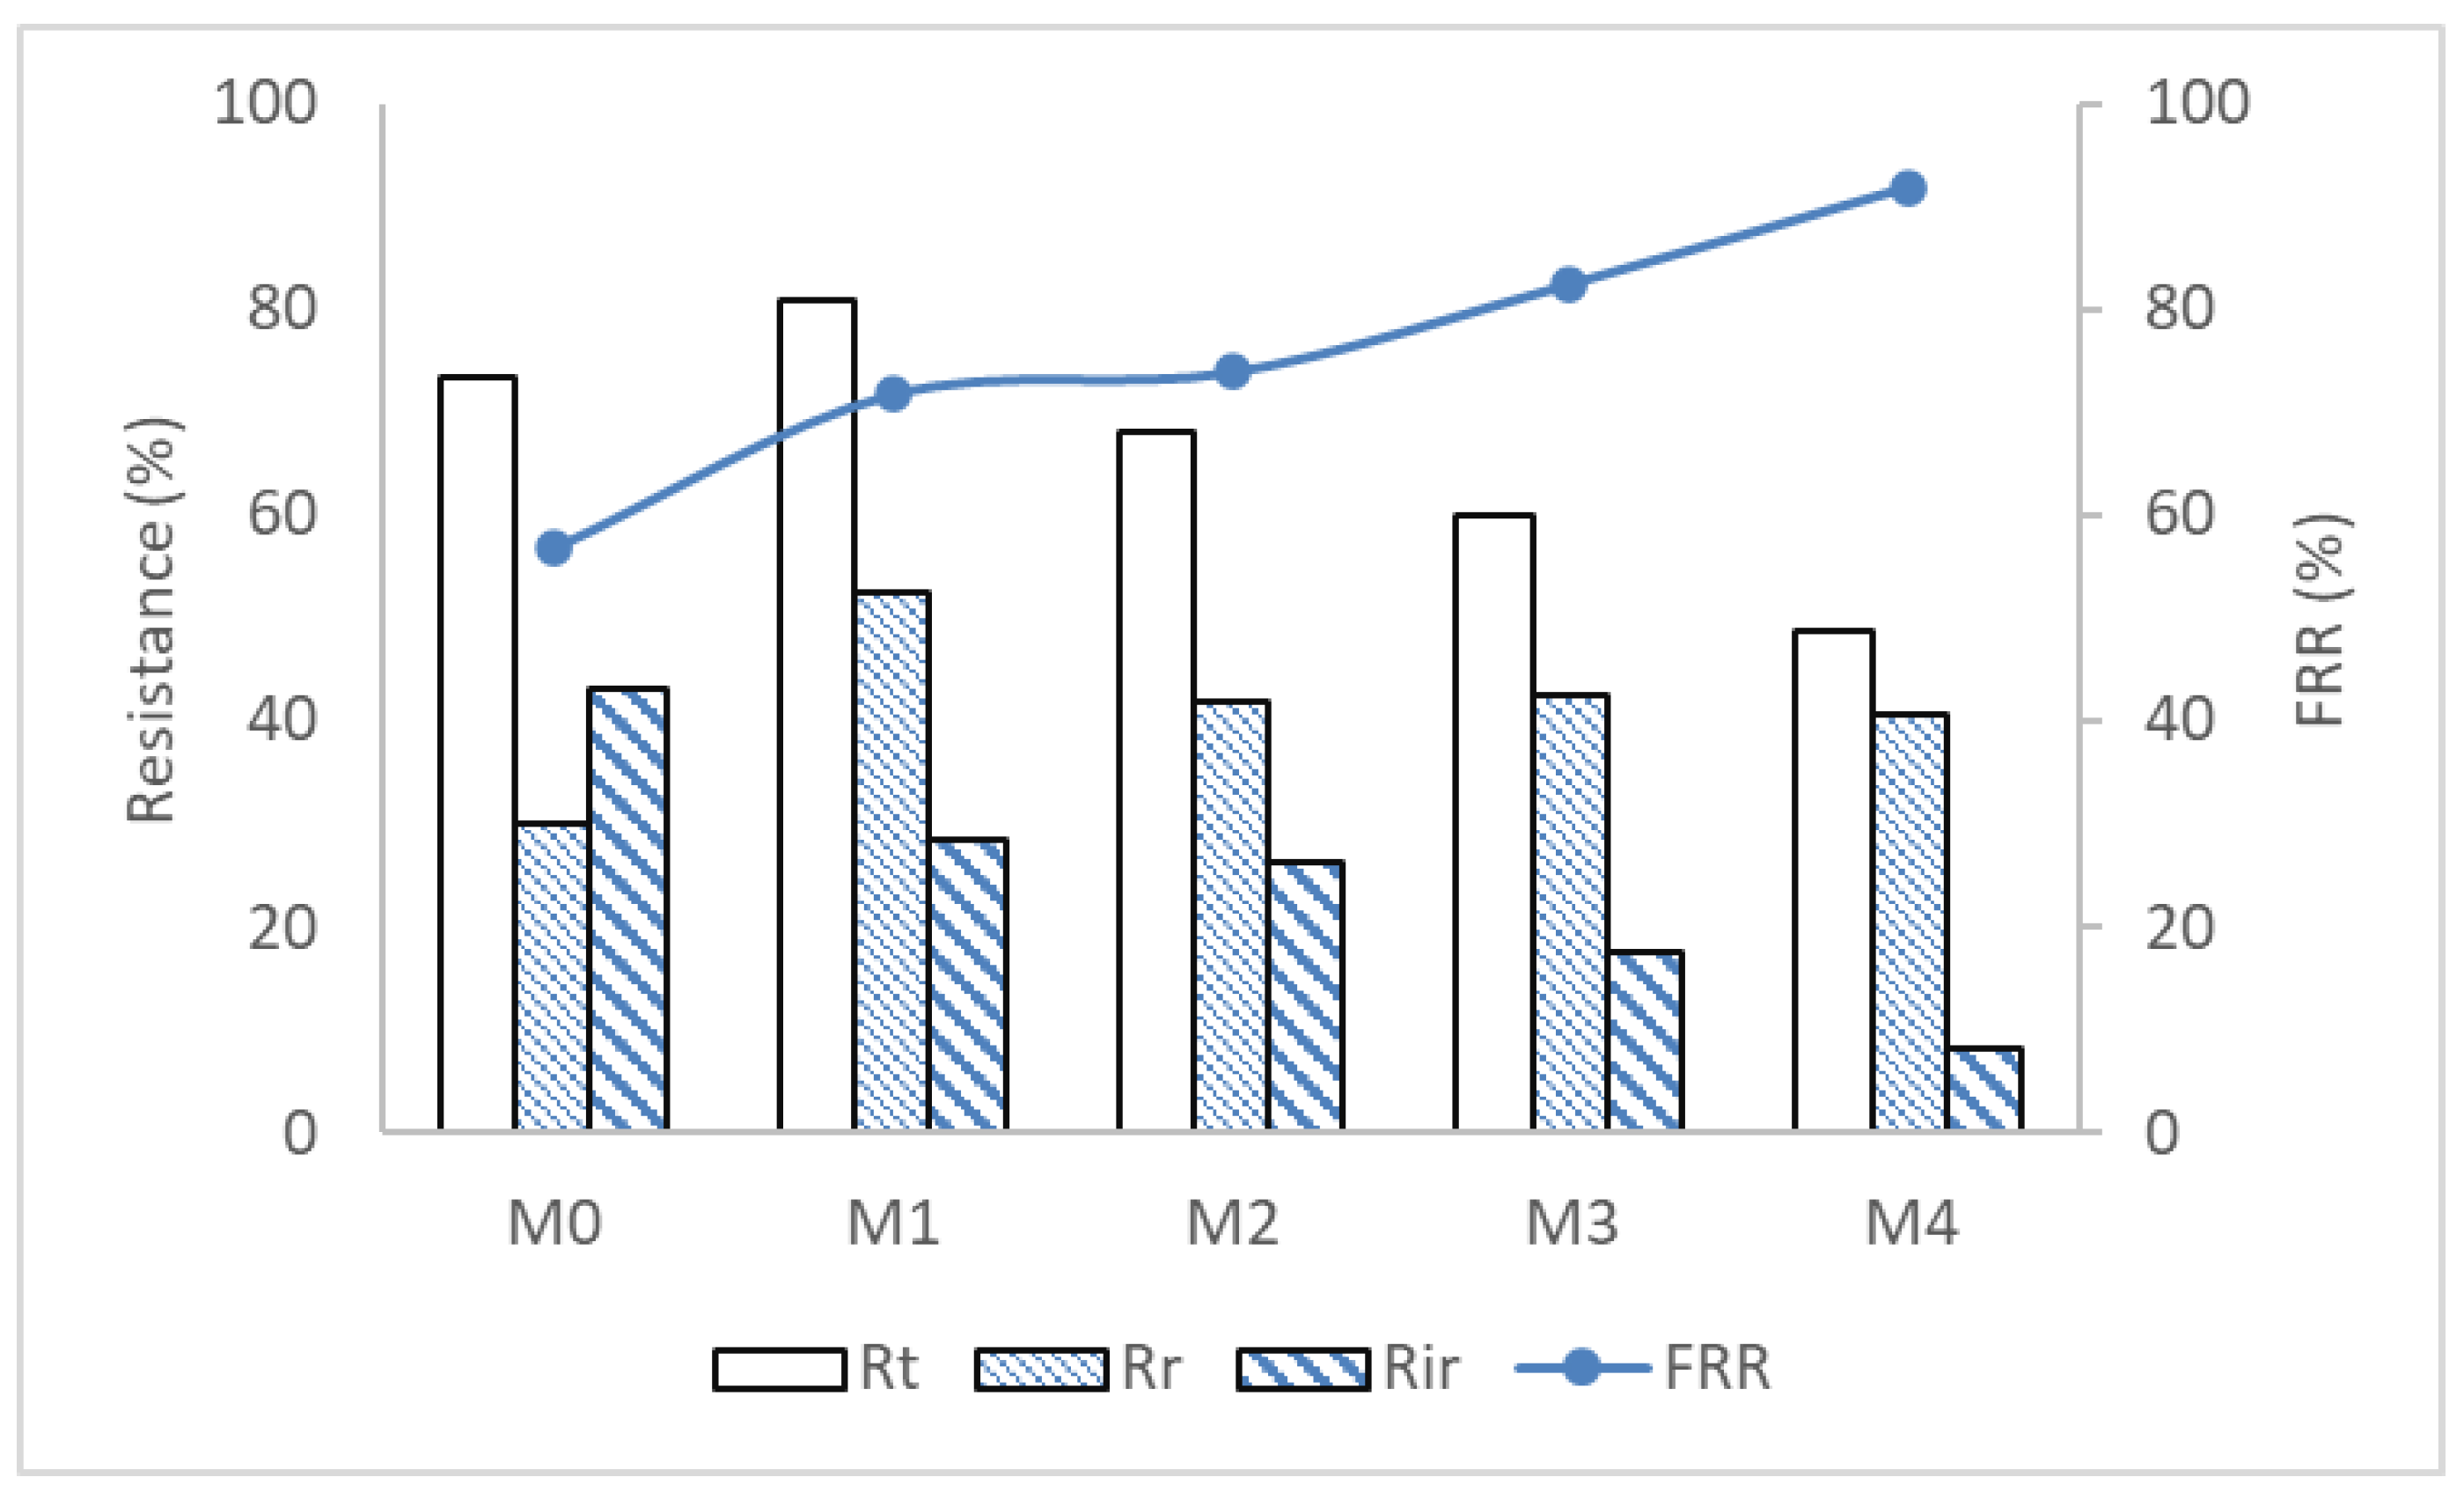
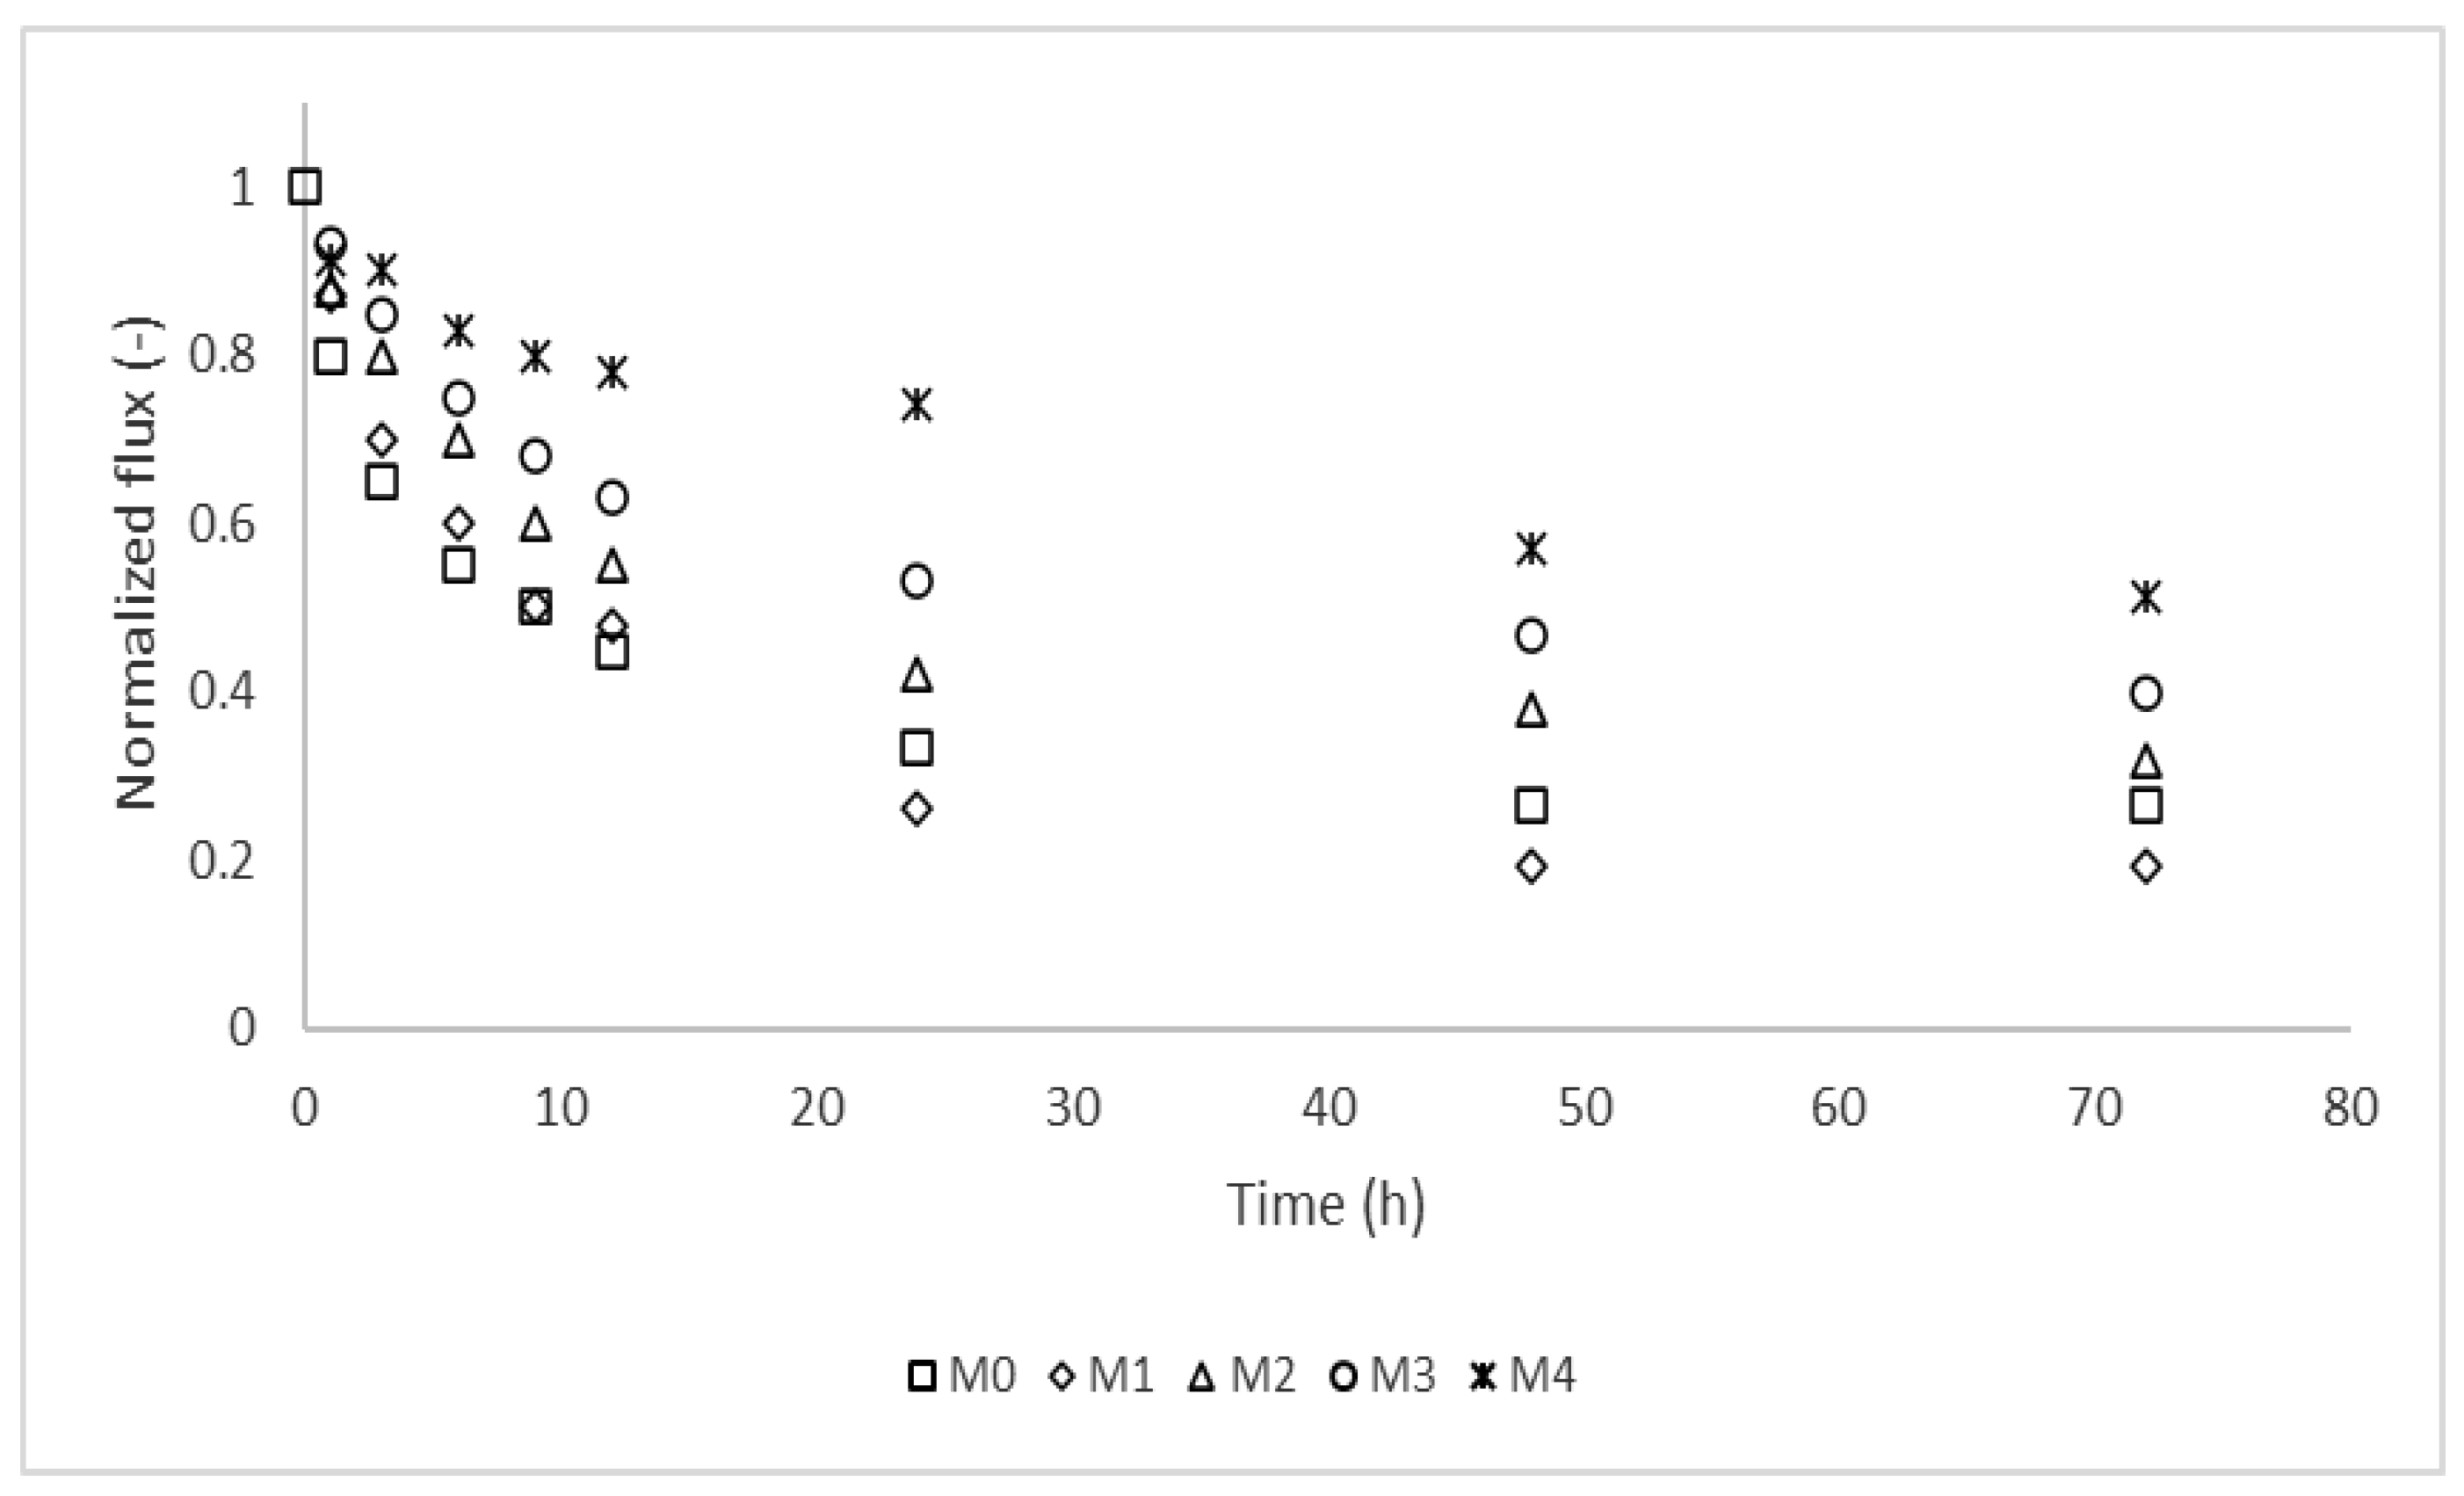
3.4. Membrane Resistance to Protein Fouling
3.5. Nanoparticle Release
4. Conclusions
Author Contributions
Funding
Informed Consent Statement
Acknowledgments
Conflicts of Interest
Abbreviations
| AFM | Atomic Force Microscopy |
| BSA | Bovine serum albumin |
| CapEX | Capital expenditure |
| CP | Concentration polarization |
| EDCs | Endocrine-disrupting compounds |
| EDS | Energy Dispersive X-ray Spectroscopy |
| EOCs | Emerging Organic Compounds |
| FRR | Flux recovery ratio |
| FTIR | Fourier Transform Infrared |
| GO | Graphene oxide |
| HRTEM | High resolution transmission electron microscopy |
| ICP-MS | Inductive coupled plasma mass spectroscopy |
| Lp | Pure water permeability |
| MSPs | Membrane separation processes |
| Mw | Molecular weight |
| MWCO | Molecular weight cut-off |
| NF | Nanofiltration |
| NTU | Nephelometric turbidity unit |
| OpEX | Operating expenditure |
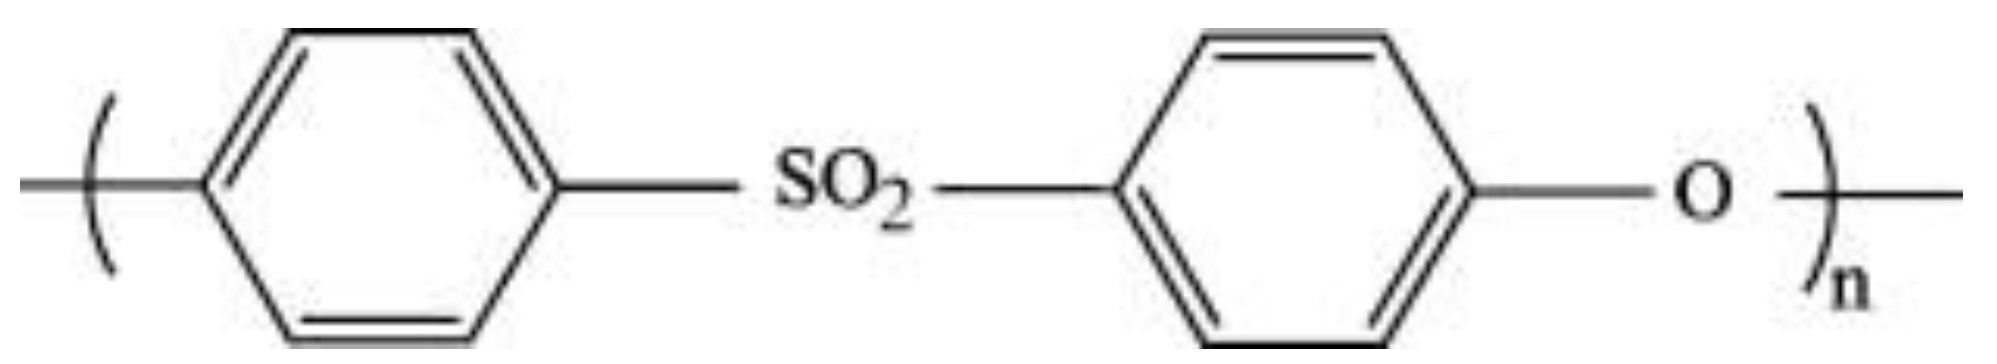
| PES | Polyethersulfone |
| PSf | Polysulfone |
| PVDF | Polyvinylidene fluoride |
| Rir | Irreversible fouling ratio |
| RO | Reverse osmosis |
| Rr | Reversible fouling ratio |
| Rt | Total fouling ratio |
| Sa | Average arithmetic roughness |
| SEM | Scanning Electron Microscopy |
| Sq | Mean square roughness |
| TEM | Transmission Electron Microscopy |
| TEP | Triethyl phosphate |
| TGA | Thermogravimetric analysis |
| TMP | Trans-membrane pressure |
| TOC | Total organic carbon |
| UF | Ultrafiltration |
References
- Liu, Q.; Zhao, Z.; Li, H.; Su, M.; Liang, S.-X. Occurrence and Removal of Organic Pollutants by a Combined Analysis Using GC-MS with Spectral Analysis and Acute Toxicity. Ecotoxicol. Environ. Saf. 2021, 207, 111237. [Google Scholar] [CrossRef]
- Grung, M.; Meland, S.; Ruus, A.; Ranneklev, S.; Fjeld, E.; Kringstad, A.; Thomas, J.; Dela, M.; Christensen, J.H. Occurrence and Trophic Transport of Organic Compounds in Sedimentation Ponds for Road Runoff. Sci. Total Environ. 2021, 751, 141808. [Google Scholar] [CrossRef]
- Borrull, J.; Colom, A.; Fabregas, J.; Borrull, F.; Pocurull, E. Presence, Behaviour and Removal of Selected Organic Micropollutants through Drinking Water Treatment. Chemosphere 2021, 276, 130023. [Google Scholar] [CrossRef] [PubMed]
- Jing, A.; Kumar, V.; Kannan, K. A Review of Environmental Occurrence, Toxicity, Biotransformation and Biomonitoring of Volatile Organic Compounds. Environ. Chem. Ecotoxicol. 2021, 3, 91–116. [Google Scholar] [CrossRef]
- Lauretta, R.; Sansone, A.; Sansone, M.; Romanelli, F.; Appetecchia, M. Endocrine Disrupting Chemicals: Effects on Endocrine Glands. Front. Endocrinol. 2019, 10, 178. [Google Scholar] [CrossRef] [PubMed] [Green Version]
- Basiuk, M.; Brown, R.A.; Cartwright, D.; Davison, R.; Wallis, P.M. Trace Organic Compounds in Rivers, Streams, and Wastewater in Southeastern Alberta, Canada. Inland Waters 2017, 7, 283–296. [Google Scholar] [CrossRef]
- Cecconet, D.; Molognoni, D.; Callegari, A.; Capodaglio, A.G. Biological Combination Processes for Efficient Removal of Pharmaceutically Active Compounds from Wastewater: A Review and Future Perspectives. J. Environ. Chem. Eng. 2017, 5, 3590–3603. [Google Scholar] [CrossRef]
- Kyzas, G.Z.; Fu, J.; Lazaridis, N.K.; Bikiaris, D.N.; Matis, K.A. New Approaches on the Removal of Pharmaceuticals from Wastewaters with Adsorbent Materials. J. Mol. Liq. 2015, 209, 87–93. [Google Scholar] [CrossRef]
- Feng, L.; Van Hullebusch, E.D.; Rodrigo, M.A.; Esposito, G.; Oturan, M.A. Removal of Residual Anti-Inflammatory and Analgesic Pharmaceuticals from Aqueous Systems by Electrochemical Advanced Oxidation Processes. A Review. Chem. Eng. J. 2013, 228, 944–964. [Google Scholar] [CrossRef]
- Song, P.; Yang, Z.; Zeng, G.; Yang, X.; Xu, H.; Wang, L.; Xu, R. Electrocoagulation Treatment of Arsenic in Wastewaters: A Comprehensive Review. Chem. Eng. J. 2017, 317, 707–725. [Google Scholar] [CrossRef]
- Nayak, J.K.; Ghosh, U.K. Biomass and Bioenergy Post Treatment of Microalgae Treated Pharmaceutical Wastewater in Photosynthetic Microbial Fuel Cell (PMFC) and Biodiesel Production. Biomass Bioenergy 2019, 131, 105415. [Google Scholar] [CrossRef]
- Gomes, J.; Costa, R.; Quinta-ferreira, R.M.; Martins, R.C. Application of Ozonation for Pharmaceuticals and Personal Care Products Removal from Water. Sci. Total Environ. 2017, 586, 265–283. [Google Scholar] [CrossRef] [PubMed]
- Ingrao, C.; Failla, S.; Arcidiacono, C. A Comprehensive Review of Environmental and Operational Issues of Constructed Wetland Systems. Curr. Opin. Environ. Sci. Health 2020, 13, 35–45. [Google Scholar] [CrossRef]
- Fatta-kassinos, D.; Vasquez, M.I.; Kümmerer, K. Transformation Products of Pharmaceuticals in Surface Waters and Wastewater Formed during Photolysis and Advanced Oxidation Processes—Degradation, Elucidation of Byproducts and Assessment of Their Biological Potency. Chemosphere 2011, 85, 693–709. [Google Scholar] [CrossRef] [PubMed]
- Modin, O.; Persson, F.; Britt-Marie Wilén, M.H.; Modin, O.; Persson, F.; Wilén, B.; Hermansson, M.; Modin, F.O.; Persson, F.; Wilén, M.; et al. Nonoxidative Removal of Organics in the Activated Sludge Process. Crit. Rev. Environ. Sci. Technol. 2016, 46, 635–672. [Google Scholar] [CrossRef] [PubMed] [Green Version]
- Mazur, L.P.; Cechinel, M.A.P.; Guelli, S.M.A.; De Souza, U.; Boaventura, R.A.R.; Vilar, V.J.P. Brown Marine Macroalgae as Natural Cation Exchangers for Toxic Metal Removal from Industrial Wastewaters: A Review. J. Environ. Manag. 2018, 223, 215–253. [Google Scholar] [CrossRef]
- Foureaux, A.F.S.; Reis, E.O.; Lebron, Y.; Moreira, V.; Santos, L.V.; Amaral, M.S.; Lange, L.C. Rejection of Pharmaceutical Compounds from Surface Water by Nanofiltration and Reverse Osmosis. Sep. Purif. Technol. 2019, 212, 171–179. [Google Scholar] [CrossRef] [Green Version]
- Liu, Y.L.; Wang, X.M.; Yang, H.W.; Xie, Y.F.; Huang, X. Preparation of Nanofiltration Membranes for High Rejection of Organic Micropollutants and Low Rejection of Divalent Cations. J. Membr. Sci. 2019, 572, 152–160. [Google Scholar] [CrossRef]
- Silva, T.L.S.; Morales-Torres, S.; Esteves, C.M.P.; Ribeiro, A.R.; Nunes, O.C.; Figueiredo, J.L.; Silva, A.M.T. Desalination and Removal of Organic Micropollutants and Microorganisms by Membrane Distillation. Desalination 2018, 437, 121–132. [Google Scholar] [CrossRef]
- Couto, C.F.; Lange, L.C.; Cristina, M.; Amaral, S. A Critical Review on Membrane Separation Processes Applied to Remove Pharmaceutically Active Compounds from Water and Wastewater. J. Water Process Eng. 2018, 26, 156–175. [Google Scholar] [CrossRef]
- Fujioka, T.; Aizawa, H.; Kodamatani, H. Fouling Substances Causing Variable Rejection of a Small and Uncharged Trace Organic Chemical by Reverse Osmosis Membranes. Environ. Technol. Innov. 2020, 17, 100576. [Google Scholar] [CrossRef]
- Mahlangu, O.T.; Nackaerts, R.; Thwala, J.M.; Mamba, B.B.; Verliefde, A.R.D. Hydrophilic Fouling-Resistant GO-ZnO/PES Membranes for Wastewater Reclamation. J. Membr. Sci. 2017, 524, 43–55. [Google Scholar] [CrossRef]
- Licona, K.P.M.; Geaquinto, L.R.D.O.; Nicolini, J.V.; Figueiredo, N.G.; Chiapetta, S.C.; Habert, A.C.; Yokoyama, L. Assessing Potential of Nano Fi Ltration and Reverse Osmosis for Removal of Toxic Pharmaceuticals from Water. J. Water Process Eng. 2018, 25, 195–204. [Google Scholar] [CrossRef]
- Garcia-Ivars, J.; Martella, L.; Massella, M.; Carbonell-Alcaina, C.; Alcaina-Miranda, M.I.; Iborra-Clar, M.I. Nanofiltration as Tertiary Treatment Method for Removing Trace Pharmaceutically Active Compounds in Wastewater from Wastewater Treatment Plants. Water Res. 2017, 125, 360–373. [Google Scholar] [CrossRef] [PubMed]
- Fujioka, T.; Kodamatani, H.; Yujue, W.; Dan, K.; Riani, E.; Yuan, H.; Fang, M.; Allen, S.; Yu, K.D.; Wanjaya, E.R.; et al. Assessing the Passage of Small Pesticides through Reverse Osmosis Membranes. J. Membr. Sci. 2020, 595, 117577. [Google Scholar] [CrossRef]
- Liu, Y.L.; Wang, X.M.; Yang, H.W.; Xie, Y.F. Quantifying the Influence of Solute-Membrane Interactions on Adsorption and Rejection of Pharmaceuticals by NF/RO Membranes. J. Membr. Sci. 2018, 551, 37–46. [Google Scholar] [CrossRef]
- Chen, L.; Xu, P.; Wang, H. Interplay of the Factors Affecting Water Flux and Salt Rejection in Membrane Distillation: A State-of-the-Art Critical Review. Water 2020, 12, 2841. [Google Scholar] [CrossRef]
- Mahlangu, O.T.; Nackaerts, R.; Mamba, B.B.; Verliefde, A.R.D. Development of Hydrophilic GO-ZnO / PES Membranes for Treatment of Pharmaceutical Wastewater. Water Sci. Technol. Water Supply 2017, 76.3, 501–514. [Google Scholar] [CrossRef]
- Konradt, N.; Kuhlen, J.G.; Rohns, H.; Schmitt, B.; Fischer, U.; Binder, T.; Schumacher, V.; Wagner, C.; Kamphausen, S.; Müller, U.; et al. Removal of Trace Organic Contaminants by Parallel Operation of Reverse Osmosis and Granular Activated Carbon for Drinking Water Treatment. Membranes 2021, 11, 33. [Google Scholar] [CrossRef]
- Braeken, L.; Ramaekers, R.; Zhang, Y.; Maes, G.; Van der Bruggen, B.; Vandecasteele, C. Influence of Hydrophobicity on Retention in Nanofiltration of Aqueous Solutions Containing Organic Compounds. J. Membr. Sci. 2005, 252, 195–203. [Google Scholar] [CrossRef]
- Ilyas, S.; Abtahi, S.M.; Akkilic, N.; Roesink, H.D.W.; de Vos, W.M. Weak Polyelectrolyte Multilayers as Tunable Separation Layers for Micro-Pollutant Removal by Hollow Fiber Nanofiltration Membranes. J. Membr. Sci. 2017, 537, 220–228. [Google Scholar] [CrossRef]
- Kusworo, T.D.; Susanto, H.; Aryanti, N.; Rokhati, N.; Widiasa, I.N.; Al-Aziz, H.; Utomo, D.P.; Masithoh, D.; Kumoro, A.C. Preparation and Characterization of Photocatalytic PSf-TiO2/GO Nanohybrid Membrane for the Degradation of Organic Contaminants in Natural Rubber Wastewater. J. Environ. Chem. Eng. 2021, 9, 105066. [Google Scholar] [CrossRef]
- Rosman, N.; Norharyati Wan Salleh, W.; Aqilah Mohd Razali, N.; Nurain Ahmad, S.Z.; Hafiza Ismail, N.; Aziz, F.; Harun, Z.; Fauzi Ismail, A.; Yusof, N. Ibuprofen Removal through Photocatalytic Filtration Using Antifouling PVDF- ZnO/Ag2CO3/Ag2O Nanocomposite Membrane. Mater. Today Proc. 2020, 42, 2–7. [Google Scholar] [CrossRef]
- Cui, J.; Yang, Y.; Hu, Y.; Li, F. Rice Husk Based Porous Carbon Loaded with Silver Nanoparticles by a Simple and Cost-Effective Approach and Their Antibacterial Activity. J. Colloid Interface Sci. 2015, 455, 117–124. [Google Scholar] [CrossRef]
- García, A.; Rodríguez, B.; Oztürk, D.; Rosales, M.; Diaz, D.I.; Mautner, A. Incorporation of CuO Nanoparticles into Thin-Film Composite Reverse Osmosis Membranes (TFC-RO) for Antibiofouling Properties. Polym. Bull. 2018, 75, 2053–2069. [Google Scholar] [CrossRef]
- Pozun, Z.D.; Rodenbusch, S.E.; Keller, E.; Tran, K.; Tang, W.; Stevenson, K.J.; Henkelman, G. A Systematic Investigation of P-Nitrophenol Reduction by Bimetallic Dendrimer Encapsulated Nanoparticles. J. Phys. Chem. C 2013, 117, 7598–7604. [Google Scholar] [CrossRef]
- Seyyed Shahabi, S.; Azizi, N.; Vatanpour, V. Synthesis and Characterization of Novel g-C3N4 Modified Thin Film Nanocomposite Reverse Osmosis Membranes to Enhance Desalination Performance and Fouling Resistance. Sep. Purif. Technol. 2019, 215, 430–440. [Google Scholar] [CrossRef]
- Quay, A.N.; Tong, T.; Hashmi, S.M.; Zhou, Y.; Zhao, S.; Elimelech, M. Combined Organic Fouling and Inorganic Scaling in Reverse Osmosis: Role of Protein-Silica Interactions. Environ. Sci. Technol. 2018, 52, 9145–9153. [Google Scholar] [CrossRef] [PubMed]
- Ahmad, A.L.; Abdulkarim, A.A.; Ooi, B.S.; Ismail, S. Recent Development in Additives Modifications of Polyethersulfone Membrane for Flux Enhancement. Chem. Eng. J. 2013, 223, 246–267. [Google Scholar] [CrossRef]
- Gumbi, N.N.; Hu, M.; Mamba, B.B.; Li, J.; Nxumalo, E.N. Macrovoid-Free PES/SPSf/O-MWCNT Ultrafiltration Membranes with Improved Mechanical Strength, Antifouling and Antibacterial Properties. J. Membr. Sci. 2018, 566, 288–300. [Google Scholar] [CrossRef]
- Zhang, L.; Cui, Z.; Hu, M.; Mo, Y.; Li, S.; He, B.; Li, J. Preparation of PES/SPSf Blend Ultrafiltration Membranes with High Performance via H2O-Induced Gelation Phase Separation. J. Membr. Sci. 2017, 540, 136–145. [Google Scholar] [CrossRef]
- Zhang, S.; Viet, Q.; Nghiem, L.D.; Wang, J.; Li, J.; Hu, Y. Optimization and Organic Fouling Behavior of Zwitterion-Modified Thin-Film Composite Polyamide Membrane for Water Reclamation: A Comprehensive Study. J. Membr. Sci. 2020, 596, 117748. [Google Scholar] [CrossRef]
- Mathaba, M.; Daramola, M.O. Effect of Chitosan’s Degree of Deacetylation on the Performance of PES Membrane Infused with Chitosan during AMD Treatment. Membranes 2020, 10, 52. [Google Scholar] [CrossRef] [Green Version]
- Niraimathi, K.L.; Sudha, V.; Lavanya, R.; Brindha, P. Biosynthesis of Silver Nanoparticles Using Alternanthera sessilis (Linn.) Extract and Their Antimicrobial, Antioxidant Activities. Coll. Surf. B Biointerfaces 2013, 102, 288–291. [Google Scholar] [CrossRef] [PubMed]
- Thiruvengadam, V.; Bansod, A.V. Characterization of Silver Nanoparticles Synthesized Using Chemical Method and Its Antibacterial Property. Biointerface Res. Appl. Chem. 2020, 10, 7257–7264. [Google Scholar] [CrossRef]
- Lee, S.-E.; Park, M.-S.; Jeong, E.; Lee, M.Y.; Lee, M.-K.; Lee, Y.-S. Mechanical Property and Thermal Stability of Epoxy Composites Containing Poly (Ether Sulfone). Polymers 2015, 39, 426–432. [Google Scholar] [CrossRef] [Green Version]
- Ouyang, Z.; Huang, Z.; Tang, X.; Xiong, C.; Tang, M.; Lu, Y. A Dually Charged Nanofiltration Membrane by pH-Responsive Polydopamine for Pharmaceuticals and Personal Care Products Removal. Sep. Purif. Technol. 2019, 211, 90–97. [Google Scholar] [CrossRef]
- Low, Z.-X.; Ji, J.; Blumenstock, D.; Chew, Y.-M.; Wolverson, D.; Mattia, D. Fouling Resistant 2D Boron Nitride Nanosheet–PES Nanofiltration Membranes. J. Membr. Sci. 2018, 563, 949–956. [Google Scholar] [CrossRef]
- Zhong, Z.; Li, D.; Zhang, B.; Xing, W. Membrane Surface Roughness Characterization and Its Influence on Ultrafine Particle Adhesion. Sep. Purif. Technol. 2012, 90, 140–146. [Google Scholar] [CrossRef]
- Mahlangu, T.O.; Thwala, J.M.; Mamba, B.B.; D’Haese, A.; Verliefde, A.R.D. Factors Governing Combined Fouling by Organic and Colloidal Foulants in Cross-Flow Nanofiltration. J. Membr. Sci. 2015, 491, 53–62. [Google Scholar] [CrossRef]
- Mahlangu, T.O.; Schoutteten, K.V.K.M.; D’Haese, A.; Van den Bussche, J.; Vanhaecke, L.; Thwala, J.M.M.; Mamba, B.B.B.; Verliefde, A.R.D. Role of Permeate Flux and Specific Membrane-Foulant-Solute Affinity Interactions (∆Gslm) in Transport of Trace Organic Solutes through Fouled Nanofiltration (NF) Membranes. J. Membr. Sci. 2016, 518, 203–215. [Google Scholar] [CrossRef]
- Chong, T.H.; Wong, F.S.; Fane, A.G. Enhanced Concentration Polarization by Unstirred Fouling Layers in Reverse Osmosis: Detection by Sodium Chloride Tracer Response Technique. J. Membr. Sci. 2007, 287, 198–210. [Google Scholar] [CrossRef]
- Kajau, A.; Motsa, M.; Mamba, B.B.; Mahlangu, O. Leaching of CuO Nanoparticles from PES Ultrafiltration Membranes. ACS Omega 2021, 6, 31797–31809. [Google Scholar] [CrossRef]


| Membrane | Concentration (wt%) | ||||
|---|---|---|---|---|---|
| PES | TEP | Ag | Pd | Ag/Pd | |
| M0 | 15 | 85.00 | 0 | 0 | 0 |
| M1 | 15 | 84.90 | 0.05 | 0.05 | 0.10 |
| M2 | 15 | 84.85 | 0.075 | 0.075 | 0.15 |
| M3 | 15 | 84.80 | 0.10 | 0.10 | 0.20 |
| M4 | 15 | 84.75 | 0.125 | 0.125 | 0.25 |
| Compound | MW (g·mol−1) | Charge (pH 7) | Log Kow |
|---|---|---|---|
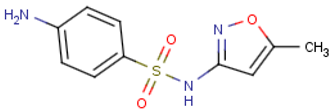 Sulfamethoxazole (C10H11N3O3S) | 253.278 | Negative | 0.791 |
 Caffeine (C8H10N4O2) | 194.1906 | Neutral | −0.546 |
 Ibuprofen (C13H18O2) | 206.2808 | Negative | 3.844 |
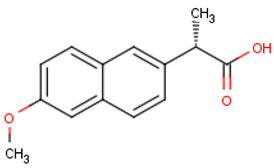 Naproxen (C14H14O3) | 230.2592 | Negative | 2.986 |
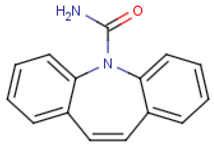 Carbamazepine (C15H12N2O) | 236.2686 | Neutral | 2.766 |
| Membrane | Bulk Porosity (%) | Contact Angle (°) | Lp (Lm−2h−1bar−1) | Zeta Potential | Mean Pore Radius (nm) | Salt Rejection (%) | |
|---|---|---|---|---|---|---|---|
| NaCl | MgSO4 | ||||||
| M0 | 57 ± 1.1 | 72.6 ± 3.6 | 37 ± 1.5 | −42.48 ± 0.48 | 2.39 | 2.3 ± 0.2 | 10.5 ± 1.2 |
| M1 | 59 ± 0.4 | 71.0 ± 3.5 | 39 ± 4.4 | −38.21 ± 0.41 | 2.59 | 4.1 ± 0.5 | 12.6 ± 0.8 |
| M2 | 62 ± 0.9 | 64.7 ± 3.2 | 59 ± 4.3 | −34.36 ± 0.36 | 3.74 | 3.8 ± 0.8 | 14.8 ± 1.1 |
| M3 | 68 ± 0.8 | 61.2 ± 3.1 | 75 ± 8.1 | −31.29 ± 0.34 | 4.68 | 1.4 ± 0.3 | 9.4 ± 0.9 |
| M4 | 77 ± 1.2 | 51.3 ± 2.7 | 85 ± 1.7 | −31.29 ± 0.52 | 4.70 | 4.6 ± 0.6 | 13.4 ± 1.3 |
Publisher’s Note: MDPI stays neutral with regard to jurisdictional claims in published maps and institutional affiliations. |
© 2022 by the authors. Licensee MDPI, Basel, Switzerland. This article is an open access article distributed under the terms and conditions of the Creative Commons Attribution (CC BY) license (https://creativecommons.org/licenses/by/4.0/).
Share and Cite
Patala, R.; Mahlangu, O.T.; Nyoni, H.; Mamba, B.B.; Kuvarega, A.T. In Situ Generation of Fouling Resistant Ag/Pd Modified PES Membranes for Treatment of Pharmaceutical Wastewater. Membranes 2022, 12, 762. https://doi.org/10.3390/membranes12080762
Patala R, Mahlangu OT, Nyoni H, Mamba BB, Kuvarega AT. In Situ Generation of Fouling Resistant Ag/Pd Modified PES Membranes for Treatment of Pharmaceutical Wastewater. Membranes. 2022; 12(8):762. https://doi.org/10.3390/membranes12080762
Chicago/Turabian StylePatala, Rapelang, Oranso T. Mahlangu, Hlengilizwe Nyoni, Bhekie B. Mamba, and Alex T. Kuvarega. 2022. "In Situ Generation of Fouling Resistant Ag/Pd Modified PES Membranes for Treatment of Pharmaceutical Wastewater" Membranes 12, no. 8: 762. https://doi.org/10.3390/membranes12080762
APA StylePatala, R., Mahlangu, O. T., Nyoni, H., Mamba, B. B., & Kuvarega, A. T. (2022). In Situ Generation of Fouling Resistant Ag/Pd Modified PES Membranes for Treatment of Pharmaceutical Wastewater. Membranes, 12(8), 762. https://doi.org/10.3390/membranes12080762