
Is Desalination a Solution to Freshwater Scarcity in Developing Countries?


 ,
, 
 ,
,
Abstract
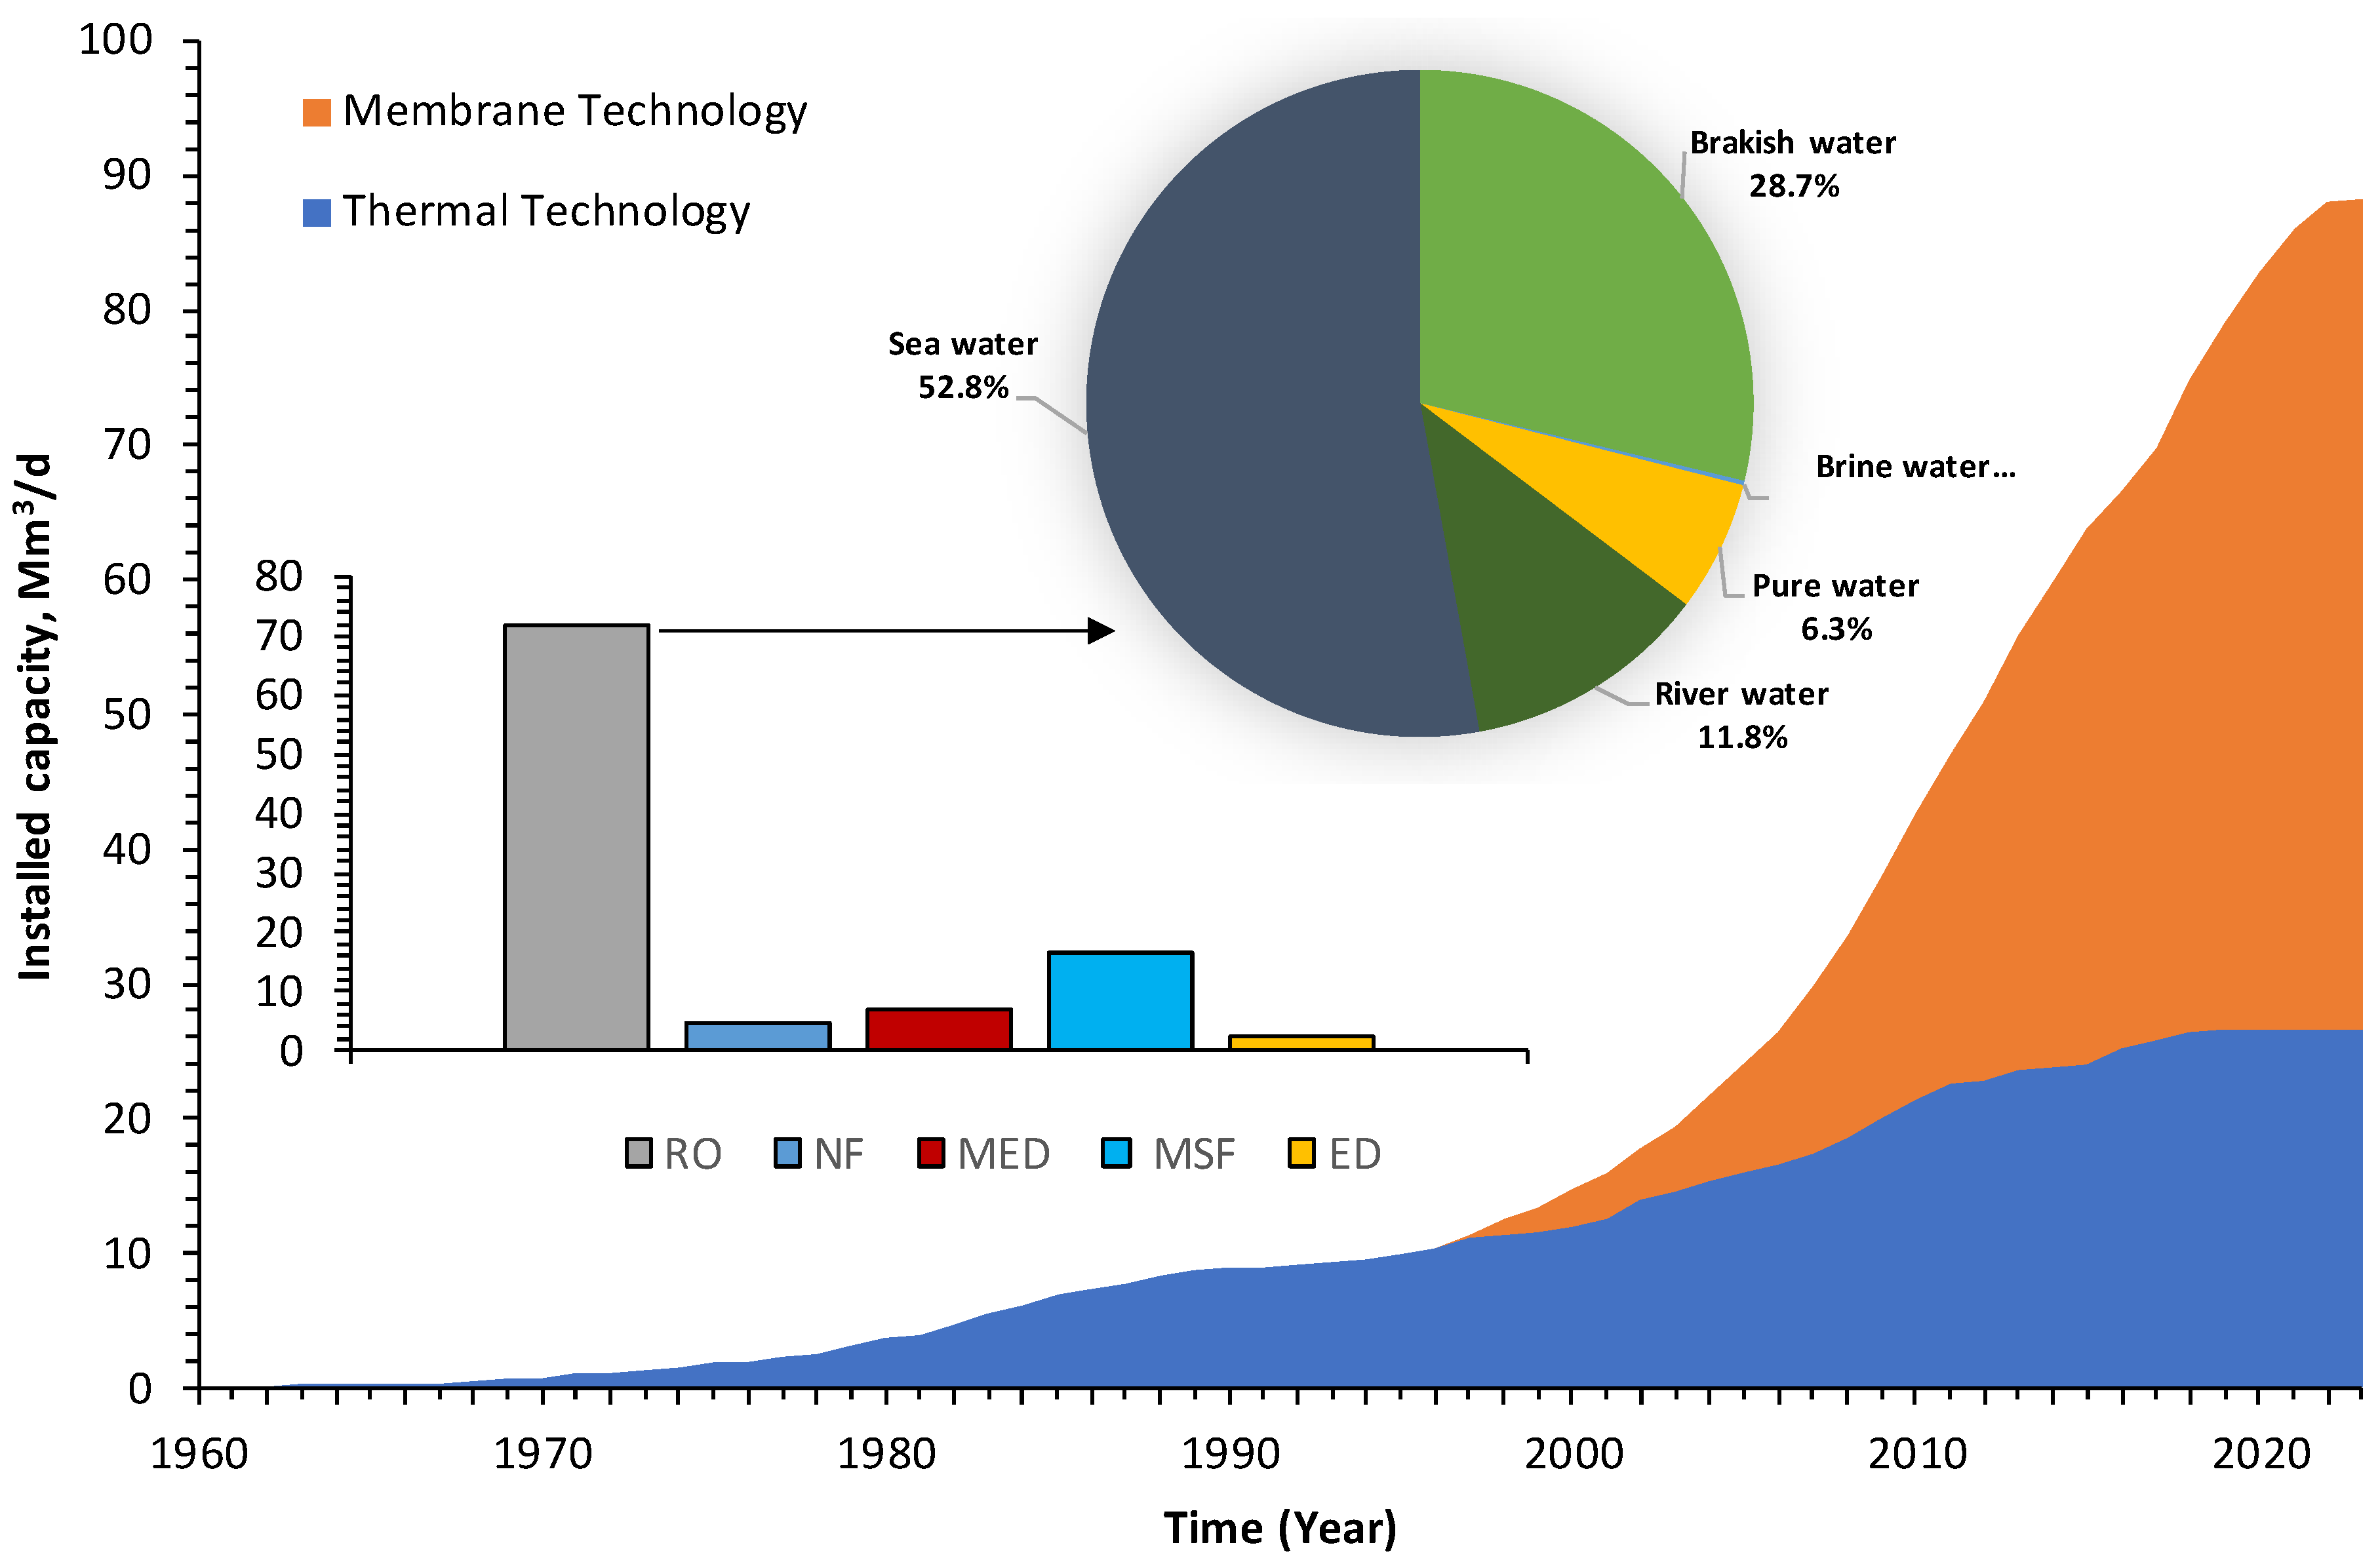
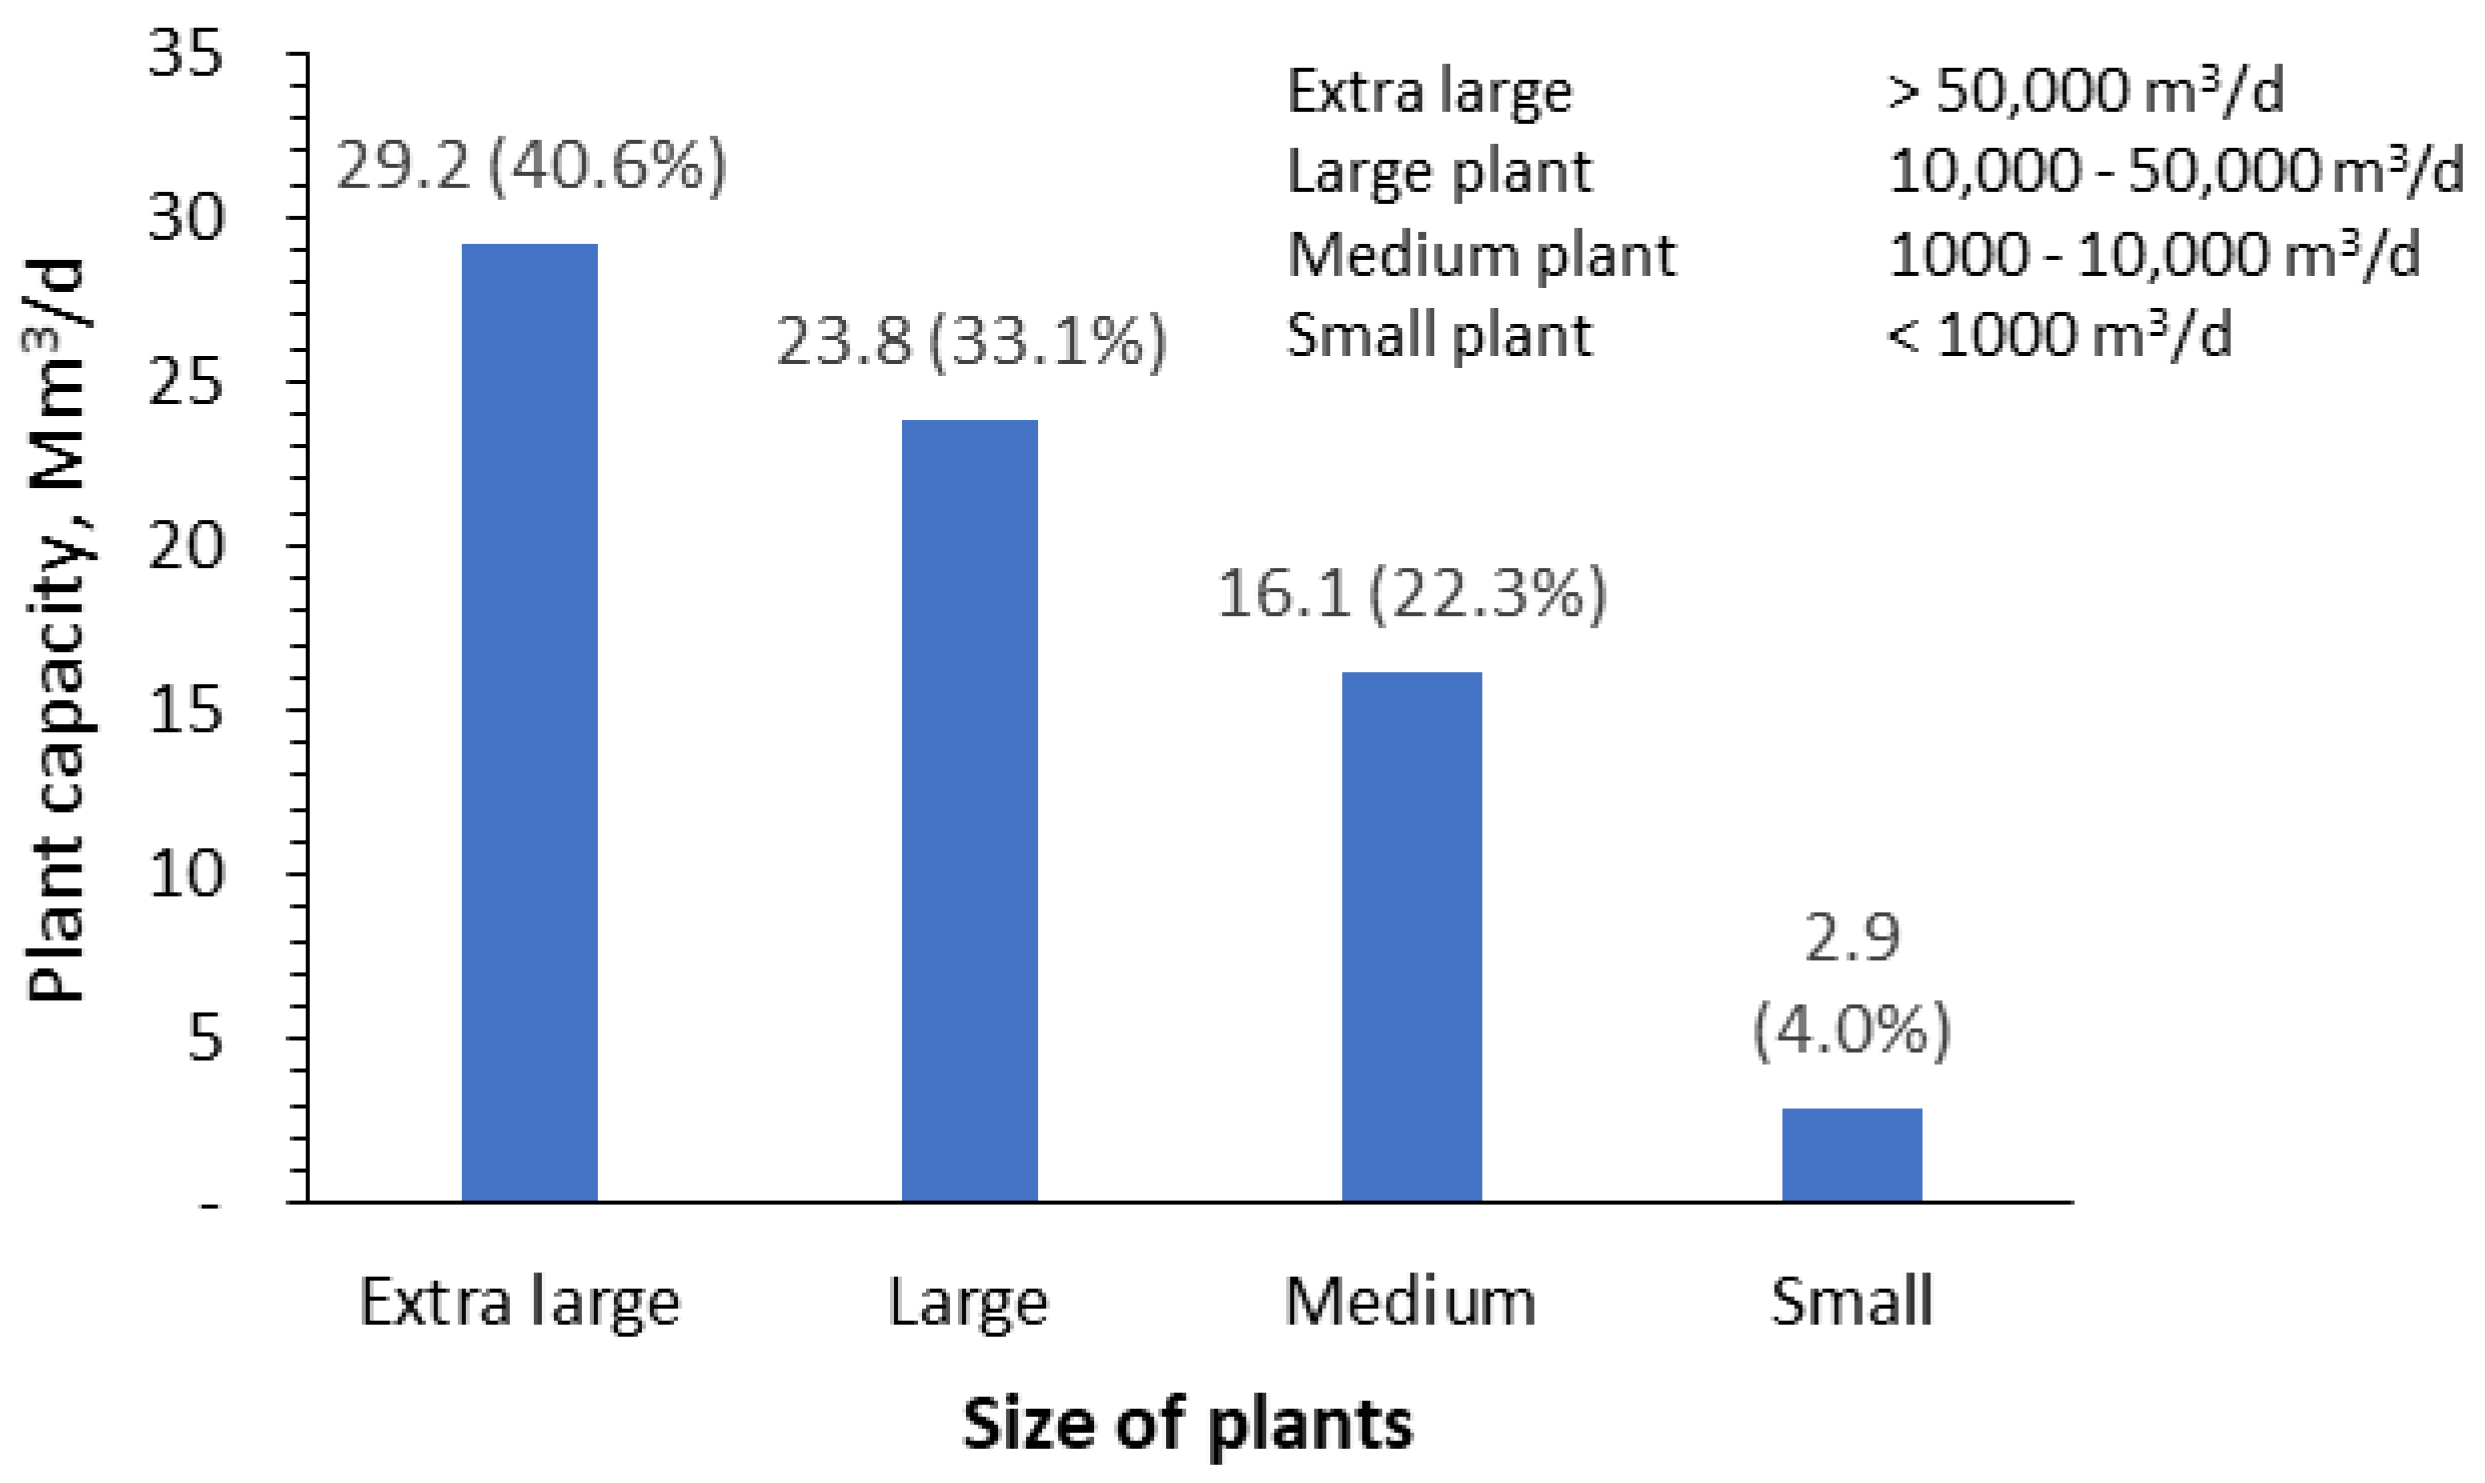
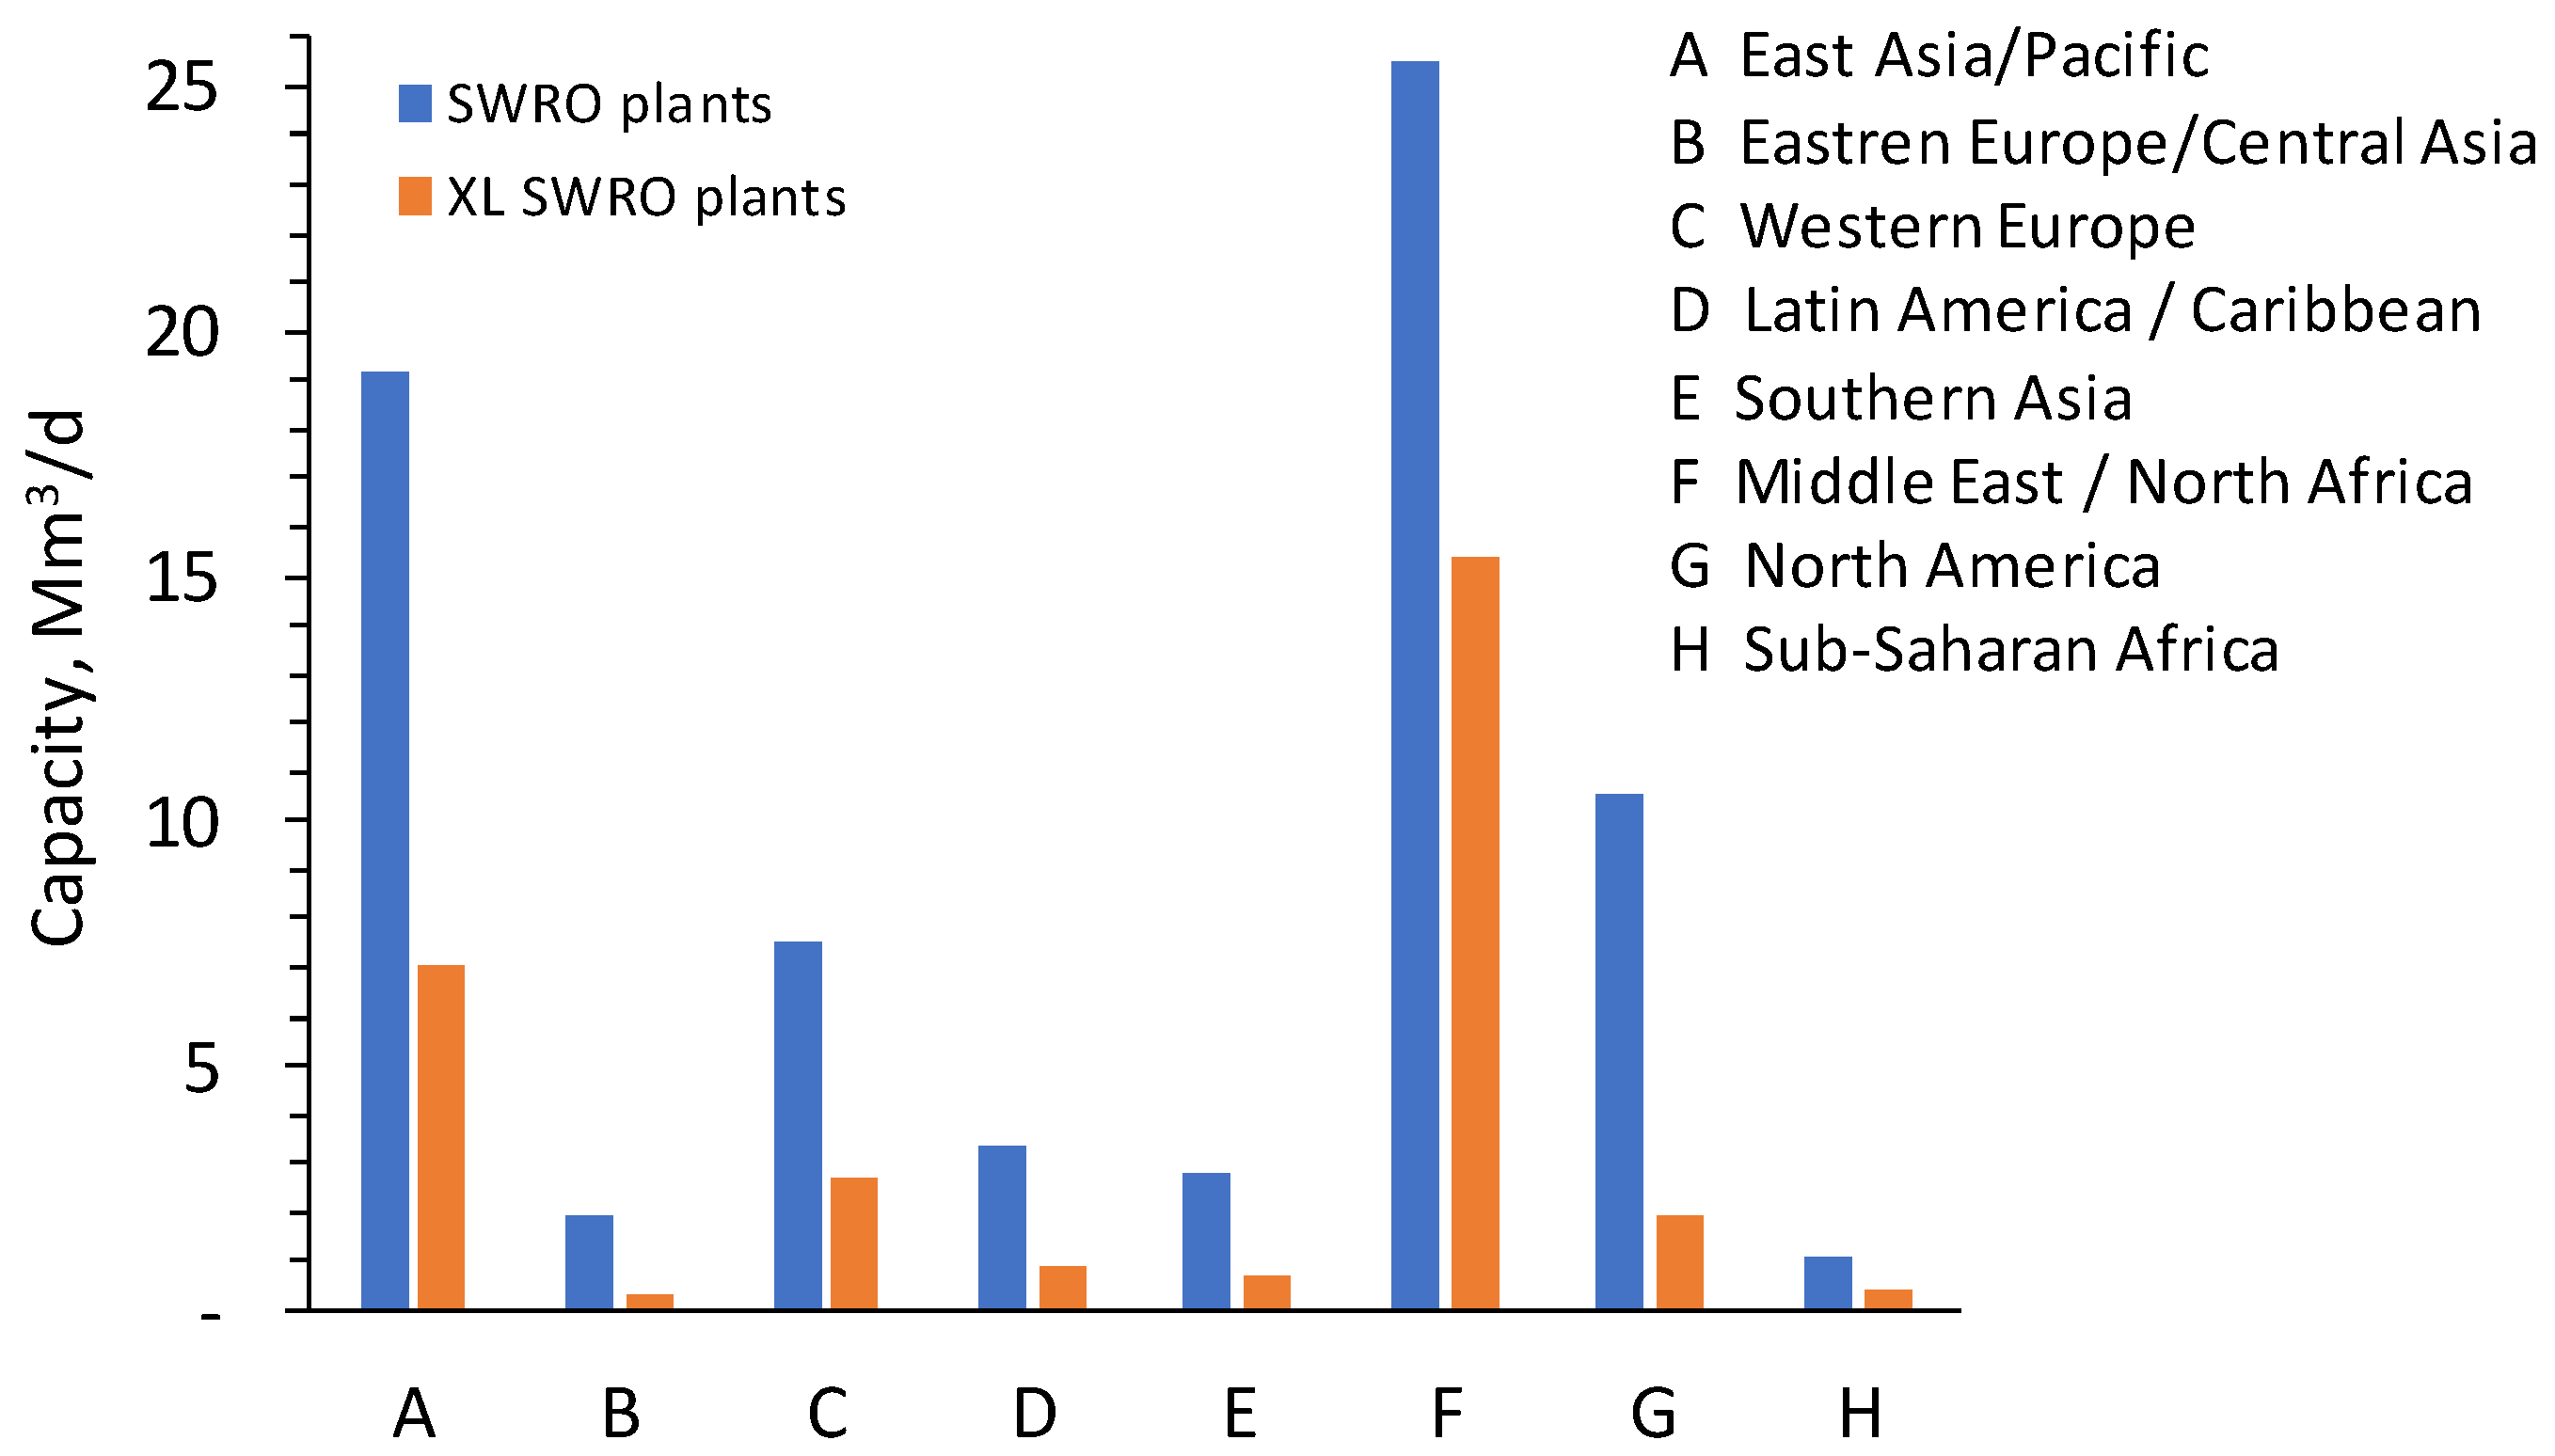
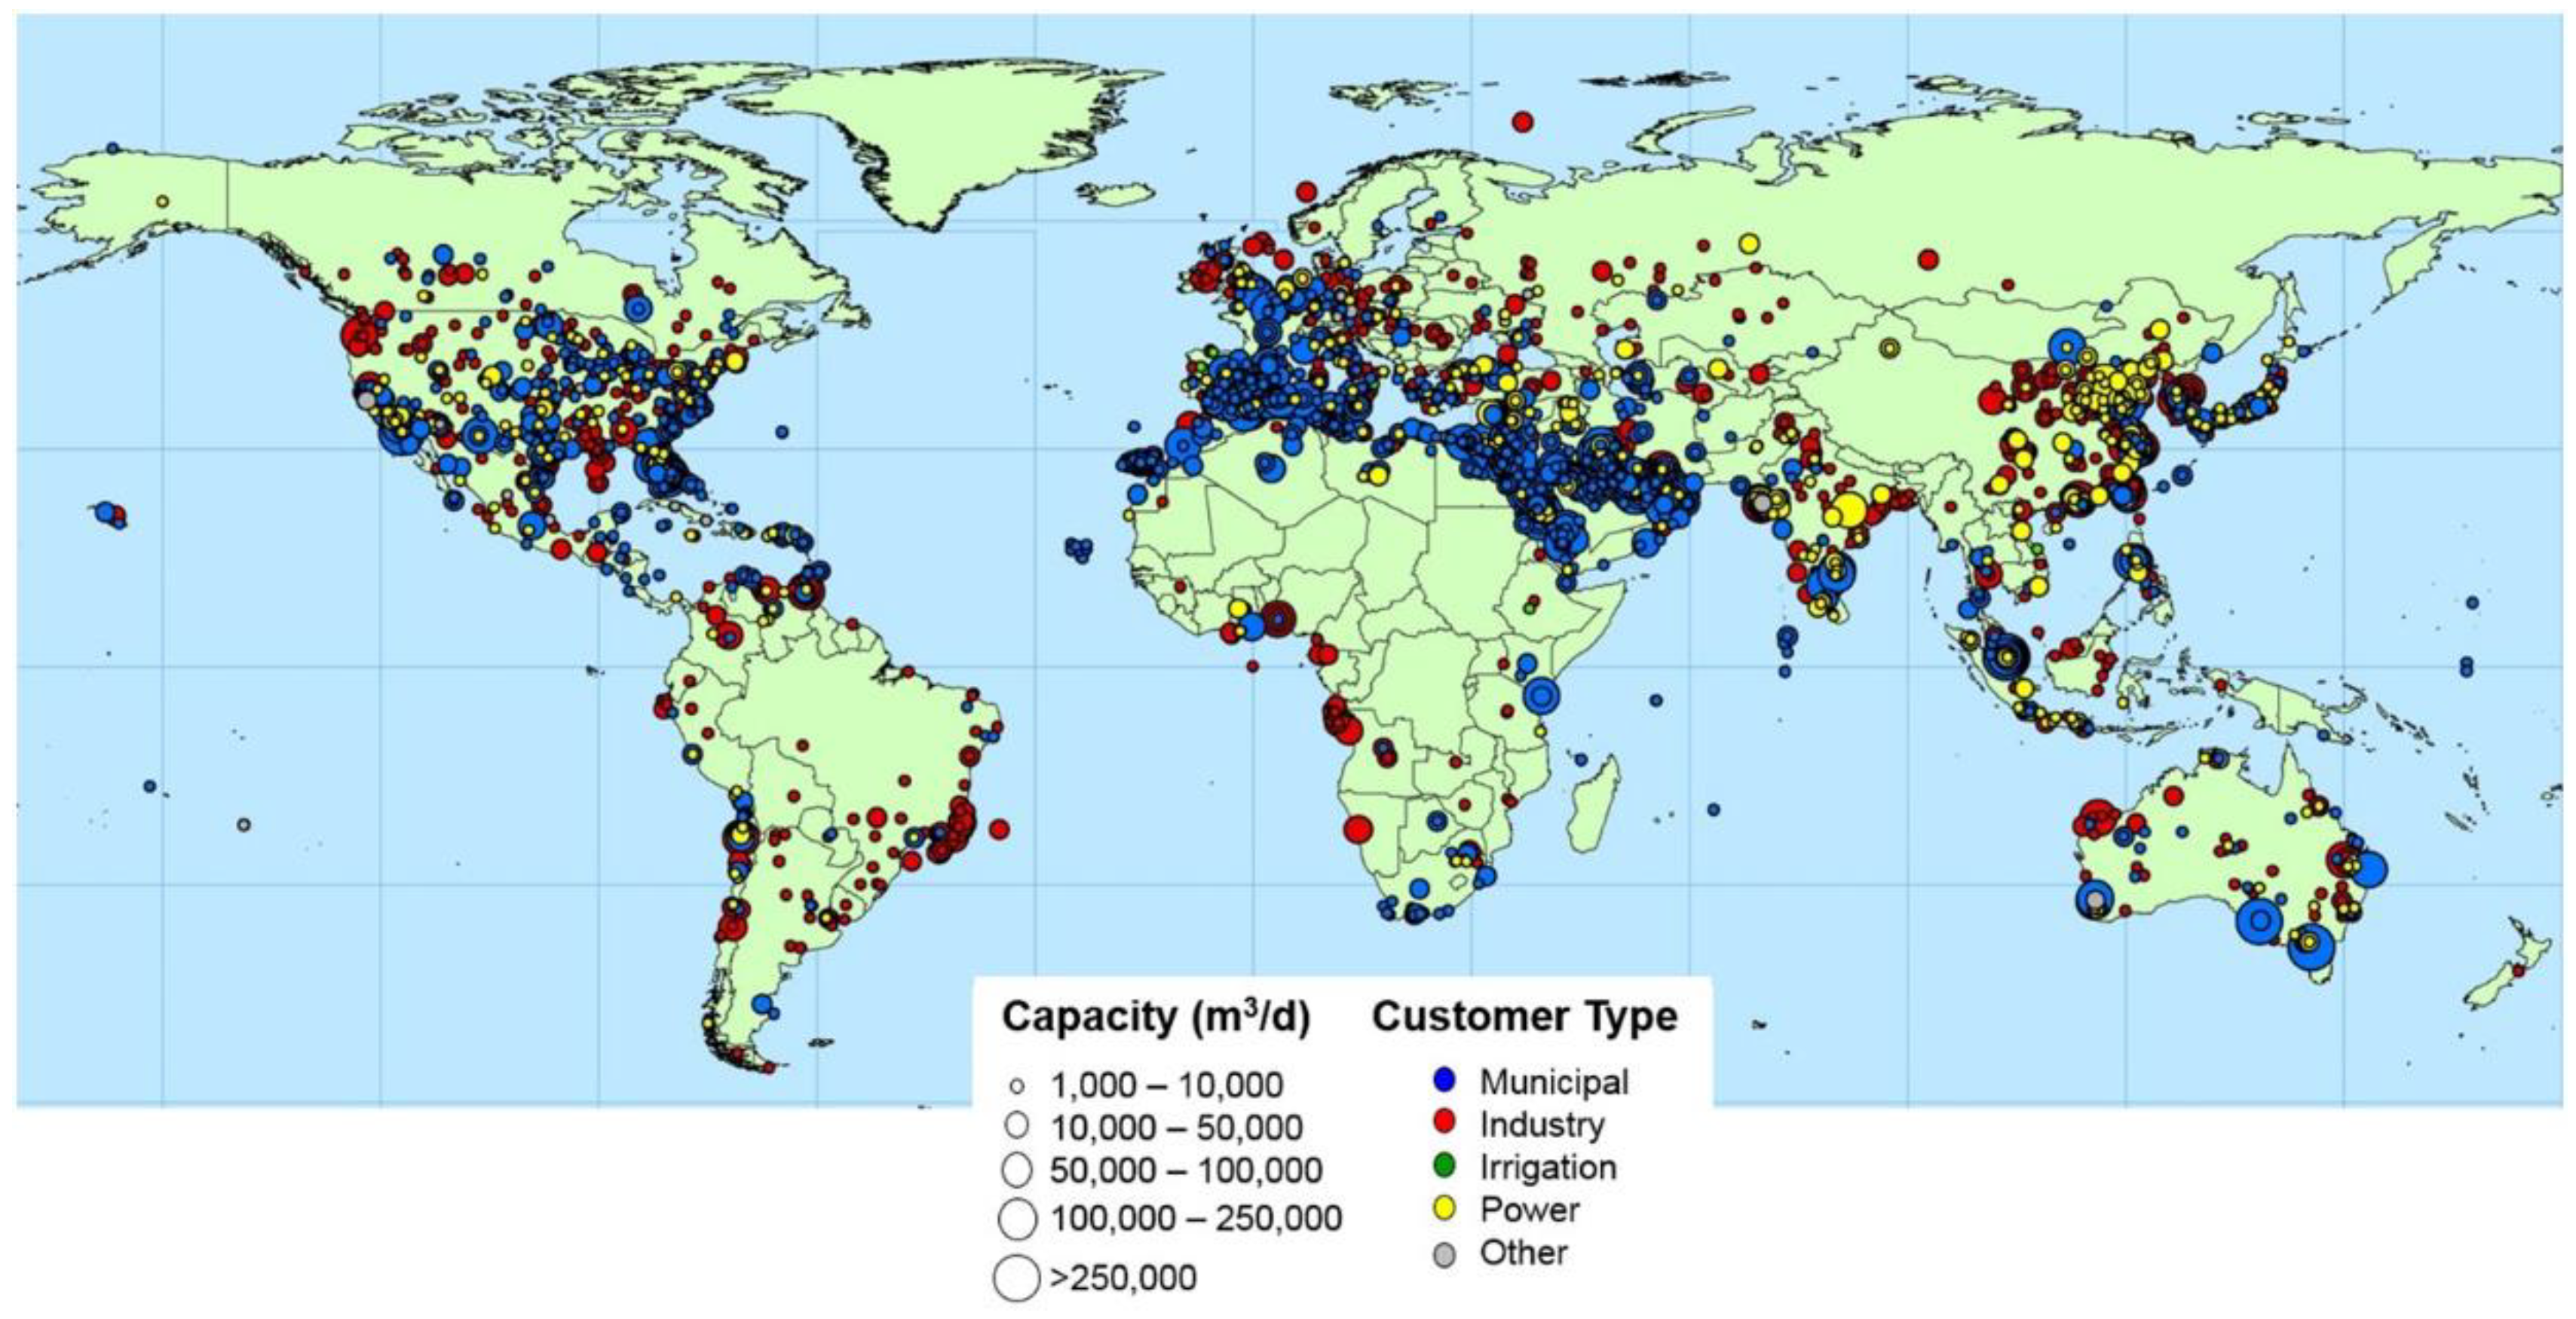
:1. Current Trends in a Global Desalination Industry
2. Is There a Need for Desalination in Developing Countries?
| Saving water | Increasing productivity in agriculture and industry |
| Reducing leakages in public water supply | |
| Imposing progressive tariffs | |
| Increasing rainwater harvesting | |
| Water transport | Transporting from long distances |
| Aquifer storage | Storing river water during high flow |
| Water reuse | Increasing reuse/recycling in industry |
| and domestic wastewater in agriculture | |
| Desalination | Using brackish water, wastewater, seawater |
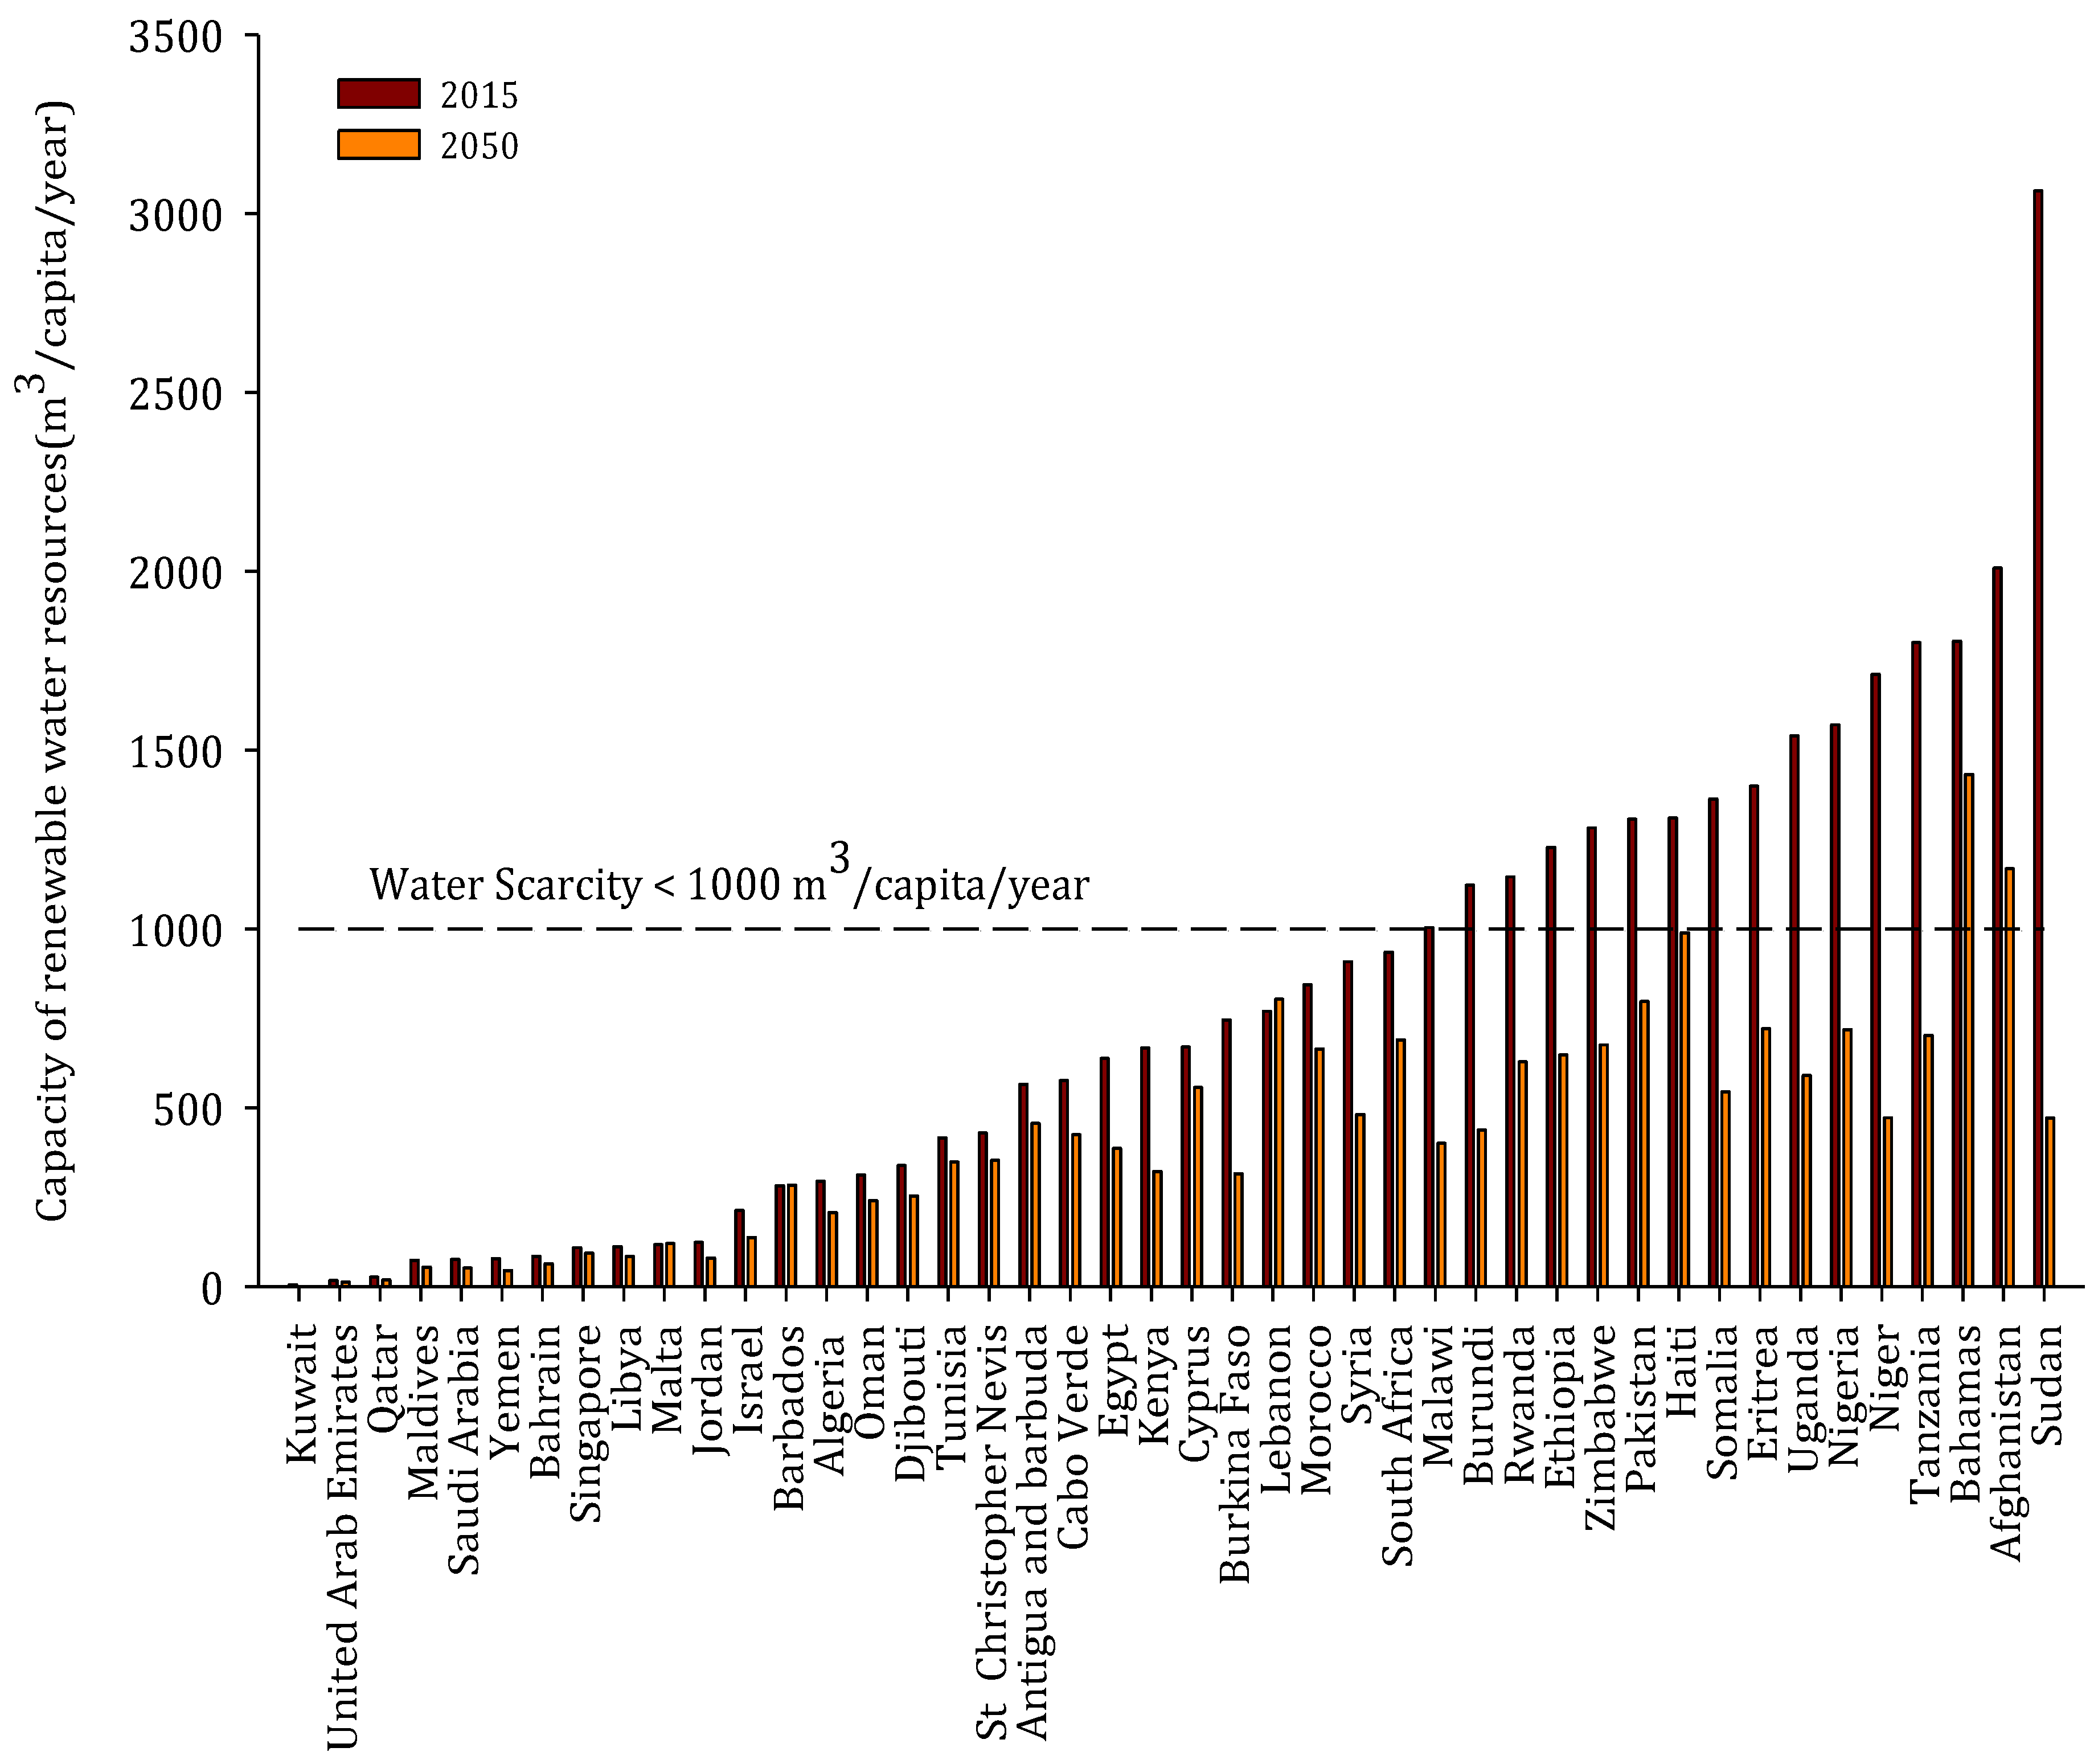
3. Current and Future Status of Desalination Market in 13 Water Scare Countries
- No withdrawal of renewable water resources to meet the water demand by population growth.
- The water demand required will only be supplied by desalination.
- Only the populations of urban areas are assumed as the potential users of desalinated water.
- The current average withdrawal for municipal purposes is assumed to be constant throughout the projection period.
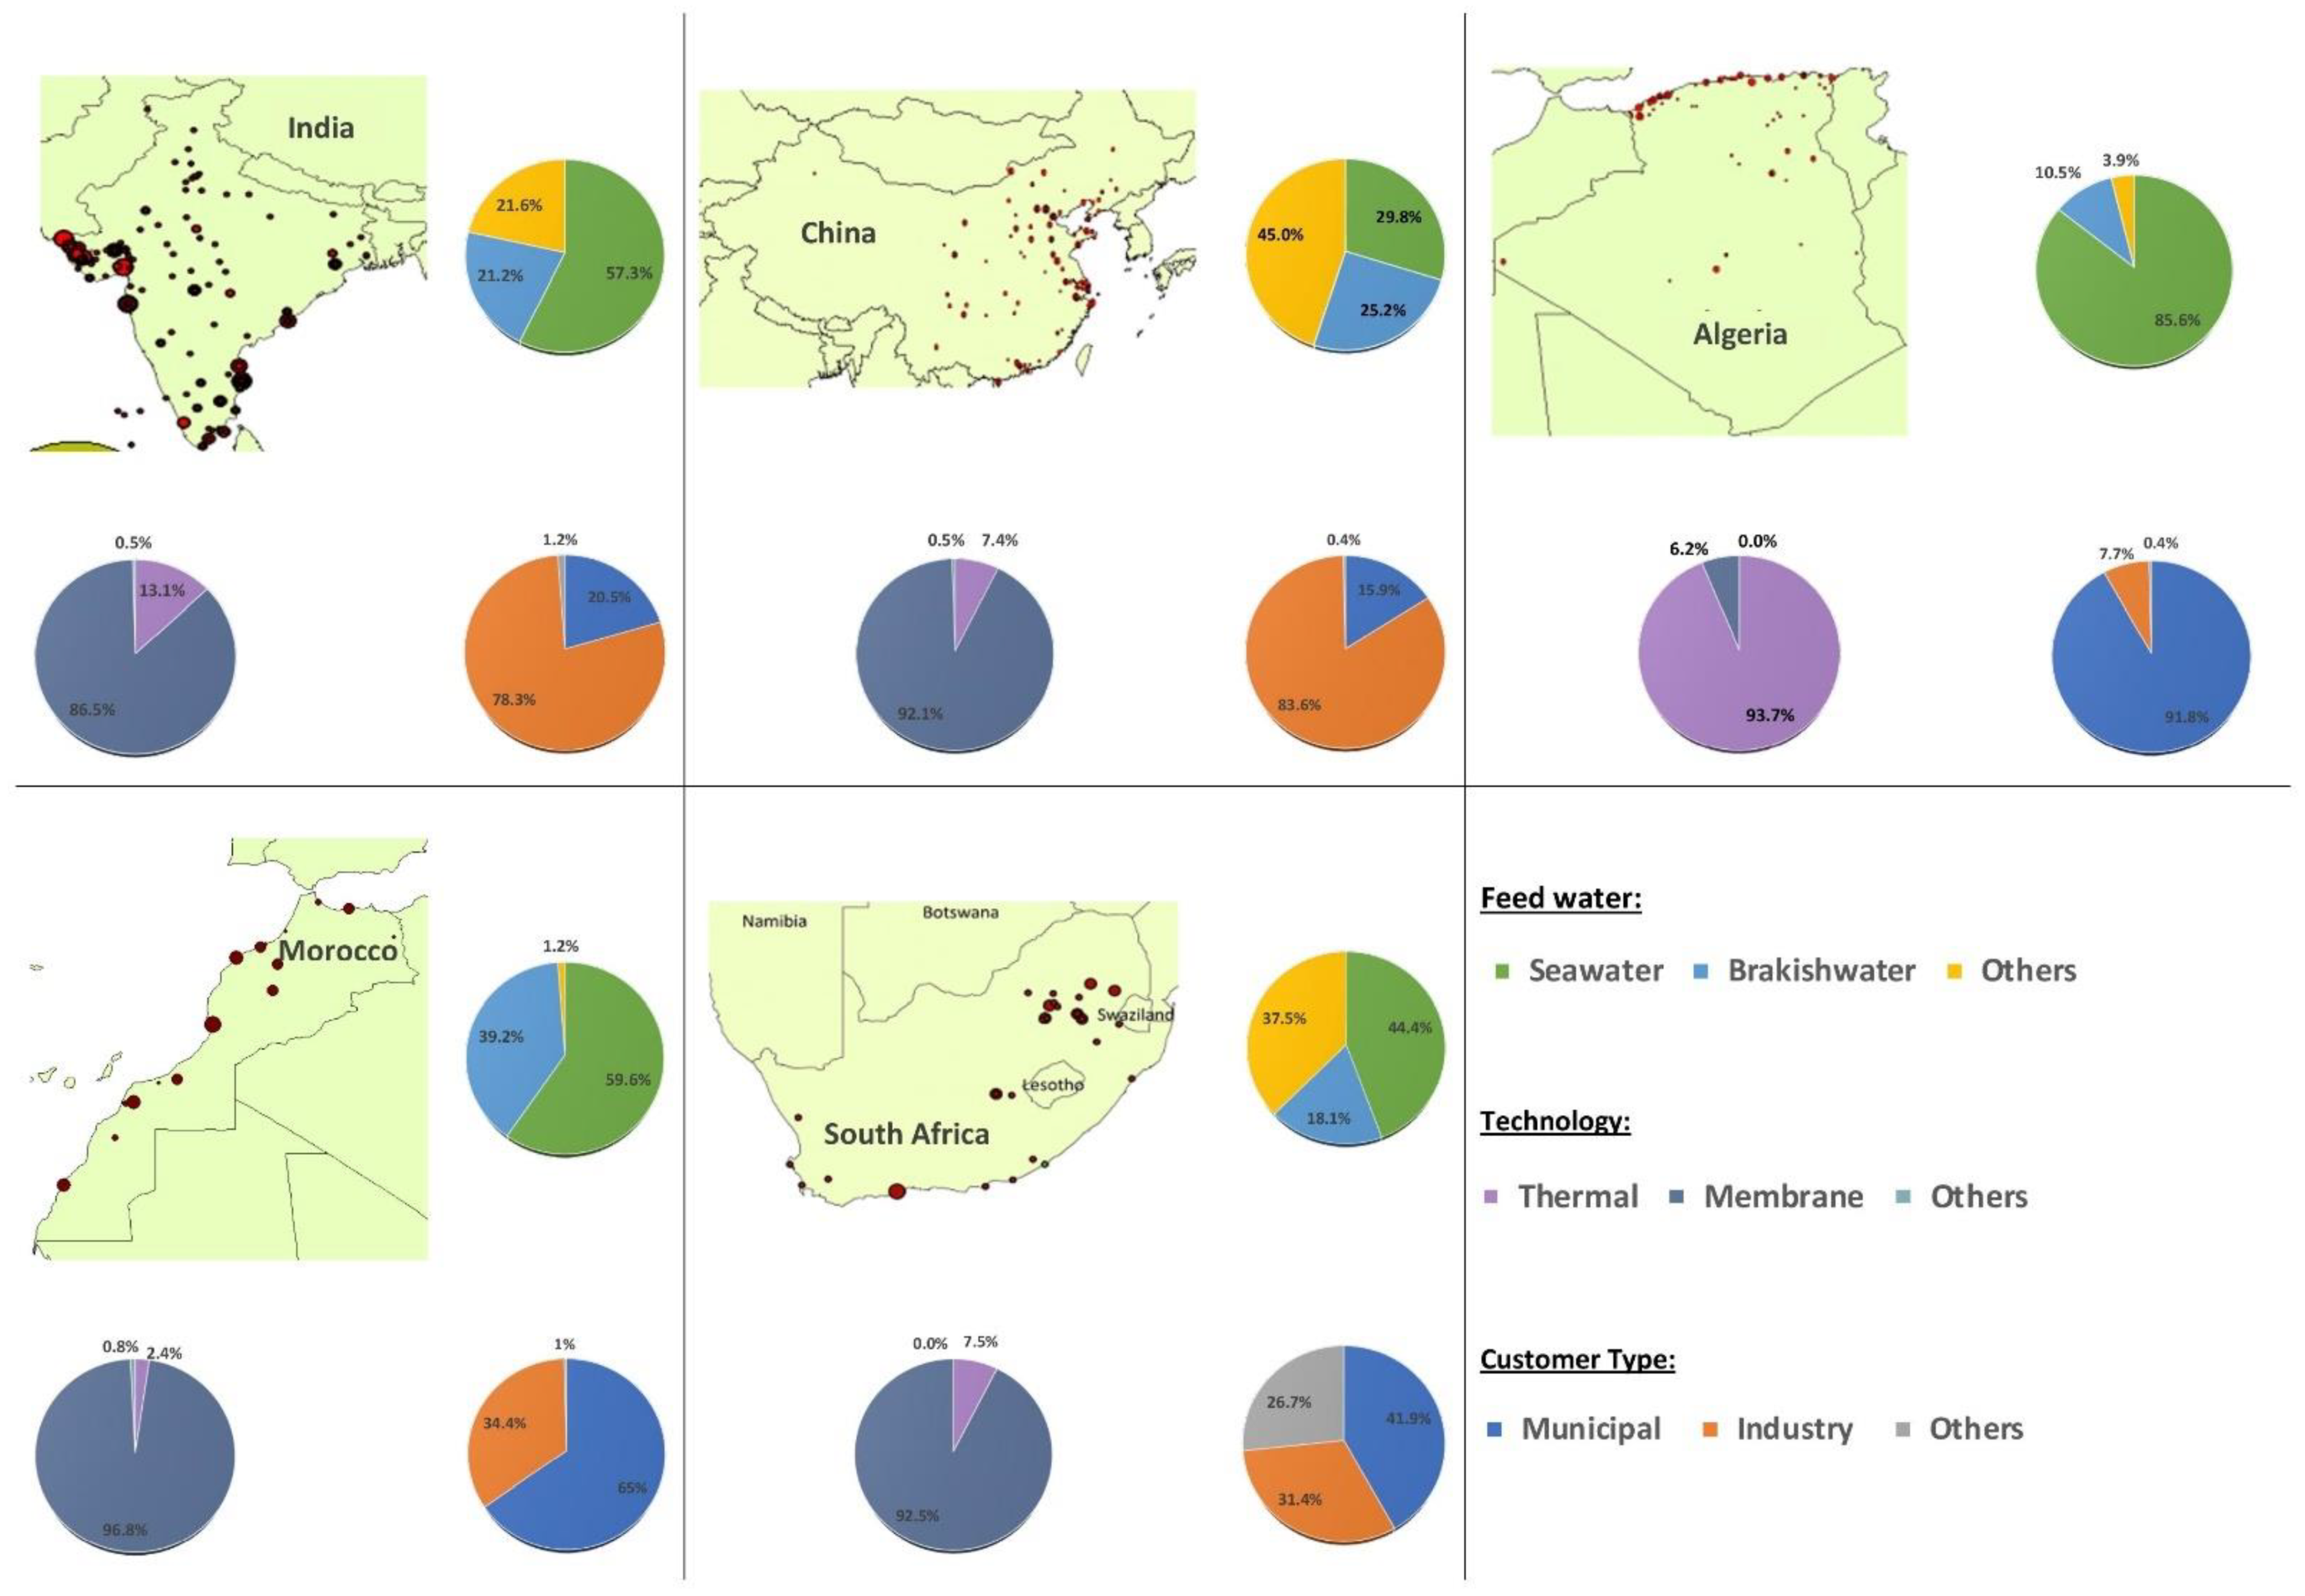
4. Case Study
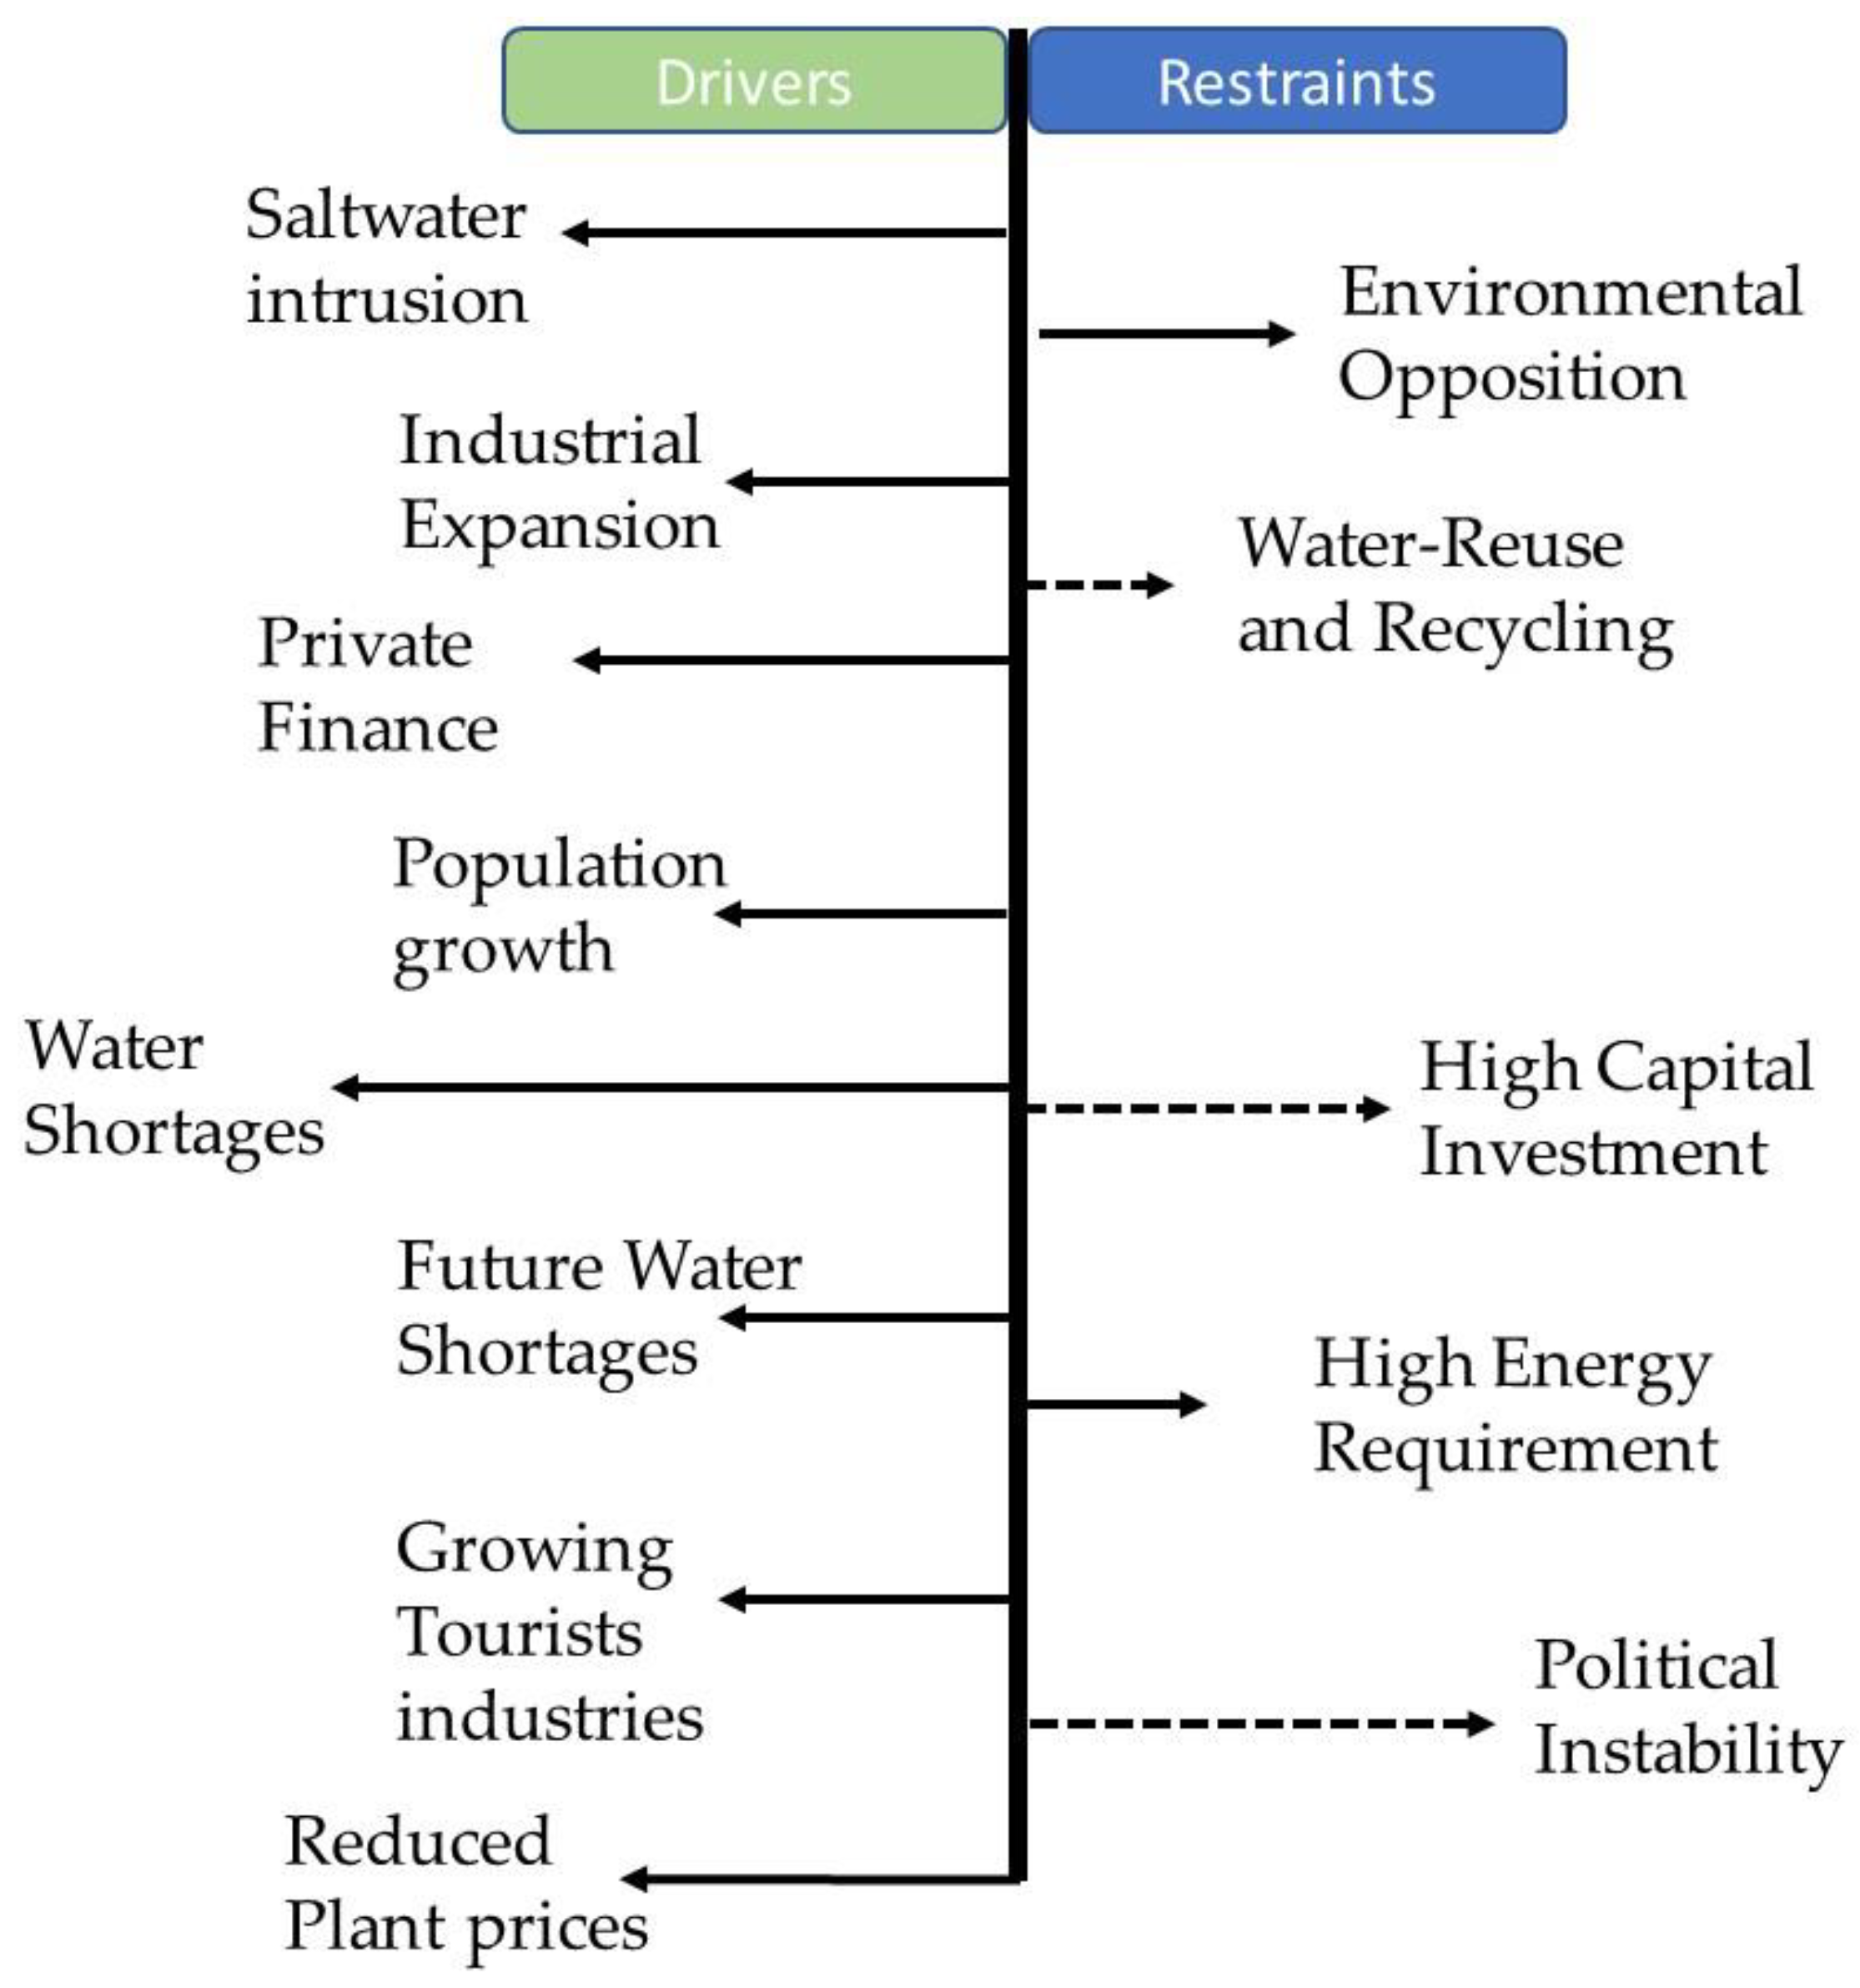
5. What Are the Challenges?
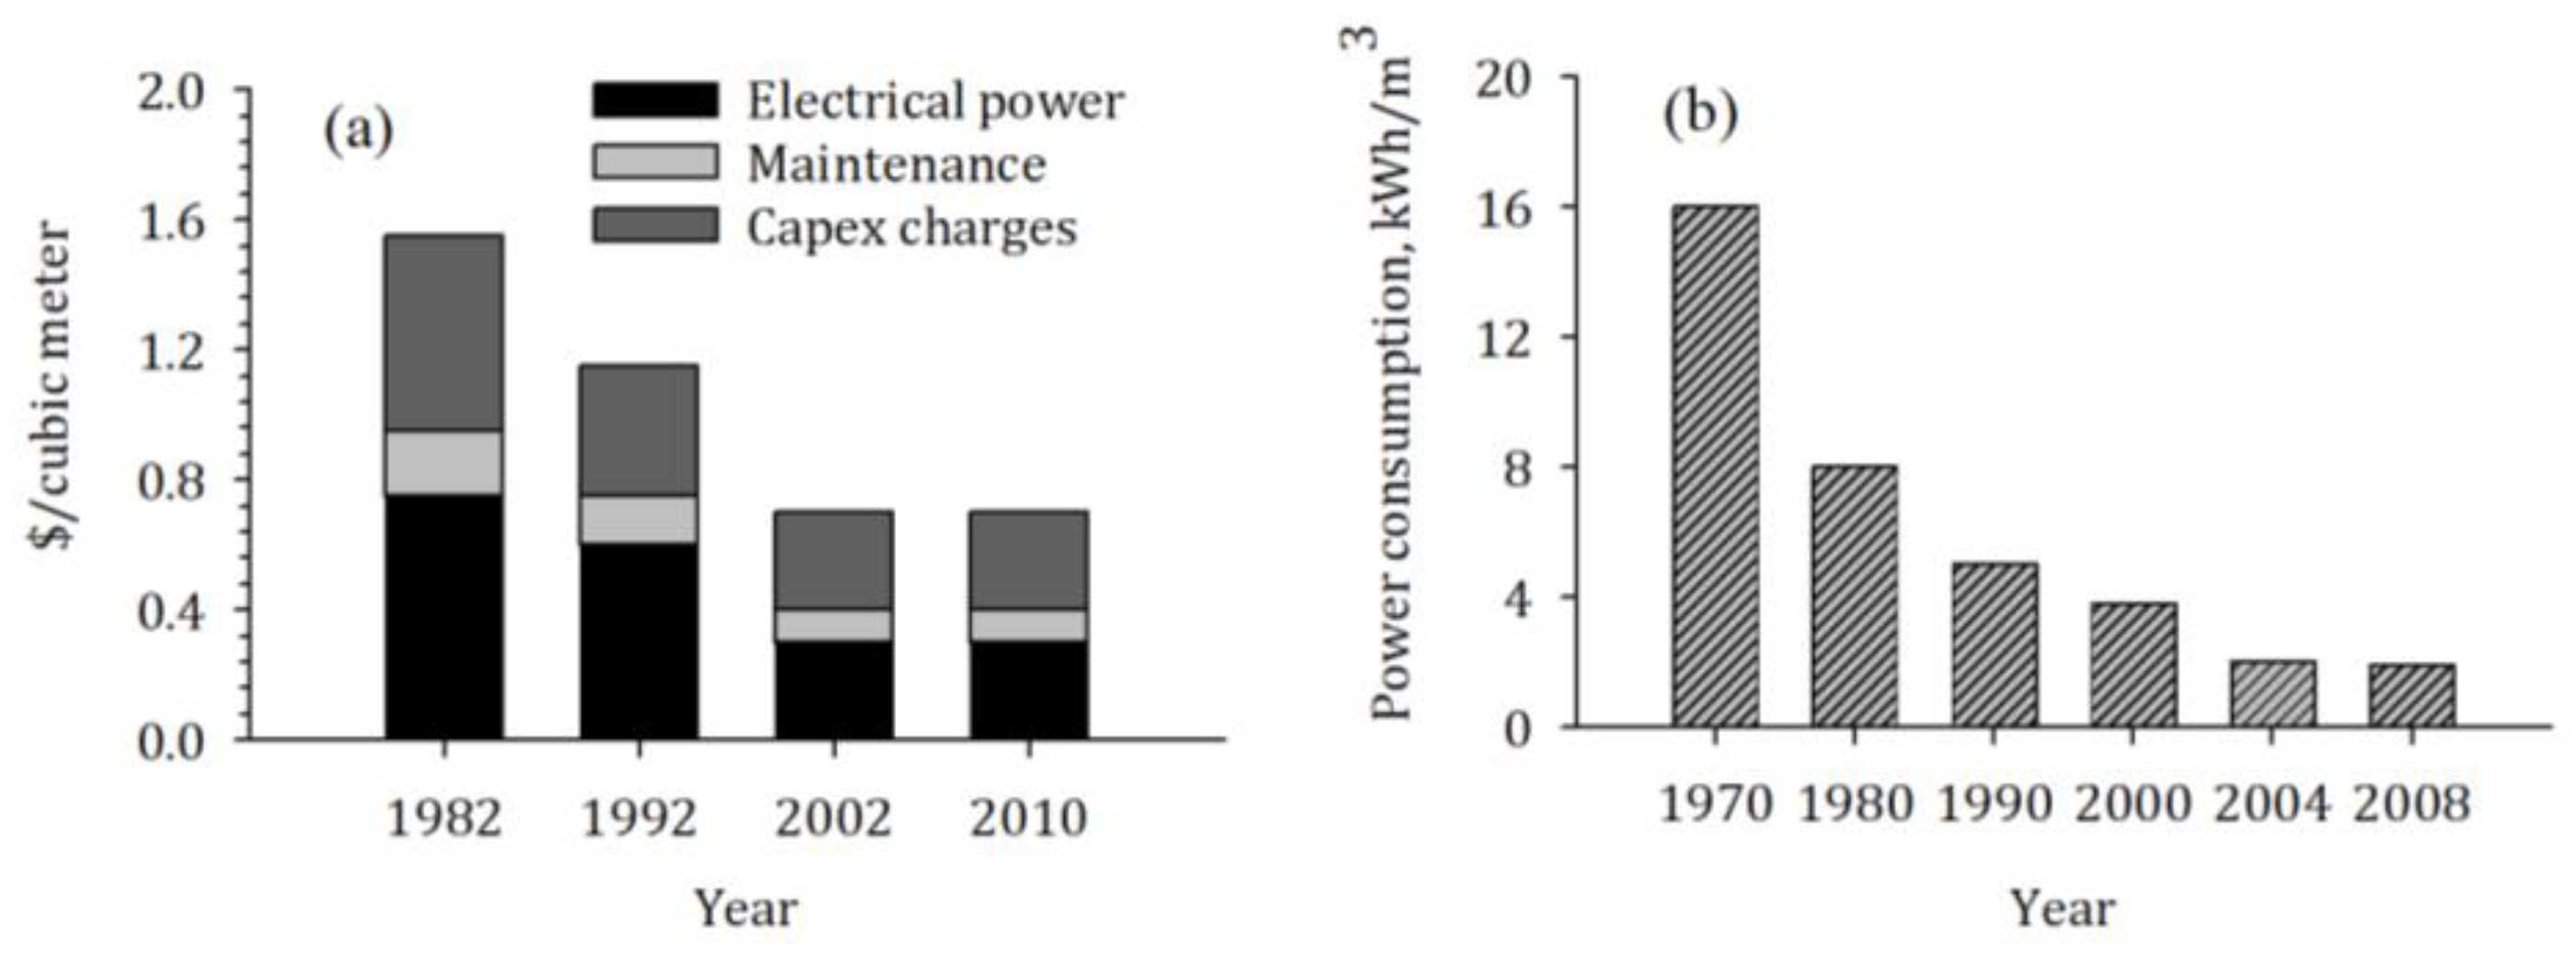
5.1. Economic Issue
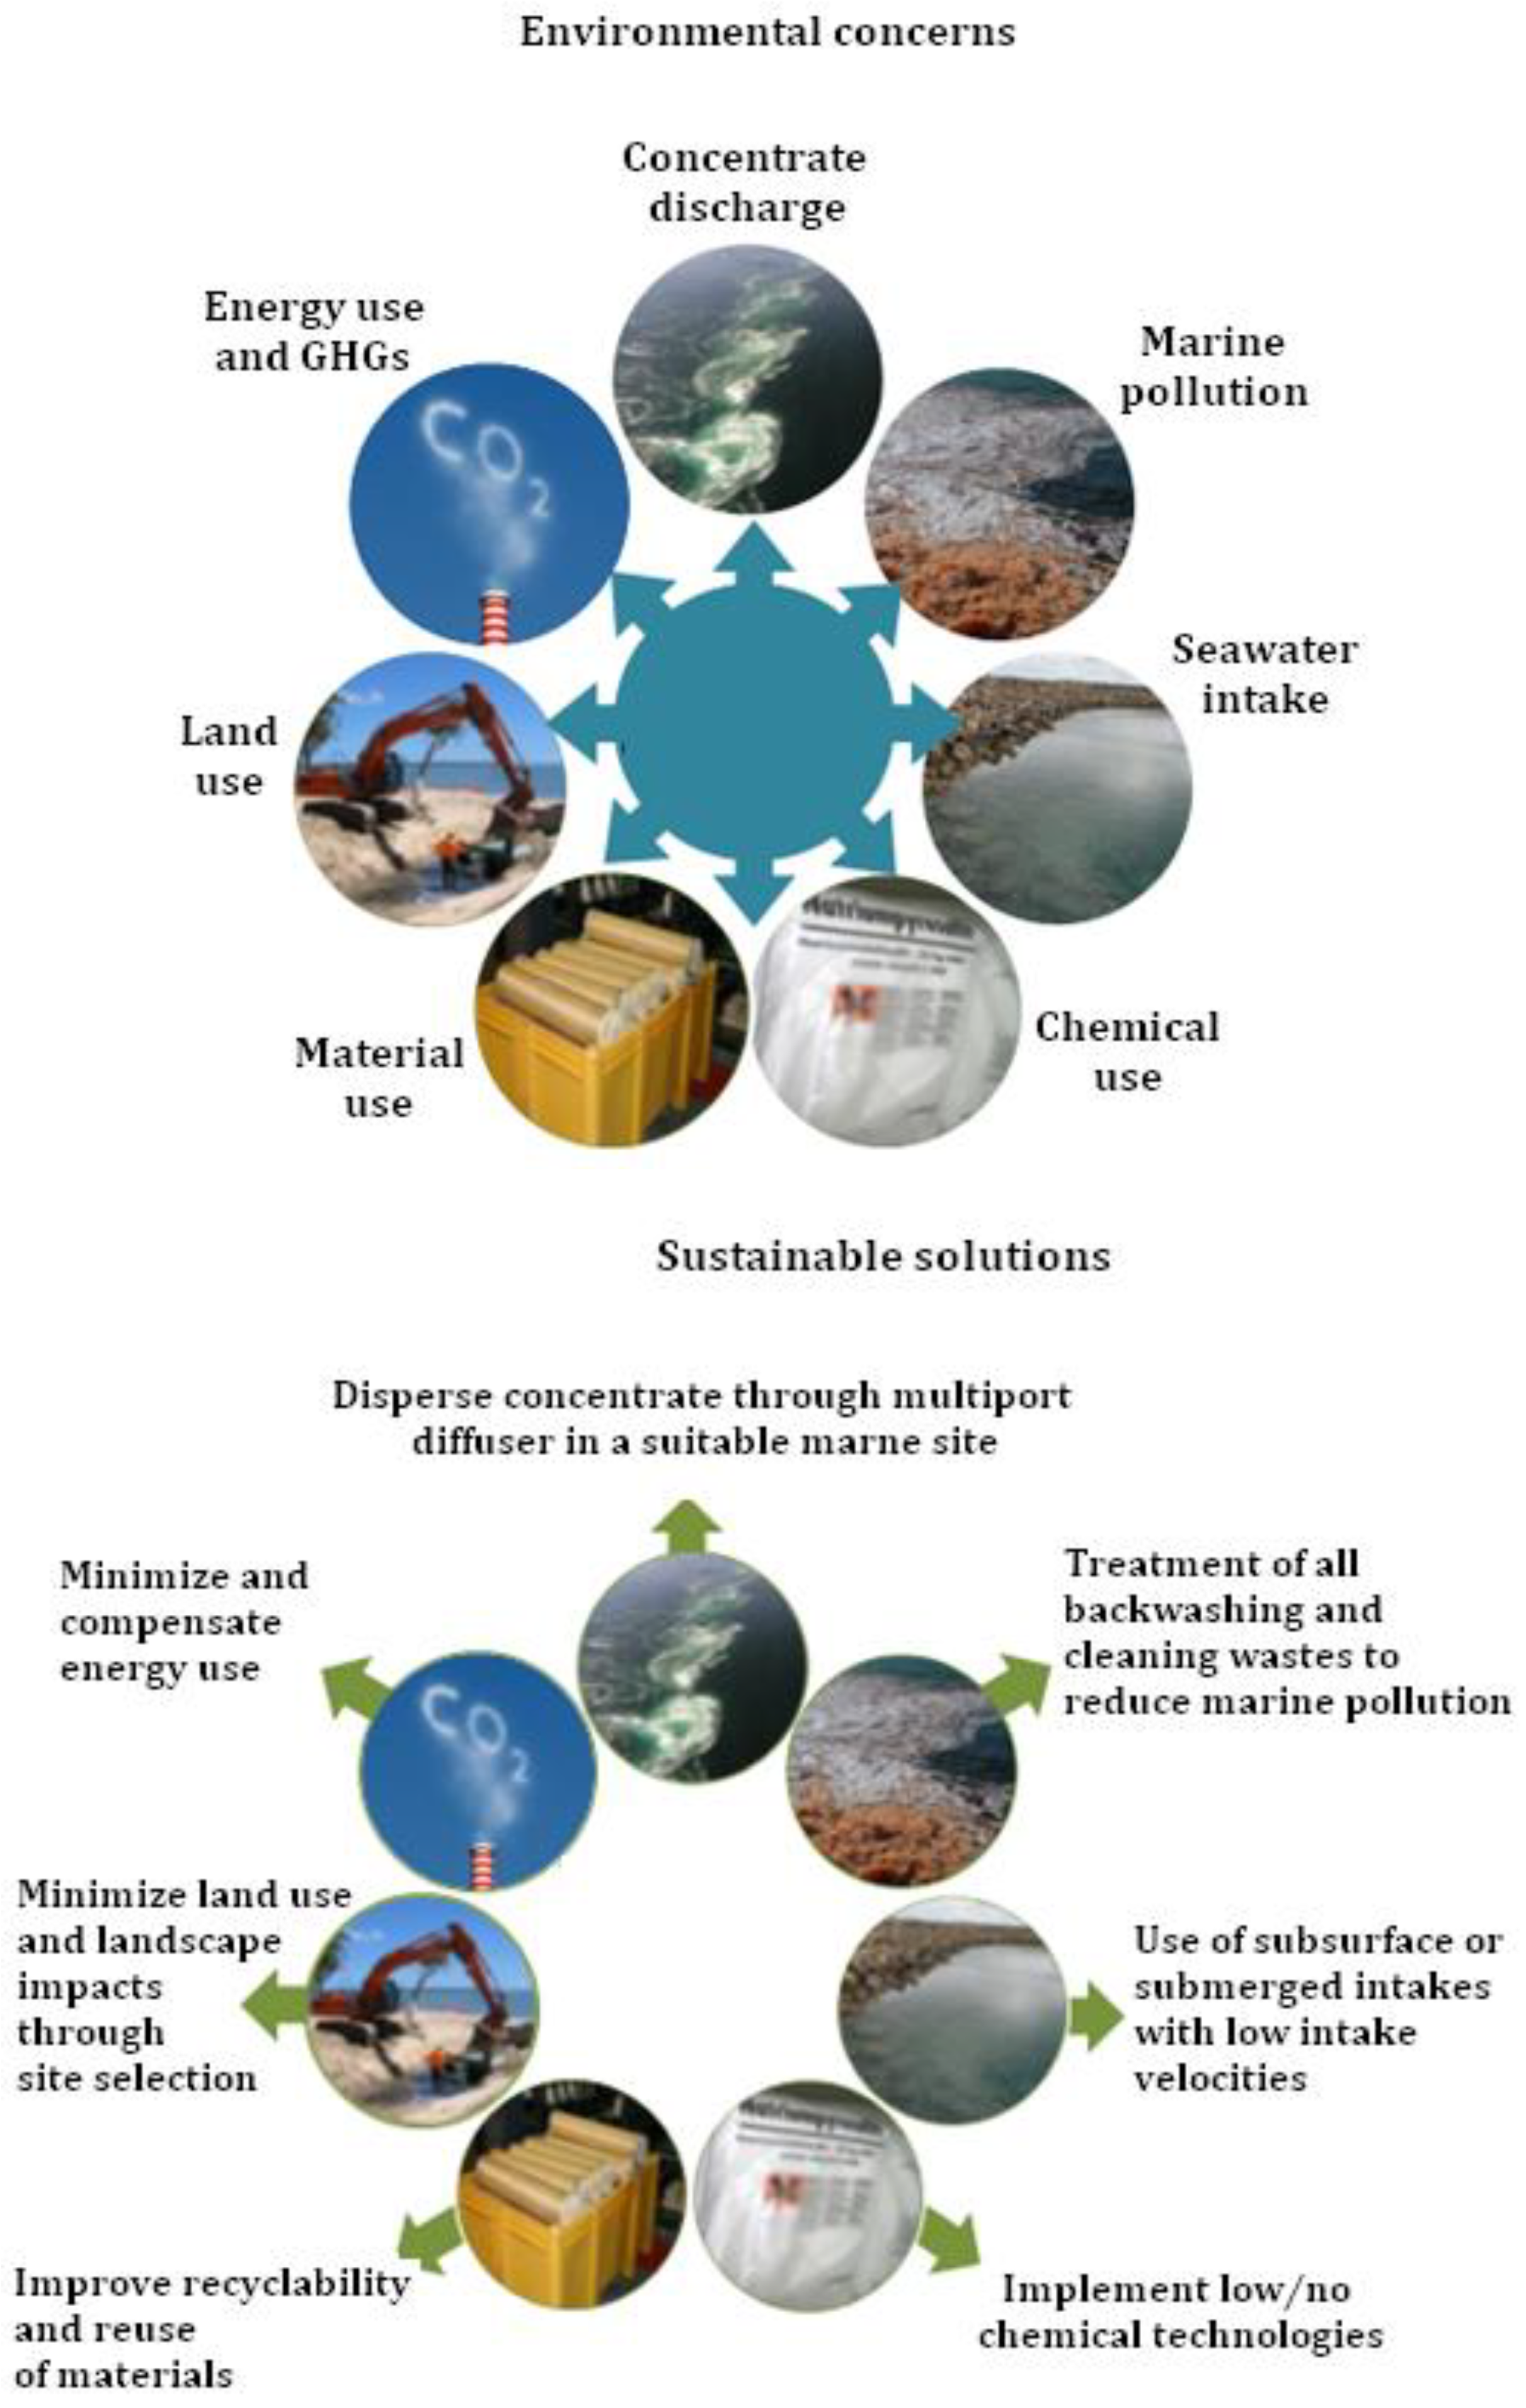
5.2. Environmental Issues
- -
- disposal of material use
- -
- land use
- -
- energy use to desalinate water and greenhouse gas (GHGs) emissions
- -
- brine discharge
- -
- high volume of chemical use
- -
- loss of aquatic organisms from marine pollution and open seawater intake
- -
- implement low or no chemical technologies
- -
- treat the chemicals before discharging into the natural water bodies
- -
- disperse the concentrate through a multiport diffuser in a suitable marine site
- -
- use subsurface or submerged intakes with low intake velocities
- -
- reuse of material
- -
- recover salts from the brine (resource recovery)
- -
- use renewable energy sources to partially/completely fulfil the energy requirements
- -
- use energy recovery devices to recover hydraulic energy
5.3. Membrane Fouling and Scaling
- -
- increase in head loss across the feed spacer of spiral wound elements
- -
- higher energy consumption to maintain the constant flux operation
- -
- higher chemical cleaning frequency
- -
- increased frequency of membrane replacement due to irreversible membrane fouling
- -
- decreased rate of water production due to longer downtime during chemical cleaning and membrane replacement
- -
- increased salt passage, thus deteriorating the permeate quality
6. Concluding Remarks
Author Contributions
Funding
Institutional Review Board Statement
Informed Consent Statement
Conflicts of Interest
References
- Wilf, M.; Awerbuch, L. The Guidebook to Membrane Desalination Technology: Reverse Osmosis, Nanofiltration and Hybrid Systems, Process, Design, Applications, and Economics; Balaban Desalination Publications: Hopkinton, MA, USA, 2007. [Google Scholar]
- Dhakal, N.; Rodriguez, S.G.S.; Schippers, J.C.; Kennedy, M.D. Perspectives and challenges for desalination in developing countries. IDA J. Desalination Water Reuse 2014, 6, 10–14. [Google Scholar] [CrossRef]
- Desal Data. 2020. Available online: www.DesalData.com (accessed on 1 January 2020).
- Caron, D.A.; Garneau, M.-È.; Seubert, E.; Howard, M.D.; Darjany, L.; Schnetzer, A.; Cetinic, I.; Filteau, G.; Lauri, P.; Jones, B. Harmful algae and their potential impacts on desalination operations off southern California. Water Res. 2010, 44, 385–416. [Google Scholar] [CrossRef] [PubMed]
- Jones, E.; Qadir, M.; van Vliet, M.T.; Smakhtin, V.; Kang, S.-M. The state of desalination and brine production: A global outlook. Sci. Total Environ. 2019, 657, 1343–1356. [Google Scholar] [CrossRef] [PubMed]
- Elimelech, M.; Phillip, W.A. The Future of Seawater Desalination: Energy, Technology, and the Environment. Science 2011, 333, 712–717. [Google Scholar] [CrossRef] [PubMed]
- Pinto, F.S.; Marques, R.C. Desalination projects economic feasibility: A standardization of cost determinants. Renew. Sustain. Energy Rev. 2017, 78, 904–915. [Google Scholar] [CrossRef]
- Darre, N.C.; Toor, G.S. Desalination of Water: A Review. Curr. Pollut. Rep. 2018, 4, 104–111. [Google Scholar] [CrossRef]
- Water Reuse Association. Seawater Desalination Costs, White Paper. 2012. Available online: https://watereuse.org/wp-content/uploads/2015/10/WateReuse_Desal_Cost_White_Paper.pdf (accessed on 15 February 2022).
- Elimelech, M. Seawater Desalination. In Proceedings of the 2012 NWRI Clarke Prize Conference, Newport Beach, CA, USA, 2 November 2012. [Google Scholar]
- Fragkou, M.C.; McEvoy, J. Trust matters: Why augmenting water supplies via desalination may not overcome perceptual water scarcity. Desalination 2016, 397, 1–8. [Google Scholar] [CrossRef] [Green Version]
- Villacorte, L.O.; Tabatabai, S.A.A.; Dhakal, N.; Amy, G.L.; Schippers, J.C.; Kennedy, M.D. Algal blooms: An emerging threat to seawater reverse osmosis desalination. Desalination Water Treat. 2015, 55, 2601–2611. [Google Scholar] [CrossRef]
- Brown, A.; Matlock, M.D. A Review of Water Scarcity Indices and Methodologies. The Sustainability Consortium 2011, Whitepaper 106. Available online: https://sustainabilityconsortium.org/download/a-review-of-water-scarcity-indices-and-methodologies/ (accessed on 10 February 2022).
- Bremere, I.; Kennedy, M.; Stikker, A.; Schippers, J. How water scarcity will effect the growth in the desalination market in the coming 25 years. Desalination 2001, 138, 7–15. [Google Scholar] [CrossRef]
- FAO Aquastat. 2021. Available online: http://www.fao.org/nr/water/aquastat/data/query/results.html (accessed on 20 February 2022).
- World Bank. 2021. Available online: http://databank.worldbank.org/data/reports.aspx?source=Health%20Nutrition%20and%20Population%20Statistics:%20Population%20estimates%20and%20projections# (accessed on 20 February 2022).
- Baggio, G.; Qadir, M.; Smakhtin, V. Freshwater availability status across countries for human and ecosystem needs. Sci. Total Environ. 2021, 792, 148230. [Google Scholar] [CrossRef]
- UNICEF. Increasing Water Scarcity in Gaza through Seawater Desalination—WASH Field Note. 2018. Available online: https://www.unicef.org/media/91396/file/Increasing-Water-Security-in-Gaza-through-Seawater-Desalination.pdf (accessed on 28 February 2022).
- PWA. Toward Building a Palestinian State from Water Perspective. In National Water Strategy for Palestine; Palestinian Water Authority: Ramallah, Palestine, 2012. [Google Scholar]
- Shannon, M.A.; Bohn, P.W.; Elimelech, M.; Georgiadis, J.G.; Mariñas, B.J.; Mayes, A.M. Science and technology for water purification in the coming decades. Nature 2008, 452, 301–310. [Google Scholar] [CrossRef] [PubMed]
- Flemming, H.-C.; Schaule, G.; Griebe, T.; Schmitt, J.; Tamachkiarowa, A. Biofouling—The Achilles heel of membrane processes. Desalination 1997, 113, 215–225. [Google Scholar] [CrossRef]
- Matin, A.; Khan, Z.; Zaidi, S.M.J.; Boyce, M.C. Biofouling in reverse osmosis membranes for seawater desalination: Phenomena and prevention. Desalination 2011, 281, 1–16. [Google Scholar] [CrossRef]
- Nellen, A. Desalination: A Viable Answer to Deal with Water Crises? Future Direction International: Nedlands, WA, Australia, 2011. [Google Scholar]
- Rastogi, N.I.T.A.N.K.; Trivedi, M.K. PESTLE Technique—A tool to identify external risks in construction projects. Int. Res. J. Eng. Technol. (IRJET) 2016, 3, 384–388. [Google Scholar]
- Thi, H.T.D.; Pasztor, T.; Fozer, D.; Manenti, F.; Toth, A.J. Comparison of Desalination Technologies Using Renewable Energy Sources with Life Cycle, PESTLE, and Multi-Criteria Decision Analyses. Water 2021, 13, 3023. [Google Scholar] [CrossRef]
- Gude, V.G. Desalination and sustainability—An appraisal and current perspective. Water Res. 2016, 89, 87–106. [Google Scholar] [CrossRef] [PubMed]
- Ghaffour, N.; Missimer, T.M.; Amy, G.L. Technical review and evaluation of the economics of water desalination: Current and future challenges for better water supply sustainability. Desalination 2013, 309, 197–207. [Google Scholar] [CrossRef] [Green Version]
- Lattemann, S.; Höpner, T. Environmental impact and impact assessment of seawater desalination. Desalination 2008, 220, 1–15. [Google Scholar] [CrossRef]
- Dawoud, M.A.; Al Mulla, M.M. Environmental Impacts of Seawater Desalination: Arabian Gulf Case Study. Int. J. Environ. Sustain. 2012, 1, 22–37. [Google Scholar] [CrossRef]
- Cherif, H.; Belhadj, J. Chapter 15—Environmental Life Cycle Analysis of Water Desalination Processes. In Sustainable Desalination Handbook; Gude, V.G., Ed.; Butterworth-Heinemann: Oxford, UK, 2018; pp. 527–559. [Google Scholar] [CrossRef]
- Rebitzer, G.; Ekvall, T.; Frischknecht, R.; Hunkeler, D.; Norris, G.; Rydberg, T.; Schmidt, W.-P.; Suh, S.; Weidema, B.P.; Pennington, D.W. Life cycle assessment: Part 1: Framework, goal and scope definition, inventory analysis, and applications. Environ. Int. 2004, 30, 701–720. [Google Scholar] [CrossRef]
- Mälkki, H.; Alanne, K. An overview of life cycle assessment (LCA) and research-based teaching in renewable and sustainable energy education. Renew. Sustain. Energy Rev. 2017, 69, 218–231. [Google Scholar] [CrossRef]


| Country | Region | Desalination Capacity, Q2020 | |||
|---|---|---|---|---|---|
| Seawater | Brackish Water | ||||
| Capacity, QSW, [m3/Day × 1000] | Municipal Water, YSW | Capacity, QBW, [m3/Day × 1000] | Municipal Water, YBW | ||
| Afghanistan | Central Asia | 0.00 | 0.00 | 2.5 | 0.85 |
| Burundi | East Africa | 0.00 | 0.00 | 0.00 | 0.00 |
| Eritrea | Northeast Africa | 1.00 | 0.00 | 0.15 | 0.00 |
| Ethiopia | Northeast Africa | 1.72 | 0.42 | 1.82 | 0.01 |
| Malawi | Southeast Africa | 0.00 | 0.00 | 0.00 | 0.00 |
| Niger | West Africa | 0.00 | 0.00 | 0.40 | 0.00 |
| Nigeria | West Africa | 13.28 | 0.45 | 115.61 | 0.01 |
| Pakistan | South Asia | 85.59 | 0.37 | 104.90 | 0.04 |
| Somalia | East Africa | 0.12 | 0.00 | 0.00 | 0.00 |
| Sudan | North Africa | 43.25 | 0.82 | 0.48 | 0.00 |
| Tanzania | East Africa | 0.60 | 1.00 | 6.08 | 0.00 |
| Uganda | East Africa | 0.00 | 0.00 | 0.00 | 0.00 |
| Zimbabwe | Southern Africa | 0.00 | 0.00 | 0.00 | 0.00 |
| Countries | N2020 [Millions] | Urban Population [Millions] | Water Withdrawal, m3/Capita/Day | |||
|---|---|---|---|---|---|---|
| Agriculture | Municipal | Industries | Total | |||
| Afghanistan | 38.93 | 1.32 | 9.13 | 0.08 | 0.08 | 9.30 |
| Burundi | 11.89 | 1.54 | 0.05 | 0.08 | 0.00 | 0.06 |
| Eritrea | 3.21 | 0.67 | 0.47 | 0.13 | 0.00 | 0.50 |
| Ethiopia | 114.96 | 18.39 | 0.23 | 0.12 | 0.00 | 0.25 |
| Malawi | 19.13 | 3.63 | 0.17 | 0.11 | 0.01 | 0.19 |
| Niger | 24.21 | 4.12 | 0.17 | 0.12 | 0.00 | 0.20 |
| Nigeria | 206.14 | 101.01 | 0.07 | 0.14 | 0.03 | 0.17 |
| Pakistan | 220.89 | 79.52 | 2.14 | 0.33 | 0.02 | 2.27 |
| Somalia | 15.89 | 5.88 | 0.57 | 0.01 | 0.00 | 0.57 |
| Sudan | 43.85 | 17.10 | 1.62 | 0.15 | 0.00 | 1.68 |
| Tanzania | 59.73 | 15.53 | 0.21 | 0.09 | 0.00 | 0.24 |
| Uganda | 45.74 | 5.95 | 0.02 | 0.15 | 0.00 | 0.04 |
| Zimbabwe | 14.86 | 5.65 | 0.56 | 0.31 | 0.02 | 0.70 |
| Average | 1.19 | 0.140 | 0.01 | 1.24 | ||
| Country | N2020 [Millions] | N2050 [Millions] | Urban Population | QSW | YSW | QBW | YBW | Q2020 [m3/cap/d] × 1000 | WWAVG [m3/cap/d] | ∆Q2050 [Mm3/d] |
|---|---|---|---|---|---|---|---|---|---|---|
| [% Share] | [m3/d × 1000] | [m3/d × 1000] | ||||||||
| Afghanistan | 38.93 | 69.5 | 22% | 0.00 | 0.00 | 2.50 | 0.85 | 0.25 | 0.140 | 2.13 |
| Burundi | 11.89 | 19.5 | 11% | 0.00 | 0.00 | 0.00 | 0.00 | 0.00 | 0.140 | 0.30 |
| Eritrea | 3.21 | 10.5 | 21% | 1.00 | 0.00 | 0.15 | 0.00 | 0.00 | 0.140 | 0.31 |
| Ethiopia | 114.96 | 171 | 16% | 1.72 | 0.42 | 1.82 | 0.01 | 0.04 | 0.140 | 3.82 |
| Malawi | 19.13 | 25.9 | 19% | 0.00 | 0.00 | 0.00 | 0.00 | 0.00 | 0.140 | 0.69 |
| Niger | 24.21 | 53 | 17% | 0.00 | 0.00 | 0.40 | 0.00 | 0.00 | 0.140 | 1.26 |
| Nigeria | 206.14 | 258.5 | 49% | 13.28 | 0.45 | 115.61 | 0.01 | 0.07 | 0.140 | 17.69 |
| Pakistan | 220.89 | 348.7 | 36% | 85.59 | 0.37 | 104.90 | 0.04 | 0.45 | 0.140 | 17.50 |
| Somalia | 15.89 | 39.7 | 37% | 0.12 | 0.00 | 0.00 | 0.00 | 0.00 | 0.140 | 2.05 |
| Sudan | 43.85 | 60.1 | 39% | 43.25 | 0.82 | 0.48 | 0.00 | 2.08 | 0.140 | 3.24 |
| Tanzania | 59.73 | 69.1 | 26% | 0.60 | 1.00 | 6.08 | 0.00 | 0.04 | 0.140 | 2.51 |
| Uganda | 45.74 | 103.2 | 13% | 0.00 | 0.00 | 0.00 | 0.00 | 0.00 | 0.140 | 1.87 |
| Zimbabwe | 14.86 | 23.5 | 38% | 0.00 | 0.00 | 0.00 | 0.00 | 0.00 | 0.140 | 1.25 |
| Total | 819.45 | 1252.20 | - | 145.56 | - | 231.93 | - | 2.92 | - | 57.1 |
| Average | 63.03 | 96.32 | - | 11.20 | - | 17.84 | - | 0.22 | - | 4.20 |
| Range | Energy Requirements (kWh/m3) | Water Production Costs ($/m3) | ||
|---|---|---|---|---|
| Conventional Water Supplies | Seawater Reverse Osmosis (SWRO) | Conventional Water Supplies | Seawater Reverse Osmosis (SWRO) | |
| Low | 0.1–0.5 | 2.5–2.8 | 0.25–0.75 | 0.5–0.8 |
| Medium | 1.0–2.5 | 3.0–3.5 | 0.75–2.50 | 1.0–1.5 |
| High | 2.5–4.5 | 4.0–4.5 | 2.50–5.00 | 2.0–4.0 |
Publisher’s Note: MDPI stays neutral with regard to jurisdictional claims in published maps and institutional affiliations. |
© 2022 by the authors. Licensee MDPI, Basel, Switzerland. This article is an open access article distributed under the terms and conditions of the Creative Commons Attribution (CC BY) license (https://creativecommons.org/licenses/by/4.0/).
Share and Cite
Dhakal, N.; Salinas-Rodriguez, S.G.; Hamdani, J.; Abushaban, A.; Sawalha, H.; Schippers, J.C.; Kennedy, M.D. Is Desalination a Solution to Freshwater Scarcity in Developing Countries? Membranes 2022, 12, 381. https://doi.org/10.3390/membranes12040381
Dhakal N, Salinas-Rodriguez SG, Hamdani J, Abushaban A, Sawalha H, Schippers JC, Kennedy MD. Is Desalination a Solution to Freshwater Scarcity in Developing Countries? Membranes. 2022; 12(4):381. https://doi.org/10.3390/membranes12040381
Chicago/Turabian StyleDhakal, Nirajan, Sergio G. Salinas-Rodriguez, Jamal Hamdani, Almotasembellah Abushaban, Hassan Sawalha, Jan C. Schippers, and Maria D. Kennedy. 2022. "Is Desalination a Solution to Freshwater Scarcity in Developing Countries?" Membranes 12, no. 4: 381. https://doi.org/10.3390/membranes12040381
APA StyleDhakal, N., Salinas-Rodriguez, S. G., Hamdani, J., Abushaban, A., Sawalha, H., Schippers, J. C., & Kennedy, M. D. (2022). Is Desalination a Solution to Freshwater Scarcity in Developing Countries? Membranes, 12(4), 381. https://doi.org/10.3390/membranes12040381