
Assessment of the Potential of Using Nanofiltration Polymeric and Ceramic Membranes to Treat Refinery Spent Caustic Effluents

 ,
, 
 ,
,  and
and
Abstract
1. Introduction
2. Materials and Methods
2.1. Reagents
2.2. Membranes
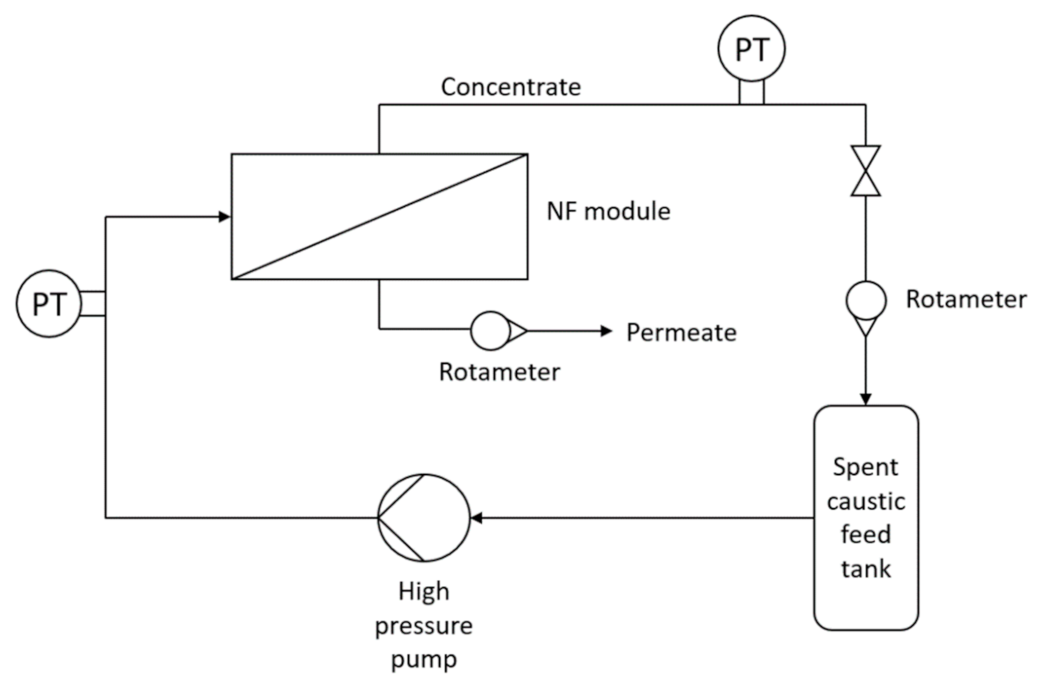
2.3. Experimental Setup
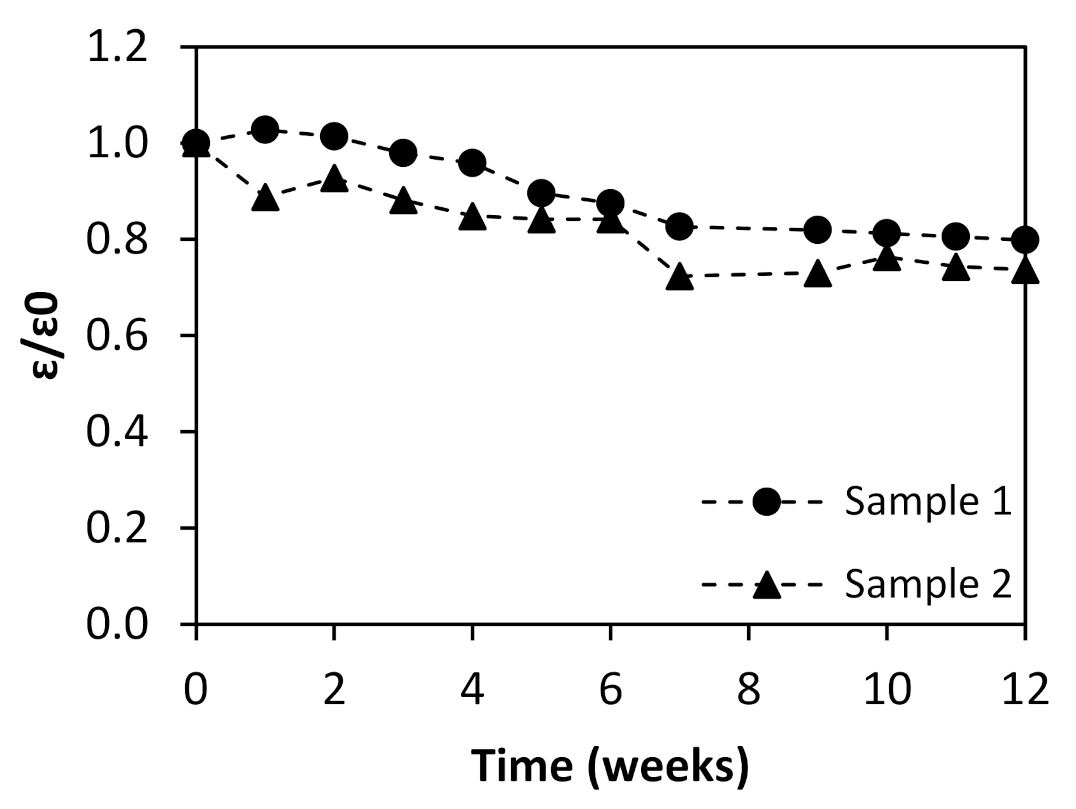
2.4. Aging Experiments
2.5. Nanofiltration Experiments
2.6. Characterization Methods
2.6.1. Effluent Characterization
2.6.2. Membrane Characterization
Dimensions and Contact Angle
Scanning Electron Microscopy with Energy Dispersive Spectroscopy (SEM-EDS) and Mapping
Fourier-Transform Infrared Spectroscopy (FT−IR)
Inductively Coupled Plasma Atomic Emission Spectroscopy (ICP-AES)
3. Results and Discussion
3.1. Effluents
3.2. Koch SeIRO Polymeric Membrane
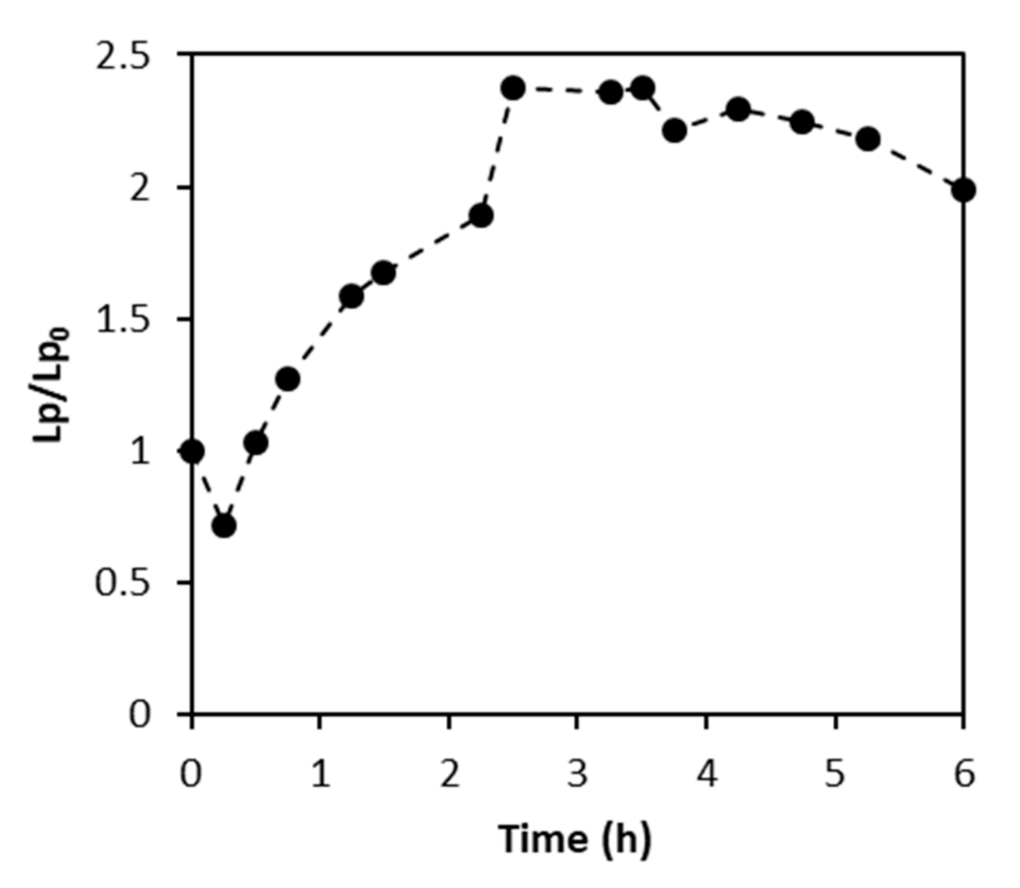
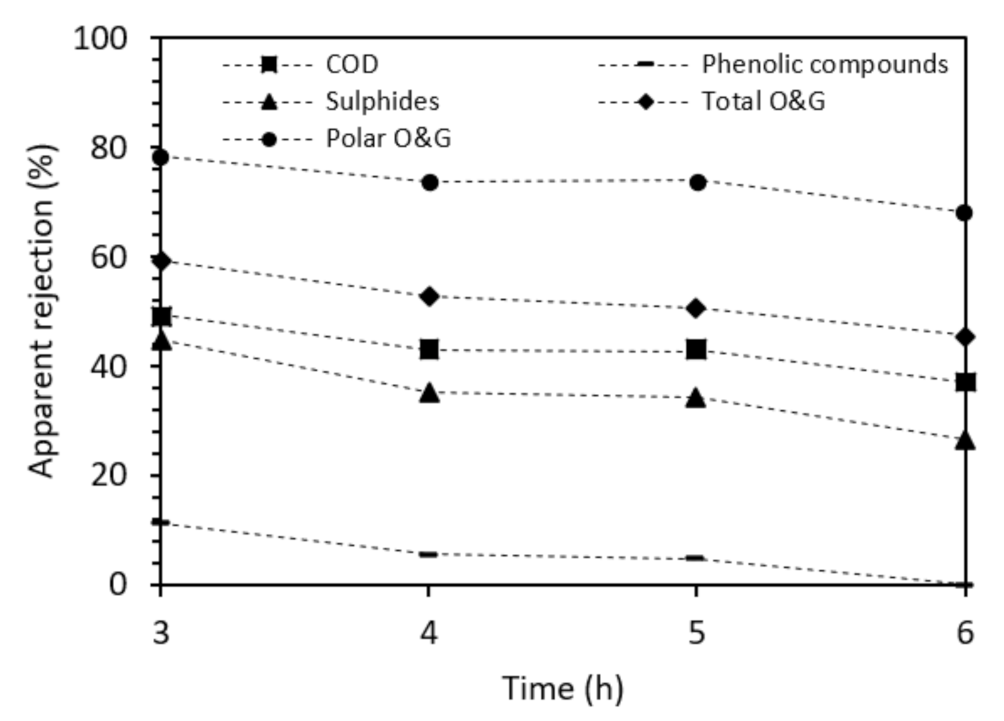
3.2.1. NF Tests to Evaluate Membrane Performance
3.2.2. Contact Angle and Thickness
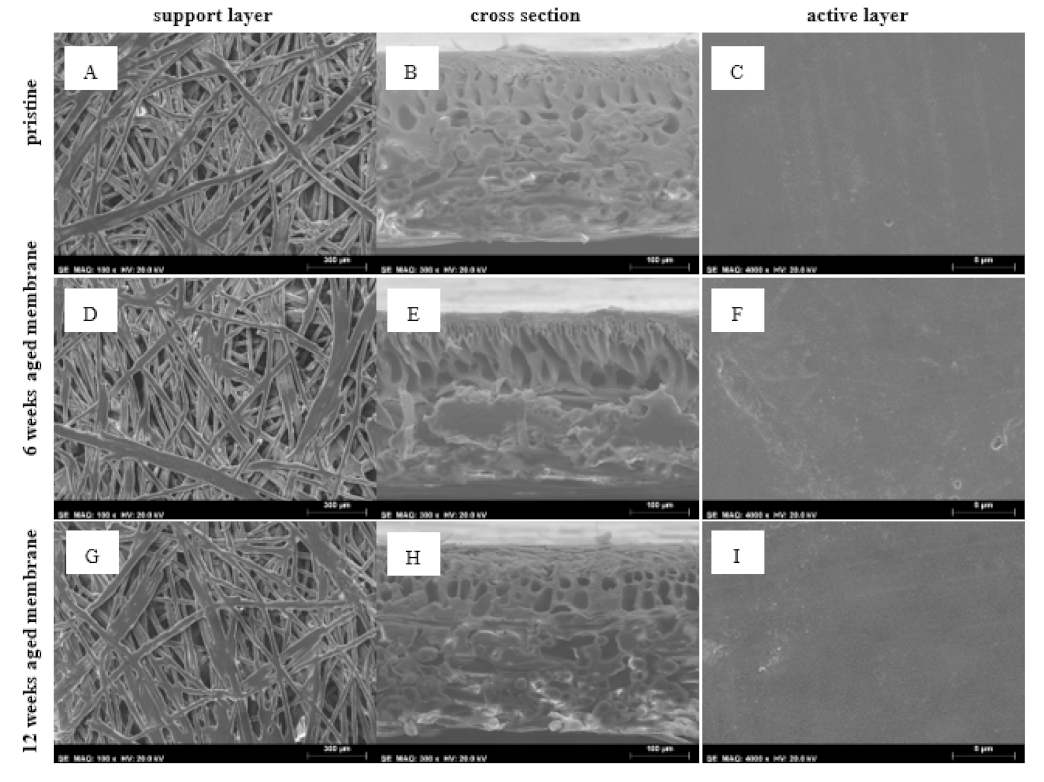
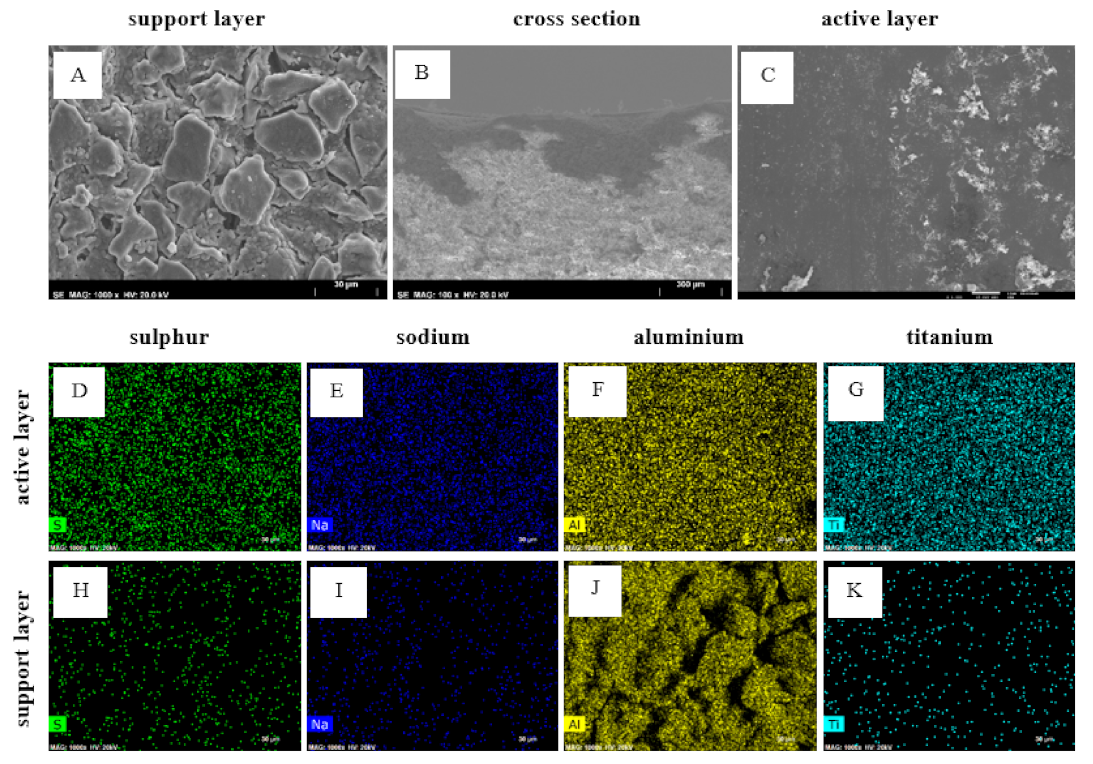
3.2.3. SEM-EDS
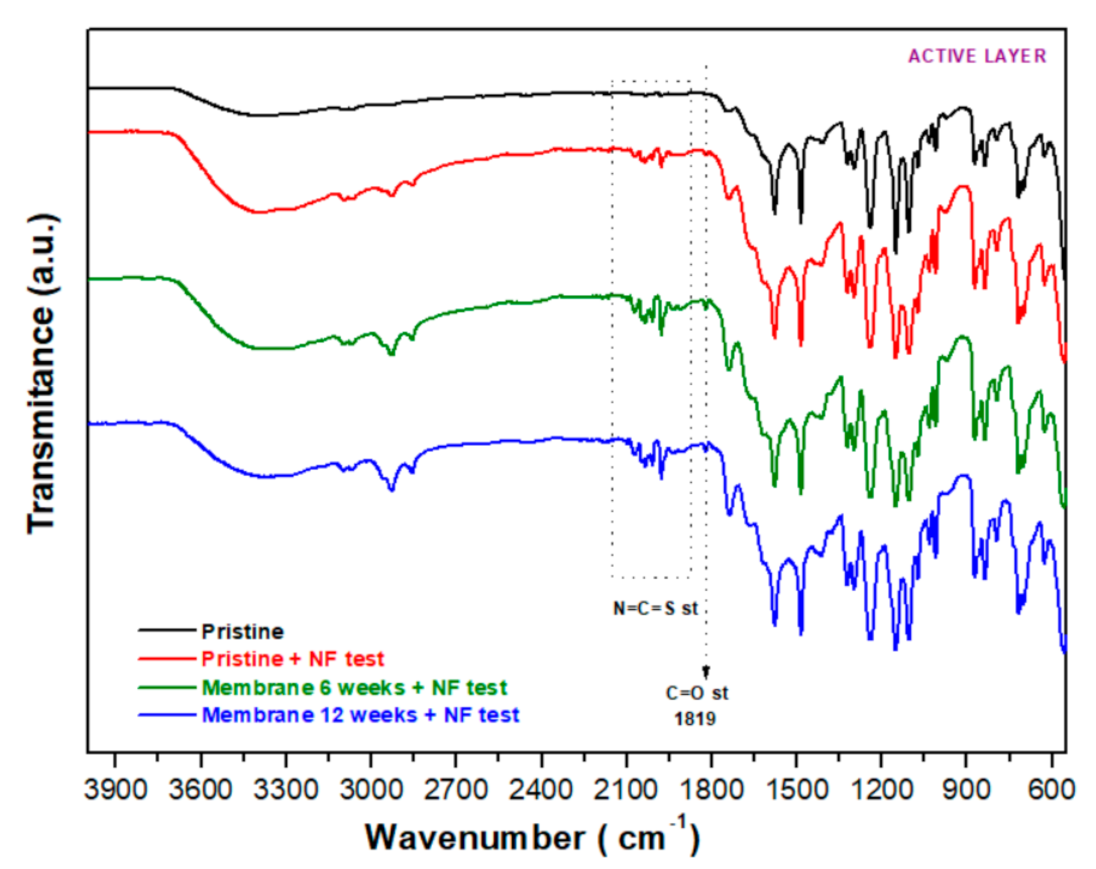
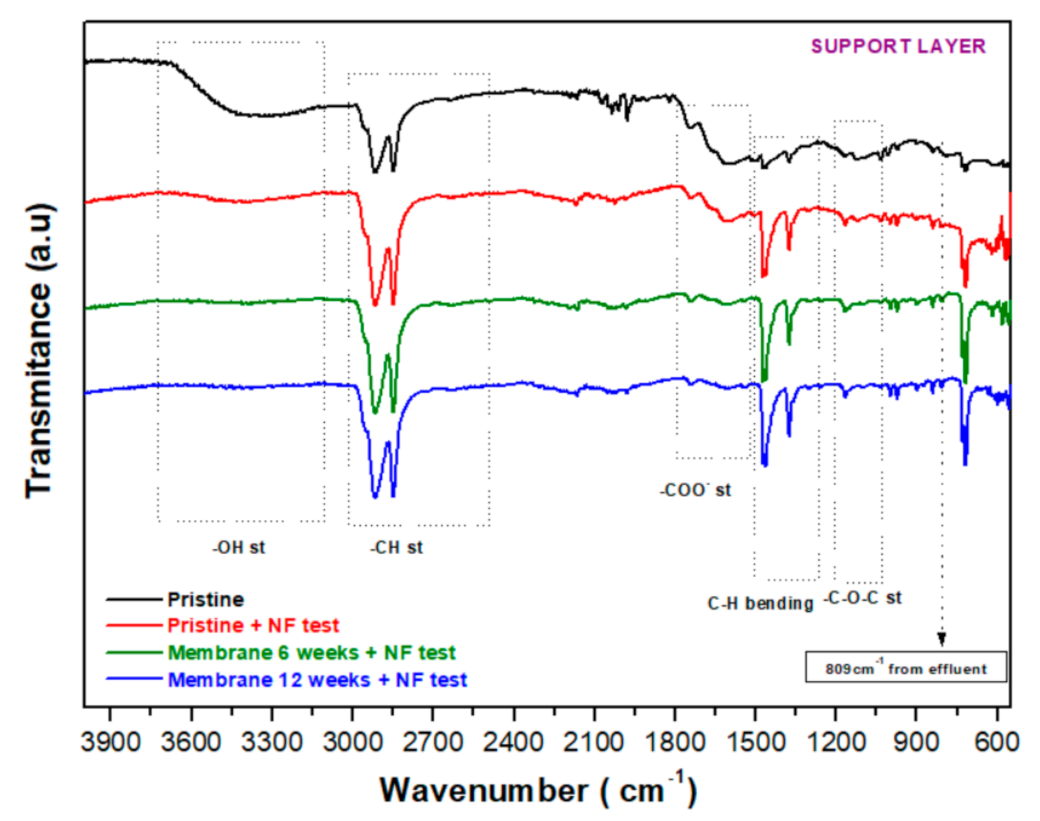
3.2.4. FT−IR
3.3. Inopor Ceramic Membrane
4. Conclusions
Supplementary Materials
Author Contributions
Funding
Institutional Review Board Statement
Informed Consent Statement
Acknowledgments
Conflicts of Interest
Nomenclature
| A | Filtration area (m2) |
| LP | Hydraulic permeability (Lh−1bar−1m−2) |
| LP0 | Hydraulic permeability for the pristine membrane (Lh−1bar−1m−2) |
| TMP | Transmembrane pressure (bar) |
| Δt | Duration of nanofiltration test (h) |
| V | Permeate volume (L) |
| Acronym list | |
| ATR | Attenuated total reflectance |
| COD | Chemical oxygen demand |
| DI | Distilled |
| EDS | Energy dispersive spectroscopy |
| FT−IR | Fourier-transform infrared spectroscopy |
| ICP-AES | Inductively coupled plasma atomic emission spectroscopy |
| MWCO | Molecular weight cut-off |
| NF | Nanofiltration |
| O&G | Oil and grease |
| PAHs | Polycyclic aromatic hydrocarbons |
| SEM | Scanning electron spectroscopy |
| SDD | Silicon drift detector |
| SMEWW | Standard method for examination of water and wastewater |
| PES | Polyethersulfone |
| PS | Polysulfone |
References
- Rita, A.; Rodrigues, C.; Santos, M.; Sanches, S.; Madeira, L. Comparison of different strategies to treat challenging refinery spent caustic effluents. Sep. Purif. Technol. 2020, 253, 117482. [Google Scholar] [CrossRef]
- Boczkaj, G.; Makoś, P.; Przyjazny, A. Application of dispersive liquid-liquid microextraction and gas chromatography with mass spectrometry for the determination of oxygenated volatile organic compounds in effluents from the production of petroleum bitumen. J. Sep. Sci. 2016, 39, 2604–2615. [Google Scholar] [CrossRef]
- Makoś, P.; Przyjazny, A.; Boczkaj, G. Methods of assaying volatile oxygenated organic compounds in effluent samples by gas chromatography—A review. J. Chromatogr. A 2019, 1592, 143–160. [Google Scholar] [CrossRef] [PubMed]
- Boczkaj, G.; Makoś, P.; Fernandes, A.; Przyjazny, A. New procedure for the control of the treatment of industrial effluents to remove volatile organosulfur compounds. J. Sep. Sci. 2016, 39, 3946–3956. [Google Scholar] [CrossRef]
- Boczkaj, G.; Makoś, P.; Fernandes, A.; Przyjazny, A. New procedure for the examination of the degradation of volatile organonitrogen compounds during the treatment of industrial effluents. J. Sep. Sci. 2017, 40, 1301–1309. [Google Scholar] [CrossRef]
- Makoś, P.; Fernandes, A.; Boczkaj, G. Method for the determination of carboxylic acids in industrial effluents using dispersive liquid-liquid microextraction with injection port derivatization gas chromatography–mass spectrometry. J. Chromatogr. A 2017, 1517, 26–34. [Google Scholar] [CrossRef] [PubMed]
- Makoś, P.; Fernandes, A.; Przyjazny, A.; Boczkaj, G. Sample preparation procedure using extraction and derivatization of carboxylic acids from aqueous samples by means of deep eutectic solvents for gas chromatographic-mass spectrometric analysis. J. Chromatogr. A 2018, 1555, 10–19. [Google Scholar] [CrossRef]
- Makoś, P.; Fernandes, A.; Boczkaj, G. Method for the simultaneous determination of monoaromatic and polycyclic aromatic hydrocarbons in industrial effluents using dispersive liquid-liquid microextraction with gas chromatography-mass spectrometry. J. Sep. Sci. 2018, 41, 2360–2367. [Google Scholar] [CrossRef] [PubMed]
- Alnaizy, R. Economic analysis for wet oxidation process for the treatment of mixed refinery spent caustic. Environ. Prog. 2008, 27, 295–3011. [Google Scholar] [CrossRef]
- Berne, F.; Cordonnier, J. Industrial Water Treatment—Refining, Petrochemical and Gas Processing Techniques; Gulf Publishing Company: Houston, TX, USA, 1995; Volume 37. [Google Scholar]
- Benavente, L.; Coetsier, C.; Venault, A.; Chang, Y.; Causserand, C.; Bacchin, P.; Aimar, P. FTIR mapping as a simple and powerful approach to study membrane coating and fouling. J. Membr. Sci. 2016, 520, 477–489. [Google Scholar] [CrossRef]
- Antón, E.; Álvarez, J.R.; Palacio, L.; Prádanos, P.; Hernandez, A.; Pihlajamäki, A.; Luque, S. Ageing of polyethersulfone ultrafiltration membranes under long-term exposures to alkaline and acidic cleaning solutions. Chem. Eng. Sci. 2015, 134, 178–195. [Google Scholar] [CrossRef]
- Antón, F.; Alvarez, J.; Luque, S. Cleaning and Ageing of Ultrafiltration Membranes. Procedia Eng. 2012, 44, 689. [Google Scholar] [CrossRef][Green Version]
- Cui, L.; Feng, Z.; Goodwin, C.; Gao, W.; Liao, B. Structure and properties of membrane at different ages in drinking water treatment. Desalination Water Treat. 2017, 74, 44–52. [Google Scholar] [CrossRef]
- Ettori, A.; Gaudichet-Maurin, E.; Schrotter, J.-C.; Aimar, P.; Causserand, C. Permeability and chemical analysis of aromatic polyamide based membranes exposed to sodium hypochlorite. J. Membr. Sci. 2011, 375, 220–230. [Google Scholar] [CrossRef]
- Ettori, A.; Gaudichet-Maurin, E.; Aimar, P.; Causserand, C. Pilot scale study of chlorination-induced transport property changes of a seawater reverse osmosis membrane. Desalination 2013, 311, 24–30. [Google Scholar] [CrossRef]
- Fraga, M.; Sanches, S.; Pereira, V.; Crespo, J.; Yuan, L.; Marcher, J.; de Yuso, M.M.; Rodríguez-Castellón, E.; Benavente, J. Morphological, chemical surface and filtration characterization of a new silicon carbide membrane. J. Eur. Ceram. Soc. 2016, 37, 899–905. [Google Scholar] [CrossRef]
- El Mansour, M.; Ettori, A.; Luque, S.; Alvarez, J.; Causserand, C.; Aimar, P. Accelerated Ageing of Crosslinked Polyamide Membranes. Procedia Eng. 2012, 44, 789. [Google Scholar] [CrossRef]
- Pellegrin, B.; Prulho, R.; Rivaton, A.; Thérias, S.; Gardette, J.; Gaudichet-Maurin, E.; Causserand, C. Hypochlorite Cleaning of Polyethersulfone/Polyvinylpyrrolidone Ultrafiltration Membranes: Impact on Performances. Procedia Eng. 2012, 44, 472–475. [Google Scholar] [CrossRef][Green Version]
- Pellegrin, B.; Prulho, R.; Rivaton, A.; Thérias, S.; Gardette, J.-L.; Gaudichet-Maurin, E.; Causserand, C. Multi-scale analysis of hypochlorite induced PES/PVP ultrafiltration membranes degradation. J. Membr. Sci. 2013, 447, 287–296. [Google Scholar] [CrossRef]
- Pellegrin, B.; Mezzari, F.; Hanafi, Y.; Szymczyk, A.; Remigy, J.-C.; Causserand, C. Filtration performance and pore size distribution of hypochlorite aged PES/PVP ultrafiltration membranes. J. Membr. Sci. 2015, 474, 175–186. [Google Scholar] [CrossRef]
- Causserand, C.; Pellegrin, B.; Rouch, J.-C. Effects of sodium hypochlorite exposure mode on PES/PVP ultrafiltration membrane degradation. Water Res. 2015, 85, 316–326. [Google Scholar] [CrossRef] [PubMed]
- Alipour, Z.; Azari, A. COD removal from industrial spent caustic wastewater: A review. J. Environ. Chem. Eng. 2020, 8, 103678. [Google Scholar] [CrossRef]
- Santos, B.; Crespo, J.G.; Santos, M.A.; Velizarov, S. Oil refinery hazardous effluents minimization by membrane filtration: An on-site pilot plant study. J. Environ. Manag. 2016, 181, 762–769. [Google Scholar] [CrossRef]
- Sanches, S.; Penetra, A.; Rodrigues, A.; Ferreira, E.; Cardoso, V.V.; Benoliel, M.J.; Crespo, M.T.B.; Pereira, V.J.; Crespo, J.G. Nanofiltration of hormones and pesticides in different real drinking water sources. Sep. Purif. Technol. 2012, 94, 44–53. [Google Scholar] [CrossRef]
- Sanches, S.; Penetra, A.; Granado, C.; Cardoso, V.V.; Ferreira, E.; Benoliel, M.J.; Crespo, M.T.B.; Pereira, V.J.; Crespo, J.G. Removal of pesticides and polycyclic aromatic hydrocarbons from different drinking water sources by nanofiltration. Desalination Water Treat. 2011, 27, 141–149. [Google Scholar] [CrossRef]
- Salahi, A.; Mohammadi, T.; Rekabdar, F.; Mahdavi, H. Reverse osmosis of refinery oily wastewater effluents. J. Environ. Heal. Sci. Eng. 2010, 7, 413–422. [Google Scholar]
- Abadi, S.R.H.; Sebzari, M.R.; Hemati, M.; Rekabdar, F.; Mohammadi, T. Ceramic membrane performance in microfiltration of oily wastewater. Desalination 2011, 265, 222–228. [Google Scholar] [CrossRef]
- Ishak, S.; Malakahmad, A.; Isa, M.H. Refinery wastewater biological treatment: A short review. J. Sci. Ind. Res. 2012, 71, 251–256. [Google Scholar]
- Shariati, S.R.P.; Bonakdarpour, B.; Zare, N.; Ashtiani, F.Z. The effect of hydraulic retention time on the performance and fouling characteristics of membrane sequencing batch reactors used for the treatment of synthetic petroleum refinery wastewater. Bioresour. Technol. 2011, 102, 7692–7699. [Google Scholar] [CrossRef] [PubMed]
- Zhong, J.; Sun, X.; Wang, C. Treatment of oily wastewater produced from refinery processes using flocculation and ceramic membrane filtration. Sep. Purif. Technol. 2003, 32, 93–98. [Google Scholar] [CrossRef]
- Zhu, Y.; Wang, D.; Jiang, L.; Jin, J. Recent progress in developing advanced membranes for emulsified oil/water separation. NPG Asia Mater. 2014, 6, e101. [Google Scholar] [CrossRef]
- Li, J. Chemical Stability of Ceramic Membrane. Delft University of Technology: Delft, The Netherlands, 2016; Unpublished manuscript. [Google Scholar]
- Chiu, T. Effect of ageing on the microfiltration performance of ceramic membranes. Sep. Purif. Technol. 2011, 83, 106–113. [Google Scholar] [CrossRef]
- Zhao, Y.-Y.; Wang, X.-M.; Yang, H.-W.; Xie, Y.-F.F. Effects of organic fouling and cleaning on the retention of pharmaceutically active compounds by ceramic nanofiltration membranes. J. Membr. Sci. 2018, 563, 734–742. [Google Scholar] [CrossRef]
- López, J.; Reig, M.; Vecino, X.; Gibert, O.; Cortina, J.L. Comparison of acid-resistant ceramic and polymeric nanofiltration membranes for acid mine waters treatment. Chem. Eng. J. 2019, 382, 122786. [Google Scholar] [CrossRef]
- Dalwani, M.; Bargeman, G.; Hosseiny, S.S.; Boerrigter, M.; Wessling, M.; Benes, N.E. Sulfonated poly(ether ether ketone) based composite membranes for nanofiltration of acidic and alkaline media. J. Membr. Sci. 2011, 381, 81–89. [Google Scholar] [CrossRef]
- Standard Methods for the Examination of Water and Wastewater. American Public Health Association: Washington, DC, USA, 2012. [CrossRef]
- Abramoff, M.D.; Magalhaes, P.J.; Ram, S.J. Image Processing with ImageJ. Biophotonics Int. 2004, 11, 36–42. [Google Scholar]
- Masselin, I.; Durand-Bourlier, L.; Laine, J.M.; Sizaret, P.Y.; Chasseray, X.; Lemordant, D. Membrane characterization using microscopic image analysis. J. Memb. Sci. 2001, 186, 85–96. [Google Scholar] [CrossRef]
- Santos, B.; Galinha, C.F.; Crespo, J.G.; Santos, M.A.; Velizarov, S. Prediction of polar oil and grease contamination levels in refinery wastewater through multivariate statistical modeling. Sep. Purif. Technol. 2013, 119, 51–57. [Google Scholar] [CrossRef]
- Rita, A.; Monteiro, A.; Albuquerque, R.; Santos, M.; Ribeiro, J.; Madeira, L.; Sanches, S. Unravelling the relation between processed crude oils and the composition of spent caustic effluents as well as the respective economic impact. J. Hazard. Mater. 2021, 421, 126629. [Google Scholar] [CrossRef] [PubMed]
- Sousa, M.R.S.; Lora-García, J.; López-Pérez, M.-F.; Heran, M. Identification of Foulants on Polyethersulfone Membranes Used to Remove Colloids and Dissolved Matter from Paper Mill Treated Effluent. Water 2020, 12, 365. [Google Scholar] [CrossRef]
- Walton, W.H. Feret’s Statistical Diameter as a Measure of Particle Size. Nature 1948, 162, 329–330. [Google Scholar] [CrossRef]
- Pretsch, E.; Clerc, T.; Seibl, J.; Simon, W. Tables of Spectral Data for Structure Determination of Organic Compounds, 2nd ed.; Springer-Verlag: Berlin/Heidelberg, Germany, 1989. [Google Scholar] [CrossRef]
- Kazemnejadi, M.; Shakeri, A.; Nikookar, M.; Shademani, R.; Mohammadi, M. Selective and metal-free epoxidation of terminal alkenes by heterogeneous polydioxirane in mild conditions. R. Soc. Open Sci. 2018, 5, 171541. [Google Scholar] [CrossRef]
- Wang, N.; Raza, A.; Si, Y.; Yu, J.; Sun, G.; Ding, B. Tortuously structured polyvinyl chloride/polyurethane fibrous membranes for high-efficiency fine particulate filtration. J. Colloid Interface Sci. 2013, 398, 240–246. [Google Scholar] [CrossRef]
- Cheng, F.; He, J.; Yan, T.; Liu, C.; Wei, X.; Li, J.; Huang, Y. Antibacterial and hemostatic composite gauze of N,O-carboxymethyl chitosan/oxidized regenerated cellulose. RSC Adv. 2016, 6, 94429–94436. [Google Scholar] [CrossRef]
- Khan, J.A.; Sayed, M.; Shah, N.S.; Khan, S.; Zhang, Y.; Boczkaj, G.; Khan, H.M.; Dionysiou, D.D. Synthesis of eosin modified TiO2 film with co-exposed {001} and {101} facets for photocatalytic degradation of para-aminobenzoic acid and solar H2 production. Appl. Catal. B Environ. 2019, 265, 118557. [Google Scholar] [CrossRef]
- Bhuvaneswari, G.H. Degradability of Polymers. In Recycle Polyurethane Foam; Sabu Thomas, M.G.T., Rane, A.V., Kanny, K., Abitha, V.K., Eds.; William Andrew Publishing: Norwich, NY, USA, 2018; pp. 29–44. [Google Scholar] [CrossRef]
- Radelyuk, I.; Tussupova, K.; Zhapargazinova, K.; Yelubay, M.; Persson, M. Pitfalls of Wastewater Treatment in Oil Refinery Enterprises in Kazakhstan—A System Approach. Sustainability 2019, 11, 1618. [Google Scholar] [CrossRef]
- Nyquist, R.A. (Ed.) Azines, Isocyanates, Isothiocyanates, and Carbodiimides. In Interpreting Infrared, Raman, and Nuclear Magnetic Resonance Spectra; Academic Press: London, UK, 2001; pp. 45–63. [Google Scholar] [CrossRef]
- Li, C.; Sun, W.; Lu, Z.; Ao, X.; Li, S. Ceramic nanocomposite membranes and membrane fouling: A review. Water Res. 2020, 175, 115674. [Google Scholar] [CrossRef] [PubMed]
- Fujioka, T.; Khan, S.J.; McDonald, J.A.; Nghiem, L.D. Nanofiltration of trace organic chemicals: A comparison between ceramic and polymeric membranes. Sep. Purif. Technol. 2014, 136, 258–264. [Google Scholar] [CrossRef]


| Effluent No. | 1 | 2 |
|---|---|---|
| Date of collection | 11 January 2019 | 10 August 2019 |
| COD (mg O2/L) | 102,190 | 88,360 |
| Phenolic compounds (mg/L) | 1908 | 2742 |
| Sulfides (mg/L) | 34.9 | 31.6 |
| Total O&G (mg/L) | 18,970 | 17,837 |
| Polar O&G (mg/L) | 15,053 | 10,090 |
| Nonpolar O&G (mg/L) | 3917 | 7747 |
| Conductivity (mS/cm) | 60.7 | 61.2 |
| pH (Soresen scale) | 13.9 | 13.9 |
| Membrane | Active Layer | Support Layer | |||
|---|---|---|---|---|---|
| C (%) | S (%) | O (%) | C (%) | S (%) | |
| Pristine membrane | 61.6 | 19.9 | 18.5 | 99.0 | 1.0 |
| Aged for 6 weeks | 64.7 | 19.0 | 16.3 | 99.0 | 1.0 |
| Aged for 12 weeks | 67.7 | 16.6 | 15.7 | 99.3 | 0.7 |
| Pristine | Membrane 6 | Membrane 12 | |
|---|---|---|---|
| Porosity (%) | 12.10 | 19.91 | 27.93 |
| Number of pores | 2196 | 2962 | 4039 |
| Pore density (µm−2) | 0.032 | 0.041 | 0.063 |
| Minimum pore area (µm2) | 0.074 | 0.074 | 0.075 |
| Maximum pore area (µm2) | 442.45 | 3821.37 | 714.92 |
| Total pore area (µm2) | 8345.47 | 14,257.44 | 18,022.10 |
| Average circularity | 0.828 ± 0.252 | 0.878 ± 0.221 | 0.837 ± 0.252 |
| Minimum circularity | 0.078 | 0.038 | 0.007 |
| Maximum circularity | 1.000 | 1.000 | 1.000 |
| Average Feret diameter (µm) | 1.662 ± 3.745 | 1.441 ± 4.974 | 1.503 ± 3.570 |
| Minimum Feret’s diameter (µm) | 0.384 | 0.384 | 0.386 |
| Maximum Feret’s diameter (µm) | 39.761 | 141.438 | 66.347 |
| Sample Name | [Al], mg/L | [Ti], mg/L |
|---|---|---|
| Feed (spent caustic) | 2.06 | 0.02 |
| Retentate—Total * | 2.07 | 0.05 |
| Permeate—Total * | 1.38 | 0.43 |
| Permeate at 3 h of NF test | 1.45 | 0.50 |
| Permeate at 4 h of NF test | 1.37 | 0.29 |
| Permeate at 5 h of NF test | 1.62 | 0.27 |
| Permeate at 6 h of NF test | 1.81 | 0.28 |
| Membrane | O (%) | C (%) | Al (%) | Ti (%) | Zr (%) | Na (%) | S (%) | Fe (%) | Si (%) |
|---|---|---|---|---|---|---|---|---|---|
| 200 Da | 22.1 | 10.2 | 18.0 | 23.8 | 10.8 | 9.9 | 3.2 | 1.6 | 0.4 |
Publisher’s Note: MDPI stays neutral with regard to jurisdictional claims in published maps and institutional affiliations. |
© 2022 by the authors. Licensee MDPI, Basel, Switzerland. This article is an open access article distributed under the terms and conditions of the Creative Commons Attribution (CC BY) license (https://creativecommons.org/licenses/by/4.0/).
Share and Cite
Rita, A.I.; Nabais, A.R.; Neves, L.A.; Huertas, R.; Santos, M.; Madeira, L.M.; Sanches, S. Assessment of the Potential of Using Nanofiltration Polymeric and Ceramic Membranes to Treat Refinery Spent Caustic Effluents. Membranes 2022, 12, 98. https://doi.org/10.3390/membranes12010098
Rita AI, Nabais AR, Neves LA, Huertas R, Santos M, Madeira LM, Sanches S. Assessment of the Potential of Using Nanofiltration Polymeric and Ceramic Membranes to Treat Refinery Spent Caustic Effluents. Membranes. 2022; 12(1):98. https://doi.org/10.3390/membranes12010098
Chicago/Turabian StyleRita, Ana Isabel, Ana Rita Nabais, Luisa A. Neves, Rosa Huertas, Maria Santos, Luis M. Madeira, and Sandra Sanches. 2022. "Assessment of the Potential of Using Nanofiltration Polymeric and Ceramic Membranes to Treat Refinery Spent Caustic Effluents" Membranes 12, no. 1: 98. https://doi.org/10.3390/membranes12010098
APA StyleRita, A. I., Nabais, A. R., Neves, L. A., Huertas, R., Santos, M., Madeira, L. M., & Sanches, S. (2022). Assessment of the Potential of Using Nanofiltration Polymeric and Ceramic Membranes to Treat Refinery Spent Caustic Effluents. Membranes, 12(1), 98. https://doi.org/10.3390/membranes12010098