
Numerical Simulation and Optimization of 4-Component LDG Separation in the Steelmaking Industry Using Polysulfone Hollow Fiber Membranes

Abstract
:1. Introduction
2. Materials and Methods
2.1. Mathematical Model
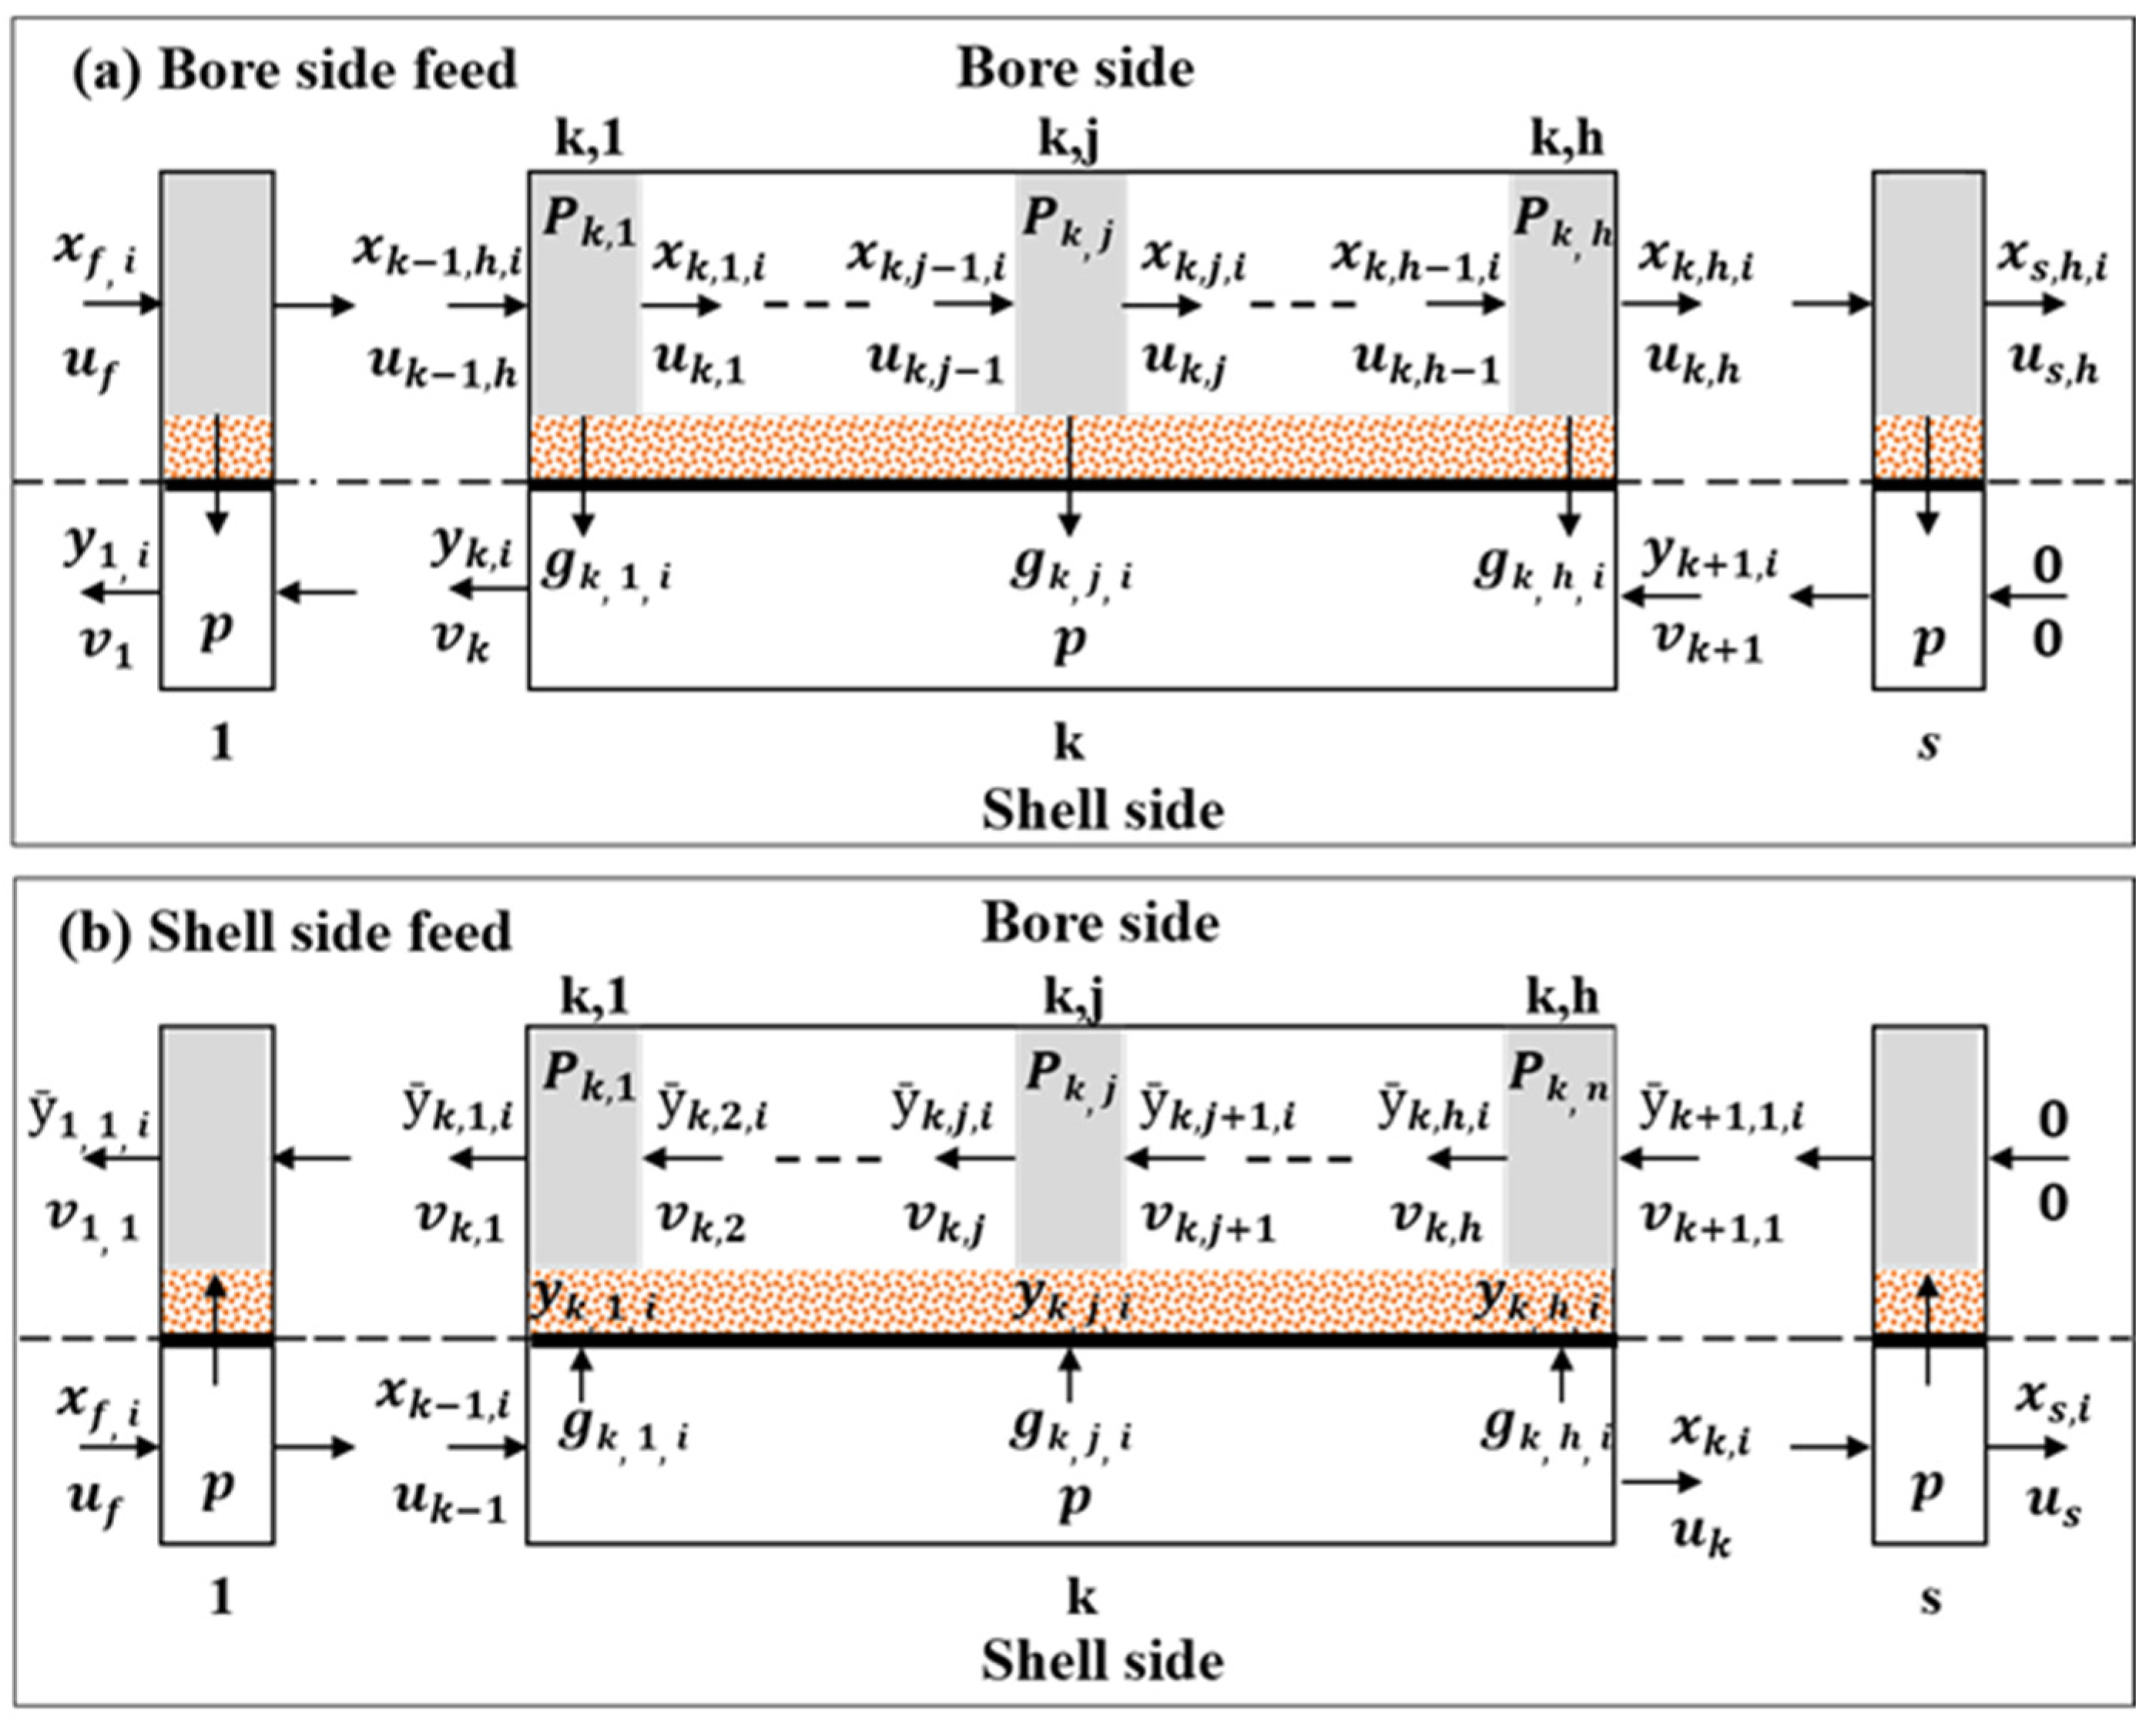
2.1.1. Bore Side Feed
- (1)
- The permeation rate of the i-component in the k,j-th element of the bore side is
- (2)
- Component and total mass balances
- The k,j-th element on the bore side is expressed as
- Meanwhile, the k,j-th element in the permeate side is given by
2.1.2. Shell Side Feed
- (1)
- The permeation rates in the k-th element:
- (2)
- The component and total mass balances in the k-th and k,j-th elements:
- (3)
- The concentration yk,j,i at the k,j-th element:
- (4)
- The pressure drop between the (k,j − 1)-th and k,j-th elements:
2.2. Solution of the Model Equation
2.3. Experimental
3. Results and Discussion
4. Conclusions
Author Contributions
Funding
Institutional Review Board Statement
Data Availability Statement
Conflicts of Interest
Nomenclature
| A | membrane area (m2) |
| C | number of gas components |
| Do | Outside diameter of membrane (m) |
| g | permeation rate (m3/s) |
| h | Number of bore side finite element per finite element of shell side |
| L | Length of membrane (m) |
| n | ratio of number of finite elements of bore side to shell side |
| Q | permeance (m3/m2.s.pa) |
| s | Number of shell side finite element |
| u | flow rate of reside side (m3/s) |
| v | flow rate of permeate side (m3/s) |
| x | concentration in residue side (volume %) |
| y | concentration at in permeate side (volume %) |
| ȳ | concentration in bulk stream of permeate side (volume %) |
| μ | viscosity (m2.pa/s) |
| Subscript | |
| f | feed |
| i | i component |
| j | j-th finite element in bore side |
| k | k-th finite element in shell side |
| m | mixed gas |
Appendix A

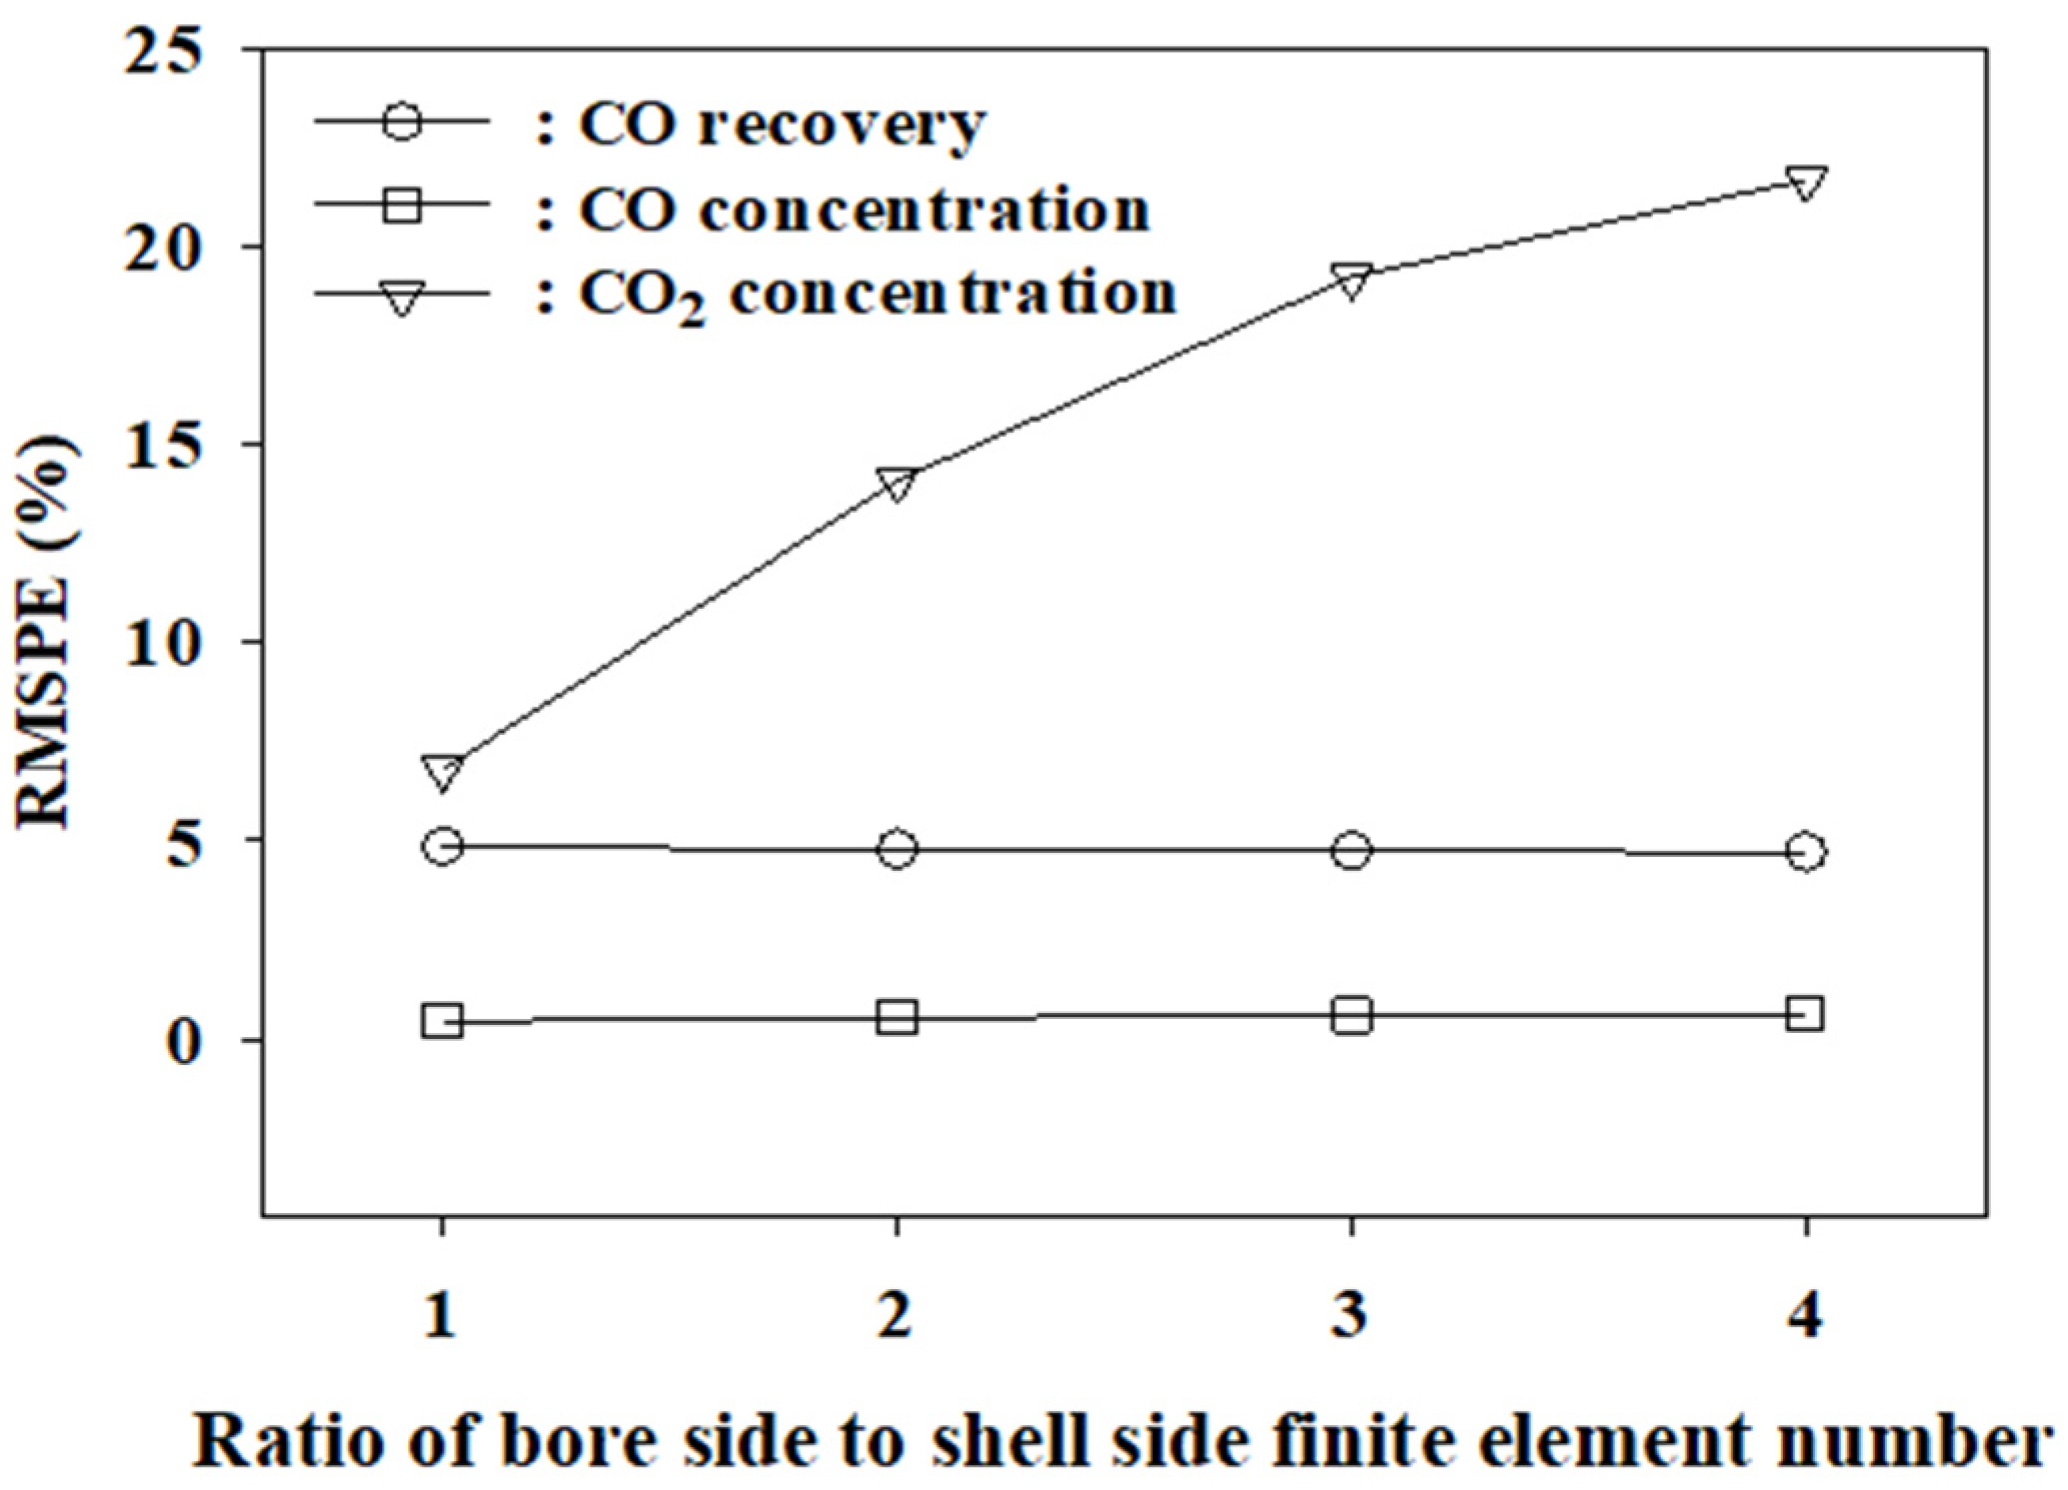
| s | n | CO Recovery (%) | CO Conc. (%) | CO2 Conc. (%) |
|---|---|---|---|---|
| 2 | 1 | 3.09 | 2.24 | 171.42 |
| 5 | 1 | 3.06 | 0.70 | 58.41 |
| 10 | 1 | 3.06 | 0.13 | 16.03 |
| 15 | 1 | 3.05 | 0.17 | 2.26 |
| 20 | 1 | 3.05 | 0.27 | 5.43 |
| 30 | 1 | 3.05 | 0.37 | 12.20 |
| 60 | 1 | 3.05 | 0.48 | 18.89 |
| s | Equation Number | CPU Time (sec.) | ΣF2 | Error (Root Mean Square) |
|---|---|---|---|---|
| 1 | 11 | 0.016 | 3.92 × 10⁻³⁴ | 5.97 × 10⁻¹⁸ |
| 2 | 22 | 0.016 | 1.51 × 10⁻³² | 2.62 × 10⁻¹⁷ |
| 15 | 110 | 0.02 | 7.77 × 10⁻³⁵ | 8.40 × 10⁻¹⁹ |
| 50 | 550 | 0.17 | 1.57 × 10−38 | 5.34 × 10⁻²¹ |
| 100 | 1100 | 1.62 | 1.59 × 10⁻³⁵ | 1.20 × 10⁻¹⁹ |
| 200 | 2200 | 19.48 | 3.84 × 10⁻³⁵ | 1.32 × 10⁻¹⁹ |
References
- Global Energy Statistics 2019, CO2 Emission from Fuel Combustion. Available online: https://yearbook.enerdata.co.kr/co2-fuel-combustion/CO2-emissions-data-from-fuel-combustion (accessed on 3 September 2019).
- IPCC, Special Report for Global Warming of 1.5 °C. 2018. Available online: https://www.ipcc.ch/sr15/ (accessed on 28 August 2019).
- Monsalve-Bravo, G.M.; Smart, S.; Bhatia, S.K. Simulation of Multicomponent Gas Transport Through Mixed-Matrix Membranes. J. Membr. Sci. 2019, 577, 219–234. [Google Scholar] [CrossRef] [Green Version]
- Tao, J.; Wang, J.; Zhu, L.; Chen, X. Integrated Design of Multi-Stage Membrane Separation for Landfill Gas with Uncertain Feed. J. Membr. Sci. 2019, 590, 117260. [Google Scholar] [CrossRef]
- Haddadi, B.; Jordan, C.; Miltner, M.; Harasek, M. Membrane Modeling Using CFD: Combined Evaluation of Mass Transfer and Geometrical Influences in 1D and 3D. J. Membr. Sci. 2018, 563, 199–209. [Google Scholar] [CrossRef]
- Zarca, G.; Urtiaga, A.; Biegler, L.T.; Ortiz, I. An Optimization Model for Assessment of Membrane-Based Post-Combustion Gas Upcycling Into Hydrogen or Syngas. J. Membr. Sci. 2018, 563, 83–92. [Google Scholar] [CrossRef]
- Qadir, S.; Hussain, A.; Ahsan, M. Numerical Analysis of a Gas Separation of CH4/CO2 Using Hollow Fiber Membrane Module. Sigma J. Eng. Nat. Sci. 2018, 36, 501. [Google Scholar]
- McNeil, M.V.; Wilfart, F.M.; Haelssig, J.B. Modelling Hollow Fiber Membrane Modules for Anesthesia Gas Separation. Chem. Eng. Sci. 2018, 191, 479–489. [Google Scholar] [CrossRef]
- Daeho, K.O. Development of a Dynamic Simulation Model of a Hollow Fiber Membrane Module to Sequester CO2 from Coalbed Methane. J. Membr. Sci. 2018, 546, 258–269. [Google Scholar] [CrossRef]
- Lee, S.H.; Binns, M.; Lee, J.H.; Moon, J.-H.; Yeo, J.-G.; Yeo, Y.-K.; Lee, Y.; Kim, J.-K. Membrane Separation Process for CO2 Capture From Mixed Gases Using TR and XTR Hollow Fiber Membranes: Process Modeling and Experiments. J. Membr. Sci. 2017, 541, 224–234. [Google Scholar] [CrossRef]
- Sharifian, S.; Harasek, M.; Haddadi, B. Simulation of Membrane Gas Separation Process Using Aspen Plus® V8. 6. Chem. Prod. Process Model. 2016, 11, 67–72. [Google Scholar] [CrossRef]
- Binns, M.; Lee, S.; Yeo, Y.; Lee, J.H.; Moon, J.; Yeo, J.; Kim, J. Strategies for the Simulation of Multi-Component Hollow Fibre Multi-Stage Membrane Gas Separation Systems. J. Membr. Sci. 2016, 497, 458–471. [Google Scholar] [CrossRef]
- Shoghl, S.N.; Raisi, A.; Aroujalian, A. A Predictive Mass Transport Model for Gas Separation Using Glassy Polymer Membranes. RSC Adv. 2015, 5, 38223–38234. [Google Scholar] [CrossRef]
- Szwast, M.; Szwast, Z. A Mathematical Model of Membrane Gas Separation With Energy Transfer by Molecules of Gas Flowing in a Channel to Molecules Penetrating This Channel From the Adjacent Channel. Chem. Process Eng. 2015, 36, 151–169. [Google Scholar] [CrossRef] [Green Version]
- Ahsan, M.; Hussain, A. A Comparison of Numerical Methods Used to Solve Cross Flow Model for Multicomponent Membrane Gas Separation. World Appl. Sci. J. 2013, 22, 703. [Google Scholar]
- Shamsabadi, A.A.; Kargari, A.; Farshadpour, F.; Laki, S. Mathematical Modeling of CO2/CH4 Separation by Hollow Fiber Membrane Module Using Finite Difference Method. J. Membr. Sep. Technol. 2012, 1, 19. [Google Scholar]
- Soni, V.; Abildskov, J.; Jonsson, G.; Gani, R. A General Model for Membrane-Based Separation Processes. Comput. Chem. Eng. 2009, 33, 644–659. [Google Scholar] [CrossRef]
- Murad Chowdhury, M.H.; Feng, X.; Douglas, P.; Croiset, E. A New Numerical Approach for a Detailed Multicomponent Gas Separation Membrane Model and AspenPlus Simulation. Chem. Eng. Technol. 2005, 28, 773–782. [Google Scholar] [CrossRef]
- Wang, R.; Liu, S.L.; Lin, T.T.; Chung, T.S. Characterization of Hollow Fiber Membranes in a Permeator Using Binary Gas Mixtures. Chem. Eng. Sci. 2002, 57, 967–976. [Google Scholar] [CrossRef]
- Lim, S.P.; Tan, X.; Li, K. Gas/Vapour Separation Using Membranes. Chem. Eng. Sci. 2000, 55, 2641–2652. [Google Scholar] [CrossRef]
- Tessendorf, S.; Gani, R.P.; Michelsen, M.L. Modeling, Simulation and Optimization of Membrane-Based Gas Separation Systems. Chem. Eng. Sci. 1999, 54, 943–955. [Google Scholar] [CrossRef]
- Feng, X.; Ivory, J.; Rajan, V.S.V. Air Separation by Integrally Asymmetric Hollow-Fiber Membranes. AIChE J. 1999, 45, 2142–2152. [Google Scholar] [CrossRef]
- Li, K.; Teo, W.K. Use of Permeation and Absorption Methods for CO2 Removal in Hollow Fibre Membrane Modules. Sep. Purif. Technol. 1998, 13, 79–88. [Google Scholar] [CrossRef]
- Thundyil, M.J.; Koros, W.J. Mathematical Modeling of Gas Separation Permeators-For Radial Crossflow, Countercurrent, and Concurrent Hollow Fiber Membrane Modules. J. Membr. Sci. 1997, 125, 275–291. [Google Scholar] [CrossRef]
- Li, K.; Chen, Y.; Teo, W.K. Removal of CO2 From a Breathing Gas Mixture Using a Hollow-Fibre Permeator With Permeate Purge and Absorption. Gas Sep. Purif. 1995, 9, 93–100. [Google Scholar] [CrossRef]
- Giglia, S.; Bikson, B.; Perrin, J.E.; Donatelli, A.A. Mathematical and Experimental Analysis of Gas Separation by Hollow Fiber Membranes. Ind. Eng. Chem. Res. 1991, 30, 1239–1248. [Google Scholar] [CrossRef]
- Sidhoum, M.; SenGupta, A.; Sirkar, K.K. Asymmetric Cellulose Acetate Hollow Fibers: Studies in Gas Permeation. AIChE J. 1988, 34, 417–425. [Google Scholar] [CrossRef]
- Krovvidi, K.R.; Kovvali, A.S.; Vemury, S.; Khan, A.A. Approximate Solutions for Gas Permeators Separating Binary Mixtures. J. Membr. Sci. 1992, 66, 103–118. [Google Scholar] [CrossRef]
- Pan, C.Y. Gas Separation by High-Flux, Asymmetric Hollow-Fiber Membrane. AIChE J. 1986, 32, 2020. [Google Scholar] [CrossRef]
- Pan, C.Y. Gas Separation by Permeators with High-Flux Asymmetric Membranes. AIChE J. 1983, 29, 545–552. [Google Scholar] [CrossRef]
- Li, K.; Acharya, D.R.; Hughes, R. Mathematical Modelling of Multicomponent Membrane Permeators. J. Membr. Sci. 1990, 52, 205–219. [Google Scholar] [CrossRef]
- Mccandless, F.P. Iterative Solution of Multicomponent Permeator Model Equations. J. Membr. Sci. 1990, 48, 115–122. [Google Scholar] [CrossRef]
- Boucif, N.; Sengupta, A.; Sirkar, K.K. Hollow Fiber Gas Permeator With Countercurrent or Cocurrent Flow: Series Solutions. Ind. Eng. Chem. Fund. 1986, 25, 217–228. [Google Scholar] [CrossRef]
- Boucif, N.; Majumdar, S.; Sirkar, K.K. Series Solutions for a Gas Permeator With Countercurrent and Cocurrent Flow. Ind. Eng. Chem. Fund. 1984, 23, 470–480. [Google Scholar] [CrossRef]
- Marriott, J.I.; Sørensen, E.; Bogle, I.D.L. Detailed Mathematical Modelling of Membrane Modules. Comput. Chem. Eng. 2001, 25, 693–700. [Google Scholar] [CrossRef]
- Kaldis, S.P.; Kapantaidakis, G.C.; Sakellaropoulos, G.P. Simulation of Multicomponent Gas Separation in a Hollow Fiber Membrane by Orthogonal Collocation—Hydrogen Recovery From Refinery Gases. J. Membr. Sci. 2000, 173, 61–71. [Google Scholar] [CrossRef]
- Marriott, J.; Sørensen, E. A General Approach to Modelling Membrane Modules. Chem. Eng. Sci. 2003, 58, 4975–4990. [Google Scholar] [CrossRef]
- Visser, T.; Masetto, N.; Wessling, M. Materials Dependence of Mixed Gas Plasticization Behavior in Asymmetric Membranes. J. Membr. Sci. 2007, 306, 16–28. [Google Scholar] [CrossRef]
- Ettouney, H.M.; Majeed, O. Transport and Permeation Properties of a Ternary Gas Mixture in a Medium-Size Polysulfone Hollow Fiber Permeator. Sep. Sci. Technol. 1996, 31, 1573–1596. [Google Scholar] [CrossRef]
- Chernova, E.; Petukhov, D.; Boytsova, O.; Alentiev, A.; Budd, P.; Yampolskii, Y.; Eliseev, A. Enhanced Gas Separation Factors of Microporous Polymer Constrained in the Channels of Anodic Alumina Membranes. Sci. Rep. 2016, 6, 31183. [Google Scholar] [CrossRef] [PubMed] [Green Version]
- Kelman, S.; Lin, H.; Sanders, E.S.; Freeman, B.D. CO2/C2H6 Separation Using Solubility Selective Membranes. J. Membr. Sci. 2007, 305, 57–68. [Google Scholar] [CrossRef]
- Merkel, T.; Gupta, R.P.; Turk, B.S.; Freeman, B.D. Mixed-Gas Permeation of Syngas Components in Poly(Dimethylsiloxane) and Poly(1-Trimethylsilyl-1-Propyne) at Elevated Temperatures. J. Membr. Sci. 2001, 191, 85–94. [Google Scholar] [CrossRef]
- Lin, H.; Zhou, M.; Ly, J.; Vu, J.; Wijmans, J.G.; Merkel, T.C.; Jin, J.; Haldeman, A.; Wagener, E.H.; Rue, D. Membrane-Based Oxygen-Enriched Combustion. Ind. Eng. Chem. Res. 2013, 52, 10820–10834. [Google Scholar] [CrossRef]
- Lin, H.; He, Z.; Sun, Z.; Kniep, J.; Ng, A.; Baker, R.W.; Merkel, T.C. CO2-Selective Membranes for Hydrogen Production and CO2 Capture–Part II: Techno-Economic Analysis. J. Membr. Sci. 2015, 493, 794–806. [Google Scholar] [CrossRef] [Green Version]
- Chenar, M.P.; Soltanieh, M.; Matsuura, T.; Tabe-Mohammadi, A.; Feng, C. Gas Permeation Properties of Commercial Polyphenylene Oxide and Cardo-Type Polyimide Hollow Fiber Membranes. Sep. Purif. Technol. 2006, 51, 359–366. [Google Scholar] [CrossRef]
- Katoh, T.; Tokumura, M.; Yoshikawa, H.; Kawase, Y. Dynamic Simulation of Multicomponent Gas Separation by Hollow-Fiber Membrane Module: Nonideal Mixing Flows in Permeate and Residue Sides Using the Tanks-in-Series Model. Sep. Purif. Technol. 2011, 76, 362–372. [Google Scholar] [CrossRef]
- Wilke, C.R. A Viscosity Equation for Gas Mixtures. J. Chem. Phys. 1950, 18, 517–519. [Google Scholar] [CrossRef]
- Coker, D.T.; Allen, T.; Freeman, B.D.; Fleming, G.K. Nonisothermal Model for Gas Separation Hollow-Fiber Membranes. AIChE J. 1999, 45, 1451–1468. [Google Scholar] [CrossRef]
- Coker, D.T.; Freeman, B.D.; Fleming, G.K. Modeling Multicomponent Gas Separation Using Hollow-Fiber Membrane Contactors. AIChE J. 1998, 44, 1289–1302. [Google Scholar] [CrossRef]
- Ahmad, A.L.; Adewole, J.K.; Leo, C.P.; Ismail, S.; Sultan, A.S.; Olatunji, S.O. Prediction of Plasticization Pressure of Polymeric Membranes for CO2 Removal From Natural Gas. J. Membr. Sci. 2015, 480, 39–46. [Google Scholar] [CrossRef]
- Ismail, A.F.; Lorna, W. Penetrant-Induced Plasticization Phenomenon in Glassy Polymers for Gas Separation Membrane. Sep. Purif. Technol. 2002, 27, 173–194. [Google Scholar] [CrossRef]
- Bos, A.; Pünt, I.G.M.; Wessling, M.; Strathmann, H. CO2-Induced Plasticization Phenomena in Glassy Polymers. J. Membr. Sci. 1999, 155, 67–78. [Google Scholar] [CrossRef]
- Wessling, M.; Schoeman, S.; van der Boomgaard, T.H.; Smolders, C.A. Plasticization of Gas Separation Membranes. Gas Sep. Purif. 1991, 5, 222–228. [Google Scholar] [CrossRef] [Green Version]
- Sanders, E.S. Penetrant-Induced Plasticization and Gas Permeation in Glassy Polymers. J. Membr. Sci. 1988, 37, 63–80. [Google Scholar] [CrossRef]
- Chiou, J.S.; Barlow, J.W.; Paul, D.R. Plasticization of Glassy Polymers by CO2. J. Appl. Polym. Sci. 1985, 30, 2633–2642. [Google Scholar] [CrossRef]
- Sada, E.; Kumazawa, H.; Wang, J.-S.; Koizumi, M. Separation of Carbon Dioxide by Asymmetric Hollow Fiber Membrane of Cellulose Triacetate. J. Appl. Polym. Sci. 1992, 45, 2181–2186. [Google Scholar] [CrossRef]
- Ahmad, F.; Lau, K.K.; Shariff, A.M.; Fong Yeong, Y. Temperature and Pressure Dependence of Membrane Permeance and Its Effect on Process Economics of Hollow Fiber Gas Separation System. J. Membr. Sci. 2013, 430, 44–55. [Google Scholar] [CrossRef]
- Wang, R.; Cao, C.; Chung, T. A Critical Review on Diffusivity and the Characterization of Diffusivity of 6FDA–6FpDA Polyimide Membranes for Gas Separation. J. Membr. Sci. 2002, 198, 259–271. [Google Scholar] [CrossRef]
- Lin, W.-H.; Chung, T. Gas Permeability, Diffusivity, Solubility, and Aging Characteristics of 6FDA-durene Polyimide Membranes. J. Membr. Sci. 2001, 186, 183–193. [Google Scholar] [CrossRef]
- SenGupta, A.; Sirkar, K.K. Ternary Gas Mixture Separation in Two-Membrane Permeators. AIChE J. 1987, 33, 529–539. [Google Scholar] [CrossRef]


| Active Length (m) | ID (μm) | OD (μm) | No. of Fiber | Active Area (m2) |
|---|---|---|---|---|
| 0.24 | 200 | 360 | 4000 | 1.0 |
| Flow Rate (L/min) | Concentration (%) | ||||
|---|---|---|---|---|---|
| CO | CO2 | N2 | H2 | ||
| Residue | 6.917 | 74.57 | 4.89 | 20.26 | 0.28 |
| Permeate | 3.065 | 40.19 | 47.25 | 6.56 | 6.00 |
| Number of Finite Element | Permeance (×10−10 m3/m2·s·Pa) | Selectivity | |||||||
|---|---|---|---|---|---|---|---|---|---|
| Shell | Bore | n | CO | CO2 | N2 | H2 | CO2/CO | CO2/N2 | CO/N2 |
| 10 | 10 | 1 | 0.3964 | 6.1372 | 0.2391 | 15.0102 | 15.66 | 25.96 | 1.66 |
| 15 | 15 | 1 | 0.3978 | 5.8752 | 0.2402 | 13.0289 | 14.77 | 24.46 | 1.66 |
| 20 | 20 | 1 | 0.3985 | 5.7216 | 0.2408 | 12.2034 | 14.36 | 23.76 | 1.65 |
| 30 | 30 | 1 | 0.3992 | 5.5757 | 0.2414 | 11.4660 | 13.97 | 23.09 | 1.65 |
| 15 | 30 | 2 | 0.3989 | 5.6345 | 0.2412 | 11.8931 | 14.13 | 23.36 | 1.65 |
| 15 | 45 | 3 | 0.3993 | 5.5574 | 0.2416 | 11.5443 | 14.30 | 23.00 | 1.65 |
| 15 | 60 | 4 | 0.3994 | 5.5194 | 0.2418 | 11.3750 | 13.82 | 22.83 | 1.65 |
| Pure gas | 0.3742 | 6.1522 | 0.2310 | 12.1477 | 16.43 | 26.23 | 1.62 | ||
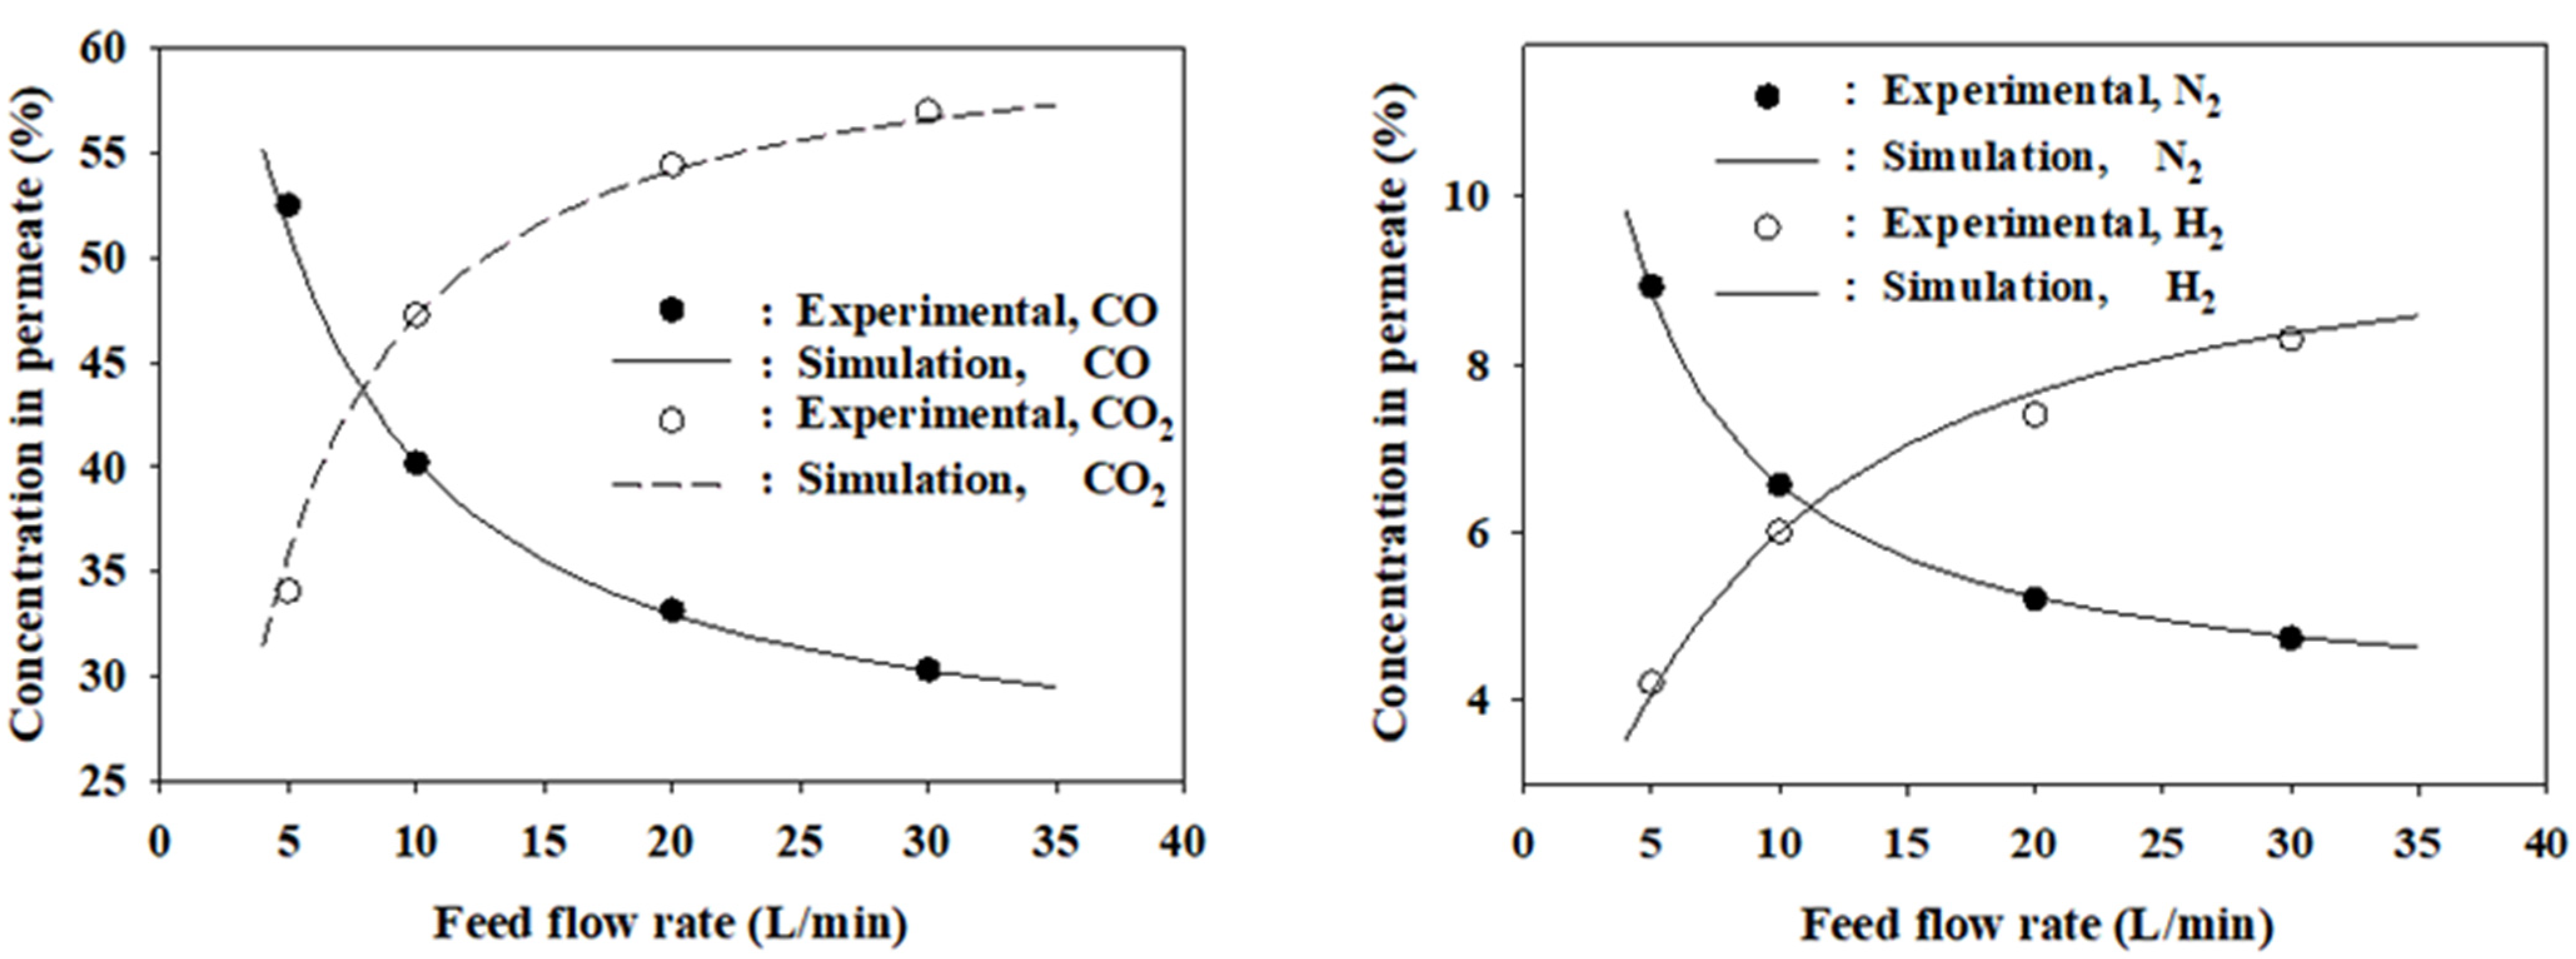
| Feed Flow Rate (L/min) | Stream | Outlet Flow Rate (L/min) | Concentration (%) | |||
|---|---|---|---|---|---|---|
| CO | CO2 | N2 | H2 | |||
| 5.0 | Residue | 2.502 | 76.470 | 0.921 | 22.580 | 0.029 |
| Permeate | 2.341 | 52.454 | 34.112 | 8.929 | 4.506 | |
| 20.0 | Residue | 16.658 | 70.923 | 9.964 | 18.321 | 0.792 |
| Permeate | 3.704 | 33.178 | 54.390 | 5.197 | 7.234 | |
| 30.0 | Residue | 25.837 | 69.102 | 12.123 | 17.680 | 1.096 |
| Permeate | 3.831 | 30.350 | 56.962 | 4.726 | 7.962 | |
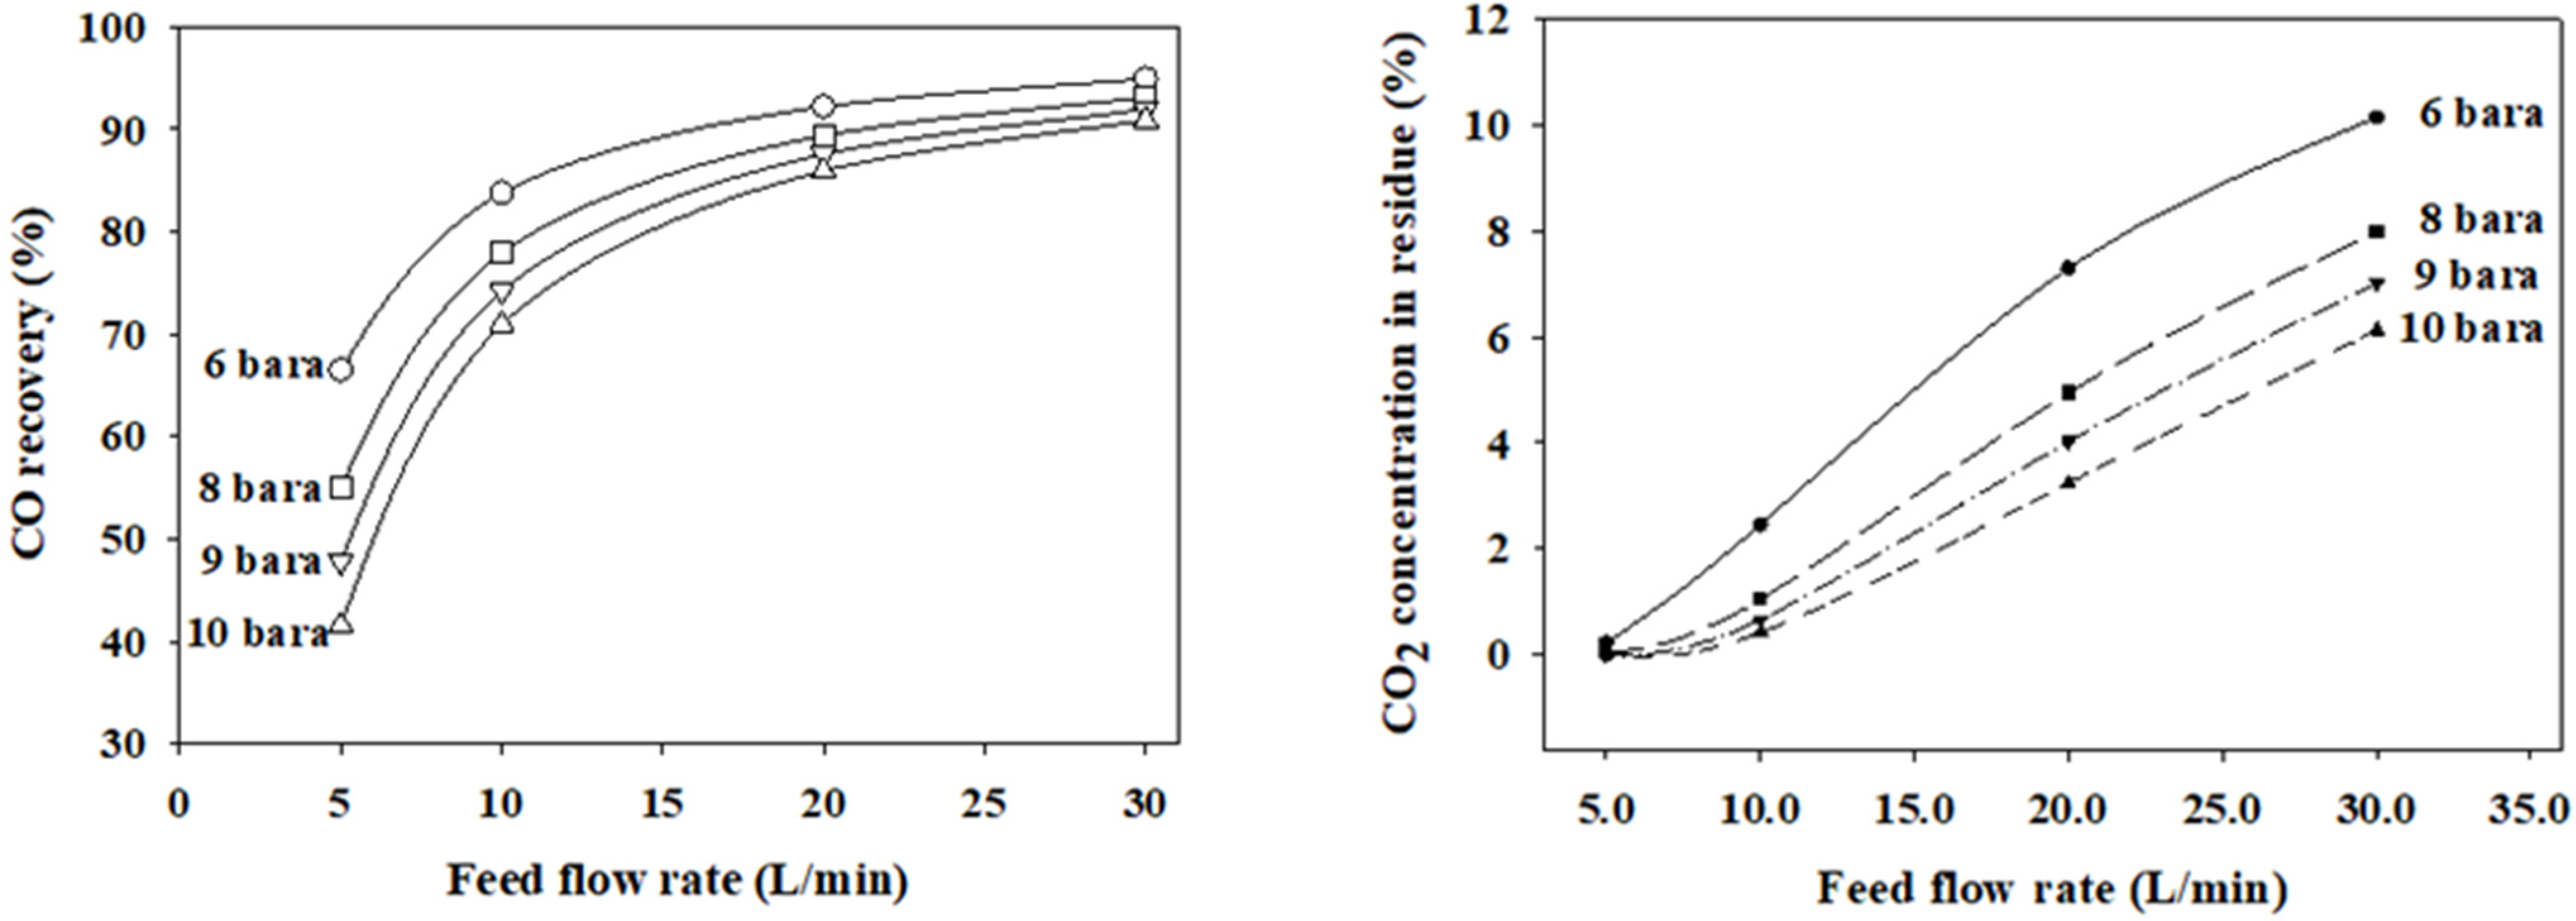
| Feed Flow Rate (L/min) | CO Recovery (%) | CO Conc. in Residue (%) | CO2 Conc. in Residue (%) | ||||||
|---|---|---|---|---|---|---|---|---|---|
| Exper. | Simul. | Err. (%) | Exper. | Simul. | Err. (%) | Exper. | Simul. | Err. (%) | |
| 5 | 59.78 | 60.98 | +2.00 | 76.47 | 76.23 | −0.31 | 0.92 | 0.94 | +2.17 |
| 10 | 80.57 | 80.75 | +0.21 | 74.57 | 74.53 | −0.05 | 4.89 | 5.07 | +3.57 |
| 20 | 92.22 | 90.56 | −1.80 | 70.92 | 70.97 | +0.07 | 9.96 | 9.89 | −0.70 |
| 30 | 92.99 | 93.77 | +0.83 | 69.1 | 69.11 | +0.01 | 12.12 | 12.15 | +0.24 |
| Root mean square percent error (%) | 1.42 | 0.16 | 2.12 | ||||||
Publisher’s Note: MDPI stays neutral with regard to jurisdictional claims in published maps and institutional affiliations. |
© 2022 by the authors. Licensee MDPI, Basel, Switzerland. This article is an open access article distributed under the terms and conditions of the Creative Commons Attribution (CC BY) license (https://creativecommons.org/licenses/by/4.0/).
Share and Cite
Jeon, J.-Y.; Park, B.-R.; Kim, J.-H. Numerical Simulation and Optimization of 4-Component LDG Separation in the Steelmaking Industry Using Polysulfone Hollow Fiber Membranes. Membranes 2022, 12, 97. https://doi.org/10.3390/membranes12010097
Jeon J-Y, Park B-R, Kim J-H. Numerical Simulation and Optimization of 4-Component LDG Separation in the Steelmaking Industry Using Polysulfone Hollow Fiber Membranes. Membranes. 2022; 12(1):97. https://doi.org/10.3390/membranes12010097
Chicago/Turabian StyleJeon, Jong-Yeol, Bo-Ryoung Park, and Jeong-Hoon Kim. 2022. "Numerical Simulation and Optimization of 4-Component LDG Separation in the Steelmaking Industry Using Polysulfone Hollow Fiber Membranes" Membranes 12, no. 1: 97. https://doi.org/10.3390/membranes12010097
APA StyleJeon, J.-Y., Park, B.-R., & Kim, J.-H. (2022). Numerical Simulation and Optimization of 4-Component LDG Separation in the Steelmaking Industry Using Polysulfone Hollow Fiber Membranes. Membranes, 12(1), 97. https://doi.org/10.3390/membranes12010097