
Dependence of Protein Structure on Environment: FOD Model Applied to Membrane Proteins

 ,
,  , and
, and
Abstract
:1. Introduction
2. Experimental Section
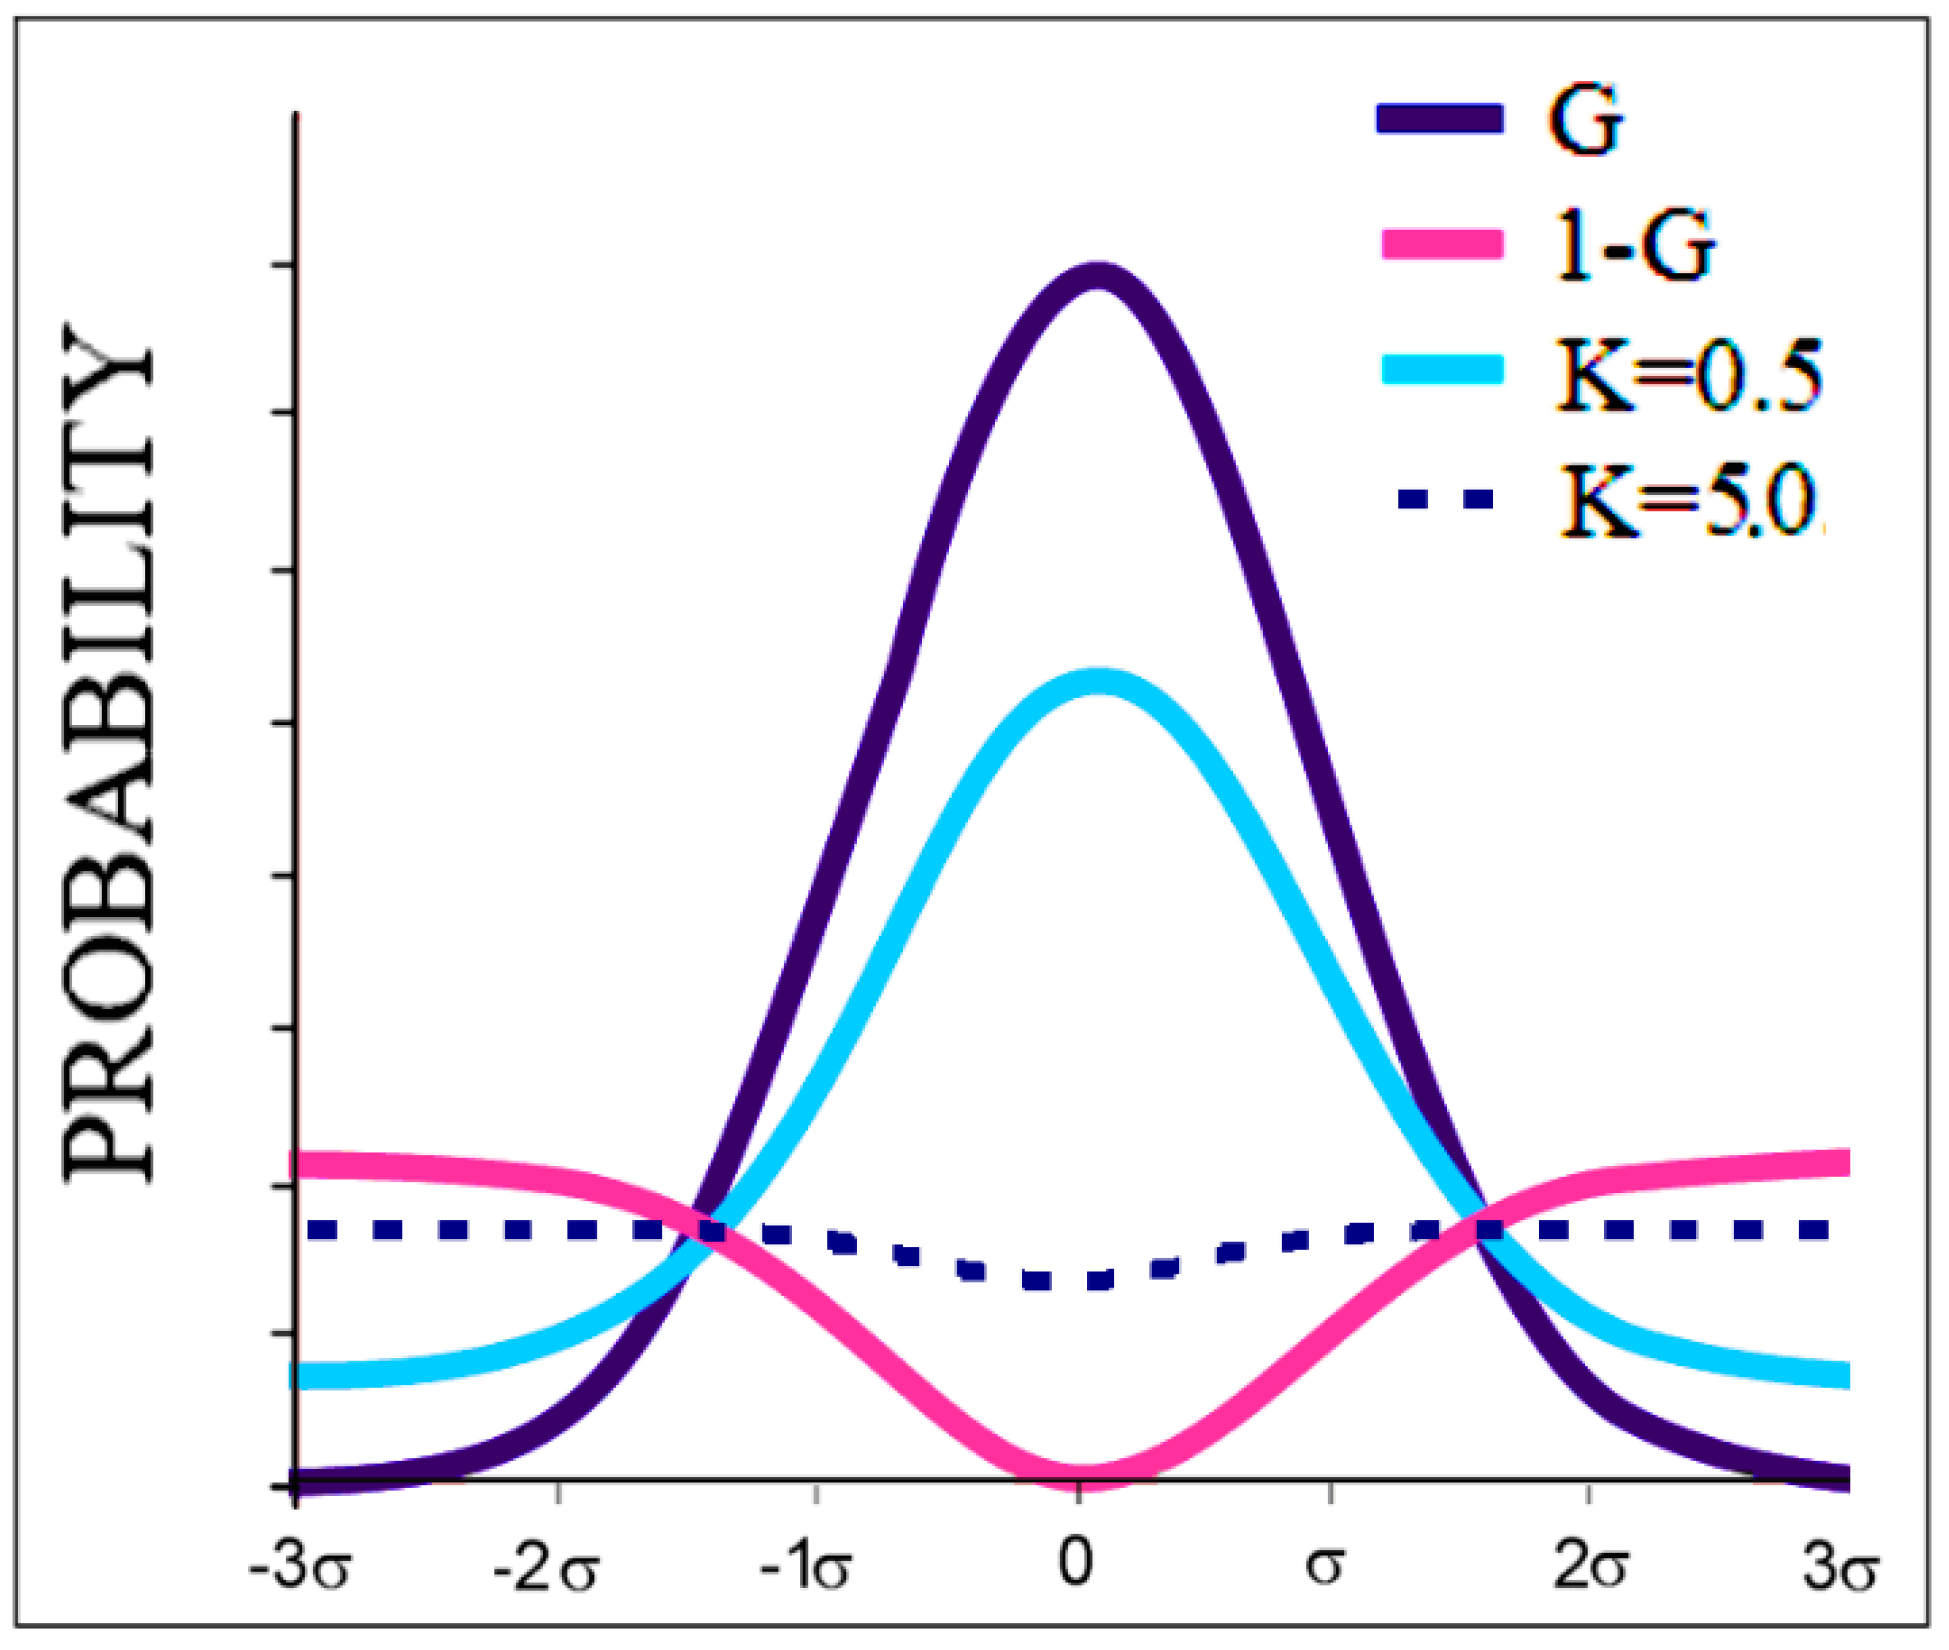
2.1. Description of the FOD Model and Its Modifications FOD-M
2.2. Tools Used
3. Results
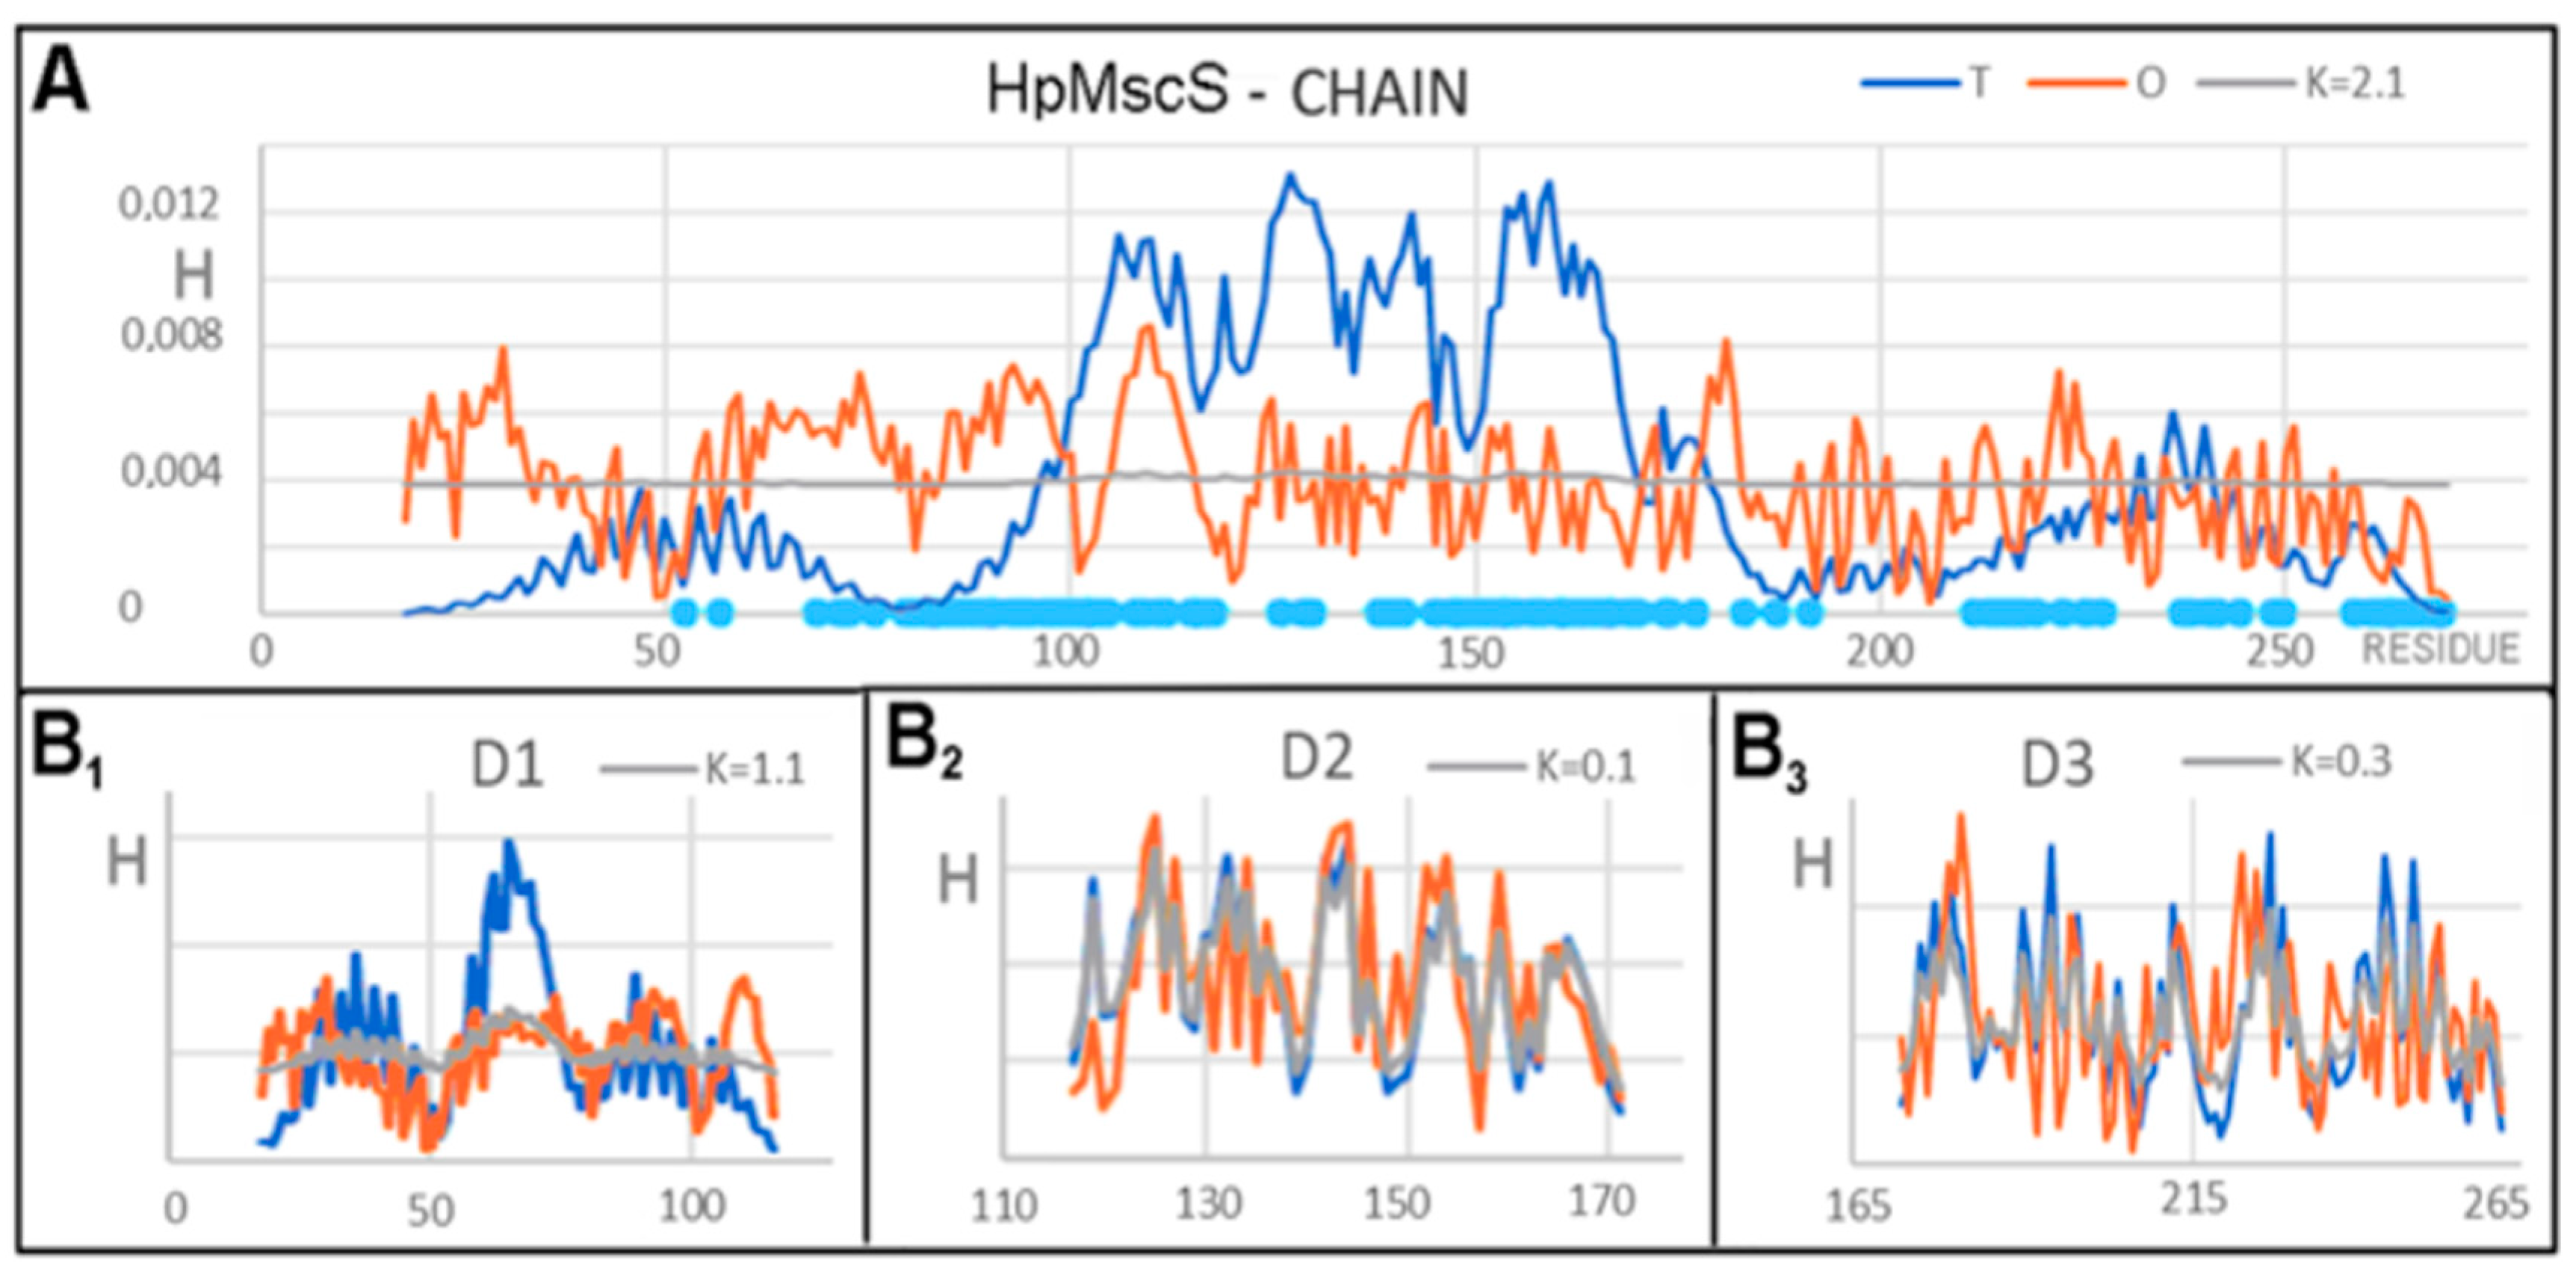
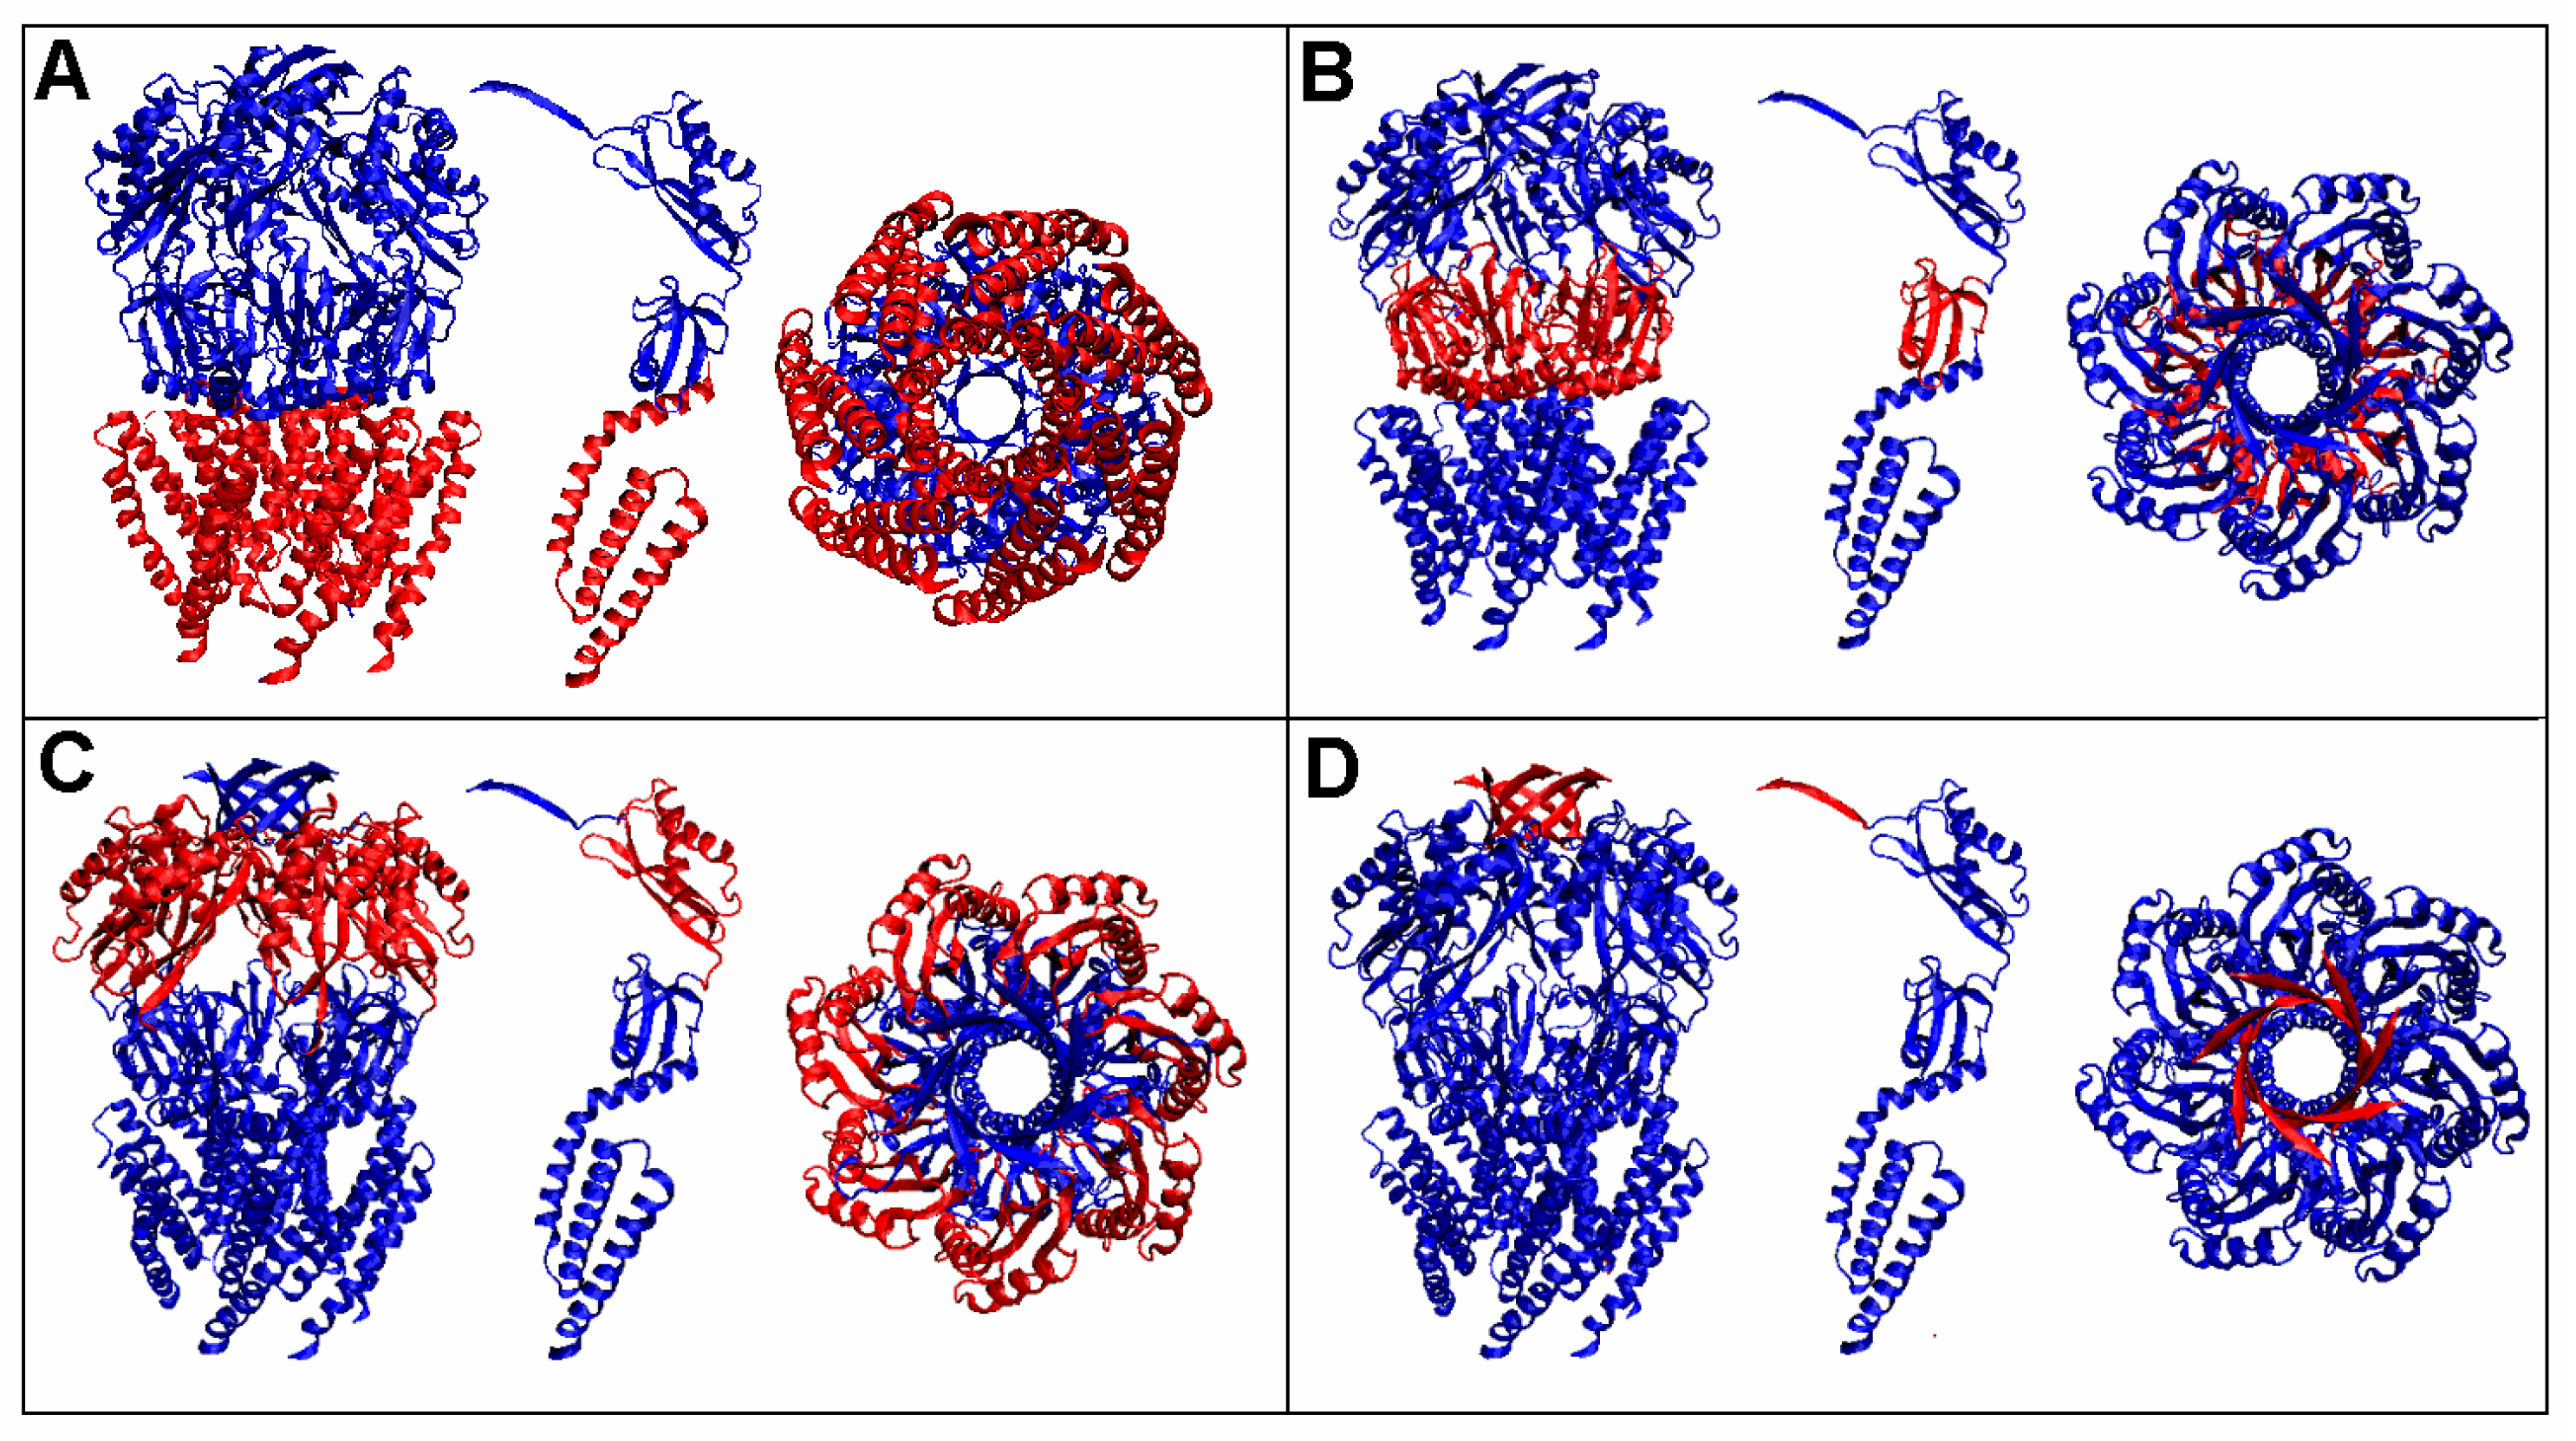
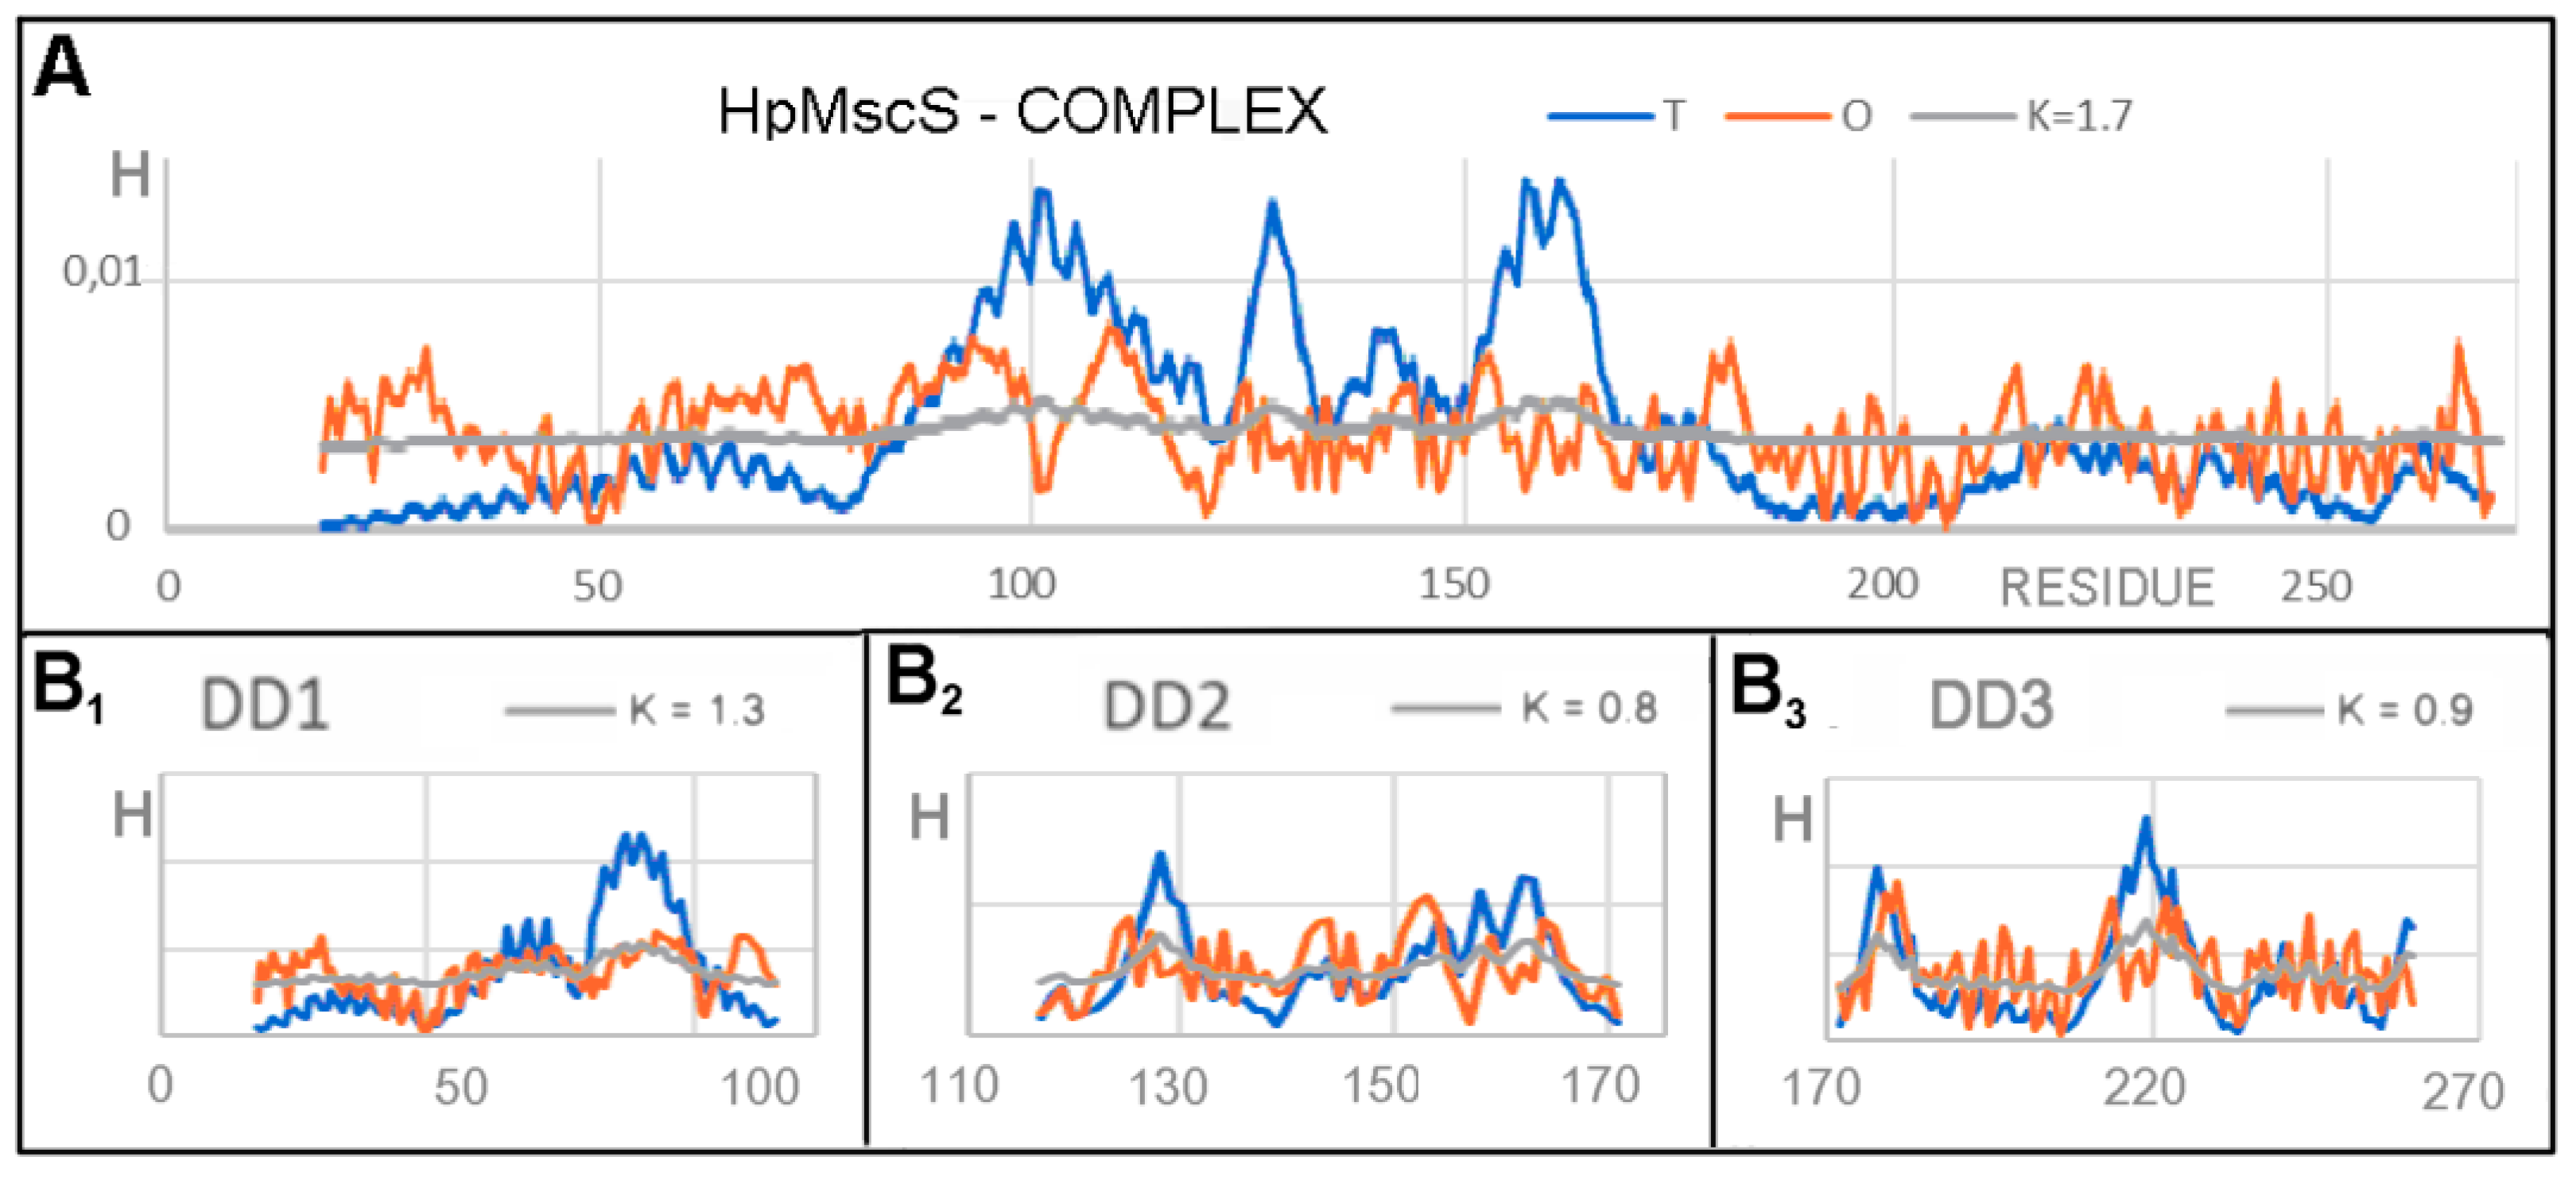
3.1. Analysis of Exemplary MscS Proteins
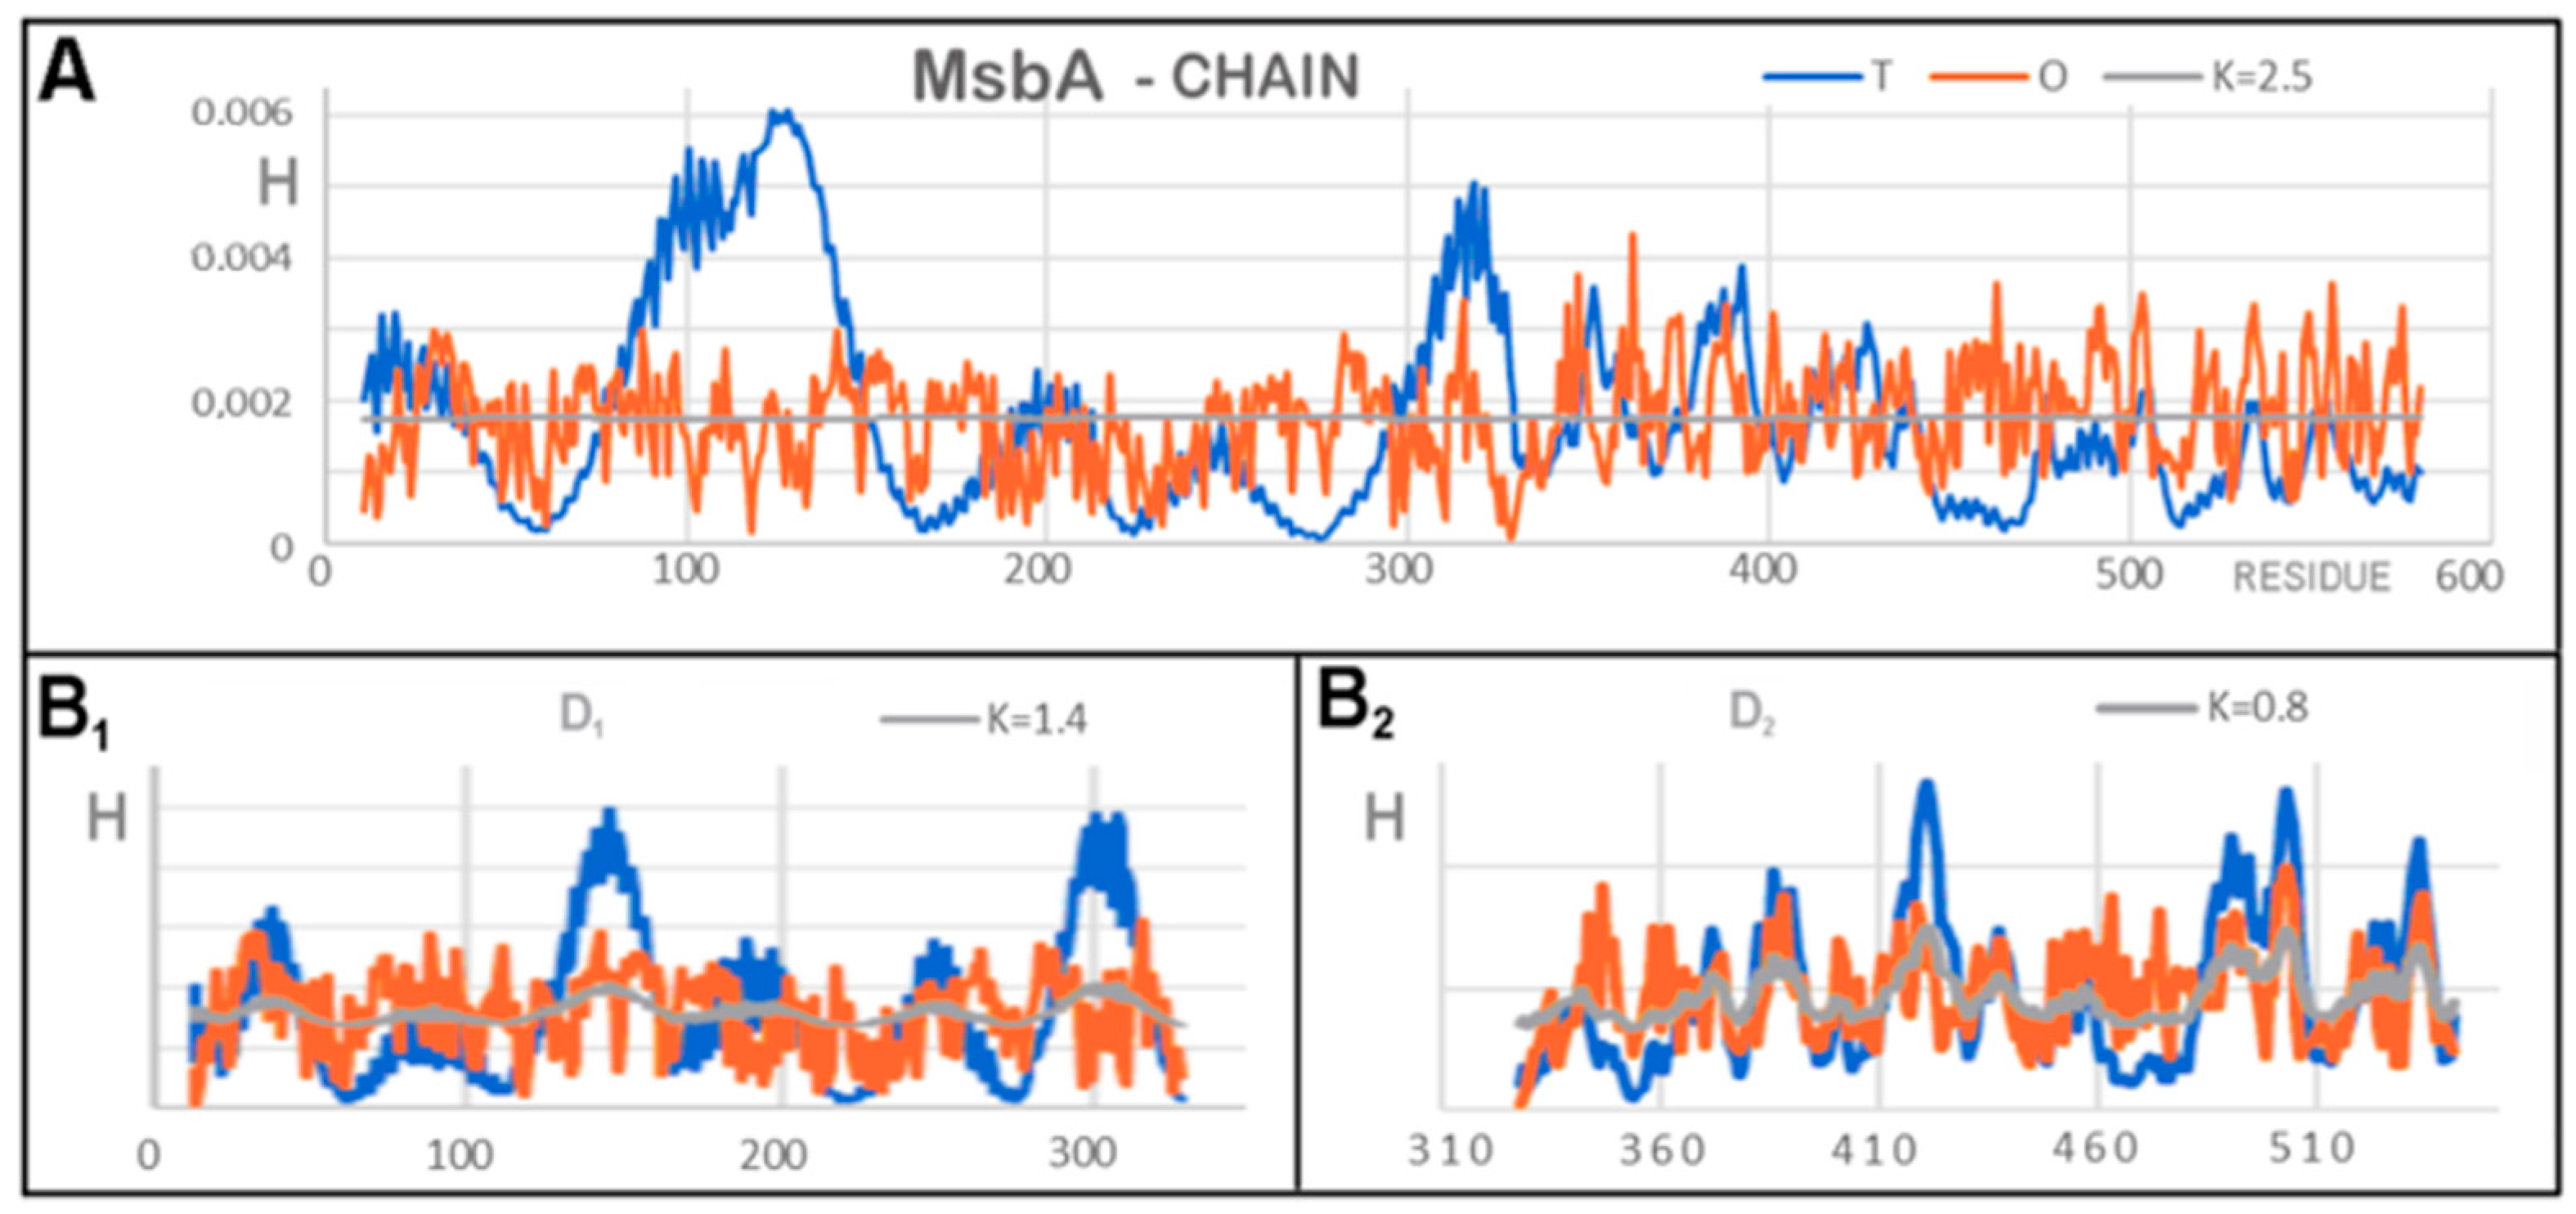
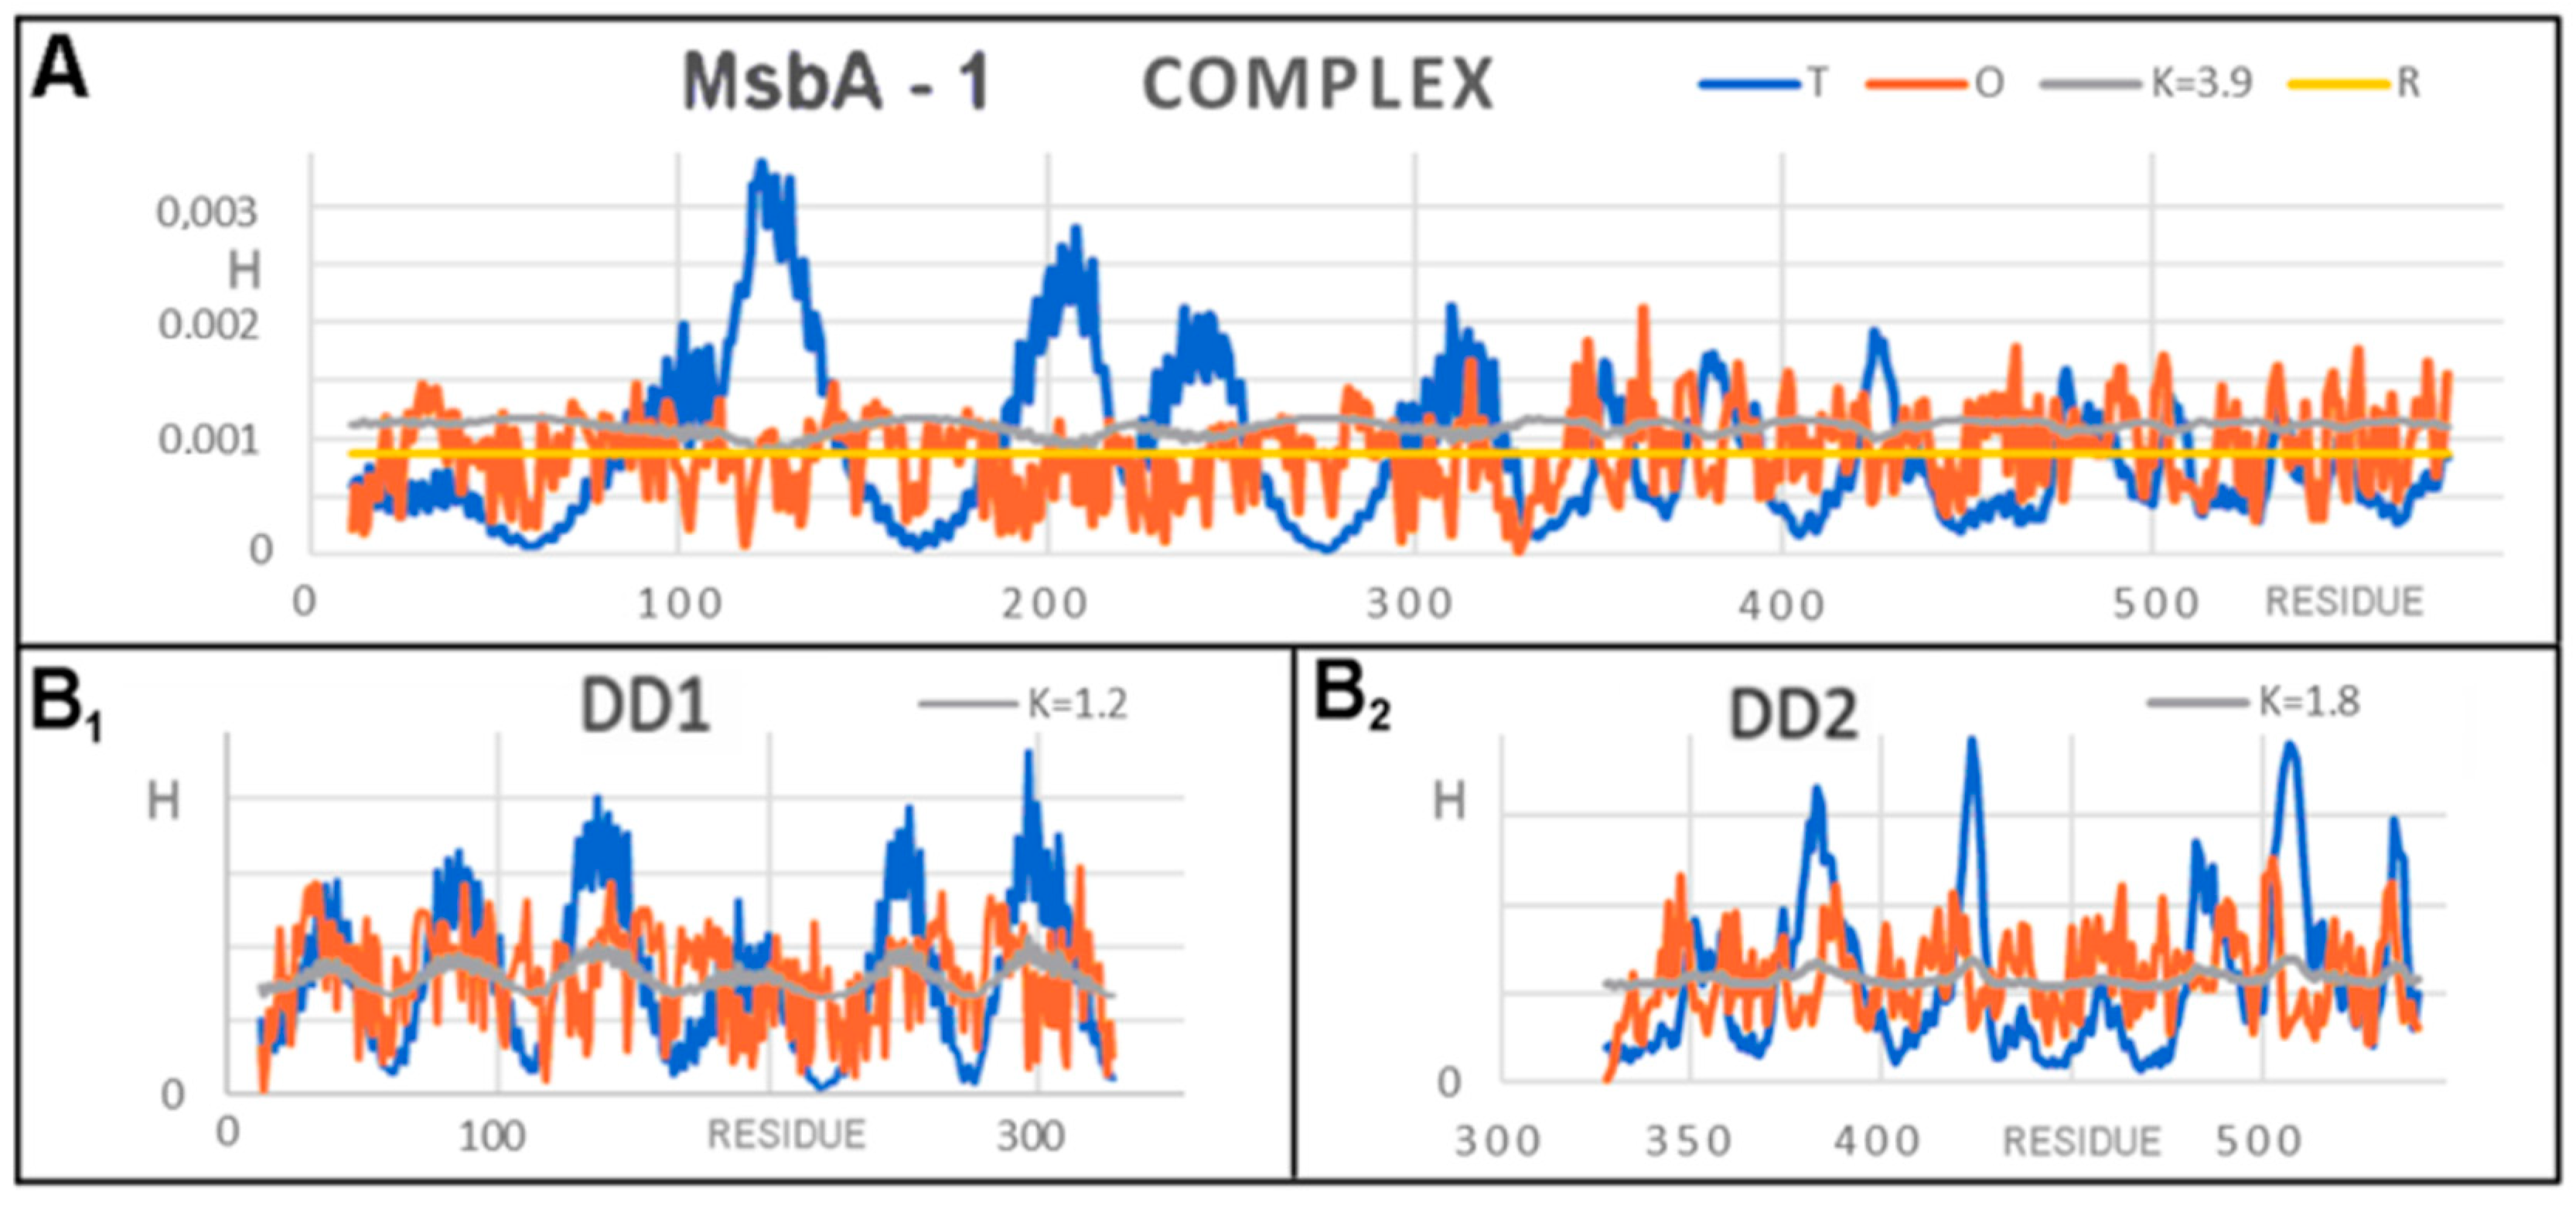
3.2. Representative of Proteins from the MsbA Group
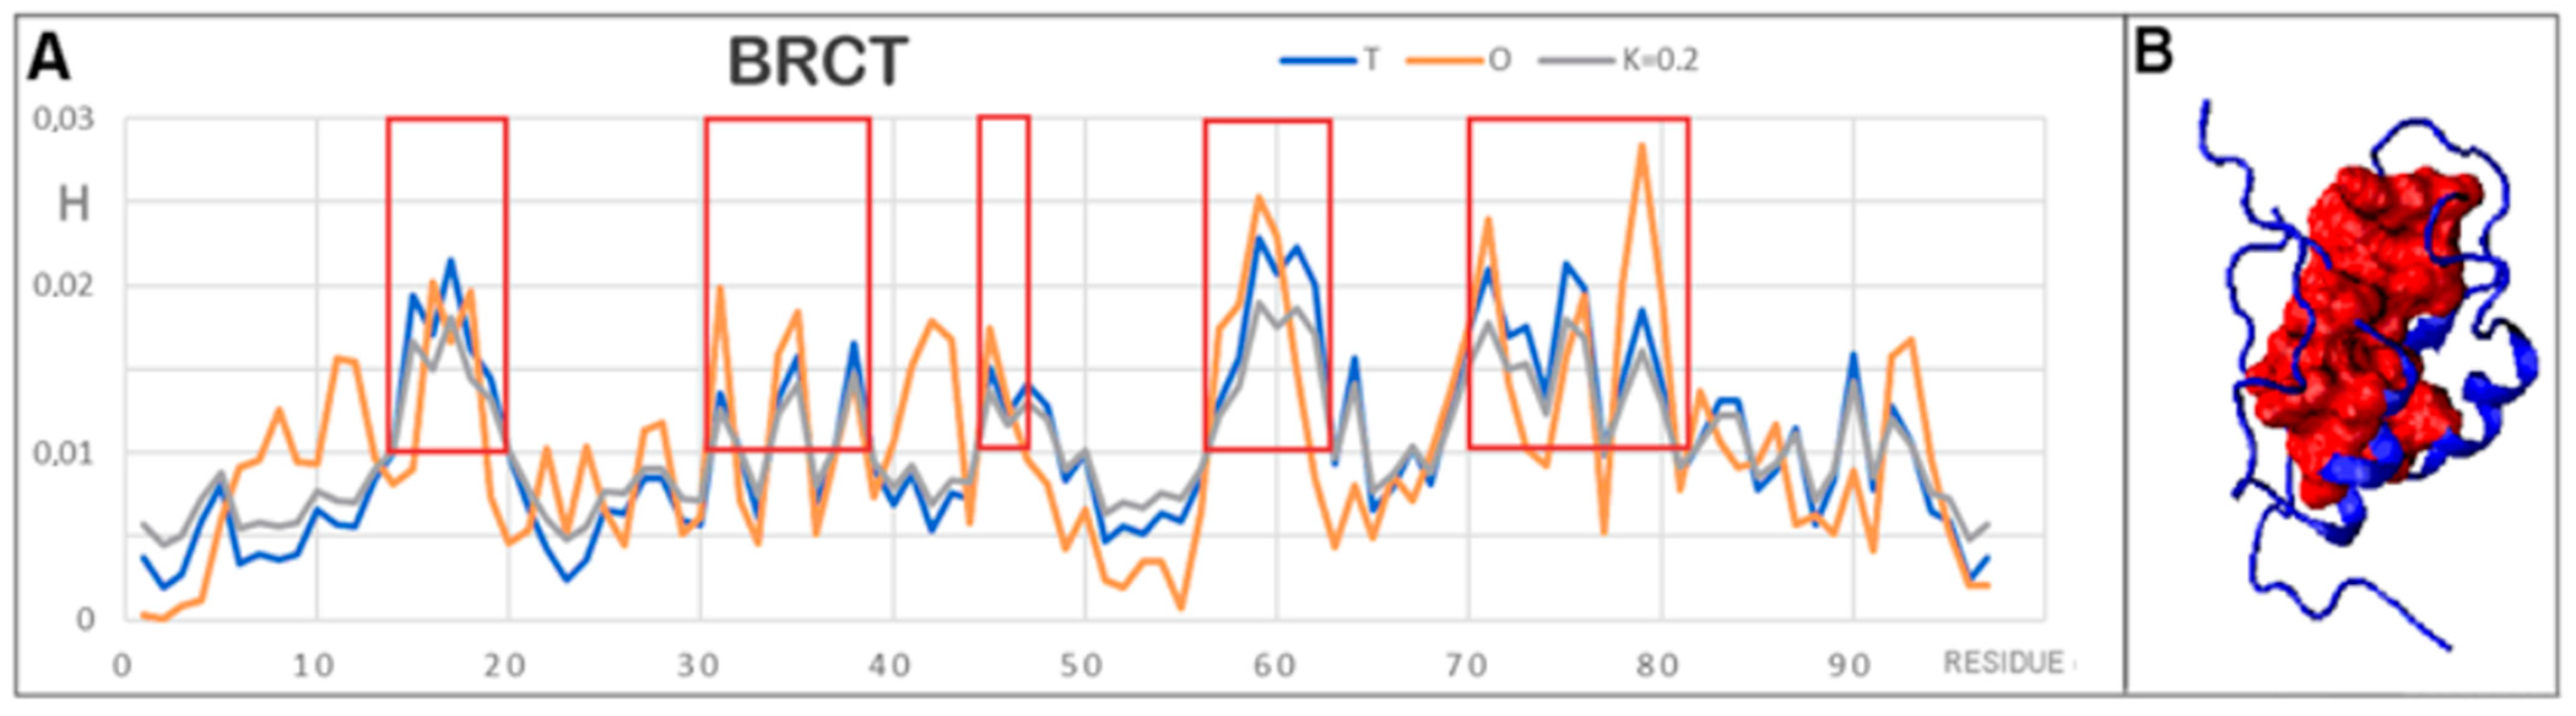
3.3. Protein with an O Distribution Consistent with the T Distribution
4. Discussion
5. Conclusions
Author Contributions
Funding
Informed Consent Statement
Data Availability Statement
Acknowledgments
Conflicts of Interest
References
- Hannah, R.; Malcolm, H.R.; Paul, B.P.; Joshua, A.; Maurer, J.A. The mechanosensitive channel of small conductance (MscS) functions as a Jack-In-The Box. Biochim. Biophys. Acta (BBA)-Biomembr. 2015, 1848, 159–166. [Google Scholar] [CrossRef] [Green Version]
- Peyronnet, R.; Tran, D.; Girault, T.; Frachisse, J.-M. Mechanosensitive channels: Feeling tension in a world under pressure. Front. Plant Sci. 2014, 5, 558. [Google Scholar] [CrossRef] [Green Version]
- Guharay, F.; Sachs, F. Stretch-activated single ion channel currents in tissue-cultured embryonic chick skeletal muscle. J. Physiol. 1984, 352, 685–701. [Google Scholar] [CrossRef]
- Wilson, M.E.; Maksaev, G.; Haswell, E.S. MscS-like mechanosensitive channels in plants and microbes. Biochemistry 2013, 52, 5708–5722. [Google Scholar] [CrossRef] [Green Version]
- Corry, B.; Martinac, B. Bacterial mechanosensitive channels: Experiment and theory. Biochim. Biophys. Acta (BBA)-Biomembr. 2008, 1778, 1859–1870. [Google Scholar] [CrossRef] [Green Version]
- Gullingsrud, J.; Schulten, K. Lipid bilayer pressure profiles and mechanosensitive channel gating. Biophys. J. 2004, 86, 3496–3509. [Google Scholar] [CrossRef] [Green Version]
- Gullingsrud, J.; Schulten, K. Gating of MscL studied by steered molecular dynamics. Biophys. J. 2003, 85, 2087–2099. [Google Scholar] [CrossRef] [Green Version]
- Gullingsrud, J.; Kosztin, D.; Schulten, K. Structural determinants of MscL gating studied by molecular dynamics simulations. Biophys. J. 2001, 80, 2074–2081. [Google Scholar] [CrossRef] [Green Version]
- Roterman, I.; Stapor, K.; Fabian, P.; Konieczny, L. The Functional Significance of Hydrophobic Residue Distribution in Bacterial Beta-Barrel Transmembrane Proteins. Membranes 2021, 11, 580. [Google Scholar] [CrossRef]
- Kalinowska, B.; Banach, M.; Konieczny, L.; Roterman, I. Application of Divergence Entropy to Characterize the Structure of the Hydrophobic Core in DNA Interacting Proteins. Entropy 2015, 17, 1477–1507. [Google Scholar] [CrossRef] [Green Version]
- Dygut, J.; Kalinowska, B.; Banach, M.; Piwowar, M.; Konieczny, L.; Roterman, I. Structural Interface Forms and Their Involvement in Stabilization of Multidomain Proteins or Protein Complexes. Int. J. Mol. Sci. 2016, 17, 1741. [Google Scholar] [CrossRef] [Green Version]
- Banach, M.; Konieczny, L.; Roterman, I. Ligand binding cavity encoded as a local hydrophobicity deficiency. In From Globular Proteins to Amyloids; Irena, R.-K., Ed.; Elsevier: Amsterdam, The Netherlands; Oxford, UK; Cambridge, MA, USA, 2020; pp. 91–94. [Google Scholar]
- Roterman, I.; Stapor, K.; Fabian, P.; Konieczny, L.; Banach, M. Model of Environmental Membrane Field for Transmembrane Proteins. Int. J. Mol. Sci. 2021, 22, 3619. [Google Scholar] [CrossRef]
- Lai, J.Y.; Poon, Y.S.; Kaiser, J.T.; Rees, D.C. Open and shut: Crystal structures of the dodecylmaltoside solubilized mechanosensitive channel of small conductance from Escherichia coli and Helicobacter pylori at 4.4 Å and 4.1 Å resolutions. Protein Sci. 2013, 22, 502–509. [Google Scholar] [CrossRef] [Green Version]
- Angiulli, G.; Dhupar, H.S.; Suzuki, H.; Wason, I.S.; Van Hoa, F.D.; Thomas, W.T. New approach for membrane protein reconstitution into peptidiscs and basis for their adaptability to different proteins. Elfie 2020, 9, e53530. [Google Scholar] [CrossRef]
- Zhang, W.; Zhang, J.; Zhang, X.; Xu, C.; Tu, X. Solution structure of Rap1 BRCT domain from Saccharomyces cerevisiae reveals a novel fold. Biochem. Biophys. Res. Commun. 2011, 404, 1055–1059. [Google Scholar] [CrossRef]
- Kauzmann, W. Some factors in the intepretation of protein denaturation. Adv. Prot Chem. 1959, 14, 1–63. [Google Scholar] [CrossRef]
- Levitt, M. A simplified representation of protein conformations for rapid simulation of protein folding. J. Mol. Biol. 1976, 104, 59–107. [Google Scholar] [CrossRef]
- Kullback, S.; Leibler, R.A. On information and sufficiency. Ann. Math. Stat. 1951, 22, 79–86. [Google Scholar] [CrossRef]
- Banach, M.; Stapor, K.; Konieczny, L.; Fabian, P.; Roterman, I. Downhill, Ultrafast and Fast Folding Proteins Revised. Int. J. Mol. Sci. 2020, 21, 7632. [Google Scholar] [CrossRef]
- Hatos, A.; Hajdu-Soltész, B.; Monzon, A.M.; Palopoli, N.; Lucía, Á.L.; Aykac-Fas, B.; Bassot, C.; Benítez, G.I.; Bevilacqua, M.; Chasapi, A.; et al. DisProt: Intrinsic protein disorder annotation in 2020. Nucleic Acids Res. 2020, 48, D269–D276. [Google Scholar] [CrossRef] [Green Version]
- Available online: www.disprot.org (accessed on 31 August 2021).
- Konieczny, L.; Roterman, I. Conclusion. In Protein Folding In Silico; Irena, R.-K., Ed.; Woodhead Publishing—Currently Elsevier: Oxford, UK; Cambridge, MA, USA; Philadelphia, PA, USA; New Dehli, India, 2012; pp. 191–201. [Google Scholar]
- Hong, M.; Zhang, Y.; Hu, F. Membrane protein structure and dynamics from NMR spectroscopy. Annu Rev. Phys. Chem. 2012, 63, 1–24. [Google Scholar] [CrossRef] [Green Version]
- Das, B.B.; Park, S.H.; Opella, S.J. Membrane protein structure from rotational diffusion. Biochim. Biophys. Acta 2015, 1848, 229–445. [Google Scholar] [CrossRef] [Green Version]
- Moraes, I.; Evans, G.; Sanchez-Weatherby, J.; Newstead, S.; Stewart, P.D. Membrane protein structure determination—The next generation. Biochim. Biophys. Acta 2014, 1838, 78–87. [Google Scholar] [CrossRef] [Green Version]
- Pedro, A.Q.; Queiroz, J.A.; Passarinha, L.A. Smoothing membrane protein structure determination by initial upstream stage improvements. Appl. Microbiol. Biotechnol. 2019, 103, 5483–5500. [Google Scholar] [CrossRef]
- Pandey, A.; Shin, K.; Patterson, R.E.; Liu, X.Q.; Rainey, J.K. Current strategies for protein production and purification enabling membrane protein structural biology. Biochem. Cell Biol. 2016, 94, 507–527. [Google Scholar] [CrossRef] [Green Version]
- Hendrickson, W.A. Atomic-level analysis of membrane-protein structure. Nat. Struct Mol. Biol. 2016, 23, 464–467. [Google Scholar] [CrossRef] [PubMed] [Green Version]
- Overduin, M.; Esmaili, M. Memtein: The fundamental unit of membrane-protein structure and function. Chem. Phys. Lipids 2019, 218, 73–84. [Google Scholar] [CrossRef]
- Tusnády, G.E.; Dosztányi, Z.; Simon, I. Transmembrane proteins in the Protein Data Bank: Identification and classification. Bioinformatics 2004, 20, 2964–2972. [Google Scholar] [CrossRef] [PubMed] [Green Version]
- Fuchs, A.; Frishman, D. Structural comparison and classification of alpha-helical transmembrane domains based on helix interaction patterns. Proteins 2010, 78, 2587–2599. [Google Scholar] [CrossRef] [PubMed]
- Neumann, S.; Fuchs, A.; Mulkidjanian, A.; Frishman, D. Current status of membrane protein structure classification. Proteins 2010, 78, 1760–1773. [Google Scholar] [CrossRef] [PubMed]
- Shimizu, K.; Cao, W.; Saad, G.; Shoji, M.; Terada, T. Comparative analysis of membrane protein structure databases. Biochim. Biophys. Acta (BBA)-Biomembr. 2018, 1860, 1077–1091. [Google Scholar] [CrossRef] [PubMed]
- Choy, B.C.; Cater, R.J.; Mancia, F.; Pryor, E.E., Jr. A 10-year meta-analysis of membrane protein structural biology: Detergents, membrane mimetics, and structure determination techniques. Biochim. Biophys. Acta (BBA)-Biomembr. 2021, 1863, 183533. [Google Scholar] [CrossRef] [PubMed]
- Roel-Touris, J.; Jiménez-García, B.; Bonvin, A.M.J.J. Integrative modeling of membrane-associated protein assemblies. Nat. Commun. 2020, 11, 6210. [Google Scholar] [CrossRef]
- Roterman, I.; Stapor, K.; Fabian, P.; Konieczny, L. In Silico Modeling of the Influence of Environment on Amyloid Folding Using FOD-M Model. Int. J. Mol. Sci. 2021, 22, 10587. [Google Scholar] [CrossRef]
- Roterman, I.; Stapor, K.; Gądek, K.; Gubała, T.; Nowakowski, P.; Fabian, P.; Konieczny, L. On the Dependence of Prion and Amyloid Structure on the Folding Environment. Int. J. Mol. Sci. 2021, 22, 13494. [Google Scholar] [CrossRef] [PubMed]


| Protein Code PDB | PDB ID | Organism | Characteristics | Ref. |
|---|---|---|---|---|
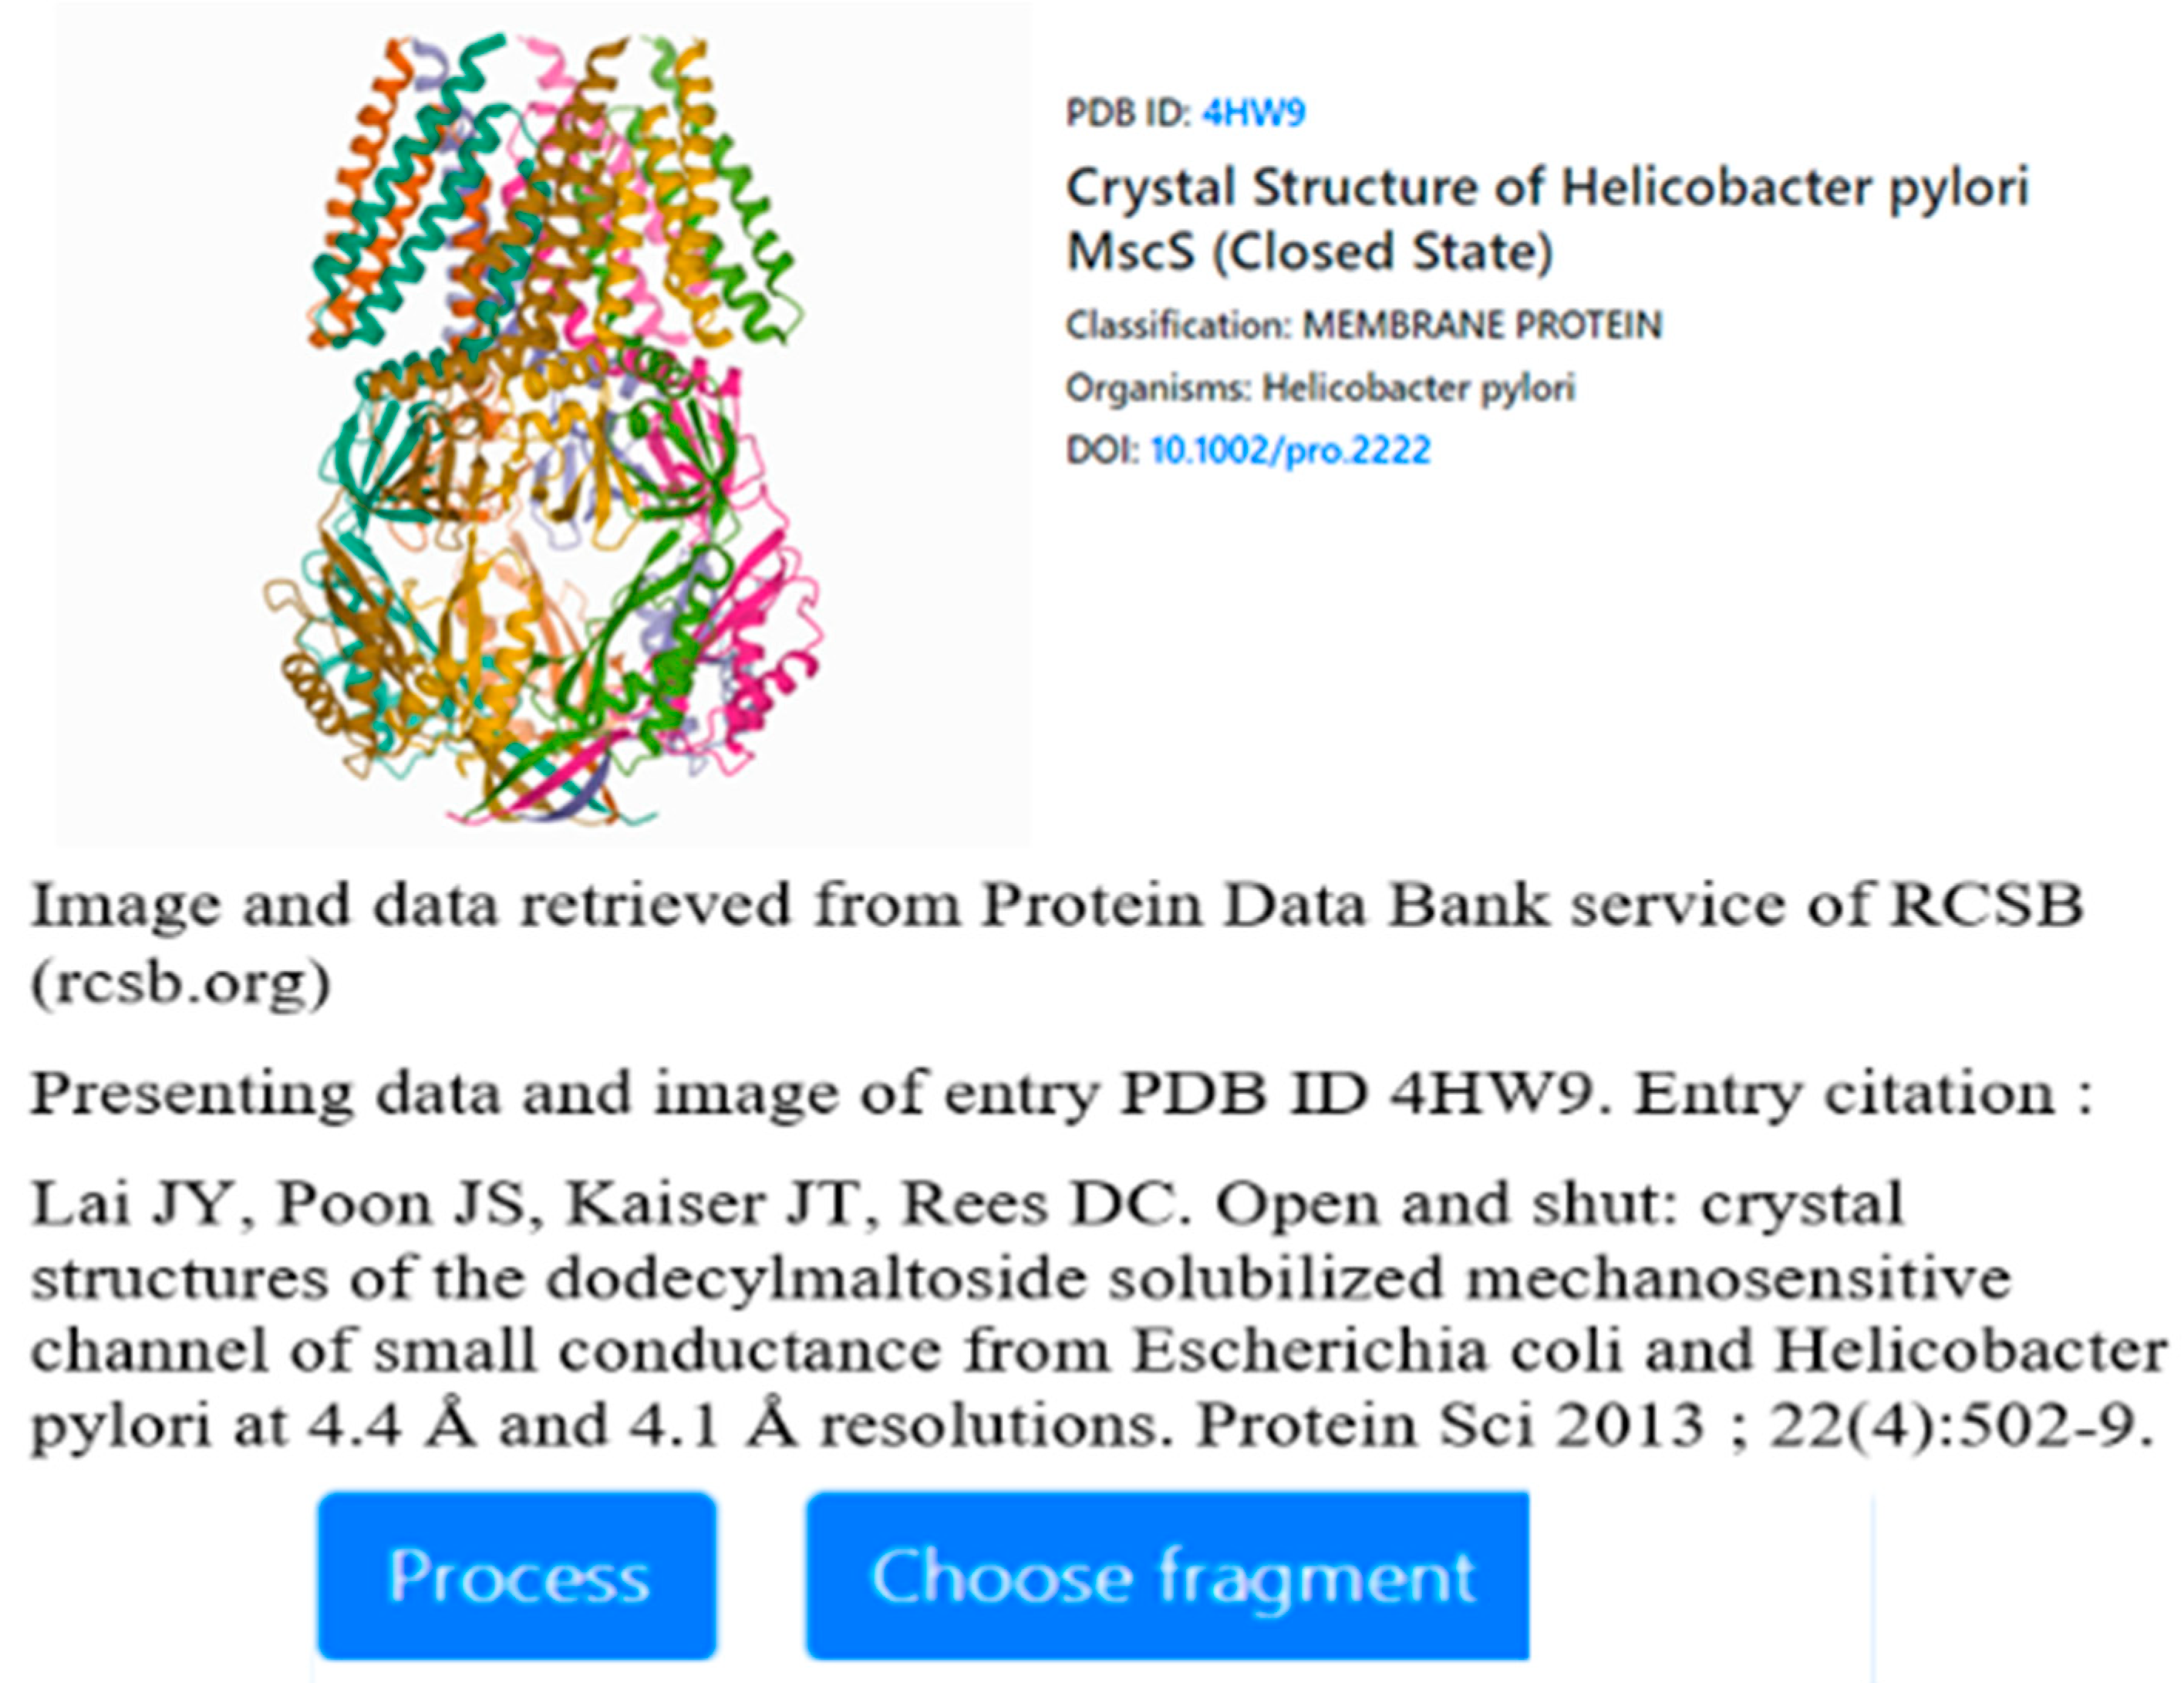
| HpMscS | 4HW9 | Helicobacter Pylori | MD, PMD | [14] |
| EcMscS | 4HWA | E coli | MD, PMD | [14] |
| MsbA-1 | 6UZ2 | E coli | MD | [15] |
| MsbA-2 | 6UZL | E coli | MD | [15] |
| BRCT domain | 2L42 | Saccharomyces cerevisiae | 1D Water-soluble | [16] |
| HpMscS (4HW9)-CLOSED | EcMscS (4HWA)-OPEN | ||||
|---|---|---|---|---|---|
| Fragment | RD | K | K | RD | Fragment |
| COMPLEX | |||||
| Complex | 0.766 | 1.6 | 1.5 | 0.770 | Complex |
| DD1 18–116 | 0.782 | 1.2 | 1.0 | 0.763 | DD1 25–126 |
| DD2 117–171 | 0.625 | 0.8 | 0.9 | 0.680 | DD2 127–179 |
| DD3 172–260 | 0.627 | 0.9 | 1.0 | 0.642 | DD3 180–270 |
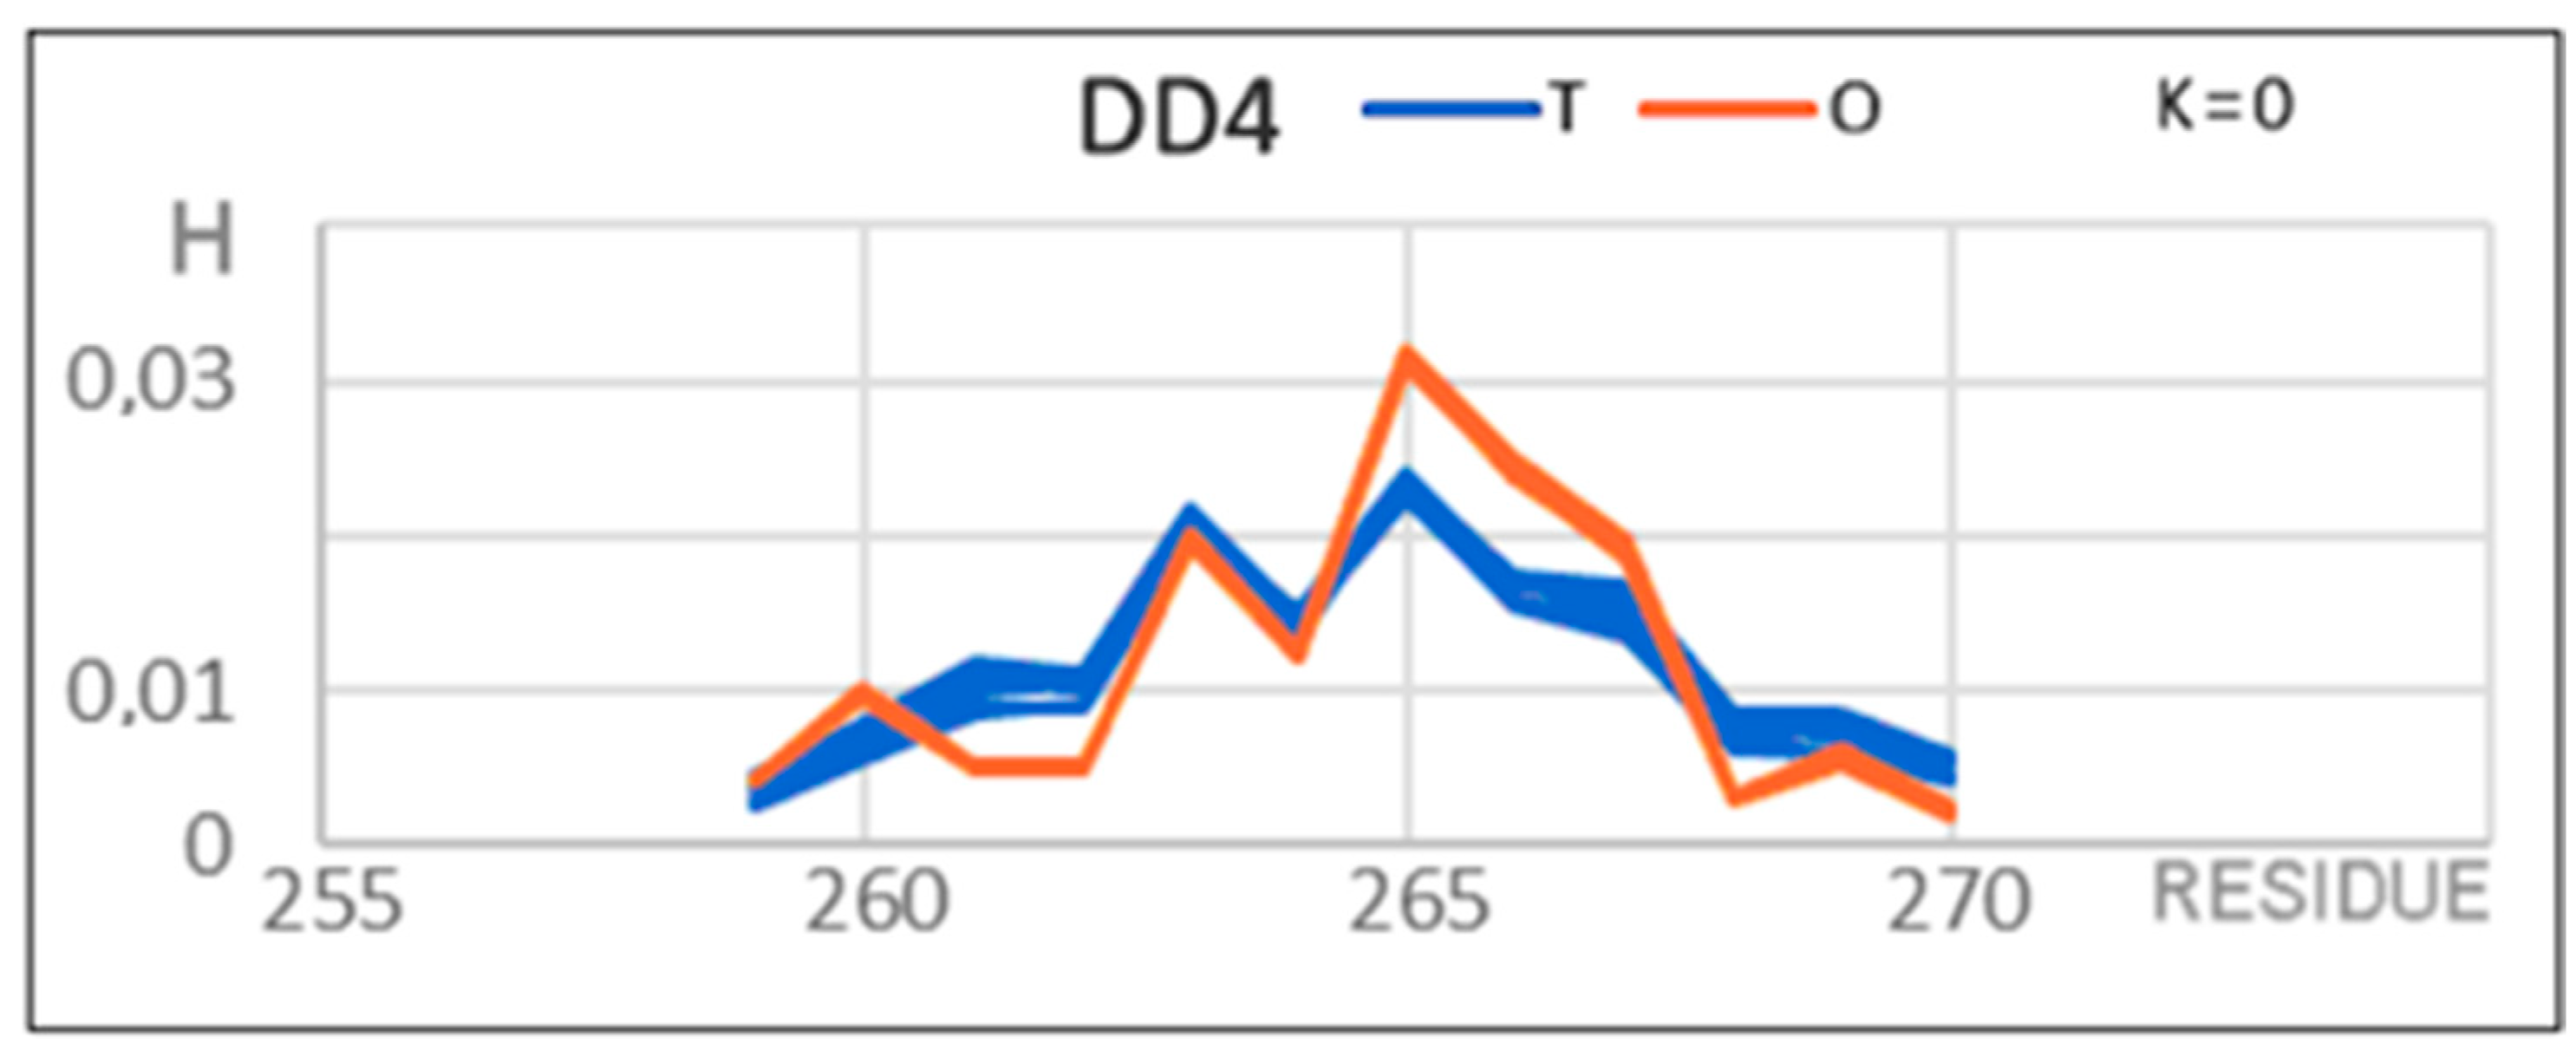
| DD4 261–272 | 0.255 | 0.0 | 0.0 | 0.090 | DD4 271–280 |
| Fragments in complex | |||||
| 18–272 | 0.781 | 1.7 | 1.7 | 0.791 | 25–280 |
| 18–116 | 0.843 | 1.6 | 1.8 | 0.873 | 25–126 |
| 117–171 | 0.613 | 0.6 | 0.4 | 0.572 | 127–179 |
| 172–260 | 0.600 | 0.6 | 0.8 | 0.635 | 180–270 |
| 261–272 | 0.508 | 0.4 | 0.3 | 0.493 | 271–280 |
| Chain individual | |||||
| 18–272 | 0.846 | 2.1 | 1.4 | 0.791 | 25–280 |
| 18–116 | 0.902 | 2.6 | 2.2 R | 0.897 | 25–126 |
| 117–171 | 0.738 | 2.1 | 0.2 | 0.560 | 127–179 |
| 172–260 | 0.639 | 1.0 | 1.4 | 0.629 | 180–270 |
| 261–267 | 0.738 | 2.1 | 1.0 | 0.801 | 271–280 |
| Domains individual | |||||
| D1 18–116 | 0.725 | 1.1 | 0.9 | 0.690 | 25–126 |
| D2 117–171 | 0.339 | 0.1 | 0.1 | 0.344 | 127–179 |
| D3 172–260 | 0.472 | 0.3 | 0.3 | 0.452 | 180–270 |
| D4 261–267 | 0.430 | 0.1 | 0.1 | 0.135 | 271–280 |
| FRAGMENT | 6UZ2 | 6UZL | ||
|---|---|---|---|---|
| RD | K | K | RD | |
| COMPLEX | ||||
| CHAINS A + B | 0.822 | 3.9 | 3.4 | 0.823 |
| DD1 | 0.717 | 1.2 | 1.2 | 0.724 |
| DD2 | 0.782 | 1.8 | 1.8 | 0.774 |
| INDIVIDUAL UNITS | ||||
| Chain A | 0.808 | 2.4 | 2.5 | 0.812 |
| D1 | 0.771 | 1.4 | 1.4 | 0.771 |
| D2 | 0.687 | 0.9 | 0.8 | 0.659 |
Publisher’s Note: MDPI stays neutral with regard to jurisdictional claims in published maps and institutional affiliations. |
© 2021 by the authors. Licensee MDPI, Basel, Switzerland. This article is an open access article distributed under the terms and conditions of the Creative Commons Attribution (CC BY) license (https://creativecommons.org/licenses/by/4.0/).
Share and Cite
Roterman, I.; Stapor, K.; Gądek, K.; Gubała, T.; Nowakowski, P.; Fabian, P.; Konieczny, L. Dependence of Protein Structure on Environment: FOD Model Applied to Membrane Proteins. Membranes 2022, 12, 50. https://doi.org/10.3390/membranes12010050
Roterman I, Stapor K, Gądek K, Gubała T, Nowakowski P, Fabian P, Konieczny L. Dependence of Protein Structure on Environment: FOD Model Applied to Membrane Proteins. Membranes. 2022; 12(1):50. https://doi.org/10.3390/membranes12010050
Chicago/Turabian StyleRoterman, Irena, Katarzyna Stapor, Krzysztof Gądek, Tomasz Gubała, Piotr Nowakowski, Piotr Fabian, and Leszek Konieczny. 2022. "Dependence of Protein Structure on Environment: FOD Model Applied to Membrane Proteins" Membranes 12, no. 1: 50. https://doi.org/10.3390/membranes12010050
APA StyleRoterman, I., Stapor, K., Gądek, K., Gubała, T., Nowakowski, P., Fabian, P., & Konieczny, L. (2022). Dependence of Protein Structure on Environment: FOD Model Applied to Membrane Proteins. Membranes, 12(1), 50. https://doi.org/10.3390/membranes12010050