Article

A Systematic Study of Ammonia Recovery from Anaerobic Digestate Using Membrane-Based Separation

1
Institute of Sustainable Processes, University of Valladolid, 47011 Valladolid, Spain
2
Department of Applied Physics, Science Faculty, University of Valladolid, 47011 Valladolid, Spain
3
Department of Chemical Engineering and Environmental Technology, University of Valladolid, 47011 Valladolid, Spain
*
Author to whom correspondence should be addressed.
Membranes 2022, 12(1), 19; https://doi.org/10.3390/membranes12010019
Submission received: 9 December 2021 / Revised: 21 December 2021 / Accepted: 23 December 2021 / Published: 24 December 2021

Abstract

:
Ammonia recovery from synthetic and real anaerobic digestates was accomplished using hydrophobic flat sheet membranes operated with H2SO4 solutions to convert ammonia into ammonium sulphate. The influence of the membrane material, flow rate (0.007, 0.015, 0.030 and 0.045 m3 h−1) and pH (7.6, 8.9, 10 and 11) of the digestate on ammonia recovery was investigated. The process was carried out with a flat sheet configuration at a temperature of 35 °C and with a 1 M, or 0.005 M, H2SO4 solution on the other side of the membrane. Polytetrafluoroethylene membranes with a nominal pore radius of 0.22 µm provided ammonia recoveries from synthetic and real digestates of 84.6% ± 1.0% and 71.6% ± 0.3%, respectively, for a membrane area of 8.6 × 10⁻⁴ m2 and a reservoir volume of 0.5 L, in 3.5 h with a 1 M H2SO4 solution and a recirculation flow on the feed side of the membrane of 0.030 m3 h−1. NH3 recovery followed first order kinetics and was faster at higher pHs of the H2SO4 solution and recirculation flow rate on the membrane feed side. Fouling resulted in changes in membrane surface morphology and pore size, which were confirmed by Atomic Force Microscopy and Air Displacement Porometry.

Graphical Abstract

1. Introduction

A change in the perception of the uses of anaerobic digestion has occurred over past decades. Thus, anaerobic digestion was initially considered as a cost-competitive technology for organic matter stabilization in wastewaters and solid waste, then a sustainable platform for renewable electricity and heat generation via biogas production, and more recently, it has been regarded as the potential core of a multiproduct biorefinery. Energy and carbon in the form of biogas, along with nutrients dissolved in anaerobic effluents (typically called digestates), represent nowadays the main by-products from anaerobic waste treatment. NH3 recovery from digestates will prevent the pollution of natural water bodies, which is desirable as this nitrogenous compound is toxic to fish, increases oxygen demand and induces eutrophication [1]. NH3 is also harmful to humans as it causes respiratory problems and is considered a precursor of N2O, a potent greenhouse gas [2,3,4]. Therefore, NH3 recovery from digestates is crucial to improve the environmental sustainability of anaerobic digestion processes and could bring additional economic benefits. Unfortunately, only 10% of the nitrogen present in wastewater is recovered by conventional wastewater treatment plants (WWTPs) [5,6,7]. Today, there is a wide range of commercial technologies to remove ammonia from wastewater, but most of them entail high operating costs [8] and environmental impacts resulting from nitrogen conversion and release to the atmosphere. Thus, conventional physical/chemical technologies are based on selective ion exchange, air stripping, chemical precipitation, adsorption, advanced oxidation processes, breakpoint chlorination, etc. [9,10,11,12]. For instance, NH3 stripping ranks among the most popular, but energy demanding, technologies available to remove nitrogen from high-strength wastewater, with an average energy consumption of 4 kwh per kg of nitrogen [13]. On the other hand, conventional nitrogen removal in domestic WWTPs relies on nitrification, which is the conversion of ammoniacal nitrogen (NH3-N) to NO 3 , and denitrification, which is the conversion of NO 3 to N2 gas [14,15,16]. In this context, 1.5 kWh of electricity are typically required to remove 1 kg of N in denitrification/nitrification or anammox processes [17]. In addition, conventional biological nitrogen removal in WWTPs entails 0.9 kg CO2 eq per m3 of treated water [18,19]. Therefore, there is an urgent need to develop and implement cost-competitive and sustainable NH3 recovery technologies in high strength wastewater such as digestates [20,21,22].
Recently, the use of membranes for NH3 recovery from high strength wastewater has been proposed as a cost-competitive and environmentally friendly approach to upgrade residual nitrogen. For example, Brennan et al. [23] made an extensive analysis of costs demonstrating the feasibility of NH3 recovery by membranes over conventional methods at a pilot plant scale. Membrane contactors require less energy because of their high specific surface area, which provides a faster NH3 separation. In this context, membrane contactors have been successfully implemented for NH3 recovery from gaseous emissions [24,25,26]. Membrane contactors have also been implemented to support a direct NH3 recovery from wastewater [27,28,29]. This approach is based on hydrophobic membranes made of polymers highly permeable to NH3, which is transported through the membrane pores into the receiving liquid phase recirculating through the permeate side [20,21,30]. This permeating NH3 reacts with an acid contained in the permeate side of the membrane. For the process to be efficient, ammoniacal nitrogen has to be present in its volatile form (NH3), which can be ensured by increasing pH and temperature [22]. Ammonium sulphate, a commercial chemical fertilizer, can be generated during membrane-based NH3 recovery when using H2SO4 to boost NH3 diffusion (Equation (1)) [31]. The use of H3PO4 and HNO3 on the permeate side also results in the generation of chemical fertilizers such as ammonium phosphate and ammonium nitrate, respectively [27,28,29]. In this regard, Damtie and co-workers concluded that H2SO4 mediates a more effective ammonia capture than H3PO4 and HNO3 [32].
2 NH 3 +   H 2 SO 4   ( NH 4 ) 2 SO 4
In this work, the performance of commercial flat sheet membranes for NH3 recovery from synthetic and real digestates was systematically evaluated. To optimize the operation conditions, the influence of digestate pH, within the range of coexisting NH4+, NH3 [33], and recirculation flow rate, was investigated using different concentrations of sulfuric acid on the other side of the membrane. To make this new ammonia process accessible, our proposal involves the use of commercial membranes that were previously employed for other applications. By scanning the variables that can be controlled at the place of installation, we reached the optimal conditions, without using the latest generation and non-commercial materials. Ultimately, our objective was to propose a solution within the reach of the farmer who intends to implement it in their facilities. Finally, membrane fouling was studied using Atomic Force Microscopy (AFM) to examine the surface morphology of the membranes and Air Displacement Porometry (ADP) to determine the corresponding changes of the pore sizes of the membranes.

2. Materials and Methods

2.1. Real and Synthetic Digestate Characterization

The synthetic digestate (SD) composition mimicked a real digestate and consisted of 5.0 g NaHCO3, 0.85 g C8H5KO4, 0.73 g peptone from casein, 1.70 g NH4Cl, 0.90 g CO(NH2)2, 0.224 g K2HPO4, 0.0175 g NaCl, 0.01 Ca2Cl and 0.005 g MgSO4 (per litre of distilled water) [34]. All reagents were purchased from PANREAC (Panreac, Química SAU, Barcelona, Spain). The real digestate (RD) used in this study was supplied by Valladolid WWTP (Spain). This digestate was obtained from the anaerobic digestion of mixed sludge and on-site centrifuged prior to use to eliminate suspended solids. The concentration of NH3 in SD and RD averaged 605.8 ± 0.1 and 678.9 ± 0.6 ppm, respectively, while pHs averaged 7.57 ± 0.05 and 8.99 ± 0.08, respectively.

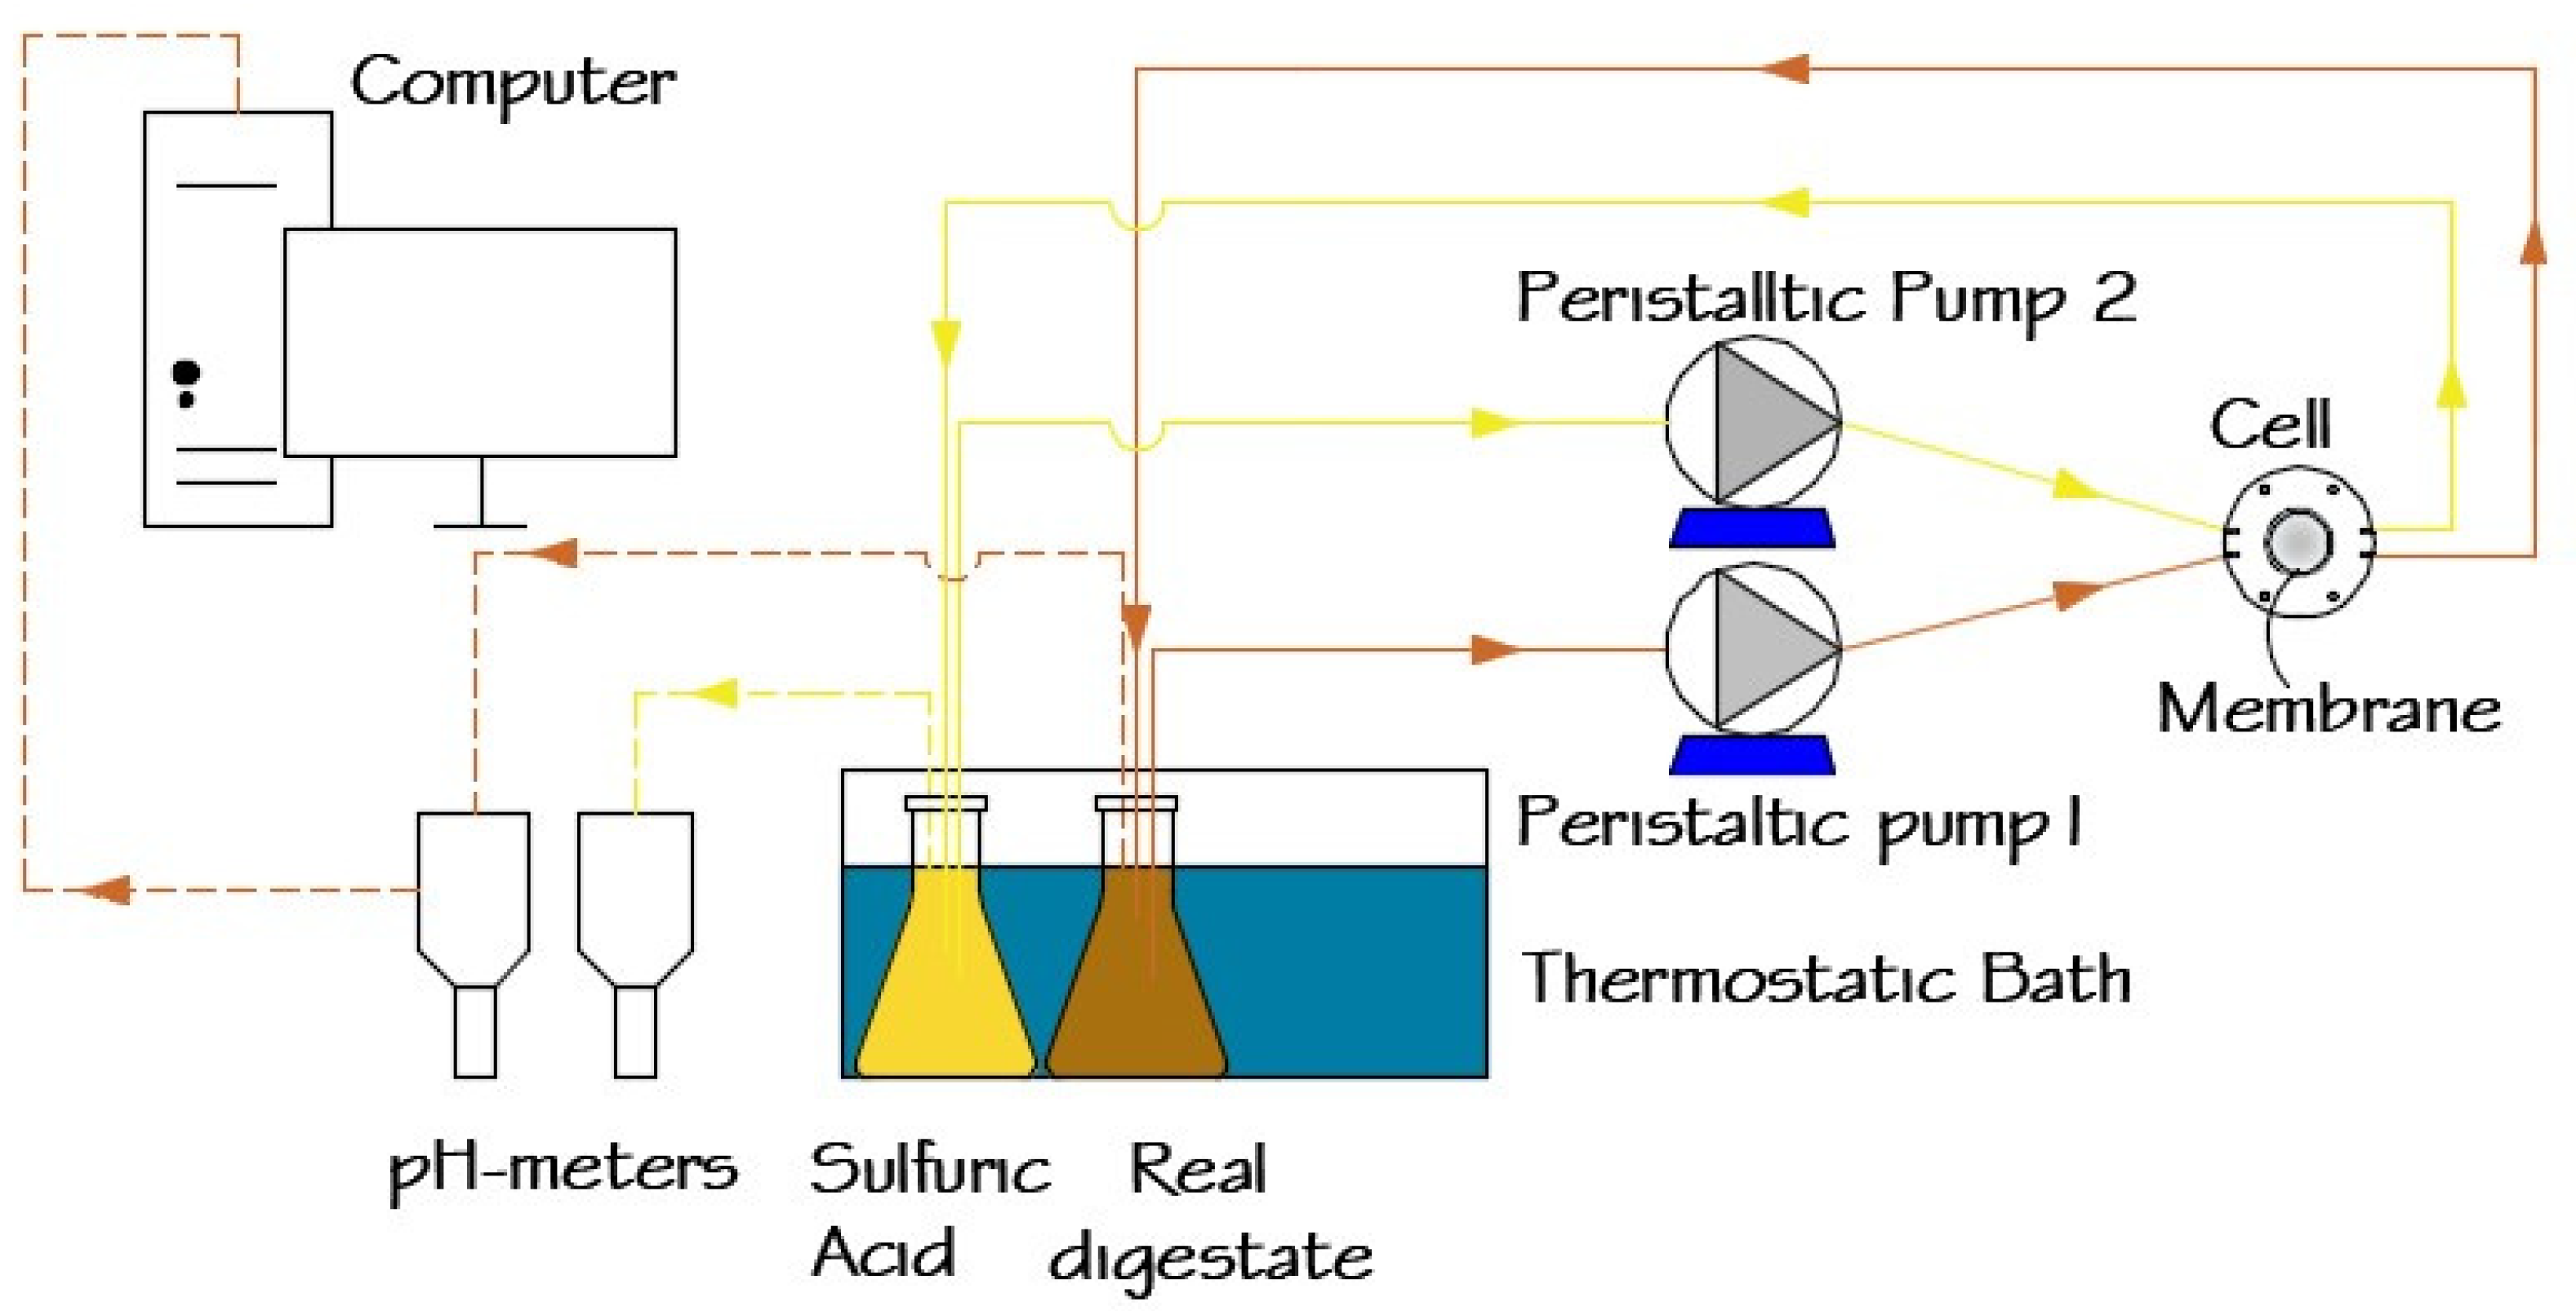
2.2. Experimental Setup

A schematic representation of the experimental setup used for ammonia recovery from digestates is shown in Figure 1. The target digestate (SD or RD) was continuously circulated using a peristaltic pump (Watson–Marlow Sci-Q 323, Spirax–Sarco Engineering plc, Cheltenham, England, UK) over the active layer of the membrane in a customized cell module [35]. A sulfuric acid solution was recirculated using a similar peristaltic pump on the support layer of the membrane. Both digestate and sulfuric acid solutions were maintained at 35 °C in a thermostatic bath (HAAKE type E12, Thermo Fisher Scientific, Waltham, MA, USA) in 0.5 L enclosed Erlenmeyer bottles.
The membranes used and their main characteristics are shown in Table 1. Polytetrafluoroethylene (PTFE) and polyvinylidene difluoride (PVDF) were selected as model commercial membranes based on their ideal properties for the separation of light molecules from water in a gaseous phase.

2.3. Operational Conditions and Process Evaluation

An initial test series was carried out with all the membranes initially selected (Table 1) using synthetic digestate at two different pHs (7.6 and 10) and two sulfuric acid concentrations (0.005 and 1 M) at 35 °C with recirculation flow rates of 0.030 m3 h−1. Trials were carried out with intermediate sulfuric acid concentration, but with no relevance in the results. A second series of experiments was conducted with PTFE-0.22 and real digestate at pHs of 8.9 and 10 using recirculation flow rates of 0.030 m3 h−1 and a sulfuric acid concentration of 1 M. Finally, a third series of experiments was carried out with both RD and SD and the PTFE-0.22 membrane, at a pH of 10, with a sulfuric acid concentration of 1 M and recirculation flow rates of 0.007, 0.015, 0.030 and 0.045 m3 h1. The membrane system was washed twice for 1 h after each experiment with distilled water when using SD, and with tap water (which contains sodium hypochlorite) when using RD. Samples of the digestate solution were drawn every 30 min over 3.5 h to analyse the concentration of NH3 and obtain pH values. Finally, a systematic evaluation of membrane fouling was performed by determining the pore size distribution of PTFE-0.22 membranes after their use with SD and RD, at a pH of 10 and with a sulfuric acid concentration of 1 M at different recirculation flow rates (0.007, 0.015, 0.030 and 0.045 m3 h−1). All experiments were carried out in duplicate.

2.4. Analytical Methods

The values of pH and temperature were monitored using a HI5522 pH meter Hanna Instruments (Woonsocket, RI, USA) and a Basic 20 pH meter (Crison Instruments, S.A., Alella, Barcelona, Spain) in the liquids on both sides of the membrane. NH3 was measured using the Nessler analytical method in a Shimadzu UV-160 A spectrophotometer at 425 nm (Shimadzu, Kyoto, Japan).

2.5. Membrane Characterization Techniques

Surface morphology was analysed by using Atomic Force Microscopy. Images were obtained with a Nanoscope IIIA microscope (Digital Instruments, Veeco Metrology Group, Chadds Ford, PA, USA) using the Tapping mode. Pore size distribution was analysed by the extended bubble point method, or Air Displacement Porometry (ADP), using a Coulter ® Porometer-II manufactured by Coulter Electronics (Porometer, Aptco Invest, Dulles, VA, USA) [36]. Samples were first wetted with an electronic liquid FC-43 (FluorinertTM, 3 M, St. Paul, MN, USA) of low surface tension (γ 1.6 × 10⁻² N m−1), low vapour pressure (192 Pa) and low reactivity, that can be assumed to fill all the pores given a zero contact-angle with the membrane material. The wetted sample was subjected to increasing pressure, applied by a compressed clean and dry air source. The pressure range for PTFE 0.22 membrane was 0.09–0.60 µm.

2.6. Theoretical Methods

The overall mass transfer coefficient of NH3 was calculated with Equation (2). according to [21].
1 k o v = 1 k s + 1 k m
where ks and km are the mass transfer coefficients in the digestate side and within pores, respectively. The resistance on the acid solution side can be considered negligible (i.e., mass transfer coefficient on the acid side is much larger than ks and km). In this context, the mass transfer coefficient on the digestate side can be estimated using Equation (3):
k s = D A W S h D H
where DAW, Sh and DH are: diffusion coefficient of NH3 in water (calculated using the software ASPEN (AspenTech, Bedford, MA, USA) at 35 °C), the Sherwood dimensionless number [37], and the hydraulic diameter, respectively. Similarly, the mass transfer coefficient within pores can be calculated by Equation (4) [26,38]:
k s = ϵ D i j τ δ
where τ , δ , Dij and ϵ are: the tortuosity, the wall thickness of the membrane, the diffusion coefficient of NH3 in the air gap within pores, and the porosity of the membrane, respectively. Accepting Knudsen regime [21]:
D i j = d p 3 8 R T π m
in terms of the pore diameter and NH3 molar mass m.
The molar theoretical flux of NH3 across the membrane can be estimated using Equation (6) [39]:
J T = k o v Δ C
here, Δ C is the difference in NH3 concentrations between the feed and permeate sides. Finally, NH3 recovery seems to follow first-order kinetics, which can be estimated using Equation (7) [40,41]:
l n C 0 C t = k o v A m V t t
where kov, Am/Vt and t are the overall mass transfer coefficient, the effective ratio of membrane area to feed volume of the digestate, and the elapsed time, respectively. C0 and Ct are the concentration of ammonia at time zero and time t in the digestate, respectively. NH3 recovery (R) ranges between 0 and 1 (Equation (8)):
R = 1 C t C 0 = 1 e k o v A m V t t 1 e α t
here α = k o v A m V t is the rate of concentration decrease and recovery increase. Therefore, the time needed to reach a given R can be estimated using Equation (9):
t ( R ) = l n ( 1 R ) k o v A m V t = l n ( 1 R ) α

3. Results and Discussion

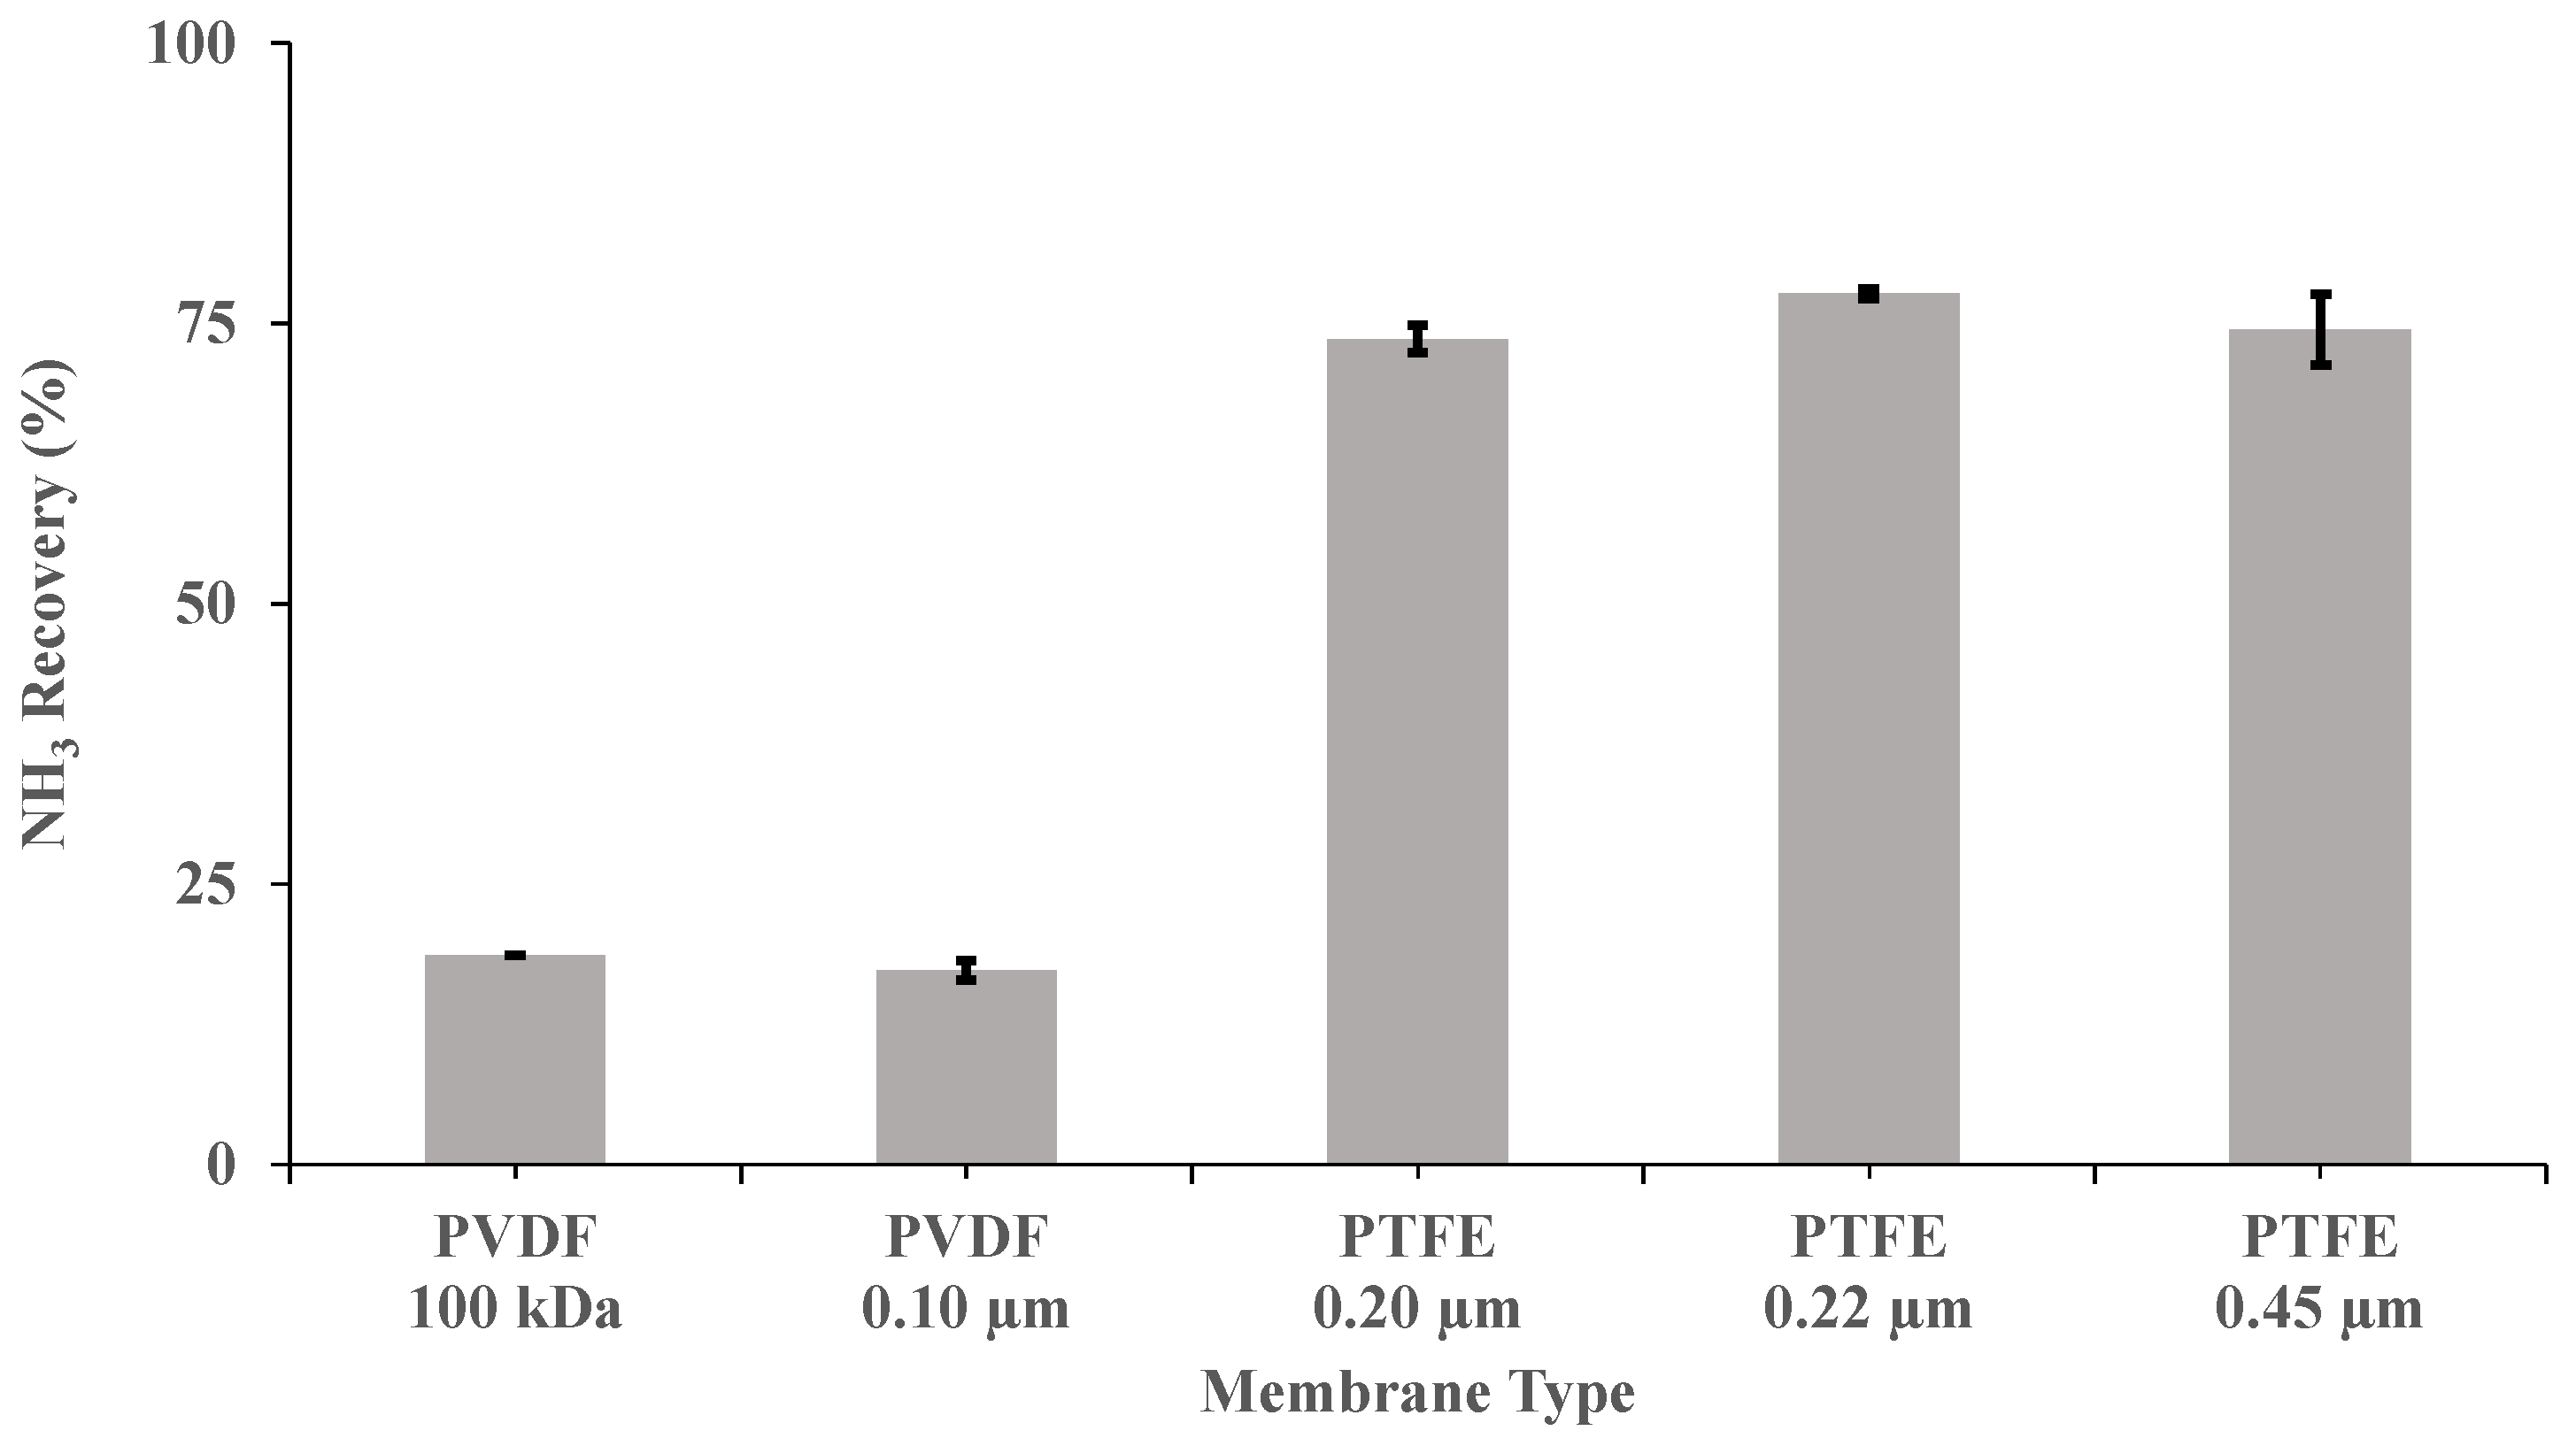
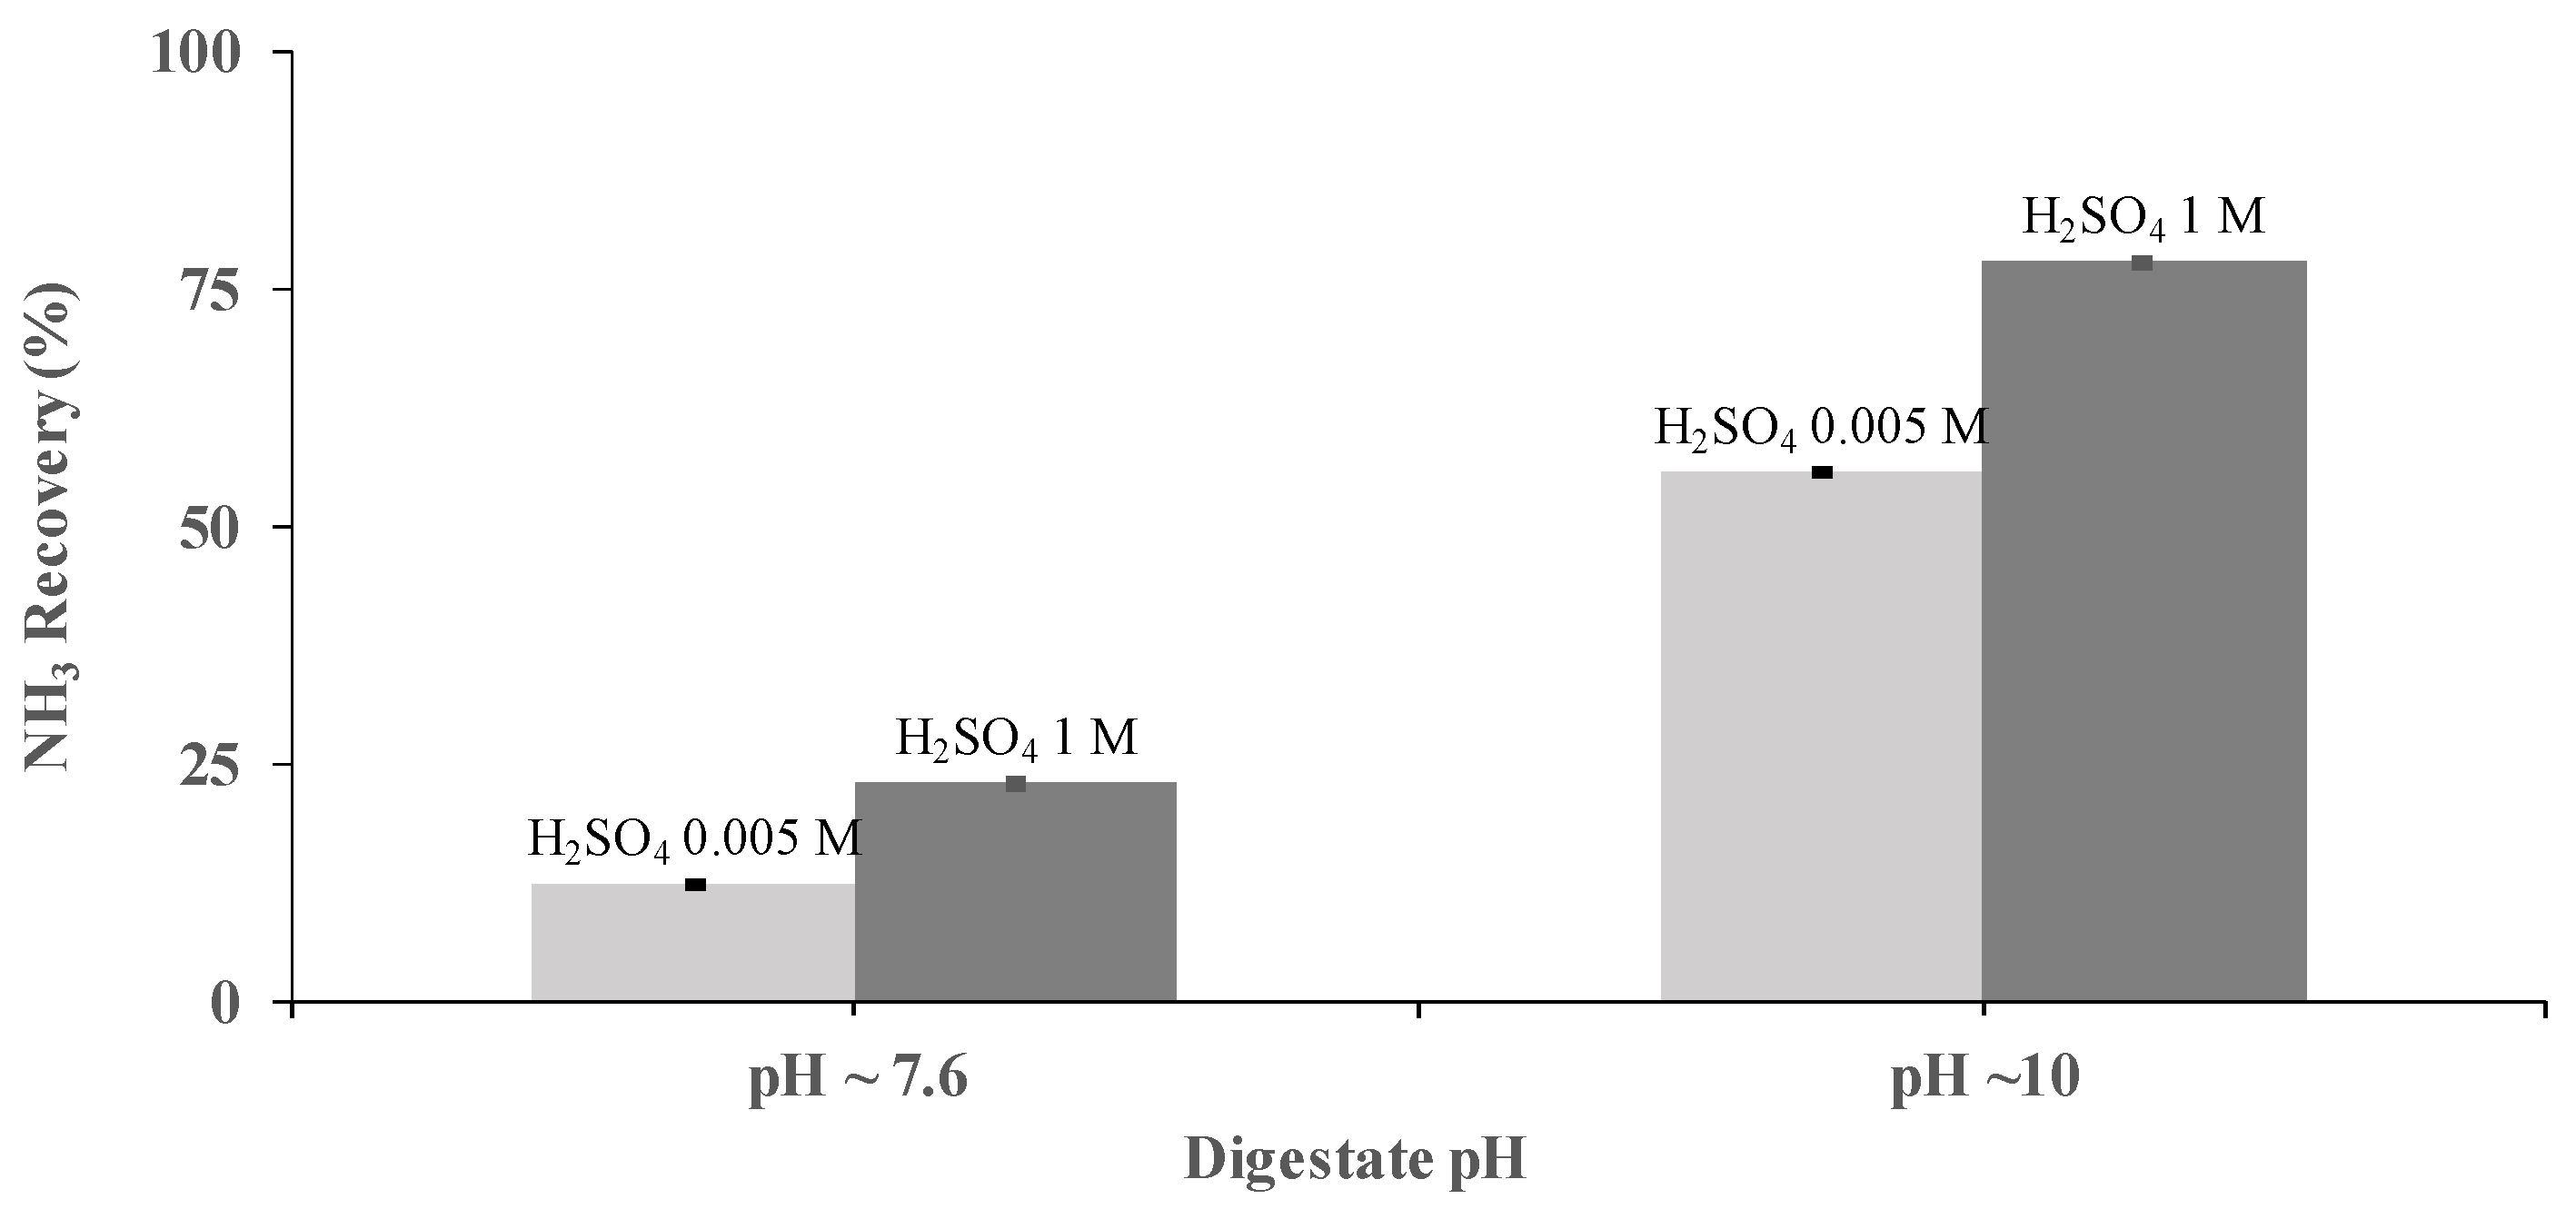
3.1. Influence of Membrane Material, pH and H2SO4 Concentration

Five flat sheet membranes (Table 1) were investigated at a recirculation flow rate of 0.030 m3 h−1, a pH of 10 and a concentration of H2SO4 of 1 M, to elucidate the optimum material, pore size and wettability for NH3 recovery from a synthetic digestate. PTFE membranes exhibited a superior performance to PVDF membranes in terms of NH3 recovery at a pH of 10 (Figure 2). In this case, the highest NH3 removal recovery after 3.5 h (77.7% ± 0.4%) was provided by PTFE-0.22. This removal efficiency was 3.6-fold higher than those obtained for the two PVDF membranes tested. As shown in Table 1, PTFE-0.22 has a contact angle (θ) of 150 degrees [42], which corresponds to a rather hydrophobic surface [43]. In fact, a membrane with θ > 140° could be considered super-hydrophobic according to Tylkowski et al. [43]. The superior performance of the PTFE-0.22 membrane could be also explained by its asymmetric structure, as membranes with symmetric structures, with similar thickness, have been consistently shown to be less permeable [20]. Therefore, the following experiments were also conducted using PTFE-0.22 membranes.
The influence of the digestate pH was also studied. This parameter determines NH3 mass transfer as it shifts the equilibrium NH 4 +   NH 3   + H + . In our study, higher ammonia recoveries were achieved by increasing the pH of the synthetic digestate because of the increase in the NH3 concentration gradient (Figure S1 in the Supplementary material). Nevertheless, an increase in the pH of the digestate above 10 does not entail large improvement in the ammonia removal [20]. Operating the process at a pH of 11 with a PTFE-0.22 membrane, a recirculation flow rate of 0.030 m3 h−1 and a concentration of H2SO4 of 1 M, resulted in a NH3 recovery of 82.8% ± 0.4%, only 10% higher than the recoveries recorded at a pH of 10. NH3 recovery was lower in real digestate than in synthetic digestate using a PTFE-0.22 membrane at pHs of 10 and 7.6, the latter pH supporting lower NH3 recoveries (Figure S1 in the Supplementary material). Thus, the times needed to reach 95% NH3 recovery significantly increased by a factor of 6.5 and 2.3 in SD and RD, respectively, when digestate pH was increased from 7.6 to 10 (Table 2).
H2SO4 concentration was identified, also, as a key operational parameter for NH3 recovery. The performance of a PTFE-0.22 membrane at two concentrations of H2SO4 (0.005 and 1 M) was studied at pHs of 7.6 and 10, under a flow rate of 0.030 m3 h−1 using synthetic digestate. Acid concentrations of 0.005 M resulted in NH3 recoveries of 12.2% ± 0.2% and 55.5% ± 0.1% at a pH of 7.6 and 10, respectively, after 3.5 h of operation at the same flow rate. Similarly, under the same conditions, NH3 recoveries of 22.9% ± 0.4% and 77.7% ± 0.4% were achieved using H2SO4 concentrations of 1 M (Figure 3). Therefore, it was concluded that the best operating conditions correspond to a pH of 10 and H2SO4 concentrations of 1 M.

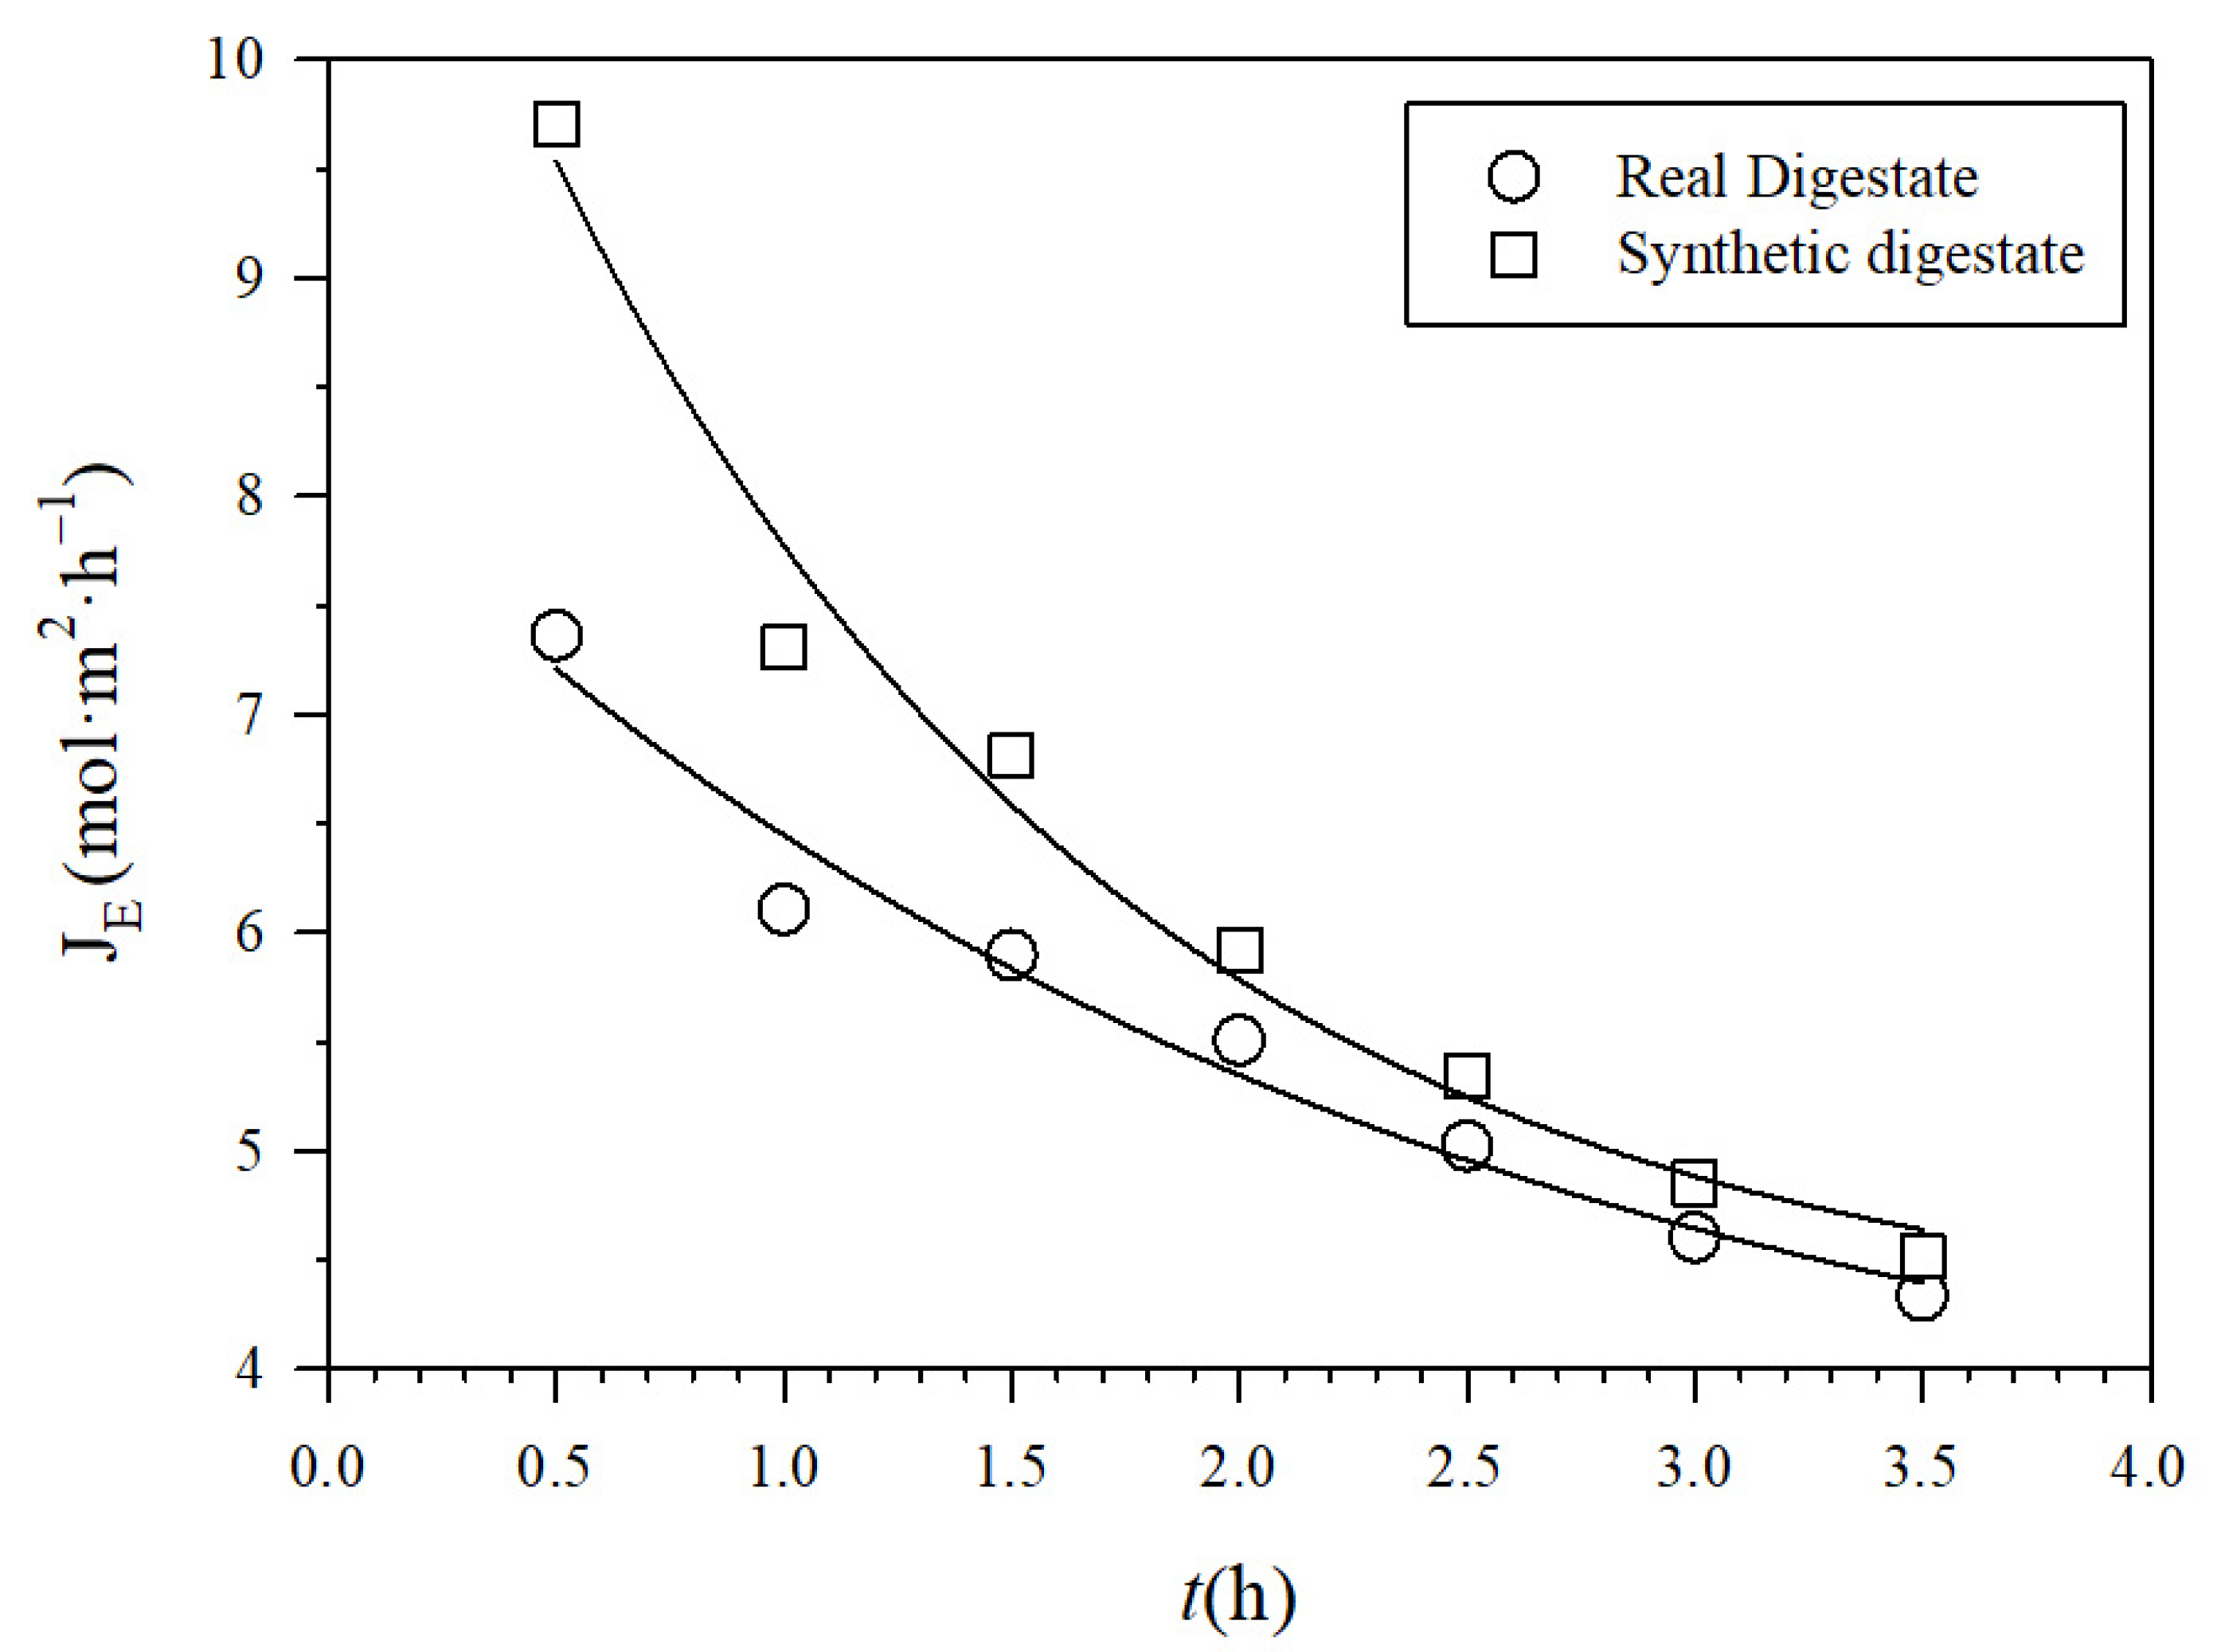
3.2. Influence of the Digestate Recirculation Flow Rate

Ammonia removal efficiencies of 84.6% ± 1.0% were achieved using the PTFE-0.22 membrane after 3.5 h of experiment in synthetic digestate, which were higher than the removal efficiencies in real digestate (71.6% ± 0.3%), at 0.045 m3 h−1 and a pH of 10. The lower NH3 recoveries in real digestate were likely due to membrane fouling. This fouling affected the NH3 permeate flux mainly due to adsorption of colloids, or solutes including ammonia, within the membrane pores, with a subsequent reduction in mean pore sizes. According to Meng et al. [44], membrane fouling typically causes cake layer formation, deposition of sludge flocs and their deposition on the membrane. The influence of the velocity of the acid solution was not herein assessed as previous literature has consistently shown that the velocity of the acid solutions does not impact significantly on NH3 mass transfer [20,31].
The increase in the digestate recirculation flow rate brought about a rise in the pace of the NH3 recovery across the PTFE-0.22 membrane regardless of the type of digestate (real or synthetic). Figure S2a,b (in Supplementary Material) show the exponential decrease of the ammonia concentration, which resulted in a rapid increase of NH3 recovery (Equation (7)). In Figure 4a, the corresponding rate of concentration decrease and recovery increase α, is shown as a function of the recirculation flow rate of SD and RD (Equation (8)). The value of α was higher for the synthetic digestate, while the increase in digestate recirculation flow rate was positively correlated with NH3 recovery rate regardless of the type of digestate. Figure 4b shows the evolution of the time needed to reach 95% recovery (Equation (9)). This time is higher for the real digestate than for the synthetic one. It is worth noting that an increase of the recirculation flow of the digestate from 0.007 to 0.045 m3 h−1 brought about a substantial decrease of the time needed to reach 95% recovery of NH3. In all cases, a pH of 10 was maintained. The duration of the experiment conducted at a liquid recirculation rate of 0.03 m3 h−1 was extended to 6 h, in order to check how a longer time improved recovery. This experiment resulted in a final NH3 recovery of 94.3% ± 0.3% in synthetic digestate in accordance with Figure 4b. Therefore, we concluded that over long time intervals, the evolution of recovery follows the pace assumed here.
The NH3 fluxes across the PTFE-0.22 membrane in both SD and RD are shown in Figure 5. They decreased as the recirculation flow rate increased because of fouling, probably induced by shear. In addition, NH3 fluxes were slightly higher in SD than in RD according to its lower induction of membrane fouling. By fitting theoretical to experimental fluxes and using Equations (2)–(6), the corresponding effective pore diameters were evaluated at the end of each experiment, as a function of the recirculation flow Q, which was 0.25 µm.
The experimental NH3 fluxes herein obtained with flat plate membranes were comparable to, but clearly higher than, those reported in the literature when using similar pHs with hollow fibre or tubular membranes (Table 3).
In contrast, the overall mass transfer coefficient increased at increasing digestate recirculation flow rates. An analysis of the relative importance of the membrane mass transfer coefficient km, and that on the digestate side ks, compared to the overall mass transfer coefficient kov, show that the largest restriction to mass transfer occurred on the digestate side of the membrane, while through the pores, there was a very high NH3 mass transfer. NH3 mass transfer through the pores decreased steeply when the recirculation flow rate was increased, but with a concomitant increase of the mass transfer on the digestate side of the membrane. Values of Table 4 correspond to synthetic digestate.

3.3. Pore Size

The characteristics of the PTFE-0.22 membrane were studied by air displacement porometry after the operation of the process under different experimental conditions (pH of 10, concentration of H2SO4 1 M, recirculation flow rates 0.007, 0.015, 0.030 and 0.045 m3 h−1) using both synthetic digestate and real digestate. The increase in membrane fouling reduced the pore diameter, as a result of deposits that partially or totally blocked the membrane pores (Table 5) [47]. A higher reduction in pore diameter was observed when the PTFE-0.22 membrane was exposed to longer periods of filtration, lower recirculation rates and real digestate from Valladolid WWTP. Interestingly, the mean pore size was similar in the new membrane and in the membranes used twice with recirculation flow rates of 0.045 m3 h−1 (0.3548 µm ± 0.0004 and 0.3521 µm ± 0.0004, respectively). This behaviour is in accordance with more specific fouling studies for PTFE in literature [48,49].

3.4. Membrane Morphology Analysis

Figure 6a shows three-dimensional AFM pictures of PTFE-0.22 membranes that were unused or used under multiple operational conditions. More fouling was detected on the surfaces of the membrane operated with real digestate at three recirculation flow rates. The membranes operated with real digestate at the highest circulation flow rate presented a surface fouling level in agreement with the pore size results (Table 4). The unused membrane has a topography with higher roughness than for the used membranes, in accordance with Zhang et al. [50].
In addition, the AFM topographic images of the support layer had a very similar appearance in all membranes tested, which suggested that the use of H2SO4 solutions did not significantly deteriorate the membrane surface (Figure 6b).
In addition, phase contrast images were obtained to detect the presence of materials coating the membrane surface (Figure S3 in Supplementary Material). The deeper brown tones detected in the membrane, used with real digestate and at three recirculation flow rates, would correspond to organic matter from the real digestate. Fouling was not significant in the rest of the samples and the coating effect was more homogeneous.

4. Conclusions

The feasibility of several commercial flat sheet membranes for ammonia recovery and their fouling were studied using synthetic and real digestate. PTFE was identified as the most efficient material for NH3 recovery regardless of the type of digestate. The highest NH3 recovery was obtained when the pH of the digestate was increased to 10 and 1 M sulfuric acid was used. NH3 recovery also increased at higher digestate circulation flow rates because of the inherent reduction in mass transfer resistance. NH3 recovery was shown to follow first order kinetics and to be faster under alkaline pH, high H2SO4 concentration and high recirculation flow rate on the digestate side of the membrane. A PTFE-0.22 membrane operated under optimal conditions supported NH3 recoveries of 71.6% ± 0.3% and 84.6% ± 1.0% after only 3.5 h using real and synthetic digestates, respectively. After 6 h of operation, 94.3% ± 0.3% NH3 recoveries were reached in synthetic digestate under similar operational conditions in accordance with the kinetics assumed here. Membrane fouling was relevant when using real digestate and resulted in a decrease in membrane pore diameter and growing surface deposition.

Supplementary Materials

The following are available online at https://www.mdpi.com/article/10.3390/membranes12010019/s1, Figure S1: Influence of the pH in (a) SD and (b) RD on the time course of NH3 concentration in the feed side of the PTFE-0.22 membrane operated with a concentration of H2SO4 of 1 M and a recirculation flow rate of 0.030 m3 h−1. Figure S2: Time course of ammonia recovery using a PTFE-0.22 membrane at different recirculation flow rates, a pH of 10, a concentration of H2SO4 of 1 M in (a) synthetic digestate and (b) real digestate. Figure S3: AFM Phase Imaging of the active layer for a PTFE 0.22 membrane under different conditions (scanned area 10 µm × 10 µm).

Author Contributions

Conceptualization, L.P., P.P., A.H., R.M.; methodology, P.P. and R.M.; validation, L.P., P.P., A.H., R.M.; formal analysis, L.P., P.P., A.H., R.M.; investigation, F.R.; resources, L.P. and R.M.; data curation, L.P., P.P., A.H., R.M.; writing—original draft preparation, F.R.; writing—review and editing, L.P., P.P., A.H., R.M.; visualization, L.P., P.P., A.H., R.M.; supervision, L.P., P.P., A.H., R.M.; project administration, L.P. and R.M.; funding acquisition, L.P. and R.M. All authors have read and agreed to the published version of the manuscript.

Funding

This research was funded by the Regional Government of Castilla y León and the European FEDER Program (VA088G19, CLU 2017-09 and UIC 071) and the Spanish Ministry of Science and Innovation (project: PID2019-109403RB-C21/AEI/10.13039/501100011033).

Institutional Review Board Statement

Not applicable.

Informed Consent Statement

Not applicable.

Data Availability Statement

Not applicable.

Acknowledgments

This work was supported by the Regional Government of Castilla y León and the European FEDER Program (VA088G19, CLU 2017-09 and UIC 071) and the Spanish Ministry of Science and Innovation (project: PID2019-109403RB-C21/AEI/10.13039/501100011033). F. Rivera thanks University of Valladolid for the PhD Contract.

Conflicts of Interest

The authors declare no conflict of interest.

References

  1. Forster, C.F. Biotechnology and Wastewater Treatment; University of Cambridge: Cambridge, UK, 1985. [Google Scholar]
  2. Tonelli, A.R.; Pham, A. Bronchiectasis, a long-term sequela of ammonia inhalation: A case report and review of the literature. Burns 2009, 35, 451–453. [Google Scholar] [CrossRef] [PubMed]
  3. De La Hoz, R.E.; Schlueter, D.P.; Rom, W.N. Chronic lung disease secondary to ammonia inhalation injury: A report on three cases. Am. J. Ind. Med. 1996, 29, 209–214. [Google Scholar] [CrossRef]
  4. Brautbar, N.; Wu, M.P.; Richter, E.D. Chronic ammonia inhalation and interstitial pulmonary fibrosis: A Case report and review of the literature. Arch. Environ. Health 2003, 58, 592–596. [Google Scholar] [CrossRef] [PubMed]
  5. Ni, H.; Fan, X.M.; Guo, H.N.; Liang, J.H.; Li, Q.R.; Yang, L.; Li, H.; Li, H.H. Comprehensive utilization of activated sludge for the preparation of hydrolytic enzymes, polyhydroxyalkanoates, and water-retaining organic fertilizer. Prep. Biochem. Biotechnol. 2017, 47, 611–618. [Google Scholar] [CrossRef]
  6. Hermassi, M.; Valderrama, C.; Dosta, J.; Cortina, J.L.; Batis, N.H. Evaluation of hydroxyapatite crystallization in a batch reactor for the valorization of alkaline phosphate concentrates from wastewater treatment plants using calcium chloride. Chem. Eng. J. 2015, 267, 142–152. [Google Scholar] [CrossRef] [Green Version]
  7. Sutton, P.M.; Rittmann, B.E.; Schraa, O.J.; Banaszak, J.E.; Togna, A.P. Wastewater as a resource: A unique approach to achieving energy sustainability. Water Sci. Technol. 2011, 63, 2004–2009. [Google Scholar] [CrossRef] [PubMed]
  8. Licon Bernal, E.E.; Maya, C.; Valderrama, C.; Cortina, J.L. Valorization of ammonia concentrates from treated urban wastewater using liquid-liquid membrane contactors. Chem. Eng. J. 2016, 302, 641–649. [Google Scholar] [CrossRef]
  9. Zheng, Y.; Wang, A. Evaluation of ammonium removal using a chitosan-g-poly (acrylic acid)/rectorite hydrogel composite. J. Hazard. Mater. 2009, 171, 671–677. [Google Scholar] [CrossRef]
  10. Ozturk, I.; Altinbas, M.; Koyuncu, I.; Arikan, O.; Gomec-Yangin, C. Advanced physico-chemical treatment experiences on young municipal landfill leachates. Waste Manag. 2003, 23, 441–446. [Google Scholar] [CrossRef]
  11. Hung, C.M.; Lou, J.C.; Lin, C.H. Removal of ammonia solutions used in catalytic wet oxidation processes. Chemosphere 2003, 52, 989–995. [Google Scholar] [CrossRef]
  12. Jorgensen, T.C.; Weatherley, L.R. Ammonia removal from wastewater by ion exchange in the presence of organic contaminants. Water Res. 2003, 37, 1723–1728. [Google Scholar] [CrossRef]
  13. Provolo, G.; Perazzolo, F.; Mattachini, G.; Finzi, A.; Naldi, E.; Riva, E. Nitrogen removal from digested slurries using a simplified ammonia stripping technique. Waste Manag. 2017, 69, 154–161. [Google Scholar] [CrossRef]
  14. Wang, G.; Xu, X.; Zhou, L.; Wang, C.; Yang, F. A pilot-scale study on the start-up of partial nitrification-anammox process for anaerobic sludge digester liquor treatment. Bioresour. Technol. 2017, 241, 181–189. [Google Scholar] [CrossRef]
  15. Gonzalez-Martinez, A.; Poyatos, J.M.; Hontoria, E.; Gonzalez-Lopez, J.; Osorio, F. Treatment of Effluents Polluted by Nitrogen with New Biological Technologies Based on Autotrophic Nitrification-Denitrification Processes. Recent Pat. Biotechnol. 2011, 5, 74–84. [Google Scholar] [CrossRef] [PubMed]
  16. Tchobanoglous, G.; Burton, F.L. Wastewater Engineering Treatment, Disposal and Reuse; McGraw-Hill Inc.: New York, NY, USA, 1991. [Google Scholar]
  17. Vineyard, D.; Hicks, A.; Karthikeyan, K.G.; Barak, P. Economic analysis of electrodialysis, denitrification, and anammox for nitrogen removal in municipal wastewater treatment. J. Clean. Prod. 2020, 262, 121145. [Google Scholar] [CrossRef]
  18. Rothausen, S.G.S.A.; Conway, D. Greenhouse-gas emissions from energy use in the water sector. Nat. Clim. Chang. 2011, 1, 210–219. [Google Scholar] [CrossRef]
  19. Hall, M.R.; West, J.; Sherman, B.; Lane, J.; De Haas, D. Long-term trends and opportunities for managing regional water supply and wastewater greenhouse gas emissions. Environ. Sci. Technol. 2011, 45, 5434–5440. [Google Scholar] [CrossRef]
  20. Tan, X.; Tan, S.P.; Teo, W.K.; Li, K. Polyvinylidene fluoride (PVDF) hollow fibre membranes for ammonia removal from water. J. Membr. Sci. 2006, 271, 59–68. [Google Scholar] [CrossRef]
  21. Hasanoĝlu, A.; Romero, J.; Pérez, B.; Plaza, A. Ammonia removal from wastewater streams through membrane contactors: Experimental and theoretical analysis of operation parameters and configuration. Chem. Eng. J. 2010, 160, 530–537. [Google Scholar] [CrossRef]
  22. Norddahl, B.; Horn, V.G.; Larsson, M.; du Preez, J.H.; Christensen, K. A membrane contactor for ammonia stripping, pilot scale experience and modeling. Desalination 2006, 199, 172–174. [Google Scholar] [CrossRef]
  23. Brennan, B.; Briciu-Burghina, C.; Hickey, S.; Abadie, T.; Al Ma Awali, S.M.; Delaure, Y.; Durkan, J.; Holland, L.; Quilty, B.; Tajparast, M.; et al. Pilot scale study: First demonstration of hydrophobic membranes for the removal of ammonia molecules from rendering condensate wastewater. Int. J. Mol. Sci. 2020, 21, 3914. [Google Scholar] [CrossRef]
  24. Yeon, S.H.; Sea, B.; Park, Y.I.; Lee, K.H. Determination of mass transfer rates in PVDF and PTFE hollow fiber membranes for CO2 absorption. Sep. Sci. Technol. 2003, 38, 271–293. [Google Scholar] [CrossRef]
  25. Malek, A.; Li, K.; Teo, W.K. Modeling of Microporous Hollow Fiber Membrane Modules Operated under Partially Wetted Conditions. Ind. Eng. Chem. Res. 1997, 36, 784–793. [Google Scholar] [CrossRef]
  26. Mahmud, H.; Kumar, A.; Narbaitz, R.M.; Matsuura, T. A study of mass transfer in the membrane air-stripping process using microporous polypropylene hollow fibers. J. Membr. Sci. 2000, 179, 29–41. [Google Scholar] [CrossRef] [Green Version]
  27. Vecino, X.; Reig, M.; Bhushan, B.; Gibert, O.; Valderrama, C.; Cortina, J.L. Liquid fertilizer production by ammonia recovery from treated ammonia-rich regenerated streams using liquid-liquid membrane contactors. Chem. Eng. J. 2019, 360, 890–899. [Google Scholar] [CrossRef]
  28. Sheikh, M.; Reig, M.; Vecino, X.; Lopez, J.; Rezakazemi, M.; Valderrama, C.A.; Cortina, J.L. Liquid–Liquid membrane contactors incorporating surface skin asymmetric hollow fibres of poly(4-methyl-1-pentene) for ammonium recovery as liquid fertilisers. Sep. Purif. Technol. 2022, 283, 120212. [Google Scholar] [CrossRef]
  29. Vecino, X.; Reig, M.; Gibert, O.; Valderrama, C.; Cortina, J.L. Integration of liquid-liquid membrane contactors and electrodialysis for ammonium recovery and concentration as a liquid fertilizer. Chemosphere 2020, 245, 125606. [Google Scholar] [CrossRef]
  30. Carter, D.; Rose, L.; Awobusuyi, T.; Gauthier, M.; Tezel, F.H.; Kruczek, B. Characterization of commercial RO membranes for the concentration of ammonia converted to ammonium sulfate from anaerobic digesters. Desalination 2015, 368, 127–134. [Google Scholar] [CrossRef]
  31. Darestani, M.; Haigh, V.; Couperthwaite, S.J.; Millar, G.J.; Nghiem, L.D. Hollow fibre membrane contactors for ammonia recovery: Current status and future developments. J. Environ. Chem. Eng. 2017, 5, 1349–1359. [Google Scholar] [CrossRef] [Green Version]
  32. Damtie, M.M.; Volpin, F.; Yao, M.; Tijing, L.D.; Hailemariam, R.H.; Bao, T.; Park, K.; Shon, H.K.; Choi, J. Ammonia recovery from human urine as liquid fertilizers in hollow fiber membrane contactor: Effects of permeate chemistry. Environ. Eng. Res. 2021, 26, 190523. [Google Scholar] [CrossRef]
  33. Li, L.; Lollar, B.S.; Li, H.; Wortmann, U.G.; Lacrampe-Couloume, G. Ammonium stability and nitrogen isotope fractionations for NH4+-NH 3(aq)-NH 3(gas) systems at 20–70 °C and pH of 2-13: Applications to habitability and nitrogen cycling in low-temperature hydrothermal systems. Geochim. Cosmochim. Acta 2012, 84, 280–296. [Google Scholar] [CrossRef]
  34. Torres-Franco, A.F.; Zuluaga, M.; Hernández-Roldán, D.; Leroy-Freitas, D.; Sepúlveda-Muñoz, C.A.; Blanco, S.; Mota, C.R.; Muñoz, R. Assessment of the Performance of an Anoxic aerobic Microalgal-bacterial System Treating High-strength wastewater. Chemosphere 2021, 270, 129437. [Google Scholar] [CrossRef]
  35. Montalvillo, M.; Silva, V.; Palacio, L.; Calvo, J.I.; Carmona, F.J.; Hernández, A.; Prádanos, P. Charge and dielectric characterization of nanofiltration membranes by impedance spectroscopy. J. Membr. Sci. 2014, 454, 163–173. [Google Scholar] [CrossRef]
  36. Hernández, A.; Calvo, J.I.; Prádanos, P.; Tejerina, F. Pore size distributions in microporous membranes. A critical analysis of the bubble point extended method. J. Membr. Sci. 1996, 112, 1–12. [Google Scholar] [CrossRef]
  37. Amaral, M.C.; Magalhães, N.C.; Moravia, W.G.; Ferreira, C.D. Ammonia recovery from landfill leachate using hydrophobic membrane contactors. Water Sci. Technol. 2016, 74, 2177–2184. [Google Scholar] [CrossRef] [PubMed] [Green Version]
  38. Gabelman, A.; Hwang, S.T. Hollow fiber membrane contactors. J. Membr. Sci. 1999, 159, 61–106. [Google Scholar] [CrossRef]
  39. Guo, J.; Lee, J.G.; Tan, T.; Yeo, J.; Wong, P.W.; Ghaffour, N.; An, A.K. Enhanced ammonia recovery from wastewater by Nafion membrane with highly porous honeycomb nanostructure and its mechanism in membrane distillation. J. Membr. Sci. 2019, 590, 117265. [Google Scholar] [CrossRef]
  40. Zhu, Z.; Hao, Z.; Shen, Z.; Chen, J. Modified modeling of the effect of pH and viscosity on the mass transfer in hydrophobic hollow fiber membrane contactors. J. Membr. Sci. 2005, 250, 269–276. [Google Scholar] [CrossRef]
  41. Tun, L.L.; Jeong, D.; Jeong, S.; Cho, K.; Lee, S.; Bae, H. Dewatering of source-separated human urine for nitrogen recovery by membrane distillation. J. Membr. Sci. 2016, 512, 13–20. [Google Scholar] [CrossRef]
  42. Cabrerizo, M.A. Bubble and Drop Interfaces: Selected Papers from International Workshop on Bubble and Drop Interfaces; Elsevier: Amsterdam, The Netherlands, 2008. [Google Scholar]
  43. Tylkowski, B.; Tsibranska, I. Overview of main techniques used for membrane characterization. J. Chem. Technol. Metall. 2015, 50, 3–12. [Google Scholar]
  44. Meng, F.; Chae, S.R.; Drews, A.; Kraume, M.; Shin, H.S.; Yang, F. Recent advances in membrane bioreactors (MBRs): Membrane fouling and membrane material. Water Res. 2009, 43, 1489–1512. [Google Scholar] [CrossRef] [PubMed]
  45. Dube, P.J.; Vanotti, M.B.; Szogi, A.A.; García-González, M.C. Enhancing recovery of ammonia from swine manure anaerobic digester effluent using gas-permeable membrane technology. Waste Manag. 2016, 49, 372–377. [Google Scholar] [CrossRef] [PubMed] [Green Version]
  46. García-González, M.C.; Vanotti, M.B.; Szogi, A.A. Recovery of ammonia from swine manure using gas-permeable membranes: Effect of aeration. J. Environ. Manag. 2015, 152, 19–26. [Google Scholar] [CrossRef] [PubMed]
  47. Wu, H.; Kanora, A.; Schwartz, D.K. Fouling of microfiltration membranes by bidisperse particle solutions. J. Membr. Sci. 2022, 641, 119878. [Google Scholar] [CrossRef]
  48. Liu, C.; Chen, L.; Zhu, L. Fouling mechanism of hydrophobic polytetrafluoroethylene (PTFE) membrane by differently charged organics during direct contact membrane distillation (DCMD) process: An especial interest in the feed properties. J. Membr. Sci. 2018, 548, 125–135. [Google Scholar] [CrossRef]
  49. Zhang, B.; Huang, D.; Shen, Y.; Yin, W.; Gao, X.; Zhang, B.; Shi, W. Treatment of alkali/surfactant/polymer flooding oilfield wastewater with polytetrafluoroethylene microfiltration membrane: Performance and membrane fouling. J. Environ. Chem. Eng. 2020, 8, 104462. [Google Scholar] [CrossRef]
  50. Zhang, B.; Shi, W.; Yu, S.; Zhu, Y.; Zhang, R.; Li, L. Optimization of cleaning conditions on a polytetrafluoroethylene (PTFE) microfiltration membrane used in treatment of oil-field wastewater. RSC Adv. 2015, 5, 104960–104971. [Google Scholar] [CrossRef]
Figure 1. Schematic representation of the lab scale ammonia recovery system.
Membranes 12 00019 g001
Figure 2. Influence of the type of membrane on ammonia recovery, after 3.5 h, in SD with a recirculation flow rate of 0.030 m3 h−1, a pH of 10 and a concentration of H2SO4 of 1 M. Vertical bars represent the standard deviation obtained from duplicate measurements.
Membranes 12 00019 g002
Figure 3. Influence of the sulfuric acid concentration on NH3 recovery from SD at pHs of 7.6 and 10 and a flow rate of 0.030 m3 h−1 using the PTFE-0.22 membrane. Vertical bars (very short here) represent the standard deviation from replicate measurements.
Membranes 12 00019 g003
Figure 4. Influence of the recirculation flow rate on (a) α, and (b) the time to reach 95% NH3 recovery using a PTFE-0.22 membrane at different recirculation flow rates at a pH of 10 and a concentration of H2SO4 of 1M for both digestates.
Membranes 12 00019 g004
Figure 5. Experimental molar fluxes JE for recirculation rate 0.030 m3 h−1 for PTFE-0.22 at a pH of 10 and 1 M H2SO4.
Membranes 12 00019 g005
Figure 6. AFM 3D topographic images of the active layer (a) and 2D topographic images of the support layer (b) for the PTFE 0.22 µm membrane under different conditions (scanned area 10 µm × 10 µm). Legends correspond to the digestate, SD or RD, treated and the recirculation flow rates used successively.
Membranes 12 00019 g006
Table 1. Description of the flat sheet membranes studied.
MembraneMaterialPore SizeNominal
Thickness (µm)
Contact Angle (θ) Porosity
(%)
WettabilityManufacturer
PVDF-100PVDF100 kDa160130–135*hydrophobicKOCH
PVDF-0.10 PVDF0.10 µm130130–135*hydrophobicSterlitech
PTFE-0.20PTFE0.20 µm139142*hydrophobicPall Gelman
PTFE-0.22PTFE0.22 µm17515070hydrophobicMillipore
PTFE-0.45PTFE0.45 µm135155*hydrophobicPall Gelman
* Information not supplied by manufacturers.
Table 2. Time needed to reach 95% NH3 recovery for the PTFE-0.22 membrane operated with a concentration of H2SO4 of 1 M and a flow rate of 0.030 m3 h−1.
Digestate
SDRD
pHt (95%)/h
7.636.0316.88
105.497.31
Table 3. Summary of fluxes using hydrophobic membranes.
MatrixC0
(ppm)
pHT
(°C)
H2SO4
(mol L−1)
Flux
(mol m−2 h−1)
Membrane ConfigurationReference
Water containing NH34009–10400.30.11Hollow fibre (PP)[21]
Simulated wastewater1201025-0.18Hollow fibre (PVDF)[20]
Digested effluents155482510.06Hollow fibre (PP)[45]
Raw swine manure239092510.33Tubular (PE)[46]
Landfill
leachate
130010250.11.27Hollow fibre (PP)[37]
Synthetic Digestate679103514.52Flat sheet (PTFE)This work
Table 4. Calculated mass transfer coefficients for synthetic digestate.
Recirculation Rate (m3 h−1)kov a
(m h−1)
ks b/kov
(m h−1)
km c/kov
(m h−1)
0.0070.133.481.40
0.0150.155.911.20
0.0300.169.731.11
0.0450.1713.231.08
a Calculated from Equation (2). b Calculated from Equation (3) Daw = 1.26 × 10 −5 m2 h−1. c Calculated from Equation (4) Dij = 0.26 m2 h−1.
Table 5. Mean pore sizes of the PTFE-0.22 membrane under different operational conditions.
Type of DigestateRecirculation Rate
(m3 h−1)
Type of MembraneMean Pore Size
(µm)
NoneNoneNew membrane0.3548 ± 0.0004
SD0.045Used twice0.3521 ± 0.0004
SD0.007, 0.015, 0.030Used multiple times0.3443 ± 0.0004
RD0.045Used twice0.3347 ± 0.0003
RD0.007, 0.015, 0.030Used multiple times0.3228 ± 0.0002
Publisher’s Note: MDPI stays neutral with regard to jurisdictional claims in published maps and institutional affiliations.

