
Traditional Chinese Medicine Extract Properties Incorporated Energy Analysis for Membrane Concentration Processes


Abstract
:
1. Introduction
2. Materials and Methods
2.1. Preparation of Yu-Ping-Feng-San Solution
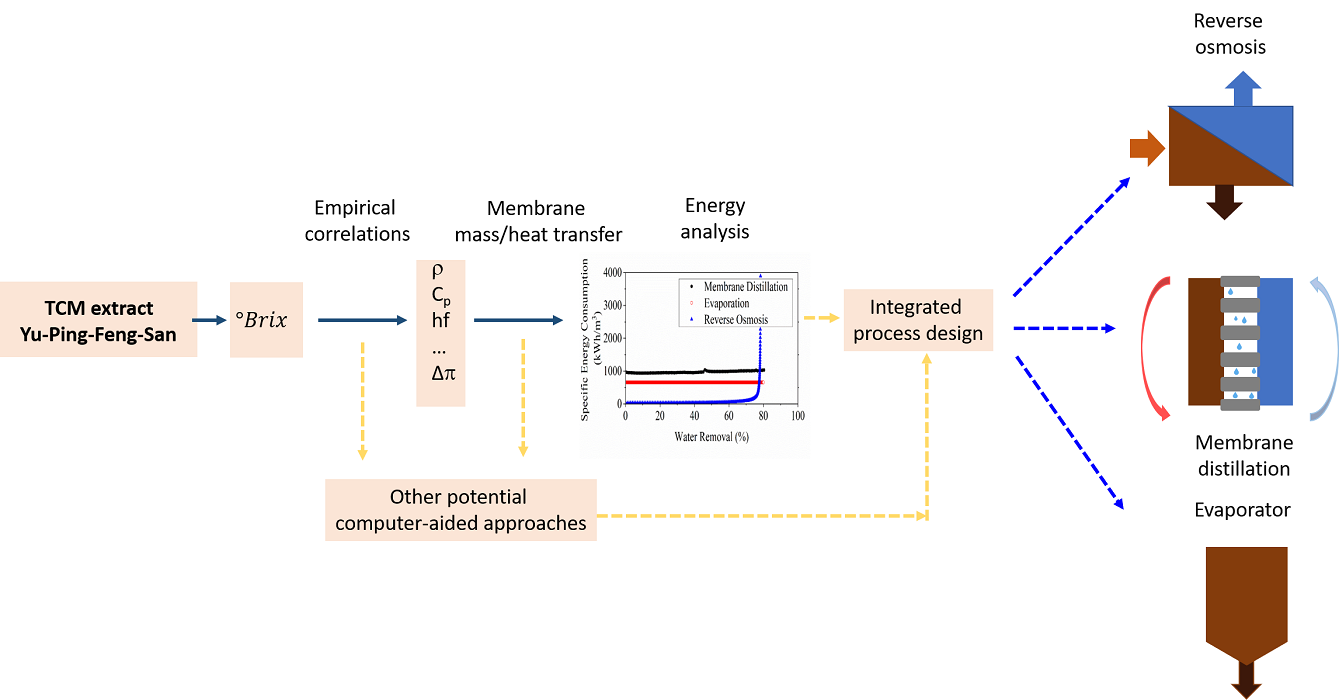
2.2. Reverse Osmosis Experiment
2.2.1. Materials
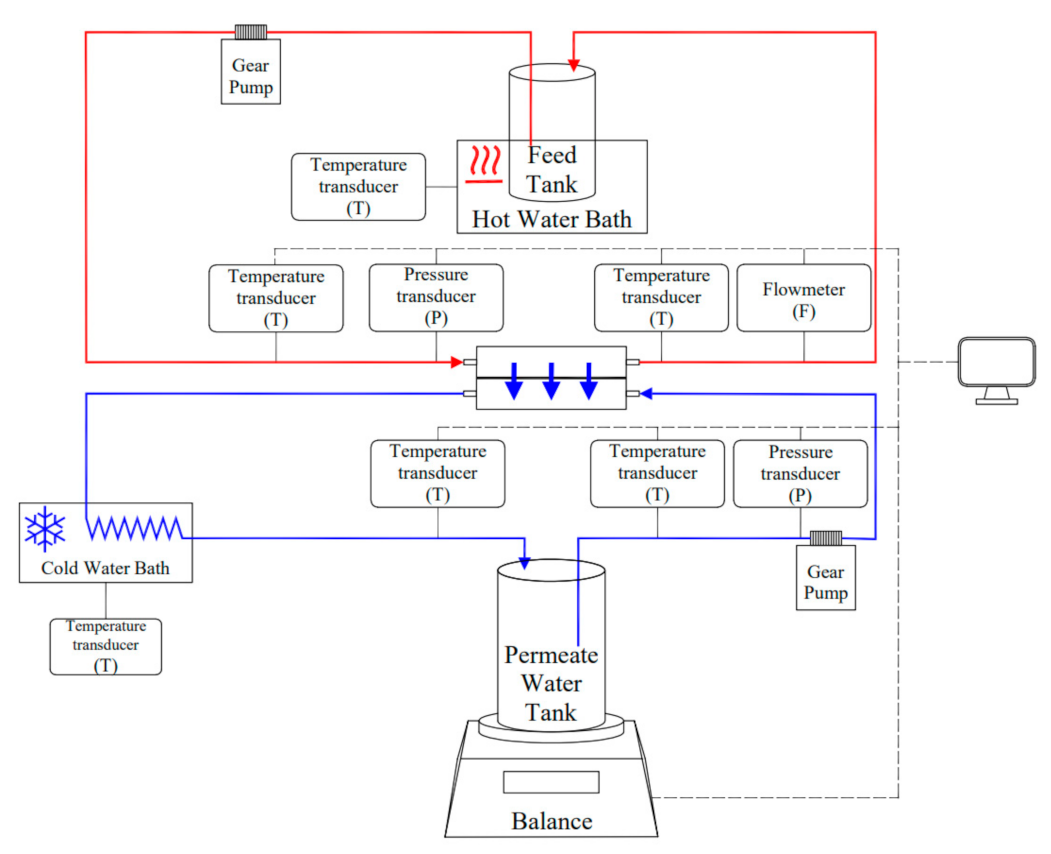
2.2.2. Experimental
2.3. Membrane Distillation Experiment
2.3.1. Materials
2.3.2. Experimental Protocol
2.4. Mathematical Model and Numerical Analysis of Energy Consumption
2.4.1. Energy Evaluation of RO Process
2.4.2. Energy Evaluation of MD Process
2.4.3. Saturated Vapor Pressure Correction Factor for YPFS Feed in MD Process
2.4.4. Energy Evaluation of Thermal Evaporation Process
3. Results and Discussion
3.1. Concentration Process of YPFS by RO
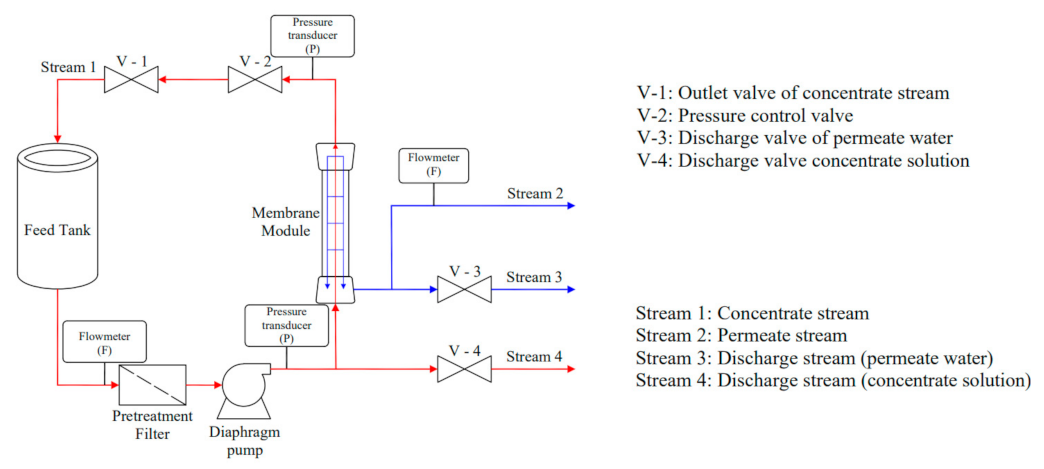
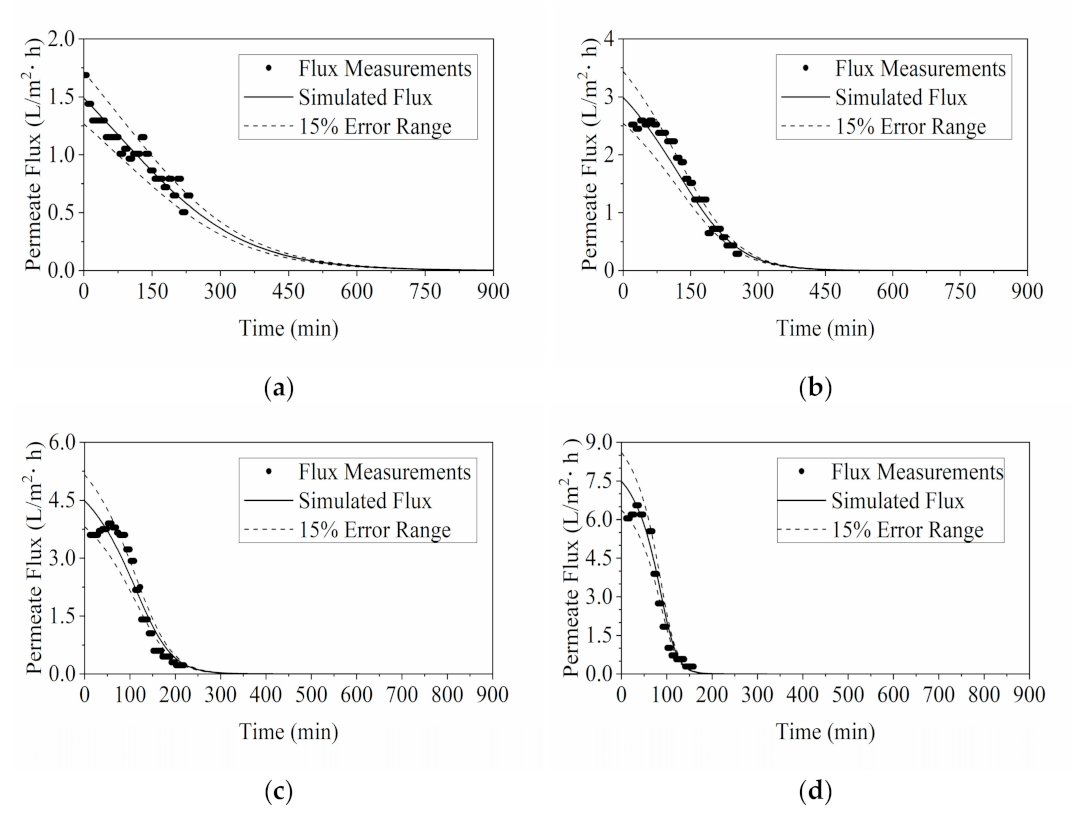
3.1.1. Model Validation by Flux and °Brix
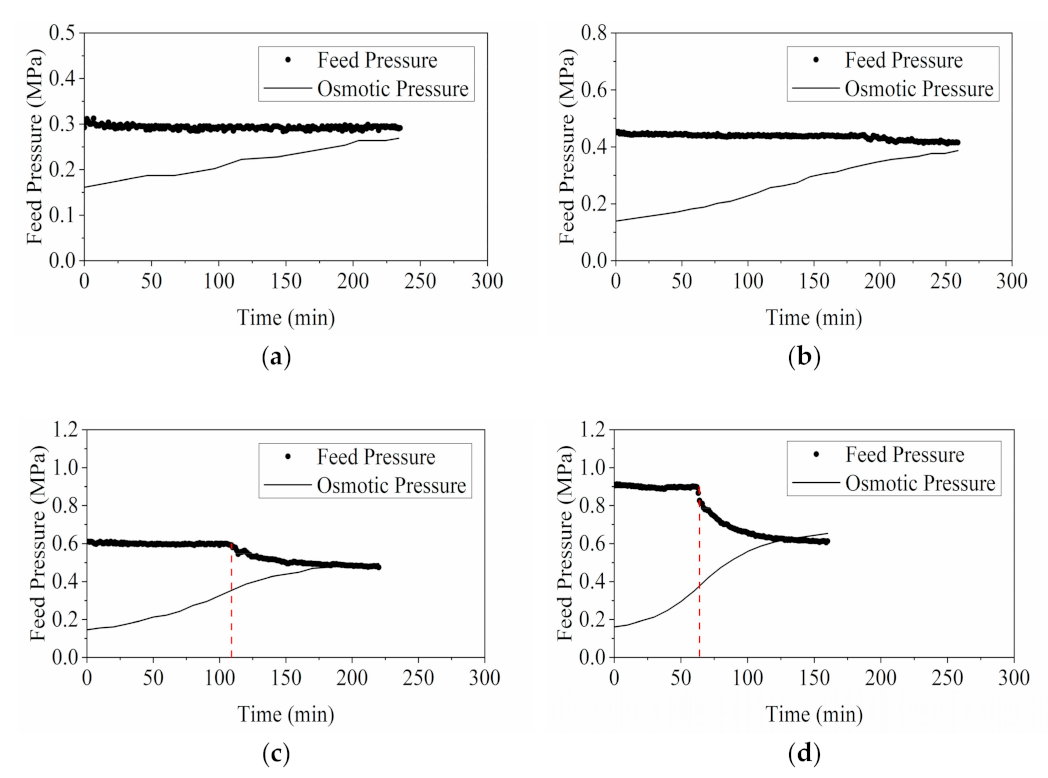
3.1.2. Comparison of Feed Pressure and Osmotic Pressure at Termination
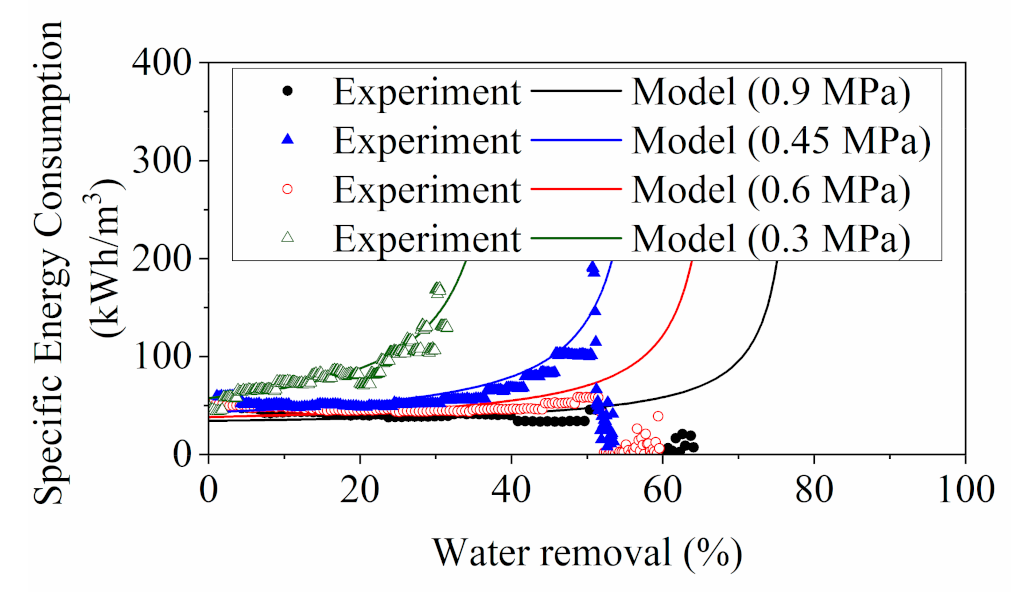
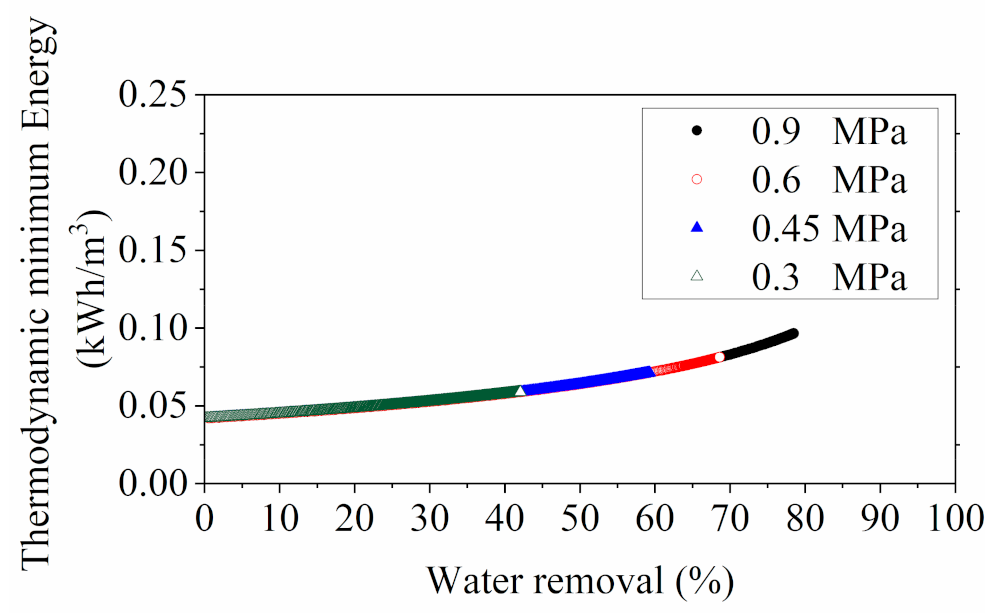
3.1.3. Energy Consumption Evaluation for RO
3.2. Concentration Process of YPFS by MD
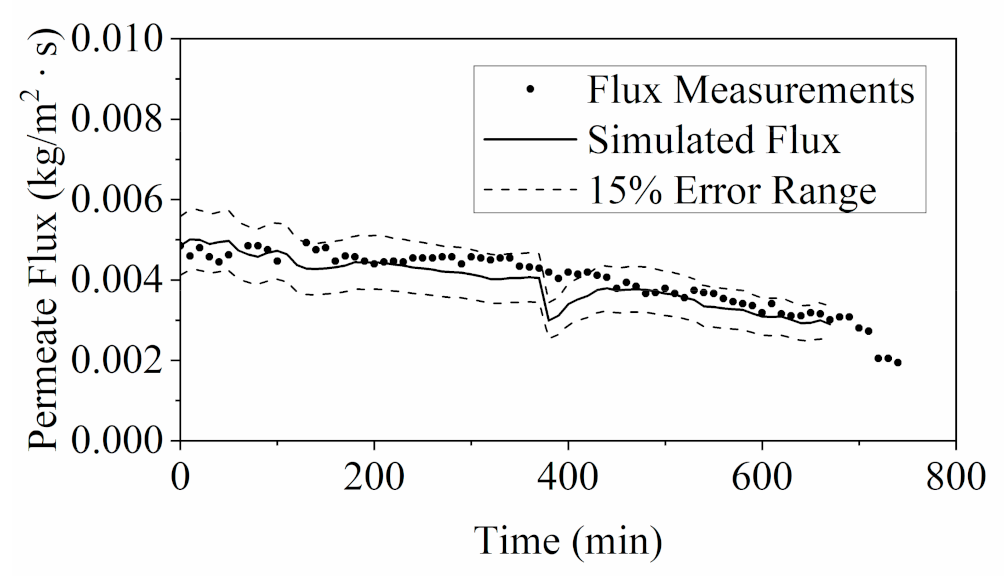
3.2.1. Model Validation by Flux
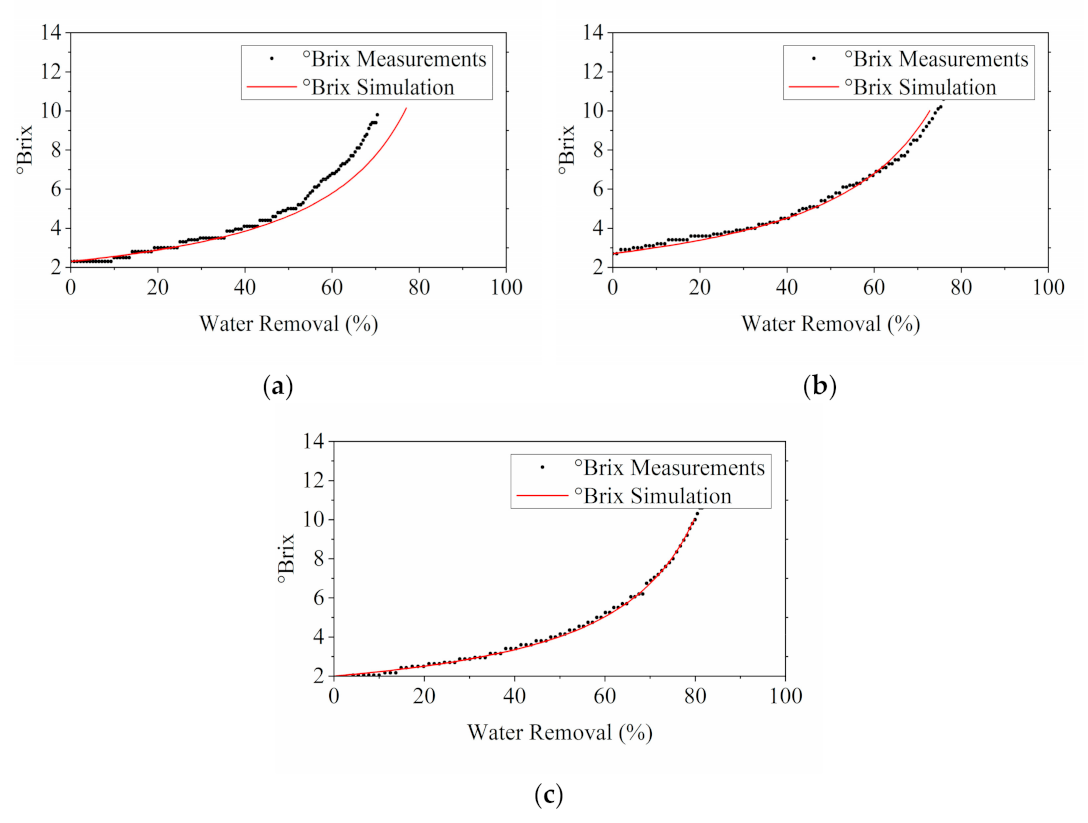
3.2.2. Impact of Water Removal on the °Brix
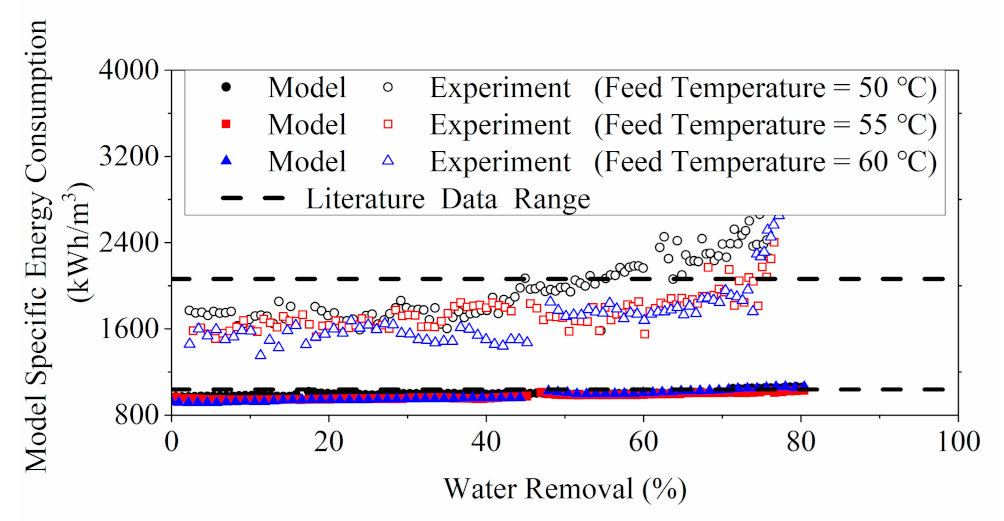
3.2.3. Energy Consumption Evaluation for MD
3.3. Numerical Evaluation of Energy Consumption for YPFS Concentration among RO, MD and Evaporation
4. Conclusions
- 1.
- Results generated from models developed in this study showed decent alignment with the experimentally acquired data;
- 2.
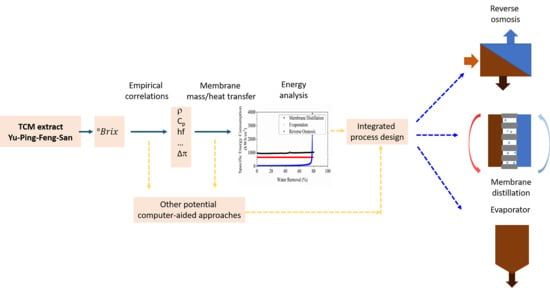
- The change in the properties of YPFS solution was characterized via the correlation with °Brix profile during concentration process. The changes in properties were integrated with the transport models. The approach proposed in this study can be easily modified and adapted for the concentration process of other natural plant extracts by membrane-based processes;
- 3.
- The model SEC was in close approximate to the experiment SEC for RO process at water removal rate of less than 50%. The SEC in this system in concentrating YPFS evaluated with higher values than the reported values in literature can largely be due to the low energy efficiency of a lab-scale module used in this work whereas Both the and were in close approximation to the reported SEC range for lab-scale DCMD system;
- 4.
- Severe foaming in the solution was observed during the concentration process by RO at high feed pressures. It may cause adverse effects on the driving force, particularly in the concentration of herbal extracts by RO processes;
- 5.
- A novel approach to estimate the saturated vapor pressure correction factor for herbal extract concentration was proposed, and the factor determined in YPFs solution was 0.95;
- 6.
- Insufficient heating resulted from the reduction of feed volume and retention time towards the later stage of concentration by MD process may cause a rapid decrease in flux and significant increase in dynamic SEC;
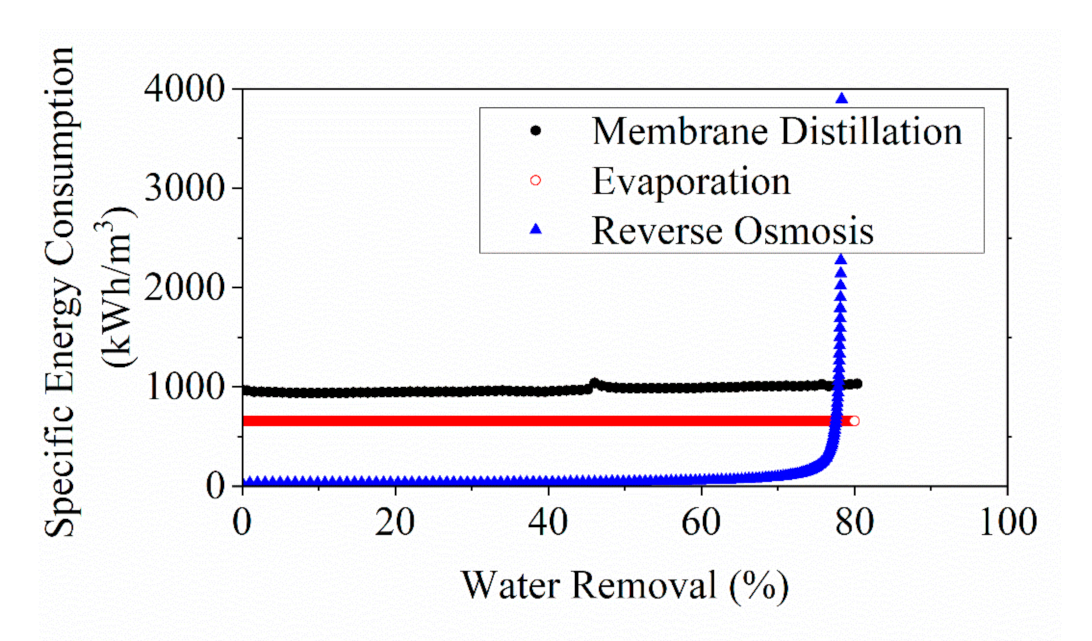
- 7.
- Evaluation via a cross-comparison among the three concecntration technologies confirmed that RO provided the best energy performance below a water removal of 77% in YPFS extract
Supplementary Materials
Author Contributions
Funding
Informed Consent Statement
Data Availability Statement
Acknowledgments
Conflicts of Interest
Nomenclature
| Abbreviations | |
| DCMD | Direct contact membrane distillation |
| MD | Membrane distillation |
| PP | Polypropylene |
| PTFE | Polytetrafluoroethylene |
| RO | Reverse osmosis |
| SEC | Specific energy consumption, |
| TCM | Traditional Chinese medicine |
| TFM | Thin film composite membrane |
| YPFS | Yu-Ping-Feng-San |
| Symbols | |
| Area, | |
| Membrane permeability, for RO and for MD | |
| Concentration indication, Brix | |
| Heat capacity, | |
| Hydraulic diameter, | |
| Membrane thickness, | |
| Energy, for RO process and for evaporation | |
| Concentration factor | |
| Thermal convection coefficient, | |
| Latent heat or Enthalpy, for MD process and for evaporation | |
| Permeate water flux, for RO process and for MD process | |
| Conduction coefficient, | |
| Characteristic length, | |
| Mass, | |
| Mass flowrate, | |
| Viscosity, | |
| Nusselt number | |
| Pressure, for RO process and for MD process | |
| Hydraulic pressure difference, | |
| Osmotic pressure difference, | |
| Prandtl number | |
| Heat transfer rate or heat consumption rate, | |
| Reynold’s number | |
| Steam flowrate, | |
| Temperature, | |
| Time, or | |
| Flow velocity, | |
| Volumetric flowrate, | |
| Volume, | |
| Power, | |
| Subscripts | |
| Start of the process | |
| Experimental results | |
| Feed | |
| Inlet | |
| Latent heat | |
| Extra water loss | |
| Membrane | |
| Membrane distillation | |
| Minimum | |
| Modelling results | |
| Outlet | |
| Permeate | |
| Pump | |
| Steam | |
| Saturated vapor | |
| Thermodynamic | |
| Water | |
References
- Yang, Y.; Islam, M.; Wang, J.; Li, Y.; Chen, X. Traditional Chinese Medicine in the Treatment of Patients Infected with 2019-New Coronavirus (SARS-CoV-2): A Review and Perspective. Int. J. Biol. Sci. 2020, 16, 1708–1717. [Google Scholar] [CrossRef] [PubMed]
- Guo, L.; Zhu, H. Chinese Mdeicine Pharmaceutical Separation Technology Based on Membrane Process: Fundamentals and Applications; Science Press: Beijing, China, 2019. [Google Scholar]
- Medina, B.G.; Garcia, A. Concentration of Orange Juice by Reverse Osmosis. J. Food Process Eng. 1988, 10, 217–230. [Google Scholar] [CrossRef]
- Alvarez, S.; Coca, J. Prediction of Flux and Aroma Compounds Rejection in a Reverse Osmosis Concentration of Apple Juice Model Solutions. Ind. Eng. Chem. Res. 2001, 40, 4925–4934. [Google Scholar] [CrossRef]
- Deshmukh, S.; Sapkal, V.S.; Sapkal, R.S. Evaluation of direct contact membrane distillation for concentration of orange juice. Int. J. Chem. Res. 2011, 1, 39–48. [Google Scholar]
- Sotoft, L.F.; Christensen, K.V.; Andrésen, R.; Norddahl, B. Full scale plant with membrane based concentration of blackcurrant juice on the basis of laboratory and pilot scale tests. Chem. Eng. Process. 2012, 54, 12–21. [Google Scholar] [CrossRef]
- Tamime, A.Y. Membrane Processing Dairy and Beverage Applications; Wiley-Blackwell: Chichester, UK, 2013. [Google Scholar]
- Criscuoli, A.; Drioli, E. Date juice concentration by vacuum membrane distillation. Sep. Purif. Technol. 2020, 251. [Google Scholar] [CrossRef]
- Jin, T. The Influence of Reverse Osmosis Concentrate for the Physical and Chemical Parameters Such as Osmotic Pressure of Chinese Herbal Materials; Nanjing University of Chinese Medicine: Nanjing, China, 2014. [Google Scholar]
- Chen, Y. Study on Membrane Mass Transfer Process of Different TCM Extracts by Reverse Osmosis Integrated Vacuum Membrane Distillation; Nanjing University of Chinese Medicine: Nanjing, China, 2017. [Google Scholar]
- Shi, F. Preliminary Study on Concentration of Radix Scutellariae and Other Different Chinese Herbal Decoctions Using Vacuum Membrane Distillation Based on PVDF Hydrophobic Membrane; Nanjing University of Chinese Medicine: Nanjing, China, 2015. [Google Scholar]
- Kucera, J. Reverse Osmosis: Design, Processes, and Applications for Engineers; Scrivener Pub.: Salem, MA, USA, 2010. [Google Scholar]
- Rao, S. Reverse Osmosis. Resonance 2011, 16, 1333–1336. [Google Scholar] [CrossRef]
- Janáček, K.; Sigler, K. Osmotic pressure: Thermodynamic basis and units of measurement. Folia Microbiol. 1996, 41, 2–9. [Google Scholar] [CrossRef]
- Borg, F. What is osmosis? Explanation and understanding of a physical phenomenon. arXiv 2003, arXiv:physics/0305011. [Google Scholar]
- Lu, K.J.; Chung, T.-S. Membrane Distillation Principle, Membrane Design and Hybrid System; CRC Press LLC: New York, NY, USA, 2019. [Google Scholar]
- Alvarez, V.; Alvarez, S.; Riera, F.A.; Alvarez, R. Permeate flux prediction in apple juice concentration by reverse osmosis. J. Membr. Sci. 1997, 127, 25–34. [Google Scholar] [CrossRef]
- Ren, L.-F.; Lin, Y.; Song, H.; Sun, H.; Shao, J. Efficient removal of antimony from aqueous solution by sustainable polymer assisted ultrafiltration process. Sep. Purif. Technol. 2021, 263, 118418. [Google Scholar] [CrossRef]
- Julian, H.; Yaohanny, F.; Devina, A.; Purwadi, R.; Wenten, I.G. Apple juice concentration using submerged direct contact membrane distillation (SDCMD). J. Food Eng. 2020, 272, 109807. [Google Scholar] [CrossRef]
- Kaya, A.; Sözer, N. Rheological behaviour of sour pomegranate juice concentrates (Punica granatum L.). Int. J. Food Sci. Technol. 2005, 40, 223–227. [Google Scholar] [CrossRef]
- Dong, G.; Kim, J.F.; Kim, J.H.; Drioli, E.; Lee, Y.M. Open-source predictive simulators for scale-up of direct contact membrane distillation modules for seawater desalination. Desalination 2017, 402, 72–87. [Google Scholar] [CrossRef]
- Zhong, W.-W.; Li, W.-Y.; Ding, F.; Li, C.-X.; Zheng, D.-Y.; Guo, L.-W. Dynamic energy estimation with key parameters of aqueous environment of traditional Chinese medicine extracts incorporated—Example given in concentration process of Yupingfeng San extracts. Chin. Tradit. Herb. Drugs 2021, 52, 1937–1944. [Google Scholar] [CrossRef]
- Vishwanath, A.; Chandan, V.; Mendoza, C.; Blake, C. A Data Driven Pre-cooling Framework for Energy Cost Optimization in Commercial Buildings. In Proceedings of the Eighth International Conference on Future Energy Systems, Hong Kong, China, 16–19 May 2017; pp. 157–167. [Google Scholar] [CrossRef]
- Weaver, N.J.; Wilkin, G.S.; Morison, K.R.; Watson, M.J. Minimizing the energy requirements for the production of maple syrup. J. Food Eng. 2020, 273, 109823. [Google Scholar] [CrossRef]
- Wang, L.; Wu, W.; Zhu, X.; Ng, W.; Gong, C.; Yao, C.; Ni, Z.; Yan, X.; Fang, C.; Zhu, S. The Ancient Chinese Decoction Yu-Ping-Feng Suppresses Orthotopic Lewis Lung Cancer Tumor Growth Through Increasing M1 Macrophage Polarization and CD4+ T Cell Cytotoxicity. Front. Pharmacol. 2019, 10, 1333. [Google Scholar] [CrossRef] [Green Version]
- Yuan, Q.; Yao, F.; Zhou, L.; Liang, G.; Song, X.; Jiang, G.; Zhou, M.; Zhang, L. Yu Ping Feng San Exert Anti-Angiogenesis Effects through the Inhibition of TSLP-STAT3 Signaling Pathways in Hepatocellular Carcinoma. Evid. -Based Complementary Altern. Med. Ecam 2019, 2019, 1947156. [Google Scholar] [CrossRef] [Green Version]
- Nikles, S.; Monschein, M.; Zou, H.; Liu, Y.; He, X.; Fan, D.; Lu, A.; Yu, K.; Isaac, G.; Bauer, R. Metabolic profiling of the traditional Chinese medicine formulation Yu Ping Feng San for the identification of constituents relevant for effects on expression of TNF-α, IFN-γ, IL-1β and IL-4 in U937 cells. J. Pharm. Biomed. Anal. 2017, 145, 219–229. [Google Scholar] [CrossRef]
- Du, C.Y.Q.; Choi, R.C.Y.; Zheng, K.Y.Z.; Dong, T.T.X.; Lau, D.T.W.; Tsim, K.W.K. Yu Ping Feng San, an Ancient Chinese Herbal Decoction Containing Astragali Radix, Atractylodis Macrocephalae Rhizoma and Saposhnikoviae Radix, Regulates the Release of Cytokines in Murine Macrophages. PLoS ONE 2013, 8, e78622. [Google Scholar] [CrossRef] [Green Version]
- Kong, J.; You, L.-J.; Peng, C.-C.; Zhao, M.-M.; Ma, F.-L. Research on reverse osmosis ultrafiltration of Lentinus polysaccharides. Mod. Food Sci. Technol. 2011, 27, 791–794. [Google Scholar] [CrossRef]
- Ding, Z.; Liu, L.; Liu, Z.; Ma, R. Fouling resistance in concentrating TCM extract by direct contact membrane distillation. J. Membr. Sci. 2010, 362, 317–325. [Google Scholar] [CrossRef]
- Ding, Z.; Liu, L.; Yu, J.; Ma, R.; Yang, Z. Concentrating the extract of traditional Chinese medicine by direct contact membrane distillation. J. Membr. Sci. 2008, 310, 539–549. [Google Scholar] [CrossRef]
- Ismail, A.F.; Khulbe, K.C.; Matsuura, T. Chapter 1—Introduction—Do RO Membranes Have Pores. In Reverse Osmosis; Ismail, A.F., Khulbe, K.C., Matsuura, T., Eds.; Elsevier: Amsterdam, The Netherlands, 2019; pp. 1–24. [Google Scholar]
- Towler, G.P.; Sinnott, R.K. Chemical Engineering Design: Principles, Practice, and Economics of Plant and Process Design; Butterworth-Heinemann: Oxford, UK; Waltham, MA, USA, 2013. [Google Scholar]
- Elimelech, M.; Phillip, W.A. The Future of Seawater Desalination: Energy, Technology, and the Environment. Science 2011, 333, 712. [Google Scholar] [CrossRef] [PubMed]
- Wang, L.; Violet, C.; DuChanois, R.M.; Elimelech, M. Derivation of the Theoretical Minimum Energy of Separation of Desalination Processes. J. Chem. Educ. 2020, 97, 4361–4369. [Google Scholar] [CrossRef]
- Shrivastava, A.; Rosenberg, S.; Peery, M. Energy efficiency breakdown of reverse osmosis and its implications on future innovation roadmap for desalination. Desalination 2015, 368, 181–192. [Google Scholar] [CrossRef]
- Madaeni, S.S.; Zereshki, S. Reverse osmosis alternative: Energy implication for sugar industry. Chem. Eng. Process. 2008, 47, 1075–1080. [Google Scholar] [CrossRef]
- Zhu, A.; Christofides, P.D.; Cohen, Y. Energy Consumption Optimization of Reverse Osmosis Membrane Water Desalination Subject to Feed Salinity Fluctuation. Ind. Eng. Chem. Res. 2009, 48, 9581–9589. [Google Scholar] [CrossRef]
- Zhu, A.; Christofides, P.D.; Cohen, Y. Effect of Thermodynamic Restriction on Energy Cost Optimization of RO Membrane Water Desalination. Ind. Eng. Chem. Res. 2009, 48, 6010–6021. [Google Scholar] [CrossRef]
- Olatunji, S.O.; Camacho, L.M. Heat and Mass Transport in Modeling Membrane Distillation Configurations: A Review. (Report)(Author abstract). Front. Energy Res. 2018, 6. [Google Scholar] [CrossRef]
- Incropera, F.P. Fundamentals of Heat and Mass Transfer, 6th ed.; John Wiley: Hoboken, NJ, USA, 2007. [Google Scholar]
- Khayet, M. Membranes and theoretical modeling of membrane distillation: A review. Adv. Colloid Interface Sci. 2011, 164, 56–88. [Google Scholar] [CrossRef] [PubMed]
- Hitsov, I.; Maere, T.; De Sitter, K.; Dotremont, C.; Nopens, I. Modelling approaches in membrane distillation: A critical review. Sep. Purif. Technol. 2015, 142, 48–64. [Google Scholar] [CrossRef]
- Yaws, C.L.; Satyro, M.A. The Yaws Handbook of Vapor Pressure: Antoine Coefficients, 2nd ed.; Gulf Professional Publishing: Oxford, UK, 2015. [Google Scholar]
- Earle, R.L. Unit Operations in Food Processing. Available online: https://www.nzifst.org.nz/resources/unitoperations/index.htm (accessed on 26 February 2021).
- Andre, H.; Ritter, R.A. Dynamic response of a double effect evaporator. Can. J. Chem. Eng. 1968, 46, 259–264. [Google Scholar] [CrossRef]
- Schuck, P.; Jeantet, R.; Tanguy, G.; Méjean, S.; Gac, A.; Lefebvre, T.; Labussière, E.; Martineau, C. Energy Consumption in the Processing of Dairy and Feed Powders by Evaporation and Drying. Dry. Technol. 2015, 33, 176–184. [Google Scholar] [CrossRef]
- Silveira, A.C.P.; de Carvalho, A.F.; Perrone, Í.T.; Fromont, L.; Méjean, S.; Tanguy, G.; Jeantet, R.; Schuck, P. Pilot-scale investigation of effectiveness of evaporation of skim milk compared to water. Dairy Sci. Technol. 2013, 93, 537–549. [Google Scholar] [CrossRef] [Green Version]
- Abed El Aziz, M. A review on saponins from medicinal plants: Chemistry, isolation, and determination. J. Nanomed. Res. 2019, 7, 282–288. [Google Scholar] [CrossRef] [Green Version]
- Góral, I.; Wojciechowski, K. Surface activity and foaming properties of saponin-rich plants extracts. Adv. Colloid Interface Sci. 2020, 279, 102145. [Google Scholar] [CrossRef]
- Martínez-Lapuente, L.; Guadalupe, Z.; Ayestarán, B.; Pérez-Magariño, S. Role of major wine constituents in the foam properties of white and rosé sparkling wines. Food Chem. 2015, 174, 330–338. [Google Scholar] [CrossRef]
- Blasco, L.; Vinas, M.; Villa, T. Proteins influencing foam formation in wine and beer: The role of yeast. Int. Microbiol. Off. J. Span. Soc. Microbiol. 2011, 14, 61–71. [Google Scholar] [CrossRef] [Green Version]
- Hudson, P.R. Investigating Foaming Solutions Generated by NaOH Extraction of Plant Materials; University of Birmingham: Birmingham, UK, 2013. [Google Scholar]
- Kim, J.; Park, K.; Yang, D.R.; Hong, S. A comprehensive review of energy consumption of seawater reverse osmosis desalination plants. Appl. Energy 2019, 254, 113652. [Google Scholar] [CrossRef]
- Nayar, K.G.; Sharqawy, M.H.; Banchik, L.D.; Lienhard V, J.H. Thermophysical properties of seawater: A review and new correlations that include pressure dependence. Desalination 2016, 390, 1–24. [Google Scholar] [CrossRef] [Green Version]
- Sharqawy, M.H.; Lienhard V, J.H.; Zubair, S.M. Thermophysical properties of seawater: A review of existing correlations and data. Desalination Water Treat. 2010, 16, 354–380. [Google Scholar] [CrossRef]
- Karabelas, A.J.; Koutsou, C.P.; Kostoglou, M.; Sioutopoulos, D.C. Analysis of specific energy consumption in reverse osmosis desalination processes. Desalination 2018, 431, 15–21. [Google Scholar] [CrossRef]
- Huang, B.; Pu, K.; Wu, P.; Wu, D.; Leng, J. Design, Selection and Application of Energy Recovery Device in Seawater Desalination: A Review. Energies 2020, 13, 4150. [Google Scholar] [CrossRef]
- Elmarghany, M.R.; El-Shazly, A.H.; Salem, M.S.; Sabry, M.N.; Nady, N. Thermal analysis evaluation of direct contact membrane distillation system. Case Stud. Therm. Eng. 2019, 13, 100377. [Google Scholar] [CrossRef]
- Susanto, H. Towards practical implementations of membrane distillation. Chem. Eng. Process. 2011, 50, 139–150. [Google Scholar] [CrossRef]
- Hou, D.; Li, T.; Chen, X.; He, S.; Dai, J.; Mofid, S.A.; Hou, D.; Iddya, A.; Jassby, D.; Yang, R.; et al. Hydrophobic nanostructured wood membrane for thermally efficient distillation. J. Sci. Adv. 2019, 5, eaaw3203. [Google Scholar] [CrossRef] [PubMed] [Green Version]


Publisher’s Note: MDPI stays neutral with regard to jurisdictional claims in published maps and institutional affiliations. |
© 2021 by the authors. Licensee MDPI, Basel, Switzerland. This article is an open access article distributed under the terms and conditions of the Creative Commons Attribution (CC BY) license (https://creativecommons.org/licenses/by/4.0/).
Share and Cite
Li, W.; Li, Q.; Guo, L.; Liu, J.; Wang, K.; Zhong, W. Traditional Chinese Medicine Extract Properties Incorporated Energy Analysis for Membrane Concentration Processes. Membranes 2021, 11, 673. https://doi.org/10.3390/membranes11090673
Li W, Li Q, Guo L, Liu J, Wang K, Zhong W. Traditional Chinese Medicine Extract Properties Incorporated Energy Analysis for Membrane Concentration Processes. Membranes. 2021; 11(9):673. https://doi.org/10.3390/membranes11090673
Chicago/Turabian StyleLi, Wanyu, Qiyuan Li, Liwei Guo, Juyan Liu, Kai Wang, and Wenwei Zhong. 2021. "Traditional Chinese Medicine Extract Properties Incorporated Energy Analysis for Membrane Concentration Processes" Membranes 11, no. 9: 673. https://doi.org/10.3390/membranes11090673
APA StyleLi, W., Li, Q., Guo, L., Liu, J., Wang, K., & Zhong, W. (2021). Traditional Chinese Medicine Extract Properties Incorporated Energy Analysis for Membrane Concentration Processes. Membranes, 11(9), 673. https://doi.org/10.3390/membranes11090673