Article

Membrane-Assisted Methanol Synthesis Processes and the Required Permselectivity

Department of Process Engineering, Institute of Membrane Research, Helmholtz-Zentrum Hereon, Max-Planck-Straße P1, 21502 Geesthacht, Germany
*
Author to whom correspondence should be addressed.
Membranes 2021, 11(8), 596; https://doi.org/10.3390/membranes11080596
Submission received: 7 June 2021 / Revised: 14 July 2021 / Accepted: 3 August 2021 / Published: 6 August 2021

Abstract

:
Water-selective membrane reactors are proposed in the literature to improve methanol yield for a standalone reactor. However, the methanol productivity is not a precise metric to show the system improvement since, with this approach, we do not consider the amount of energy loss through the undesirable co-permeation of H2, which could otherwise remain on the reaction side at high pressure. In other words, the effectiveness of this new technology should be evaluated at a process flowsheet level to assess its advantages and disadvantages on the overall system performance and, more importantly, to identify the minimum required properties of the membrane. Therefore, an equation-based model for a membrane reactor, developed in Aspen Custom Modeler, was incorporated within the process flowsheet of the methanol plant to develop an integrated process framework to conduct the investigation. We determined the upper limit of the power-saving at 32% by exploring the favorable conditions wherein a conceptual water selective membrane reactor proves more effective. Using these suboptimal conditions, we realized that the minimum required H2O/H2 selectivity is 190 and 970 based on the exergy analysis and overall power requirement, respectively. According to our results, the permselectivity of membranes synthesized for this application in the literature, showing improvements in the one-pass conversion, is well below the minimum requirement when the overall methanol synthesis process flowsheet comes into consideration.

Graphical Abstract

1. Introduction

Carbon capture and utilization (CCU) is an economically and ecologically attractive solution to unravel the two contemporary global challenges, i.e., rapid climate change and future energy dilemma. However, the CCU cycle cannot be fully composed, unless the captured CO2 consolidates itself as major building blocks for the production of diverse high-demand CO2-based fuels, such as methane, methanol, and liquid hydrocarbon transportation fuels (LHTF), as well as chemicals. With almost 99 Mt global demand in 2020, methanol is identified as a pivotal intermediate for production of manifold chemicals (dimethyl ether, formaldehyde, formic acid, lower olefins, acetic acid, and higher alcohols), and LHTFs via the so-called methanol-to-gasoline (MTG) and Mobil olefins-to-gasoline-and-distillate (MOGD) technologies, instead of the traditional Fischer–Tropsch (FT) synthesis approach, as shown in Figure 1 [1,2,3,4]. Based on the premises, green methanol has substantial potential to shortly emerge as one of the key pieces of the carbon cycle puzzle; however, its production via CO2 hydrogenation is limited by equilibrium conversion under relevant process conditions and suffers from a high amount of water produced, which causes catalyst thermal deactivation. The in situ removal of water from the reaction system not only mitigates the two aforesaid problems but also intensifies the reaction rate and offers a unique opportunity to merge reaction and separation into one single piece of equipment with potential savings in capital and operating expenditures. This tactic can be carried out through the incorporation of membrane separation technology into the reaction system.
The first membrane reactor (MR) for methanol synthesis was proposed by Struis et al. [5]. The authors reported that the reactor equipped with a Nafion membrane outperforms conventional reactors (CR) with a 2.5% improvement in one-pass conversion. However, the membrane material was not sufficiently resistant to the temperatures at which the commonly used catalyst is active. A theoretical study of zeolite-based MRs with two hypothetical sets of species’ permeances was performed by Barbieri et al. [6]. The methanol yield increased from 5.8% to 13.7% in the best scenario of the MR system. A theoretical and experimental investigation was performed by Chen and Yuan [7]. They developed an isothermal MR for methanol synthesis utilizing a silicone rubber/ceramic composite membrane. They claimed a 22% enhancement in the reaction conversion. Gallucci et al. exploited zeolite membranes to experimentally study their impact on the isothermal reactor performance [8]. The results showed improvements in both selectivity and conversion. Raso et al. studied various zeolite membranes (zeolite A, mordenite, zeolite T, chabazite and Ti-chabazite) for the methanol production application [9]. Zeolite A was reported as the best choice for this application. The experimental results revealed that while this type of membrane increases the CO2 conversion, it decreases the methanol selectivity. A bifunctional catalytic MR based on a zeolite LTA was proposed by Yeu et al. [10]. Recently, a polymer–ceramic composite membrane was suggested by Juarez et al. as an alternative candidate for this application [11]. Due to the envisaged advantages of MR, it has been applied to several other CO2 conversion routes presented in Figure 1 [12,13,14,15].
Although several researchers have already investigated the feasibility of using MRs in the methanol synthesis application and unanimously concurred that MRs improve the system performance, the scope of their investigations was limited to laboratory-scale devices with an exclusive emphasis on the standalone reactor’s performance rather than the overall methanol process. While it was not clear if and to what extent these two metrics can represent the overall process performance enhancement, the one-pass reactor conversion and selectivity were used to show the improvement in the reaction system. More importantly, they completely overlooked the amount of the reactor feed pressure exergy (especially for hydrogen with high compression costs) sacrificed through the transmembrane pressure drop to promote the reactor conversion. This ignorance happens while the main advantage of MR is supposedly the reduction in the process energy demand through the recycle flowrate decrease. Finally, when the CO2 conversion rate increases but at the same time the methanol selectivity decreases, the use of the two metrics creates a predicament, whether the MR employment is advantageous or not [9,16].
In this work, we present a holistic framework by embedding a numerically based membrane reactor model, developed in Aspen Custom Modeler (ACM), within the entire methanol production process flowsheet simulated in Aspen Hysys V11. This integrated scheme enables us to accurately probe the role of an MR in the overall performance of an entire methanol process flowsheet, and analyze to what extent the employment of this technology impacts the overall utility demands of the plant. We determine in which heat transfer mode and process conditions the installation of an MR is appropriate. Finally, we suggest the minimum required H2O/H2 selectivity, above which an MR comes into effect and benefits the overall methanol process performance. The latter should be of high importance and interest to membrane material developers.

2. Process Description and Simulation

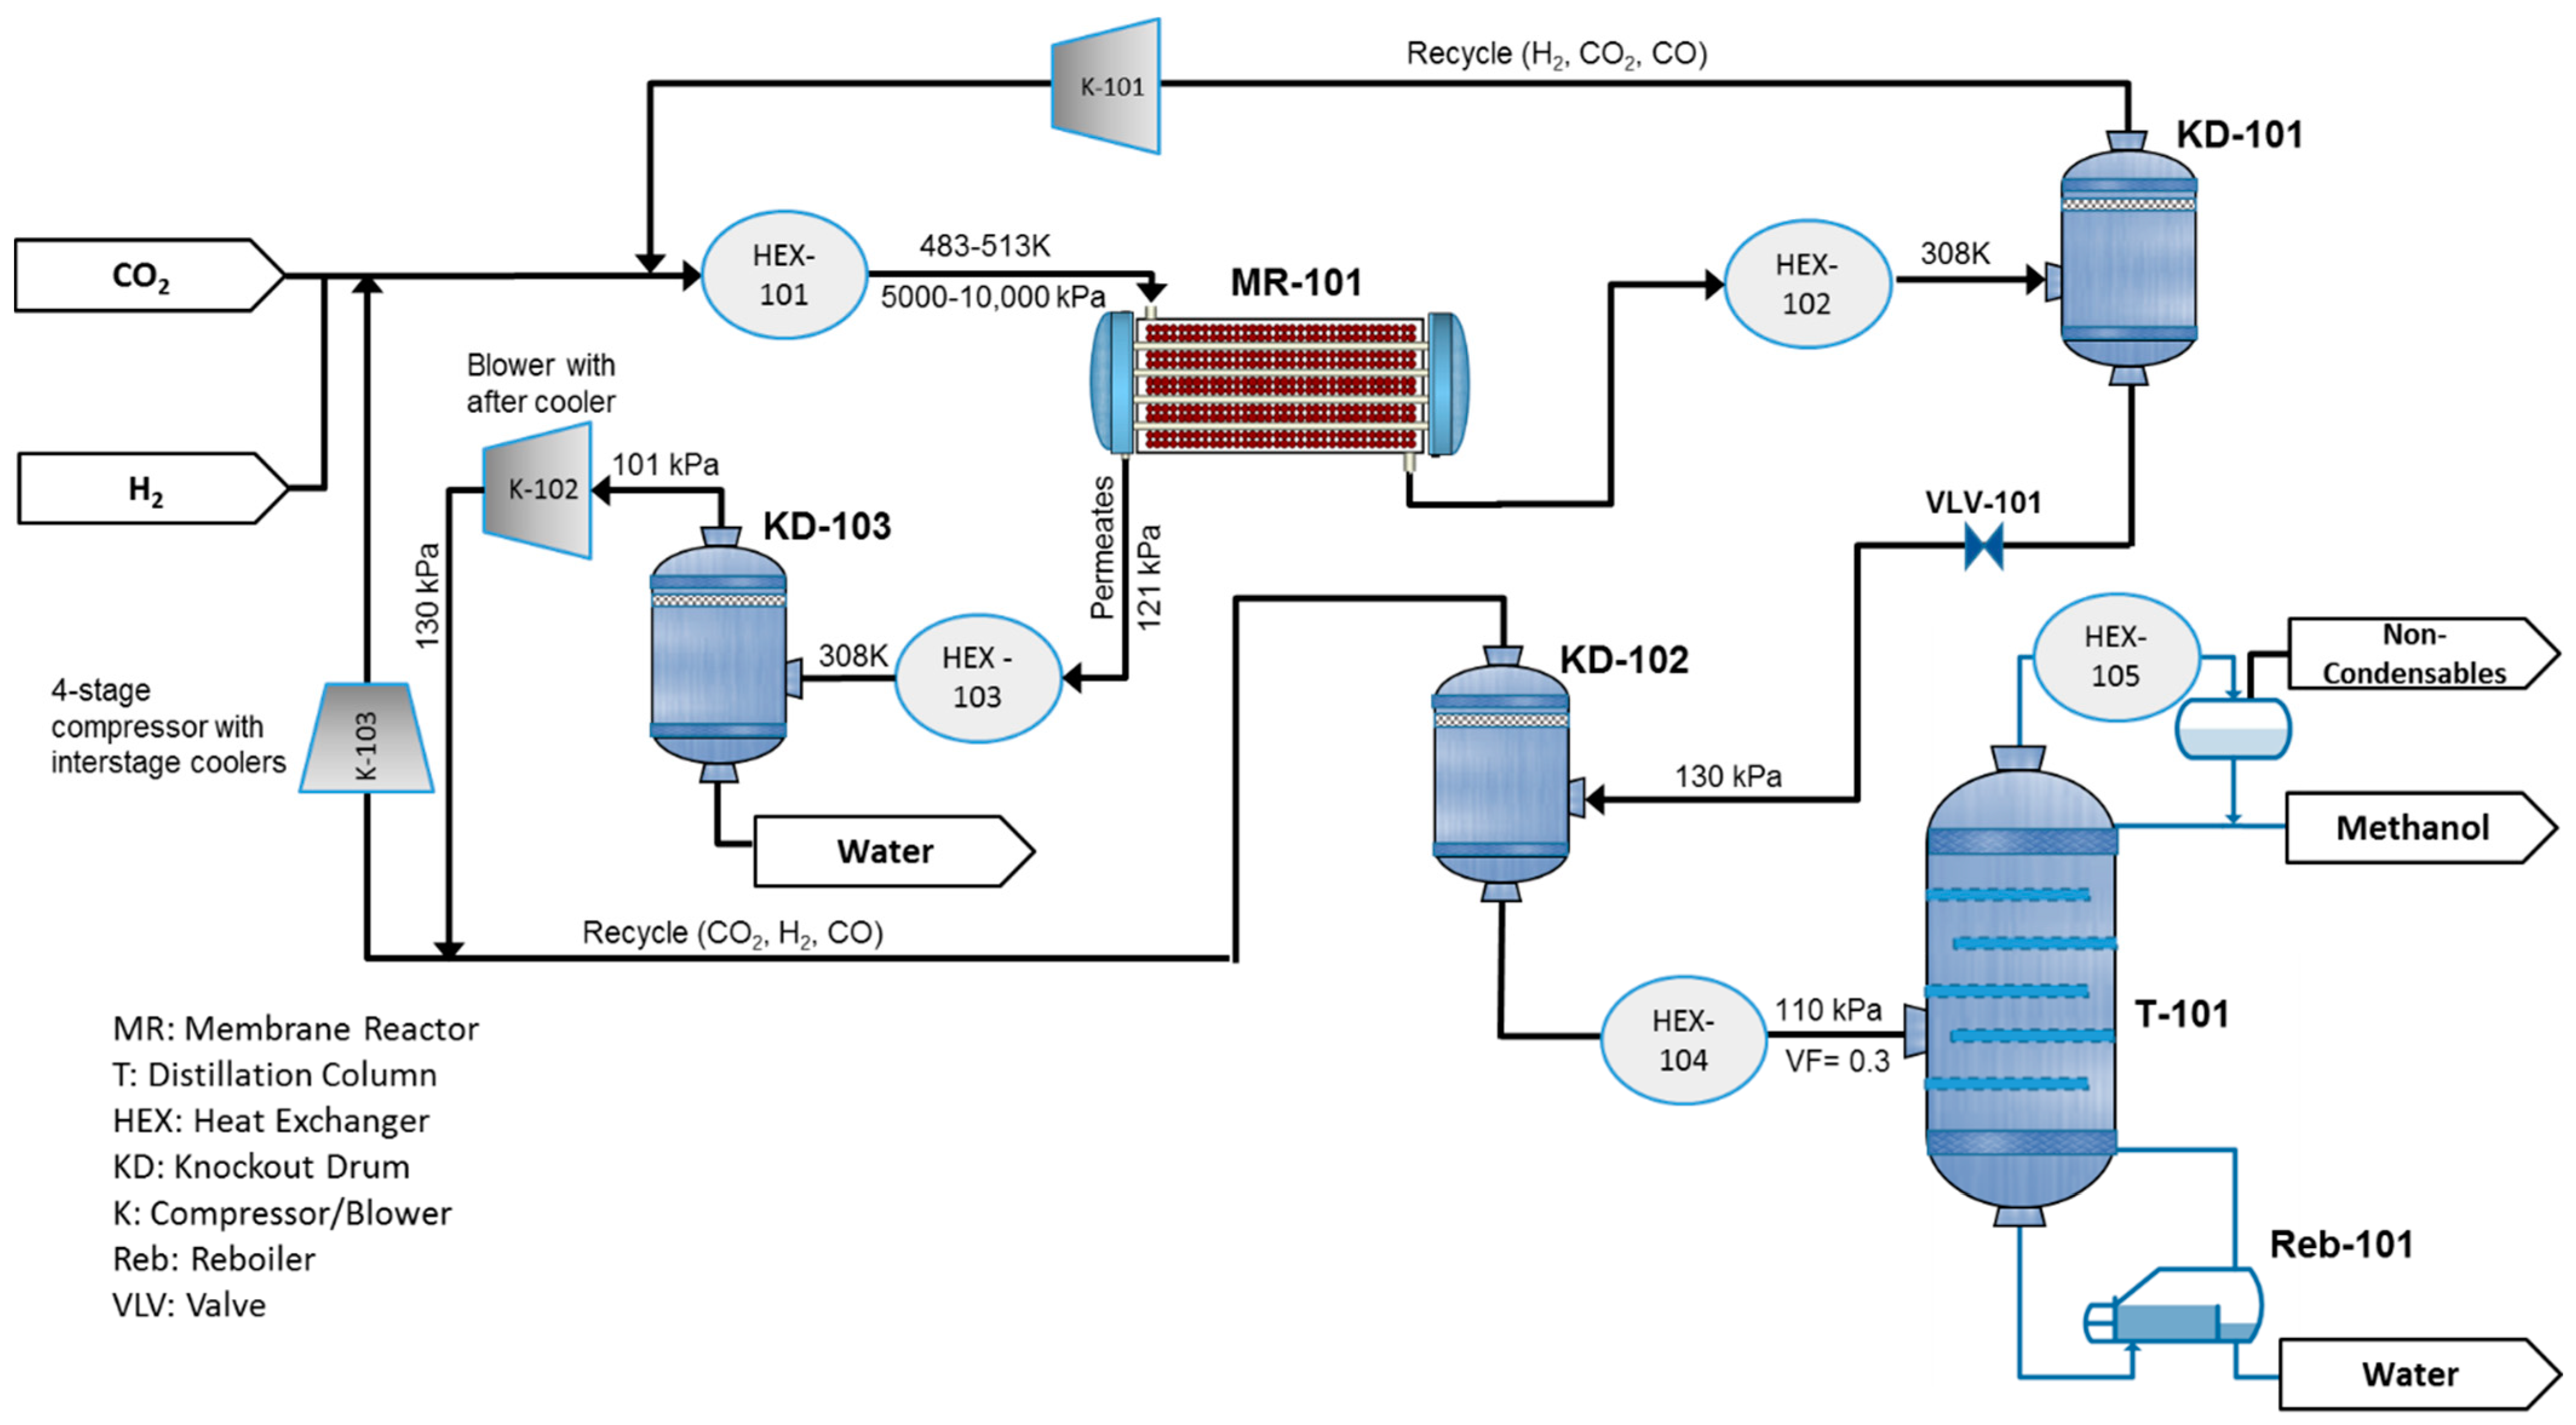
Figure 2 represents the process flow diagram of methanol production, which is aided by a water-selective MR. The plant is fed by pure CO2 and H2, which can be generated by water electrolysis using renewable energy sources. The feed is mixed with the recycle stream and heated in HEX-101 to the temperature of 483.15 K and 513.15 K for adiabatic and isothermal scenarios, respectively. Then, it is routed to the water-selective MR-101. The reactor product is cooled to 308.15 K to separate the unreacted gases from the condensable products, methanol and water, in the knockout drum (KD-101) and then recycled into the reactor after compression in K-101. The liquid product, crude methanol, is expanded through a valve (VLV-101) to 130 kPa pressure, and sent to the second separator (KD-102) to recover and further recycle the residual gases, which contain mostly CO2. The mixture of water and methanol is preheated and enters the distillation column T-101 to reach the product purification of 99% for both methanol and water. A very limited amount of CO2, along with other possible noncondensable impurities, is drawn from the column condenser as shown in the figure. The permeate coming from MR-101 is sent to HEX-101 and KD-103 to remove the produced water. The separated gases are compressed and recycled to the reactor. In the case of an infinitely water-selective membrane, K-102 is not necessary. Throughout this paper, a reactor with a membrane tube number equal to zero corresponds to a CR.
Membrane system separation is not suitable for sharp separation. Thus, to meet the product specification of 99% purity, the distillation tower is still required and industrially accepted.
Regardless of reactor designs, the overall productivity of a methanol production process is near 100% since the unreacted components and products can be almost thoroughly separated in the downstream equipment and recycled into the reactor. However, what is important here is how much energy/exergy is necessary for the overall conversion and separation.
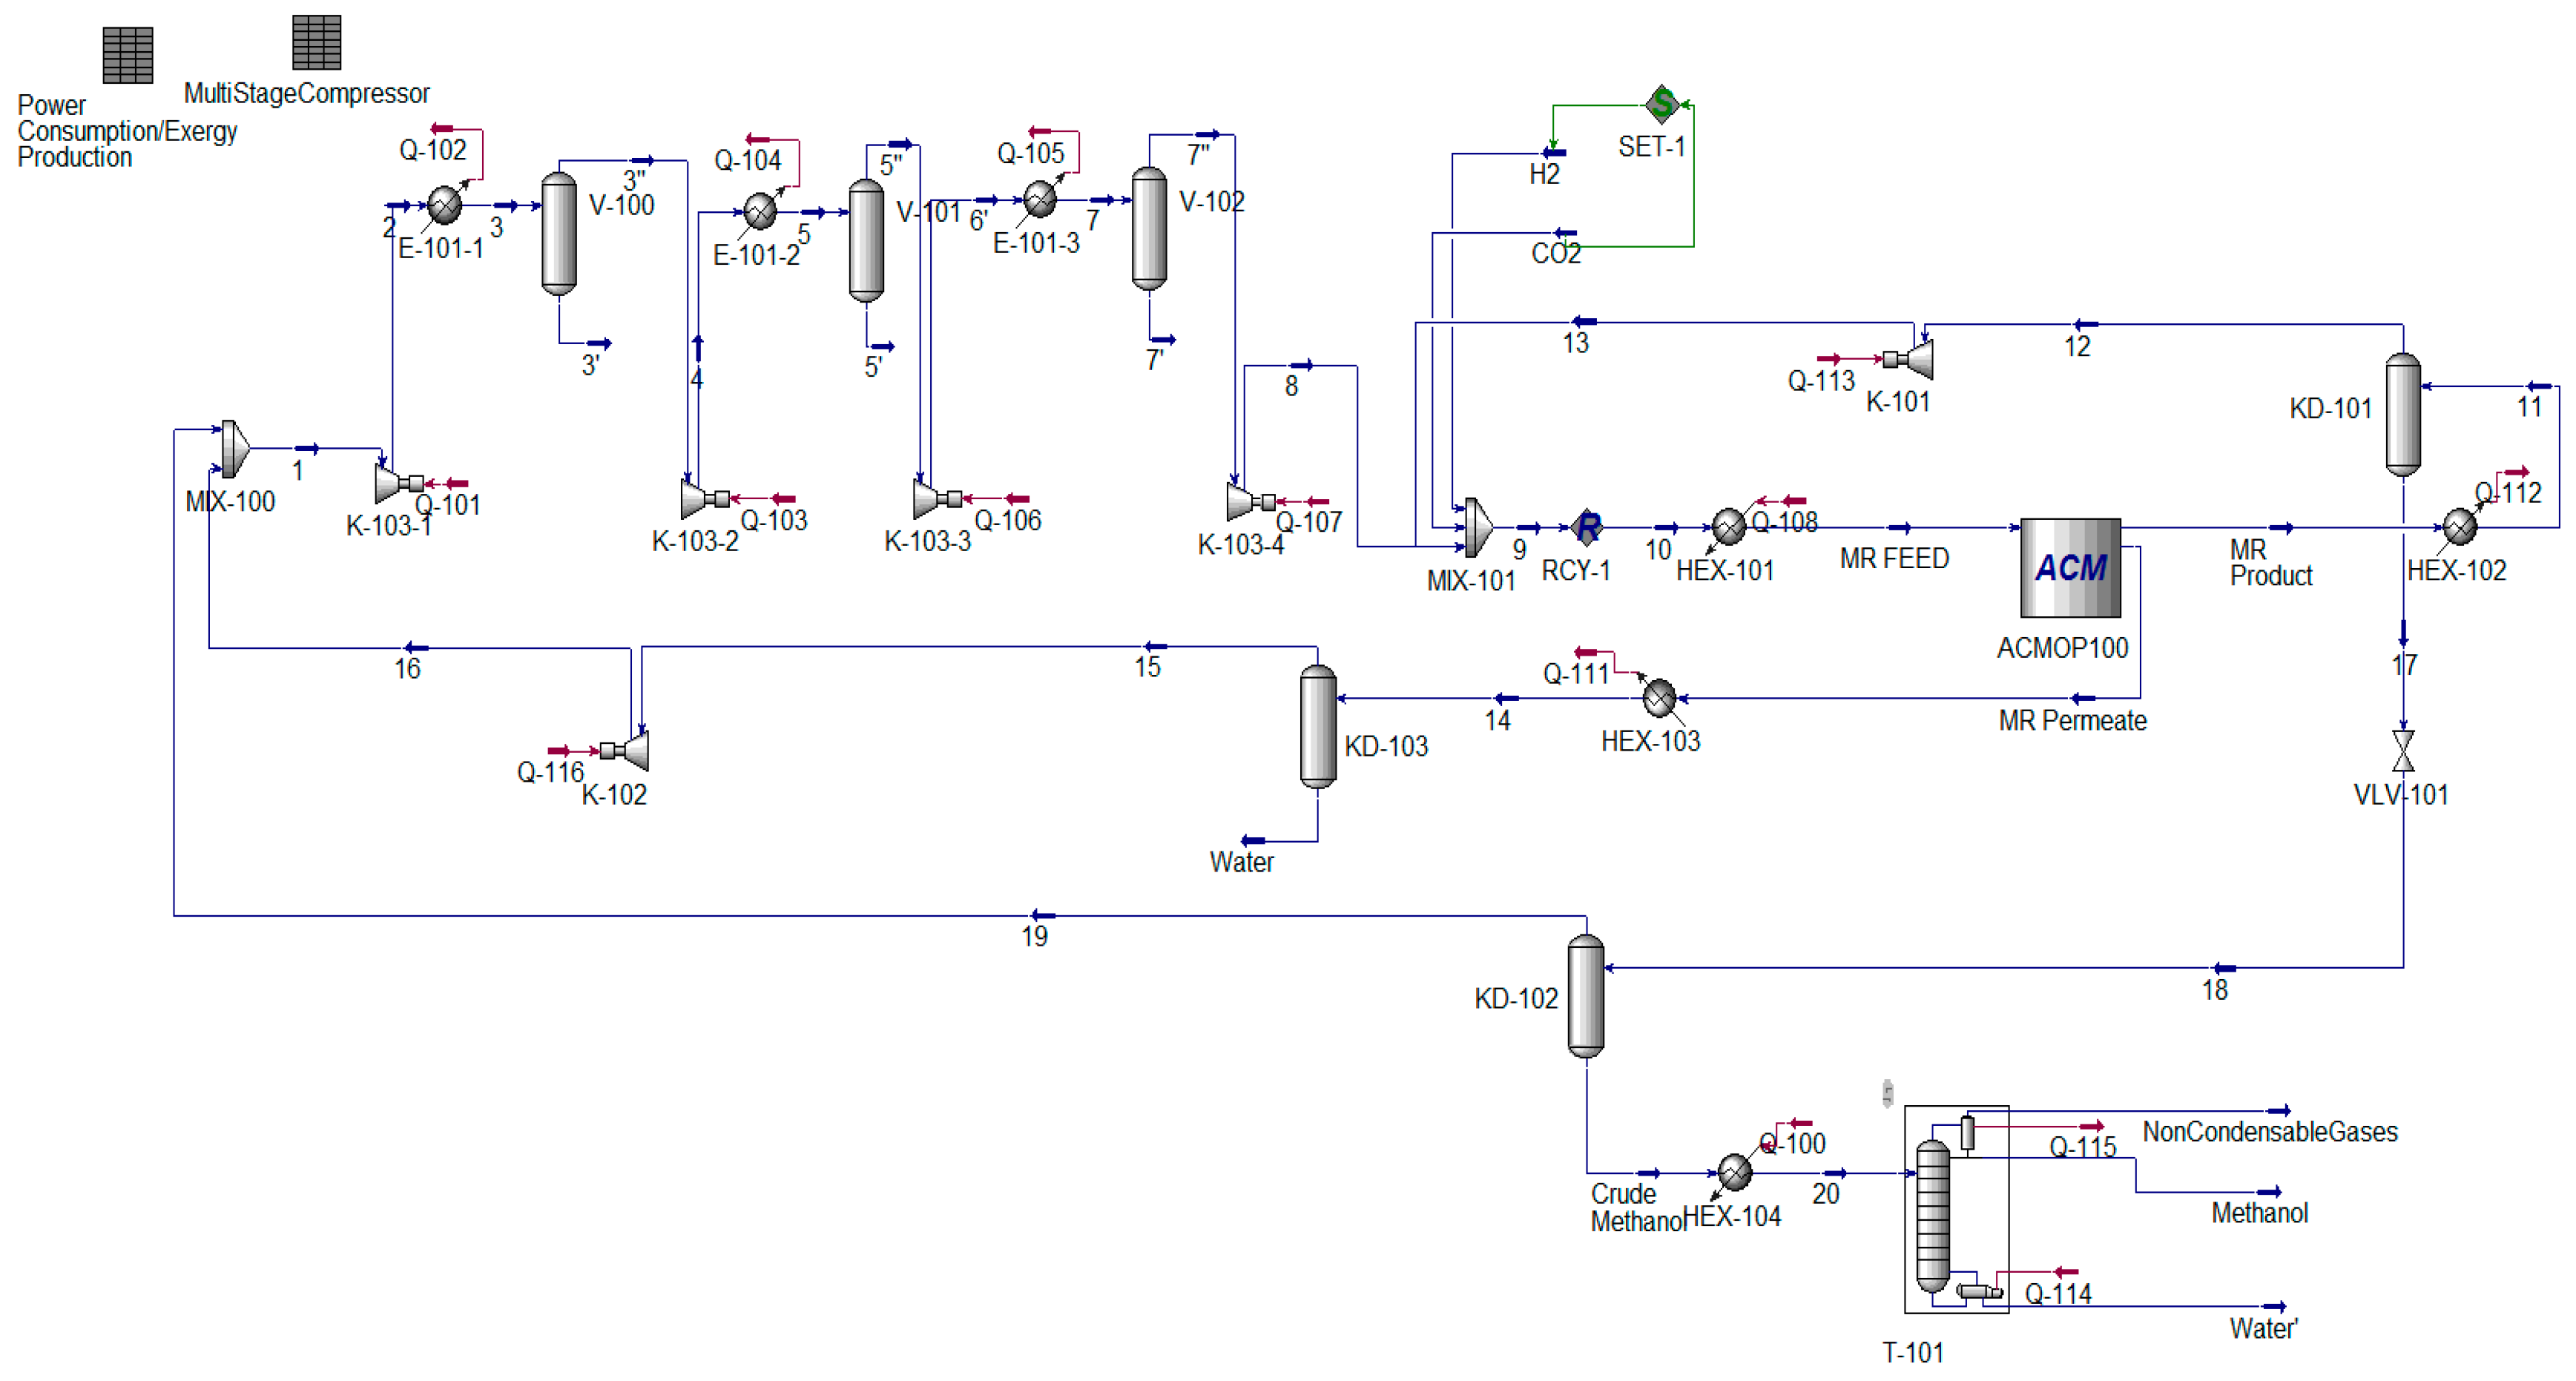
The process was simulated using Aspen HYSYS V11 (Aspen Technology Inc., Bedford, MA, USA). The Redlich–Kwong–Soave equation of state with modified Huron–Vidal mixing rules (RKSMHV2), developed in Aspen Plus, was imported and used as the fluid package [17]. The MR model, developed in ACM, is converted to an HYSYS package model and employed as an ACM operation unit in the process flowsheet (Appendix A, Figure A1). The details of the model are presented in our previous study with unrestricted access [16]. Though concentration polarization effects for gas permeation are reported negligible by several publications [18,19,20] due to the high diffusivity and low permeability of gases, we still need to clarify that the disregard of the phenomena in this primary assessment ensures that we are sufficiently cautious when presenting the lower limit for H2O/H2 selectivity. This is because, in the latter case, we overestimate the performance of the MR-based process during the comparison with the CR-based process. A crossflow pattern was assumed for the transmembrane mass transport. We used Ergun’s equation to calculate the pressure drop through the fixed bed reactor. For converging the recycles in the flowsheet shown in Appendix A. “Dominant Eigenvalue” should be used as the acceleration method for the single HYSYS recycle unit placed upstream of HEX-101. Due to the high nonlinearity of the problem, only the aforementioned method with at least 50 trials can solve the problem. The solution for the CR-based process should be set as an initial guess for the MR-based system. Additional specifications and process design data are provided in Section 5.

3. Reaction Kinetics

The methanol synthesis is a set of reversible reactions represented as follows [17]:
C O ( g ) + 2 H 2 ( g ) C H 3 O H ( l )   Δ H 298 K = 128   kJ mol
C O 2 ( g ) + H 2 ( g ) C O ( g ) + H 2 O ( g )   Δ H 298 K = + 41.19   kJ mol
C O 2 ( g ) + 3 H 2 ( g ) C H 3 O H ( l ) + H 2 O ( g )   Δ H 298 K = 49.51   kJ mol  
Van den Bussche and Froment’s kinetic model for a commercial Cu/ZnO/Al2O3 catalyst [21], which has been proven to describe the reaction system more accurately, was employed in our study [22]. Based on their model, the direct transformation of CO to methanol (Equation (1)) does not occur. We used the kinetic constants suggested by Mignard and Pritchard [23], which are valid for a pressure range of up to 7500 kPa [17]. Given the validity range for the parameters and the industrial operating pressure for methanol synthesis (5000–10,000 kPa) [17], the scope of this study was limited to 5000–7500 kPa. Moreover, though the use of MR at lower pressures can improve the reactor’s performance, it is still not satisfactory [16,22]. The reaction rates can be written as follows:
r C H 3 O H = k 1 p C O 2 p H 2   ( 1 1 K e q 1   p H 2 O   p C H 3 O H p H 2 3   p C O 2 ) ( 1 + k 2 p H 2 O p H 2 + k 3   p H 2 0.5 + k 4   p H 2 O ) 3   ρ c a t   ( 1 ψ )   [ kmol m 3   h ]
r R W G S = k 5 p C O 2   ( 1 K e q 2   p H 2 O   p C O p H 2   p C O 2 ) ( 1 + k 2   p H 2 O p H 2 + k 3   p H 2 0.5 + k 4   p H 2 O )   ρ c a t   ( 1 ψ )   [ kmol m 3   h ]
k i = A i   e x p ( B i R T )
l o g 10 K e q 1 = 3066 T 14.592  
l o g 10 K e q 2 = 2073 T 2.029  
Symbols are described in Nomenclature and the required constants are presented in Table 1. We set the effectiveness factor at 1.0 due to the high pressure operating conditions and the small size catalysts of 2 mm, i.e., diffusion limitations are assumed negligible [24].

4. Membrane Properties

In the literature, various polymeric, ceramic, and zeolite membranes with hydrophilic structures have been suggested for MR-based methanol synthesis [5,6,7,8,9,25,26,27]. Due to the limited water permeances through these materials at elevated temperatures of the methanol reaction, the pressure on the permeate side should be set at the lowest possible, typically atmospheric pressure, to achieve the highest water permeation. At such high temperatures, for inorganic porous membranes, the Knudsen diffusion and molecular sieving are expected to be the dominating mechanisms for transmembrane permeation. In contrast, for membranes with a continuous polymeric selective layer, the gas permeances are determined by the solution–diffusion mechanism while the diffusion selectivity proves to be the dominator at elevated temperatures, especially in the case of glassy polymers. Among all the existing species in the reaction system, water and hydrogen are tightly competitive in permeation due to their small kinetic diameters, 0.265 and 0.289 nm, respectively. The co-permeation of hydrogen leads to very high penalties for the overall system since the recompression of this light gas from atmospheric pressure back to the reactor’s feed pressure is very costly. Thus, in general, high values of H2O/H2 permselectivity are demanded. However, the state-of-the-art polymeric membranes, which can be supported on porous ceramic or temperature stable, porous polymeric substrates, exhibit only 1–10 H2O/H2 permselectivity at the temperatures of interest [28,29,30]. On the other hand, ceramic membranes are also of poor permselectivity due to the degradation of the hydrophilic structure at high temperatures [28]. However, based on the experimental evaluation reported in the literature, zeolite membranes, in particular hydroxy sodalite (H-SOD) and mordenite, are proven to be the most promising materials for this particular application due to their higher H2O/H2 permselectivities and adequate thermal and mechanical stabilities under harsh conditions [27,28,31]. H-SOD with 0.27 nm openings is claimed to work solely based on molecular sieving and capable of selectively removing water vapor, with limited co-permeation of hydrogen depending on the reaction conditions [28,31]. Although this membrane has been employed in several theoretical studies for different reaction systems, its capability has never been tested and verified under the corresponding applied conditions [12], especially considering that the permeation properties of zeolite membranes depend on temperature, pressure, and the mixture composition [8]. However, a more target-based approach that can predict the minimum requirement of H2O/H2 permselectivity based on the methanol process simulation is expected to be of high importance and interest to membrane material developers for their future experiments.
In this study, for the first part of our simulation, we assume an ideally water-selective MR, which is impermeable to H2, CO2, CO, and CH3OH, similar to what is claimed for H-SOD membranes [28,31]. The maximum H2O permeance of zeolite-based membrane in the literature, 10−6 mol/(s m2 Pa), was considered [28,32,33]. Based on these assumptions, we could demonstrate the highest energy saving potentials that can be achieved within a methanol synthesis process using MR technology. Moreover, this allows us to identify the circumstances in which MR is more effective. However, in the second part, the H2O/H2 permselectivity will be gradually reduced to find the minimum value that renders an MR-based process competitive with the CR-based counterpart. In both parts, the membrane is assumed to be completely impermeable to the other existing species (CO, CH3OH, and CO2). Later, we will provide a reason why this is a fair assumption.

5. Design Data and Specifications

The specifications that form the basis for the simulation are in Table 2. It is notable that the H2/CO2 feed ratio is marginally below the stoichiometric fraction since a very slight amount of the feed CO2, together with other possible noncondensable gases, is vented from the column overhead. Moreover, for a fair comparison between MR- and CR-based processes, the overall reactor volume (ORV), which is composed of the reactor’s and membrane’s volume, is kept constant, as in Equation (9) [33]. It is obvious that for a CR, the ORV and R e a c t o r   V o l u m e are equal. This assumption is also valid for a retrofit scenario.
O R V = R e a c t o r   V o l u m e + M e m b r a n e   V o l u m e  

6. Results and Discussion

In this section, we evaluate and compare the performance of the methanol production processes, which include different reactor designs, namely CR and MRs with different membrane tube numbers (Nm). Two heat transfer scenarios are considered for the reactors. We used the two metrics of power consumption and exergy production as defined below.
(A)
Power Consumption
P o w e r   C o n s u m p t i o n = i = 101 103 W K i
(B)
Exergy Production
E x e r g y   P r o d u c t i o n =   i = 101 105 E x H E X i +   E x R e b 101 +   E x M R 101 i = 101 103 W K i
where         E x M R 101 = { 0                                        i f   a d i a b a t i c Δ H r e a c t o r ( 1 T a m b i e n t T r e a c t o r ) i f   i s o t h e r m a l
Δ H r e a c t o r = H M R 101 i n H M R 101 p e r m e a t e s H M R 101 p r o d u c t
where W is compressor’s input power per CO2 feed mass flowrate (CFMF). E x denotes the exergy production/consumption rate per CFMF for the respective equipment in Figure 2. Since the overall process always produces exergy, the summation is designated by E x e r g y   P r o d u c t i o n . H is enthalpy rate per CFMF, and consists of both sensible enthalpy and the heat of formation as uniformly defined in the Aspen Engineering suite.
It is notable that each metric presented in Equations (10) and (11) can alone serve as a basis for the comparison of CR- and MR-based processes. However, depending on the allowable tightness between the cold/hot composite curves during the heat integration practice, the subsequent exergy destruction can also be taken into account by giving a weighting factor to the first three terms in Equation (11) [34]. In this study, we used Equations (10) and (11) directly without any weighting factor. Furthermore, the aim of this study is not to compare the process performance under different feed pressures (or reactor’s operating pressure), but to assess the impact of the MR use on each process. Hence, for the comparison, we consider the metrics’ saving percentages that can be achieved by replacing the CR with different MRs, rather than their absolute values.

6.1. Adiabatic MR-Based Process

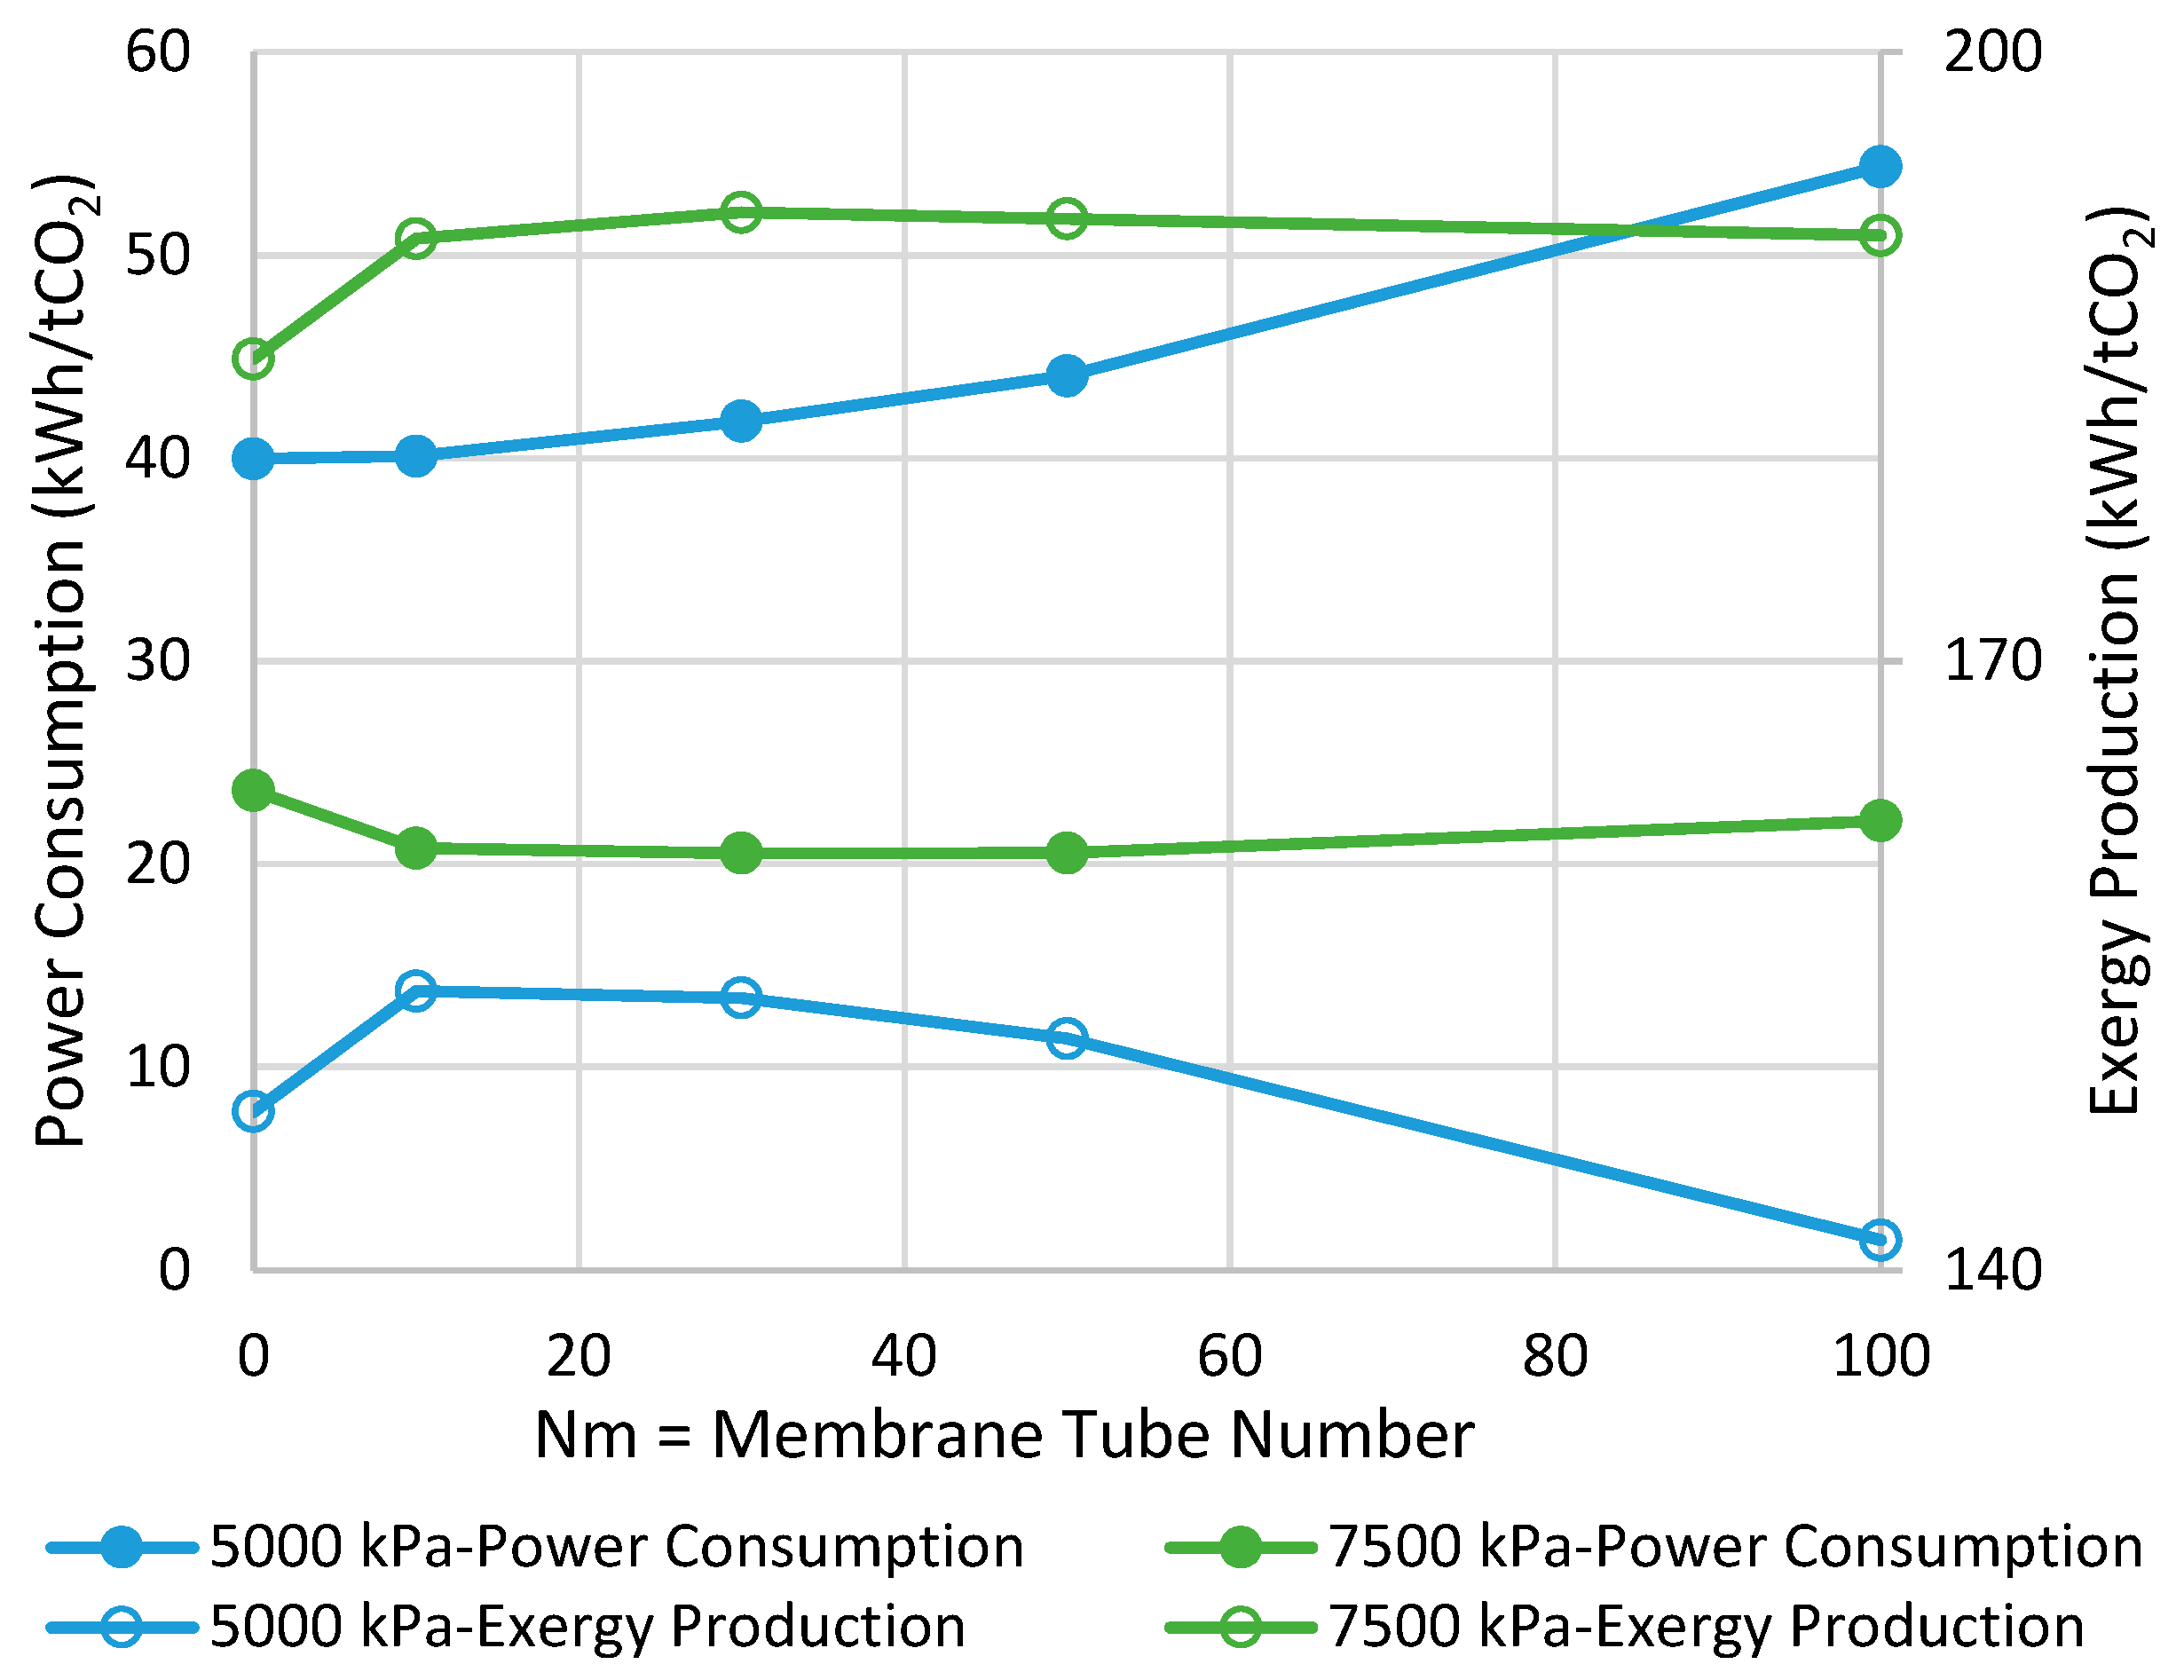
Figure 3 presents the comparison between MR- and CR-based processes in terms of power consumption and exergy production when the reactor operates with the adiabatic mode. As can be seen, at the pressure of 7500 kPa, the highest possible improvements are 13% and 4% in power consumption and exergy production, respectively, when Nm is 30. In contrast, at the pressure of 5000 kPa, no power consumption improvement is observed while a 4% enhancement in exergy production can be achieved at the best when Nm is 10. From Figure 3, we can conclude that at both operating pressures, increasing Nm is not always in a favor of the process and, thus, there is an optimal value for it. This tradeoff can be attributed to the following undesirable phenomena when the membrane area increases to possibly promote CO2-to-methanol conversion.
(a)
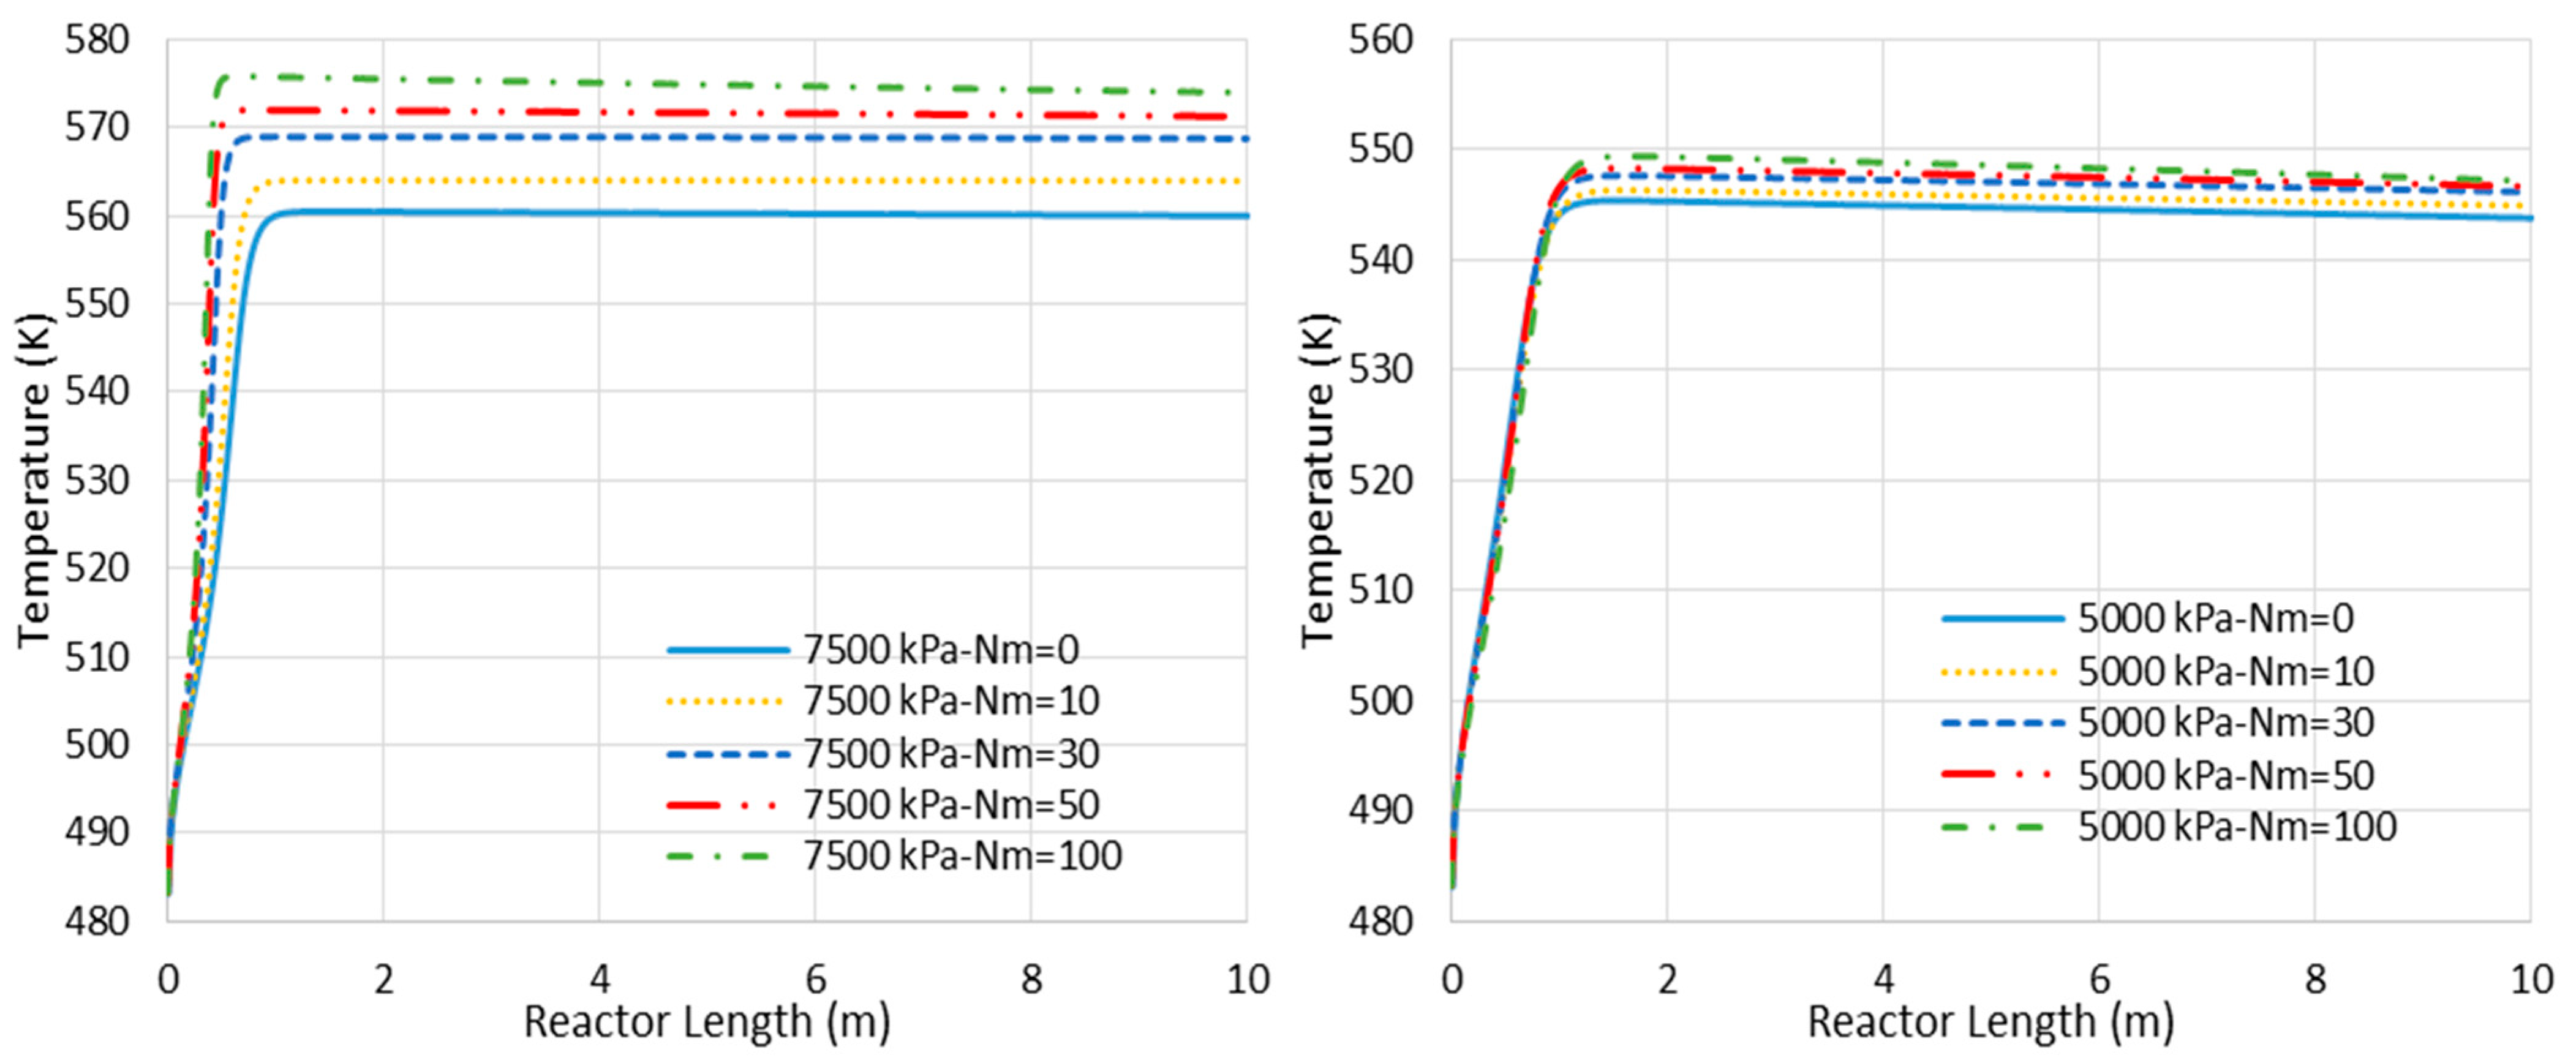
Higher loss of water from the reaction environment and the subsequent acceleration in temperature rise, as shown in Figure 4, which is not in a favor of the exothermic methanolation reaction.
(b)
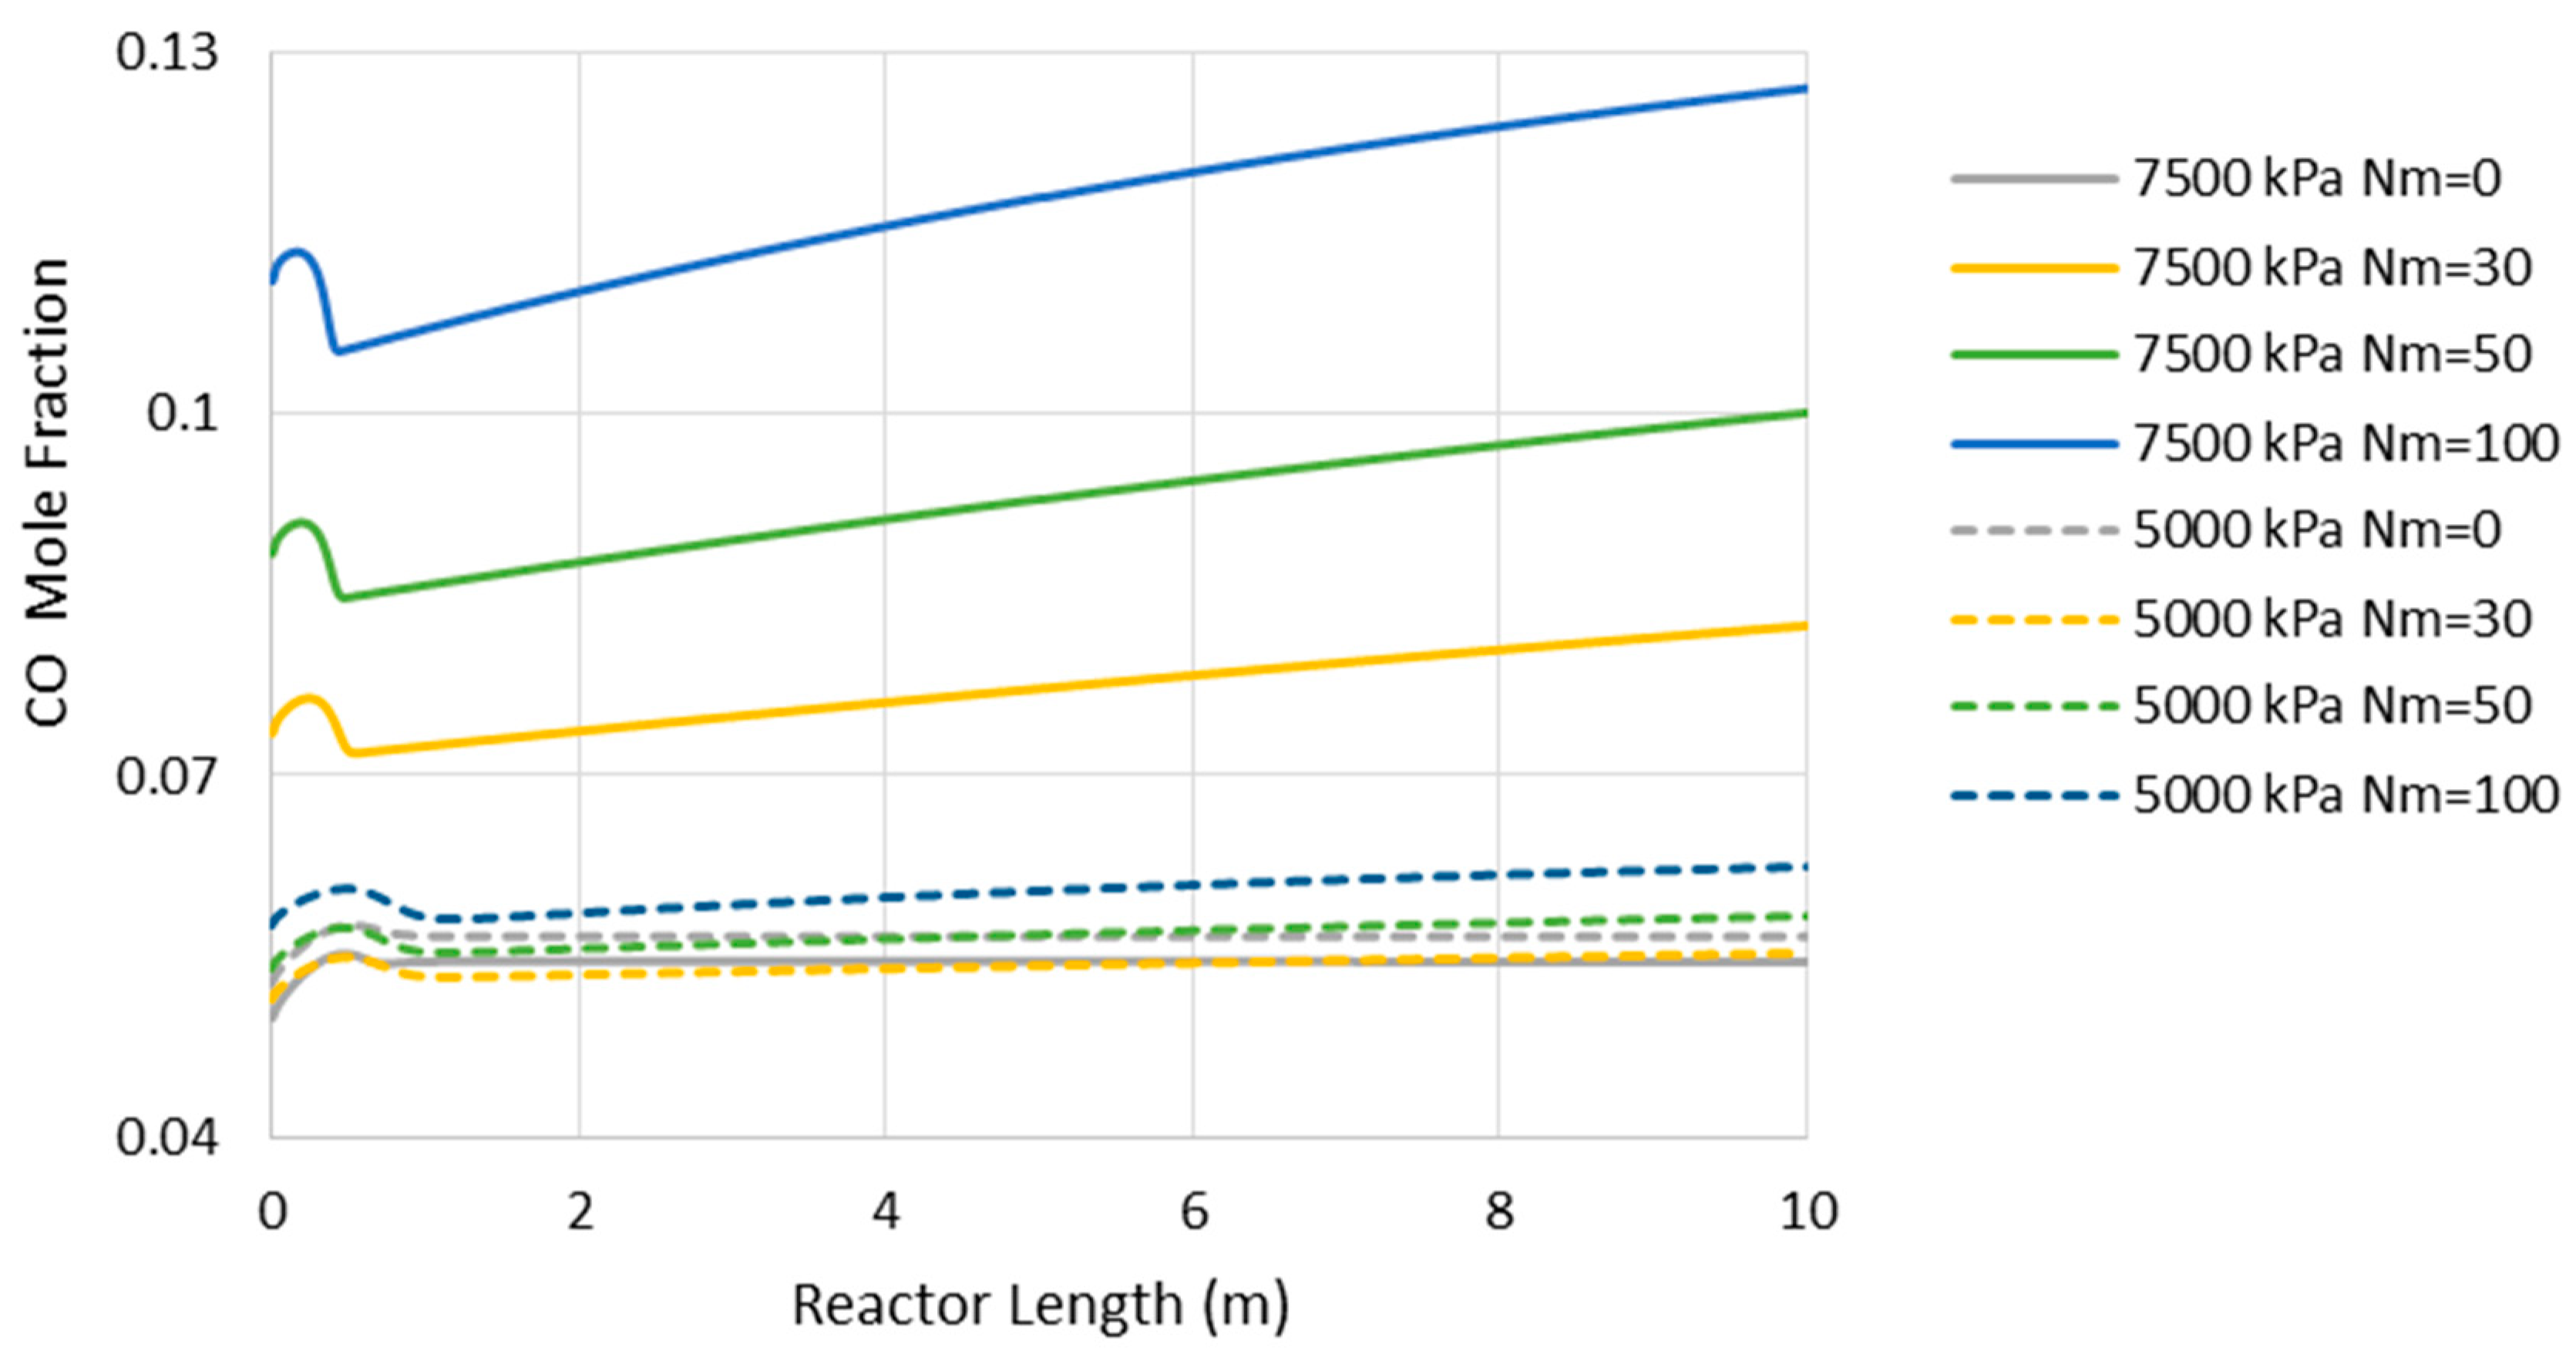
Reduction in CO2-to-methanol selectivity due to the aforementioned temperature rise and water removal [16] and, in turn, increase in CO concentration in the reactor environment, as presented in Figure 5. This increases the recompression power for the recycle.
(c)
Higher exergy destruction of water through the isenthalpic transmembrane process.
(d)
Losing reaction volume to accommodate more membrane tubes.
(e)
A higher reactor pressure drop due to the membrane volumetric occupancy.
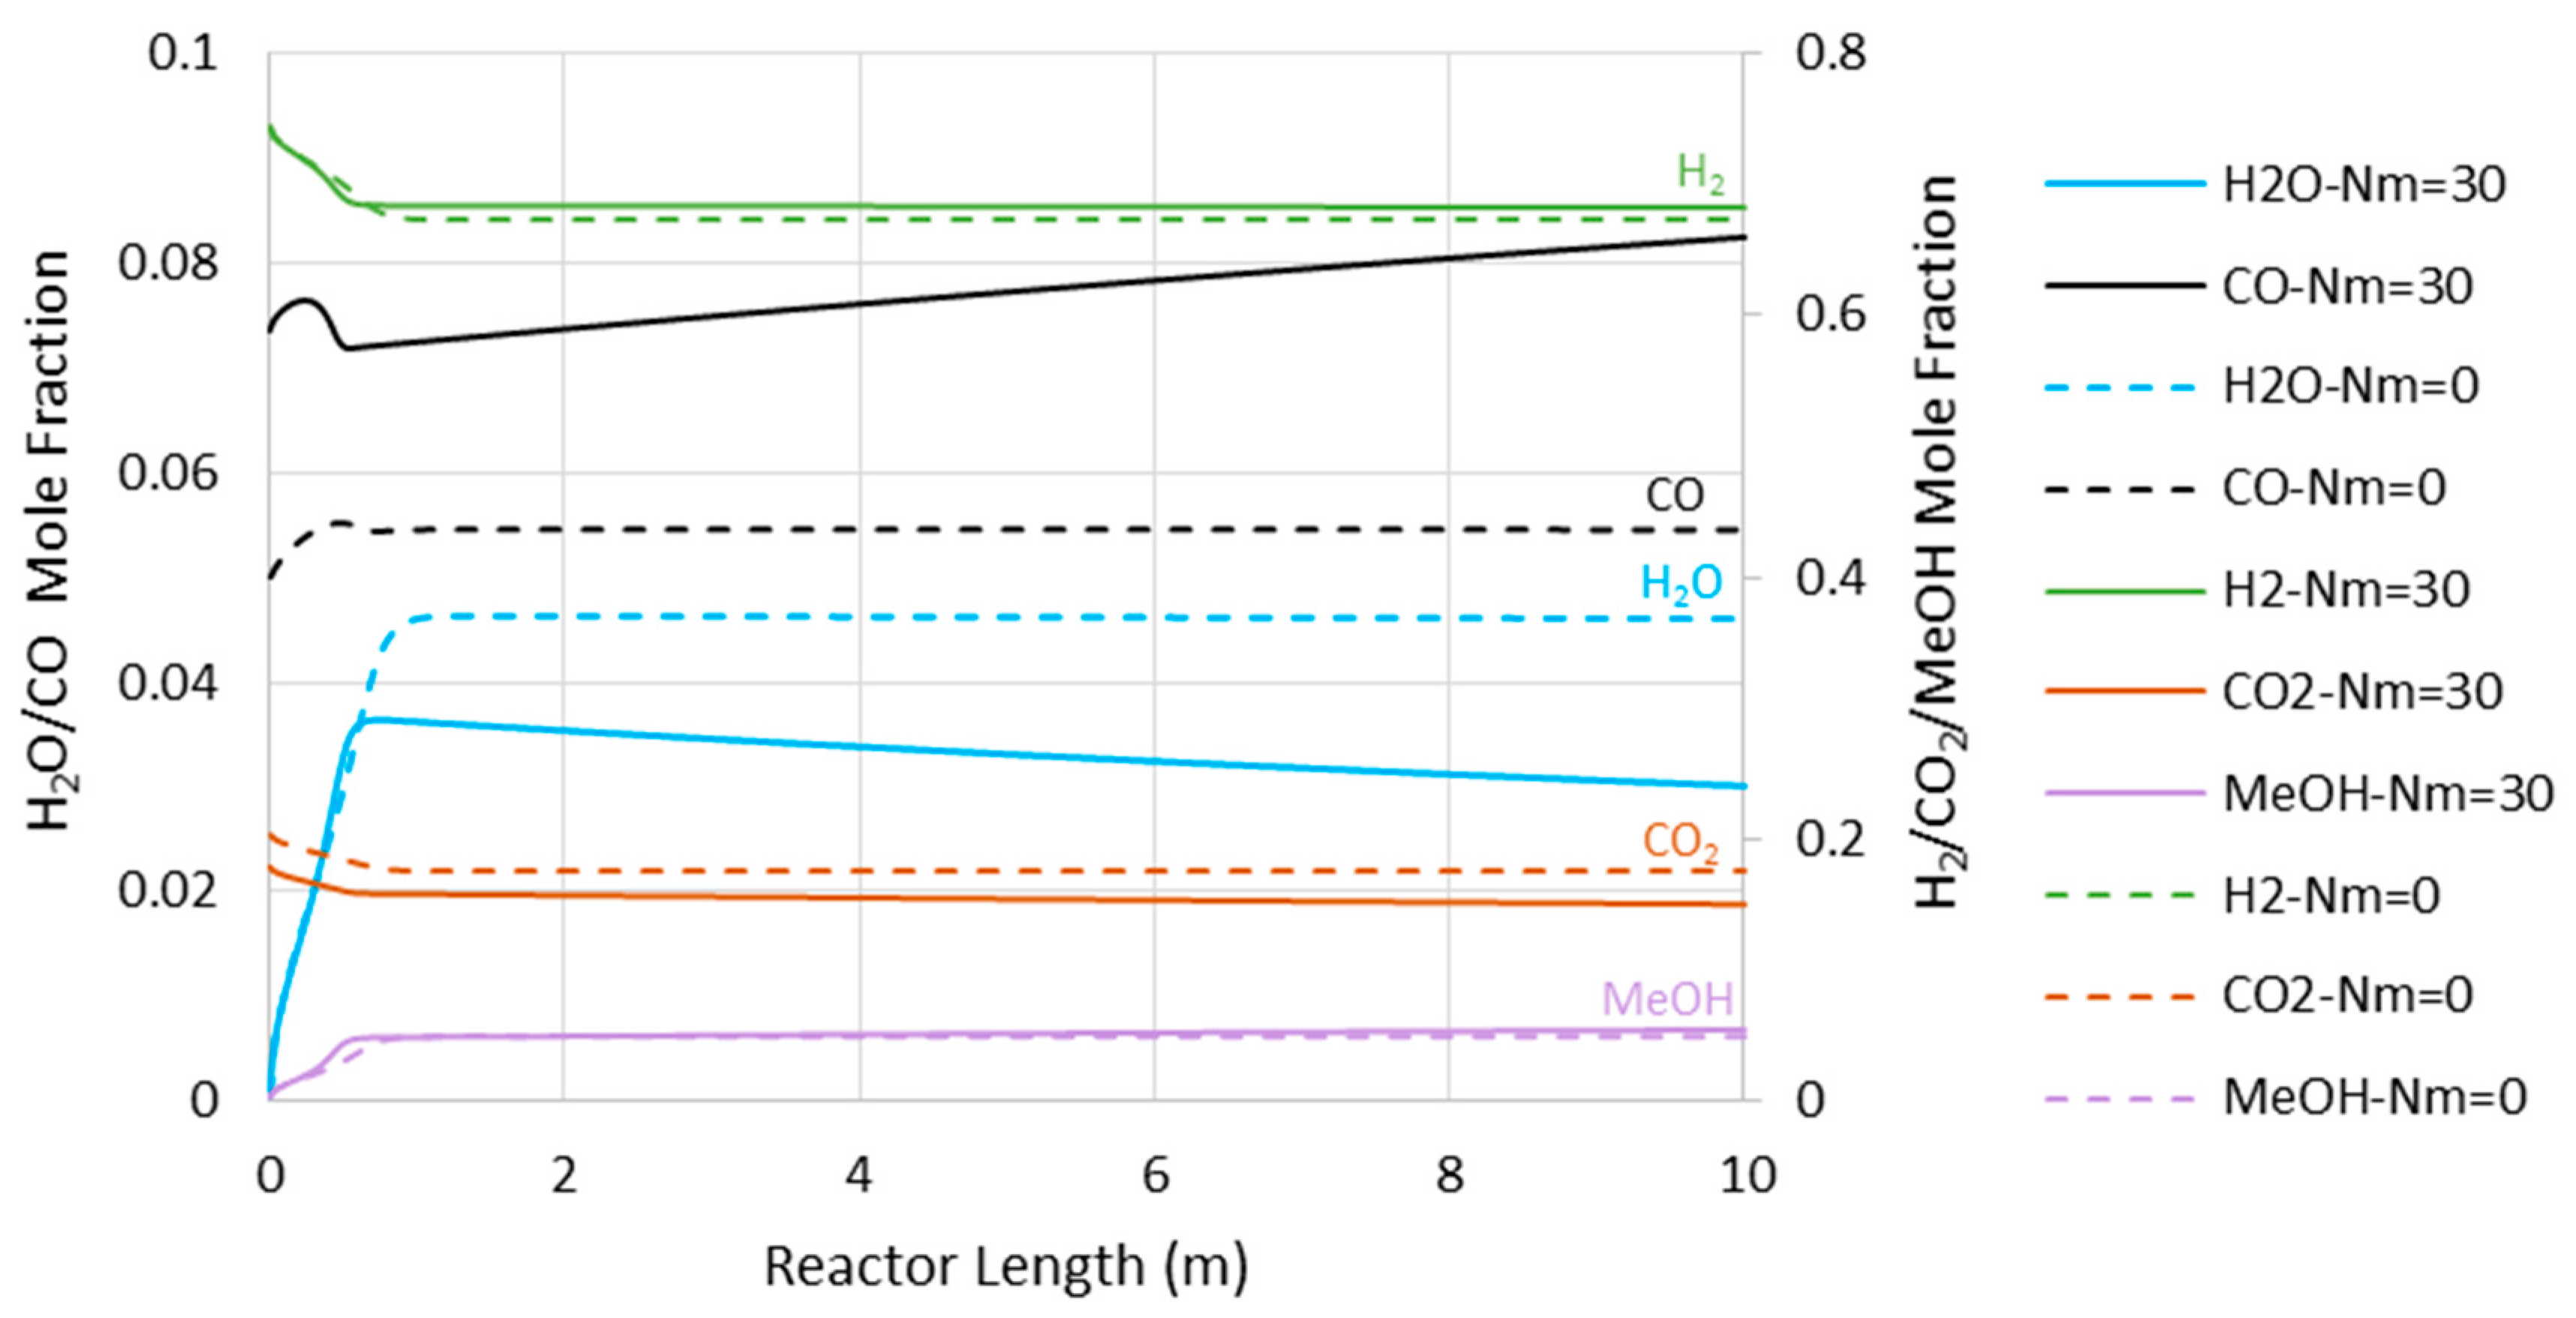
Figure 6 represents the concentration profiles for the existing species through the adiabatic CR and MR with Nm of 30 and 7500 kPa operating pressure (where the MR shows the highest impact). As shown, only the entrance section of the reactor is active. However, this active region of the reactor cannot be extended by the in situ water removal since the temperature rise as a dominating factor halts the reaction (see also Figure 4). After the temperature profile reaches 560 K for the CR and 569 K for the MR with Nm = 30, there are only slight changes in the species’ concentration, with some tendency toward CO production.

6.2. Isothermal MR-Based Process

Different heat transfer layouts, either proposed by the leading companies (Linde, Toyo, Methanol Casale, and Mitsubishi) or the literature, suggest various temperature profiles, from quasi-isothermal to adiabatic [22]. The optimal design of the heat transfer system takes a proper optimization investigation, which is out of the scope of the present work. However, in the previous section we realized that in an adiabatic MR the water removal amplifies the temperature rise, which curbs the positive impact of the membrane and inhibits the reaction. Consequently, if an MR avoids the adiabatic condition and approaches the isothermal operation, it should outperform the CR counterpart at highest. Therefore, we assume the isothermal reactor to ensure that we are on the safe side when proposing the minimal value for the lower limit of H2O/H2 selectivity.
Figure 7 demonstrates the power consumption and exergy production for the methanol synthesis process using isothermal CR and MRs. The power consumption/exergy production can be improved by 30%/8% and 32%/21% for the operating pressure of 5000 and 7500 kPa, respectively, in their best-case scenario where the respective Nm is optimal. Comparing with the adiabatic scenarios, we can conclude that if the MR operates in the isothermal mode at 7500 kPa, the highest possible savings can be achieved in both of the metrics.
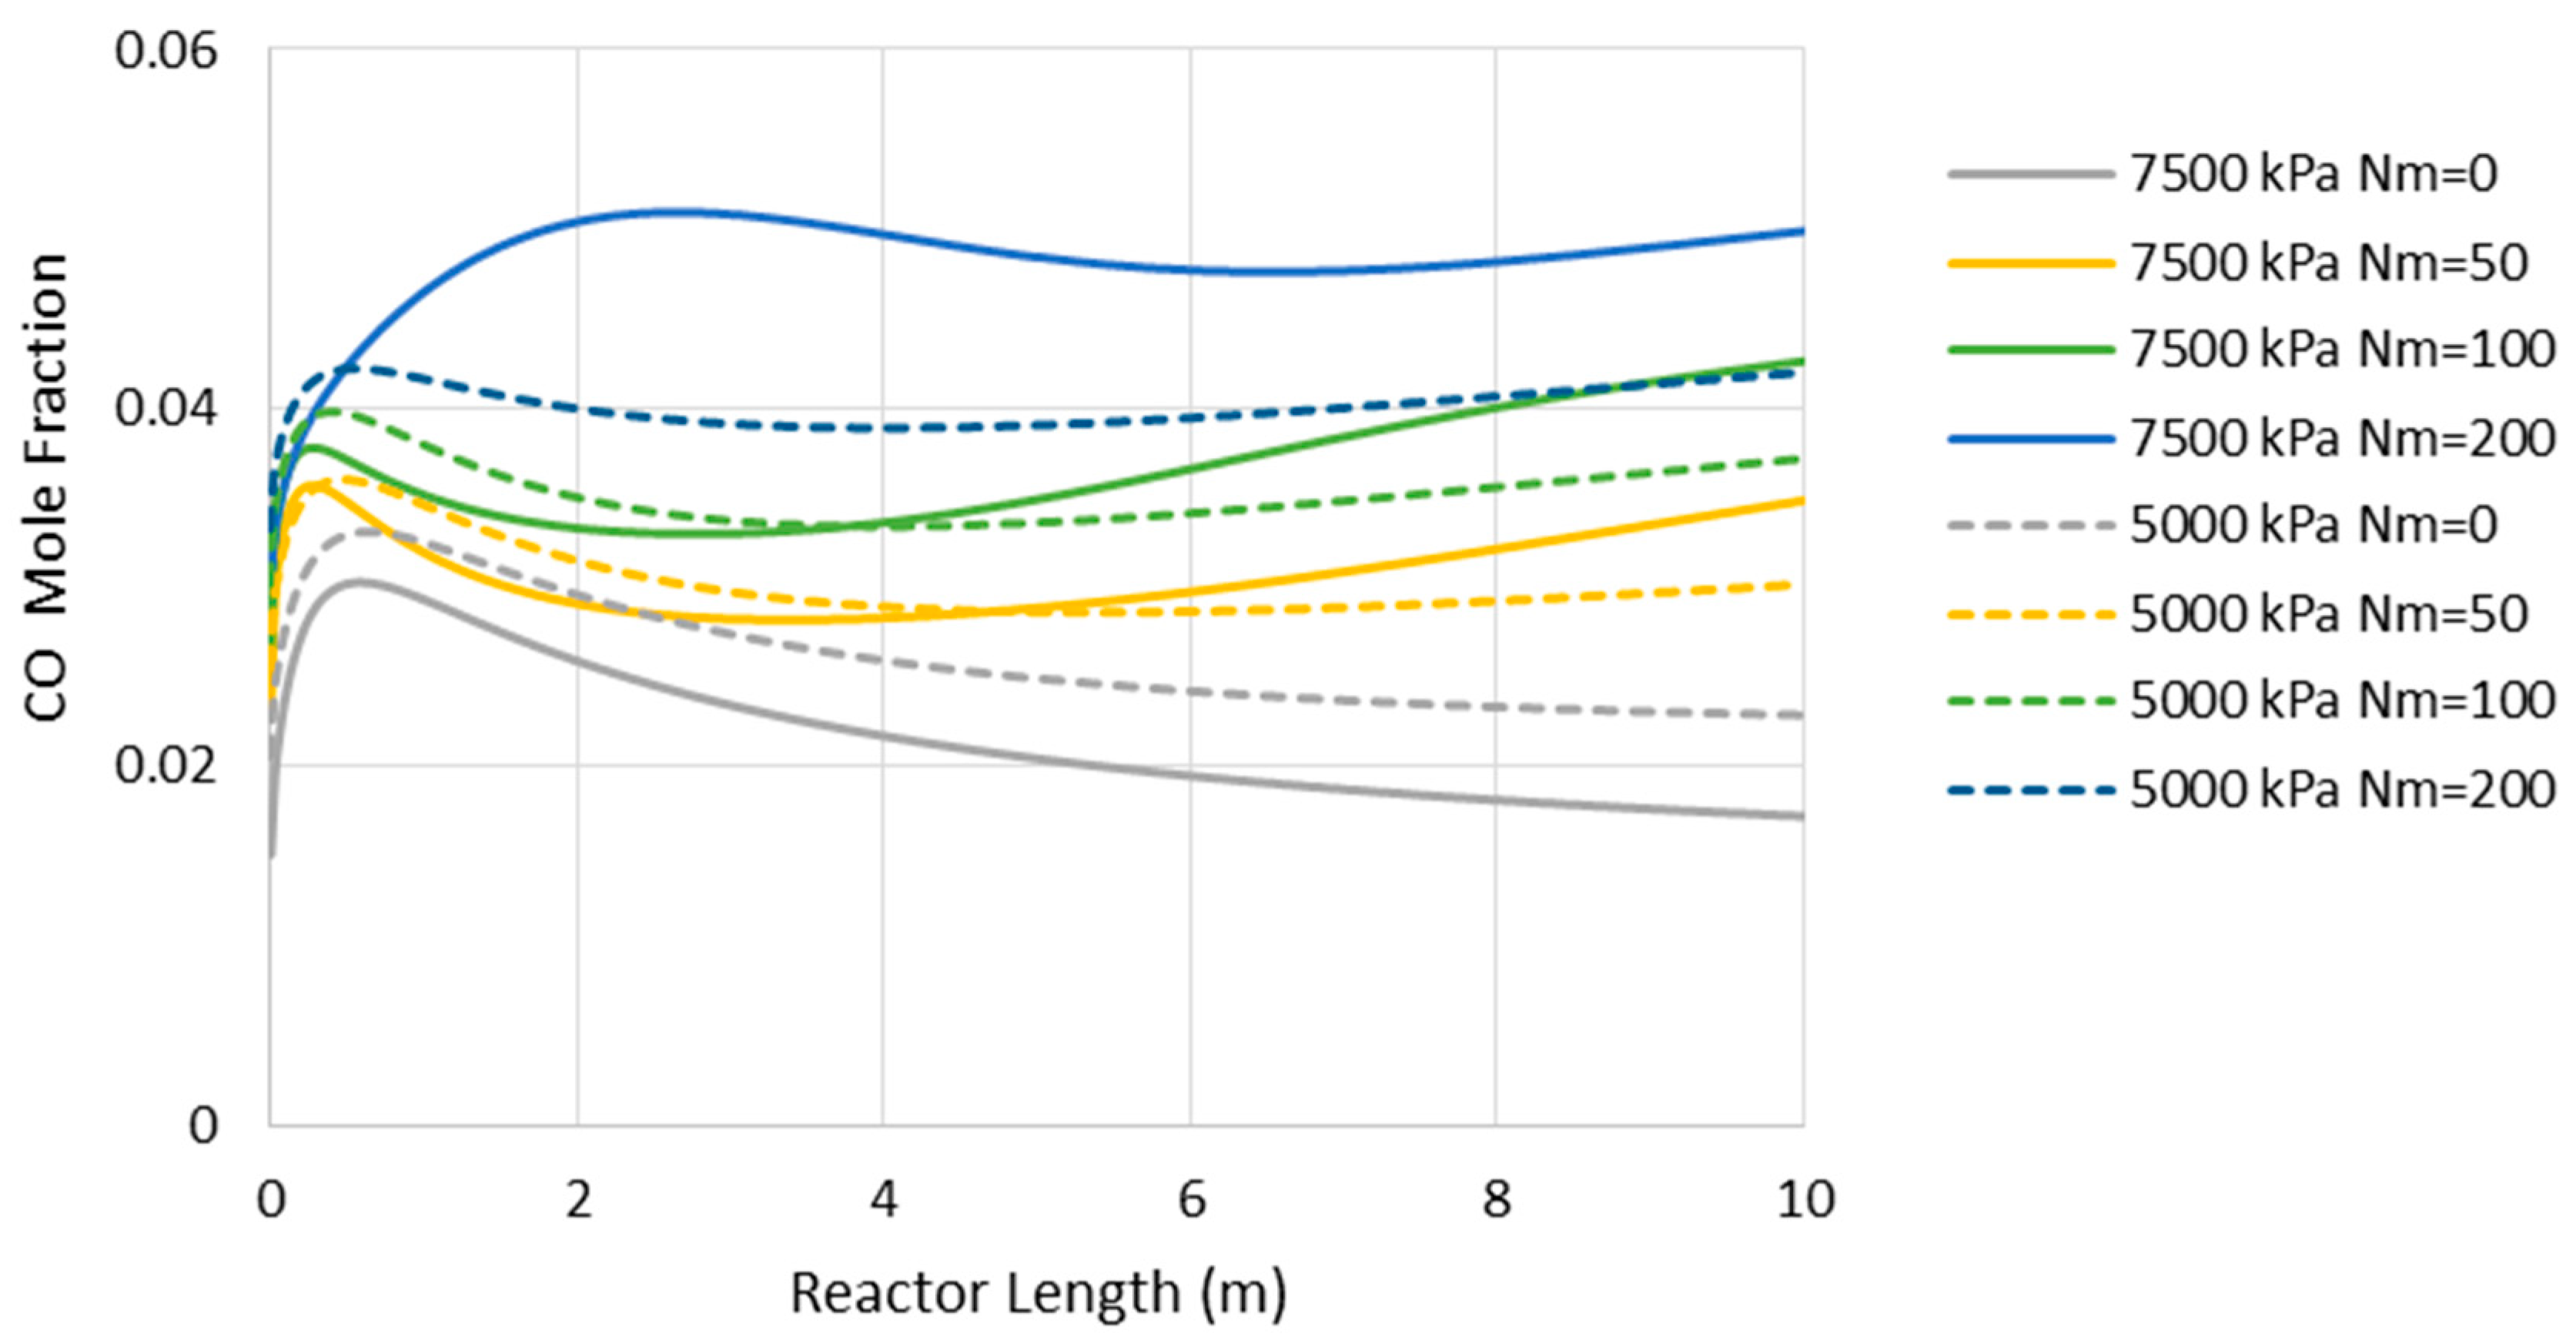
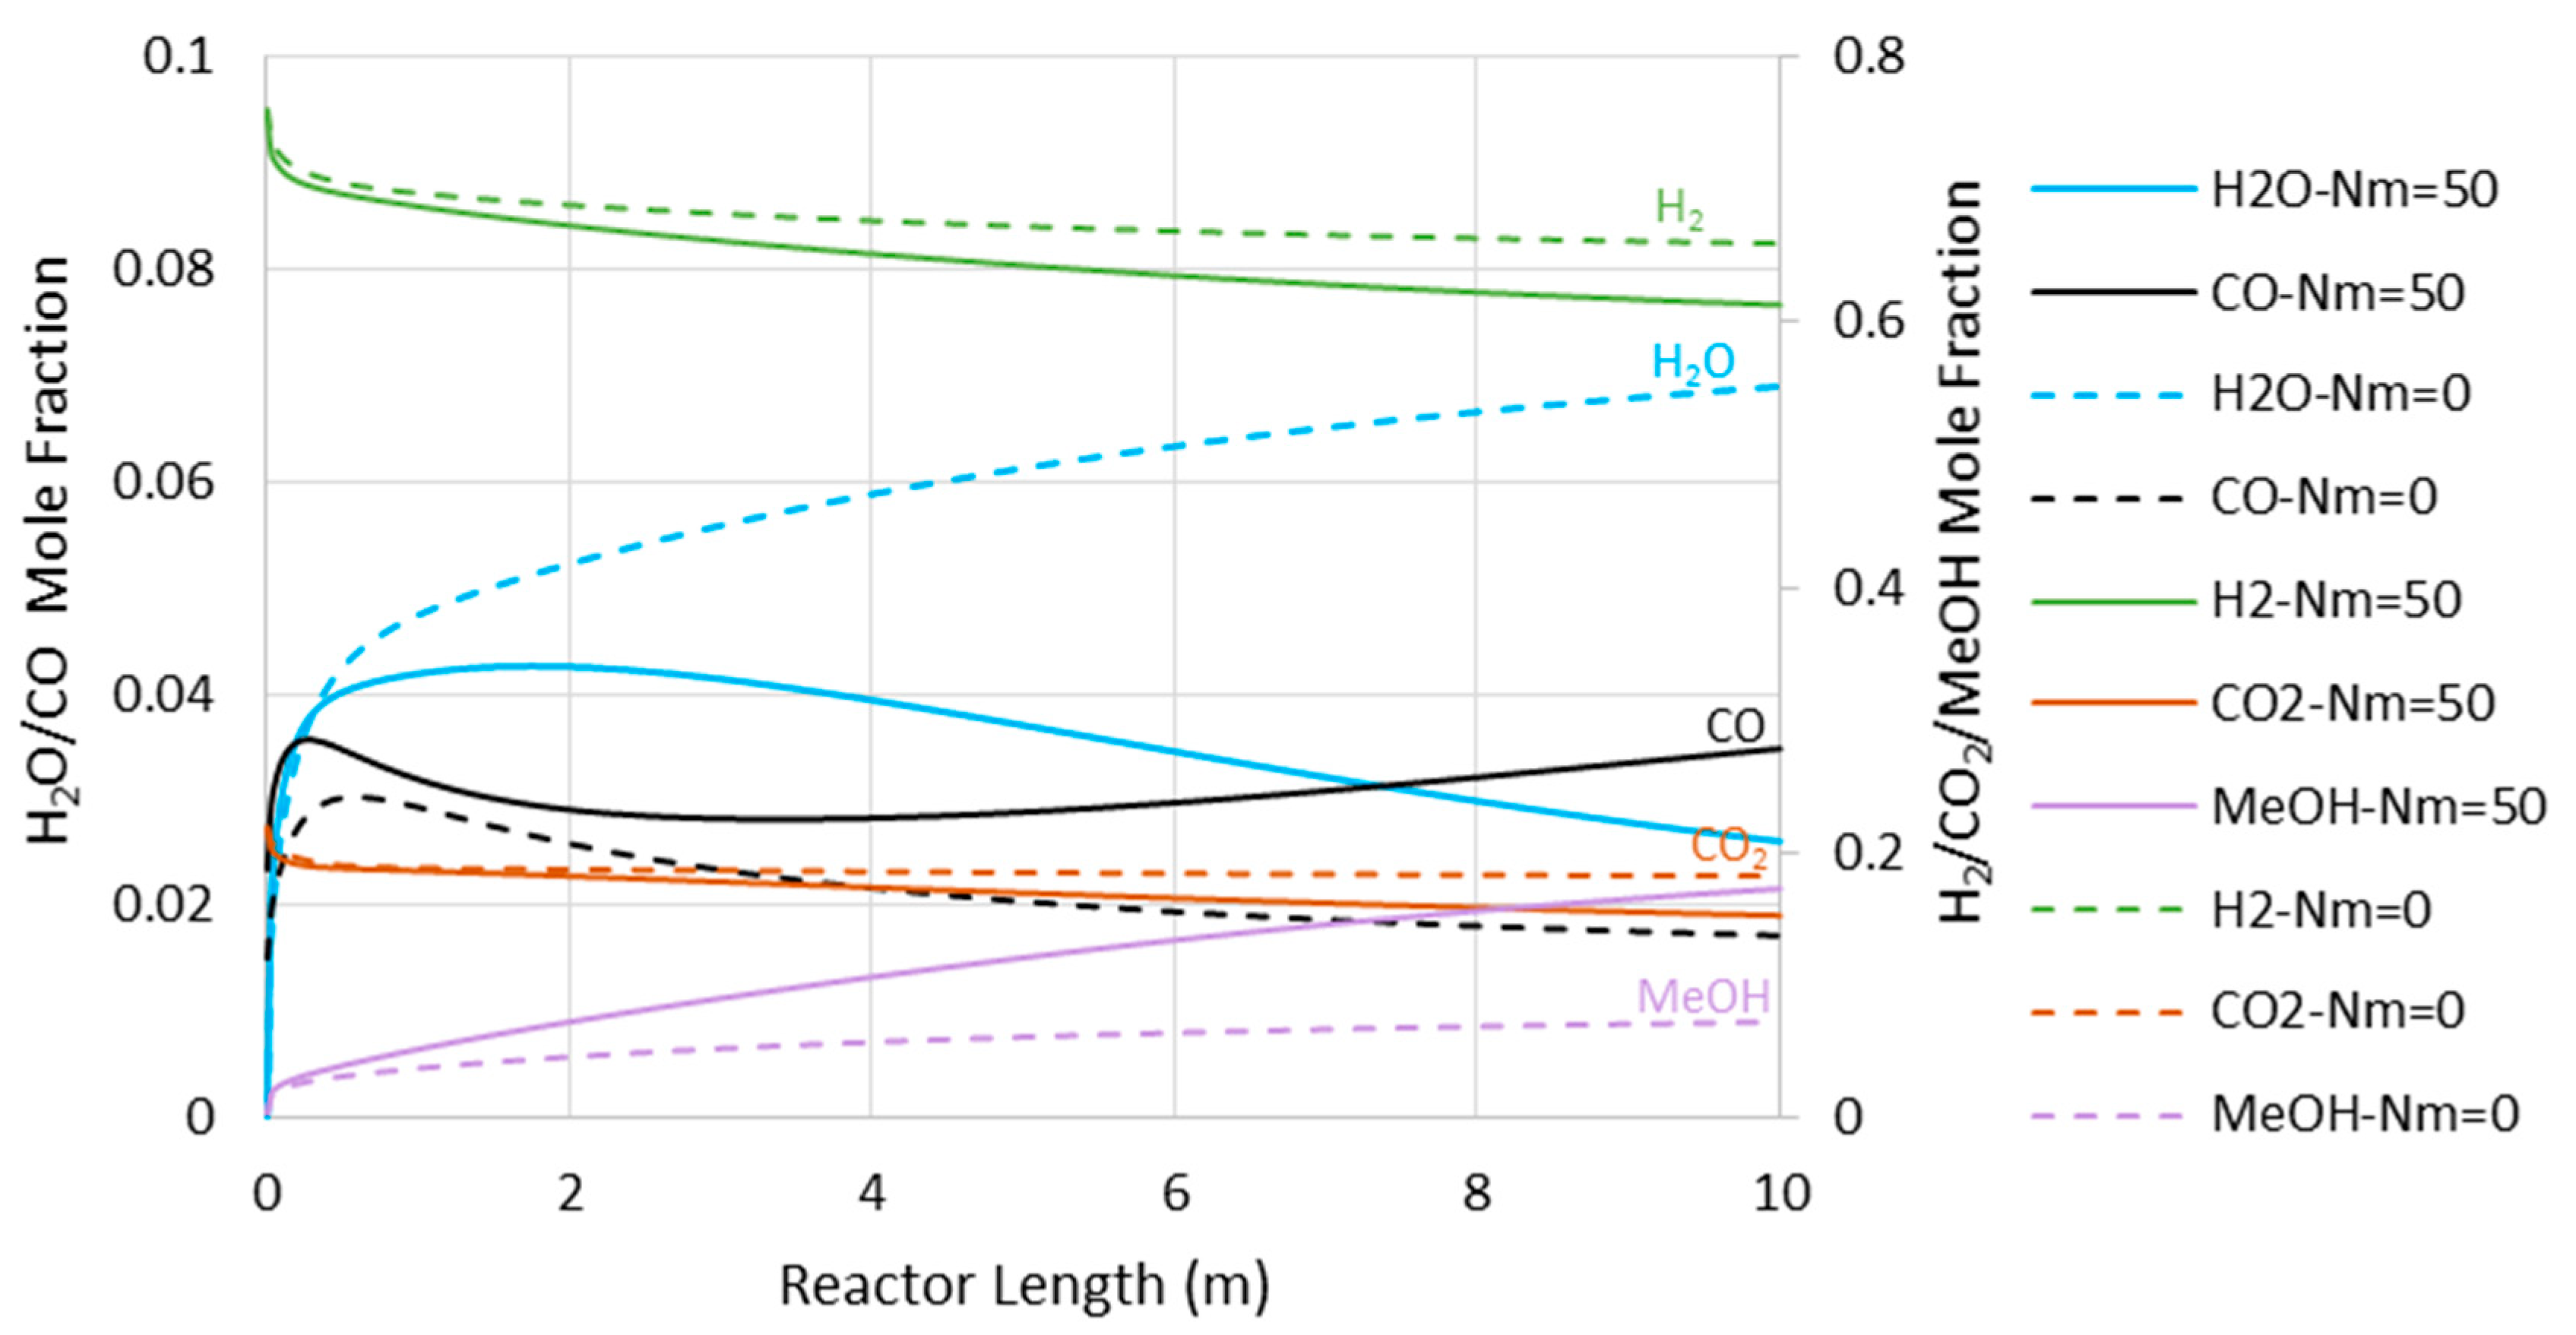
Figure 8 presents the CO concentration in the reactor’s feed versus Nm at the pressures of 5000 and 7500 kPa. Similar to the adiabatic scenario (Figure 5), the CO feed mole fraction increases (in other words, methanol selectivity decreases) with Nm. However, compared to the adiabatic cases, CO exists at much lower levels, implying higher methanol selectivity. The latter can also be confirmed by comparing Figure 6 and Figure 9, where the CO concentrations are shown throughout the reactor’s length. Moreover, in contrast to the adiabatic scenario, for the isothermal condition, the reactor’s active region significantly extends to the almost full reactor length by the use of membranes. Nevertheless, despite the continuous water removal and isothermal condition, the driving force for the reaction decreases throughout the reactor’s length due to the increases in methanol concentrations. According to Equation (4), the reaction rate drops as the methanol partial pressure increases.

6.3. Minimum Requirement for H2O/H2 Membrane Permselectivity

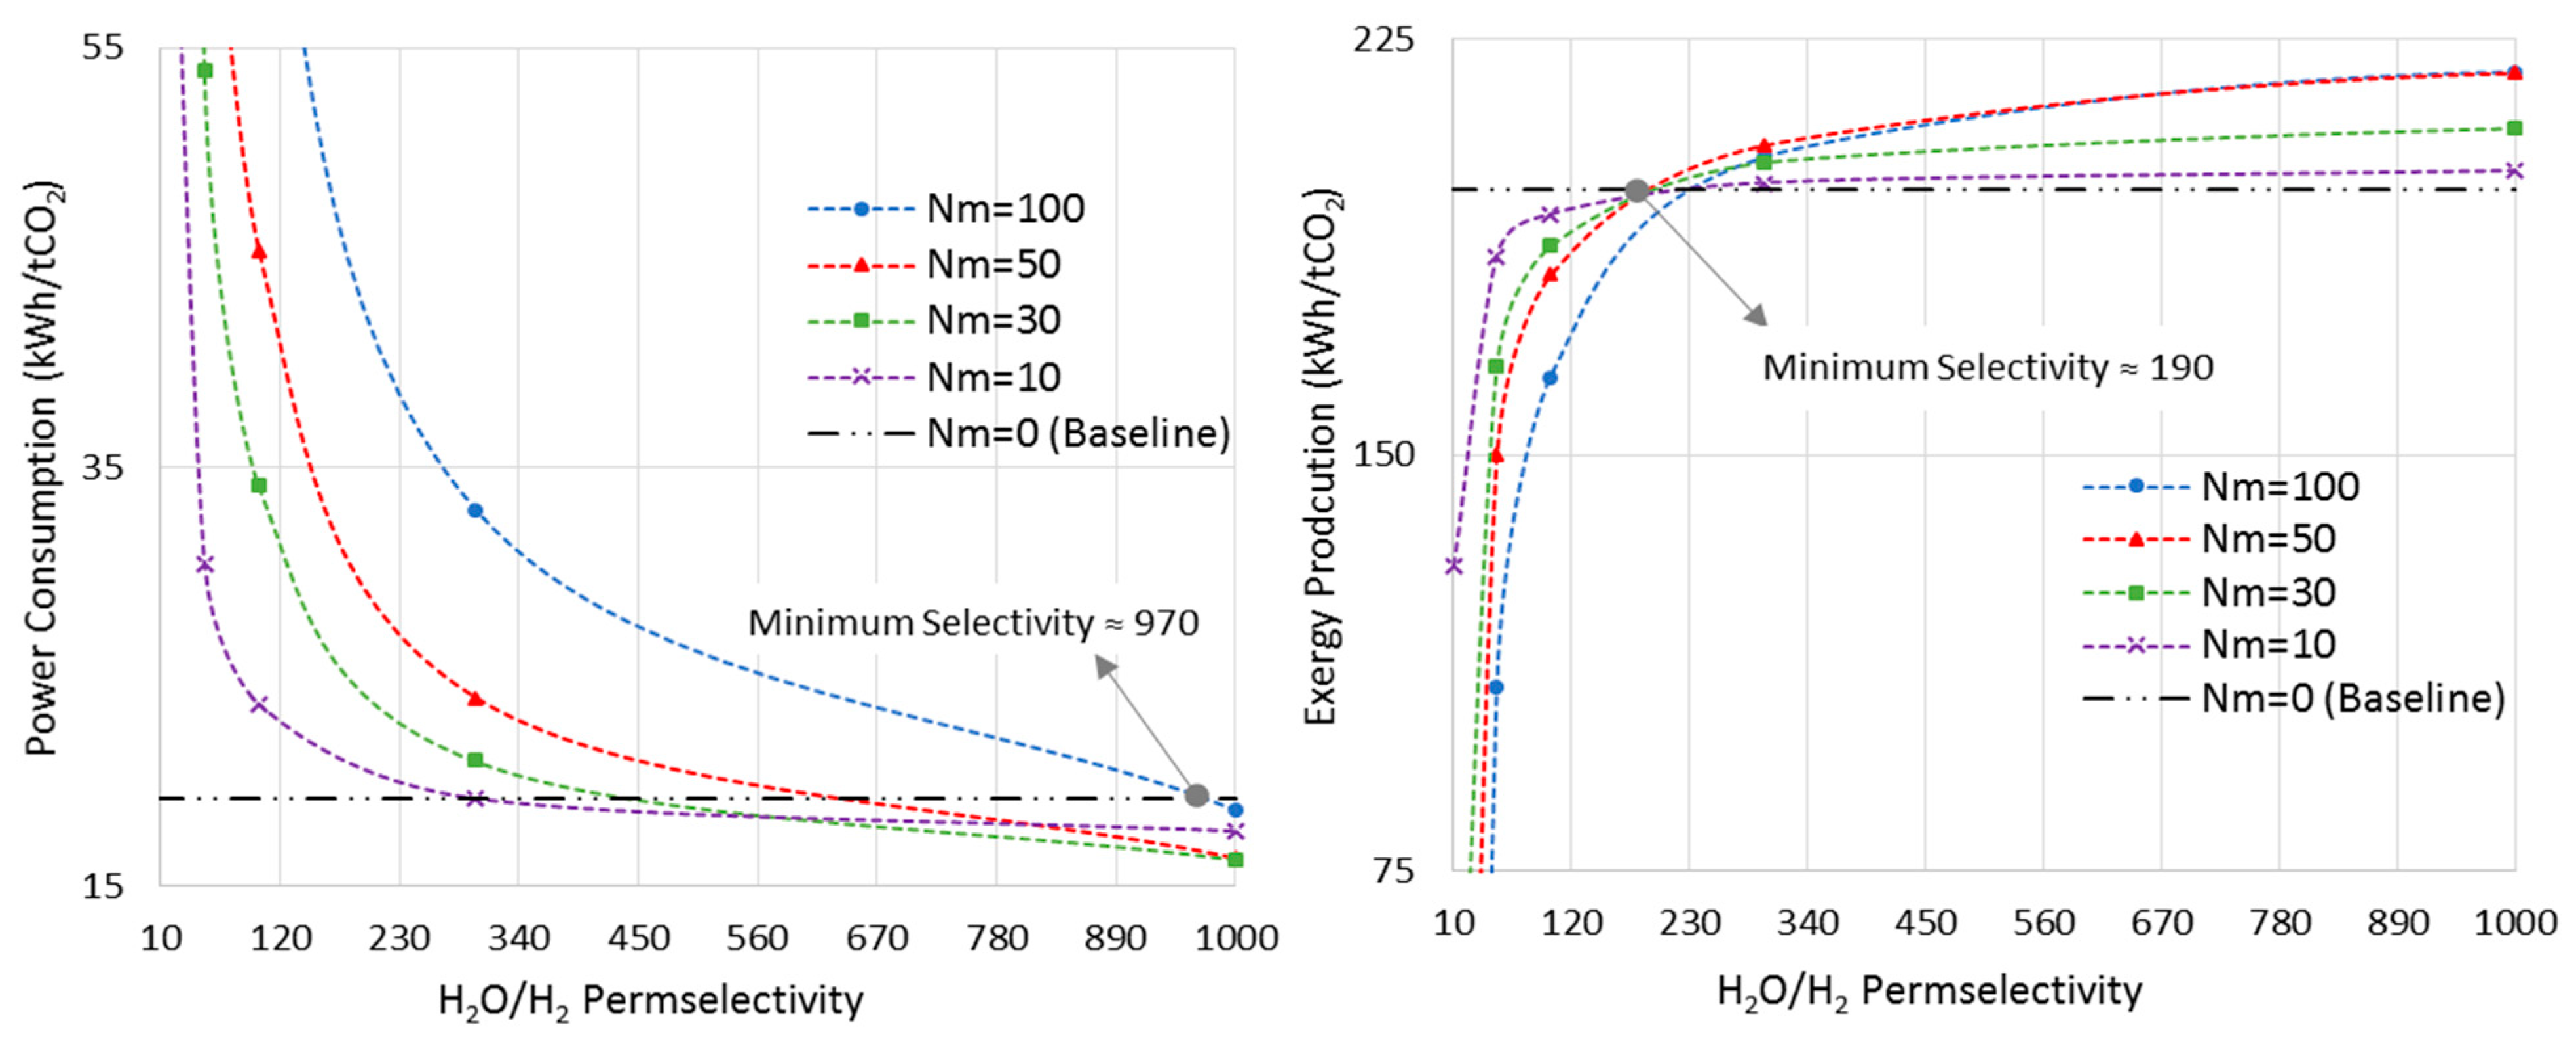
Figure 10 shows the power consumption and exergy production versus H2O/H2 permselectivity, in an isothermal MR-based process at the pressure of 7500 kPa, where the MRs showed the maximum improvements in both metrics (Section 6.2). As opposed to the last sections, in which the membrane was assumed to be permeable only to water, here we allow the H2O/H2 permselectivity to vary in order to realize the minimum requirement of this important parameter.
The CR-based process is considered the baseline. As earlier shown in Figure 7, at the pressure of 7500 kPa and the isothermal mode, the optimal Nm values are 100 and 50 for power consumption and exergy production, respectively. Thus, according to Figure 10, the minimum required H2O/H2 permselectivity is 970 and 190 when the power consumption and exergy production are taken into account, respectively. It is obvious that these are only the minimum values. However, in practice, since the MR-based process brings more complexity into the system, and the ideal isothermal condition may not be achieved in a large-scale reactor, this parameter should be much higher than its minimum in order for MR technology to be advantageous over the conventional design in terms of energy efficiency. Moreover, it is clear that the H2O/H2 permselectivity of polymeric and ceramic membranes, which is in the range of 1–10 [28], does not even satisfy the minimum requirement even though they enhance the standalone reactor’s conversion. To improve their selectivity, the latter calls for high-performance polymeric materials with a higher affinity toward water molecules at elevated temperatures or adoption of innovative techniques. Although zeolite membranes that have been utilized for methanol synthesis in the literature exhibit more promising characterizations for this application [9,27,28], their H2O/H2 permselectivities are still below the minimum. Moreover, H-SOD as the most promising zeolite-based membrane has been used for water separation at elevated temperatures only in theoretical works [12,28]. Hence, it still needs to be practically investigated under the methanol synthesis operating condition to study whether and to what extent H-SOD maintains its ideal molecular sieving feature.
According to Figure 10, as Nm decreases to lower values, there is less room for improvement. In other words, both power consumption and exergy production reach plateaus and show no improvements as the permselectivity increases.
Finally, considering the high values of the minimum required H2O/H2 permselectivity for this particular application, and the very small hydrogen kinetic diameter of 0.289 nm versus those of CO2, CH3OH, and CO with kinetic diameters of 3.3, 3.6, and 0.376 nm, respectively, the earlier assumption that the membrane is impermeable to the other existing species seems a fair conjecture.

7. Conclusions

MRs have established a proper niche in process intensification research for low conversion reaction system cases, including methanol synthesis. In this study, we compared MR-based and CR-based methanol production plants when the reactor pressure is in an industrial range of 5000–7500 kPa, using two key metrics of the “power consumption” and “exergy production”. We identified the conditions at which the use of MRs is more effective. The latter is the case when the MR operates in the isothermal condition and at higher pressures. For the best-case scenario of the adiabatic case, there were only 13% and 4% improvements in power consumption and exergy production, respectively, at the pressure of 7500 kPa. In contrast, for the isothermal mode, the power consumption/exergy production can be improved by 32% and 21 % at the same operating pressure, in the best-case scenario. Since an infinitely water-selective membrane with the permeance of 10−6 mol/(s m2 Pa) was assumed, these are the highest possible improvements in the process performance. We also showed that the minimum required H2O/H2 membrane permselectivity is 970 (190) by balancing the power consumption (exergy production) of the MR- and CR-based processes. This important information can shed light on future research directions. It is notable that since an MR brings more complexity into the system, these values are only considered as thresholds to make the MR-based process competitive with the CR-based counterpart. The current approach for the determination of the membrane’s minimum requirement is expected to be more broadly applied to the other membrane-reactor-aided processes proposed in the literature, such as syngas, methane, and Fischer–Tropsch syntheses.

Author Contributions

H.H. was involved in conceptualization, simulation, writing original draft preparation, and visualization; T.B. in conceptualization, review and editing, supervision, and project administration; S.S. in analysis, review and editing. All authors have read and agreed to the published version of the manuscript.

Funding

The Helmholtz Climate Initiative (HI-CAM) is funded by the Helmholtz Association’s Initiative and Networking Fund. The authors are responsible for the content of this publication.

Institutional Review Board Statement

Not applicable.

Informed Consent Statement

Not applicable.

Conflicts of Interest

There are no conflict to declare.

Nomenclature

Acronyms
CCUcarbon capture and utilization
CRconventional reactor
CFMFCO2 feed mass flowrate
FTFischer–Tropsch
H-SODhydroxy sodalite
LHTFliquid hydrocarbon transportation fuels
MOGDMobil olefins to gasoline and distillate
MRmembrane reactor
MTGmethanol to gasoline
Nmmembrane tube numbers
ORVoverall reactor volume
RWGSreverse water gas shift
tCO2tonne (metric ton) of CO2
TRLtechnology readiness level
Variables/Parameters
Exexergy production/consumption rate per CO2 feed mass flowrate (kWh/tCO2)
H enthalpy rate per CO2 feed mass flowrate (kWh/tCO2)
k reaction rate’s parameters
K eq 1 equilibrium constants for methanol reaction, Equation (7) (1/kPa2)
K eq 2 equilibrium constants for reverse water gas shift reaction, Equation (8)
ORV overall reactor volume (m3)
ppartial pressure (kPa)
r reaction rate (kmol/m3 h)
R universal gas constant (kJ/kmol K)
T temperature (K)
T ambient ambient temperature, 298.15 (K)
T reactor isothermal reactor temperature (K)
W compressor power per CO2 feed mass flowrate (kWh/tCO2)
ρ cat catalyst’s density (kg/m3)
ψ fixed bed porosity
Δ H reactor heat generation rate per CO2 feed mass flowrate for isothermal reactors (kWh/tCO2)

Appendix A

Figure A1. MR-based methanol production process flowsheet diagram simulated in Aspen HYSYS V11.
Membranes 11 00596 g0a1

References

  1. Chauvy, R.; Meunier, N.; Thomas, D.; De Weireld, G. Selecting emerging CO2 utilization products for short- to mid-term deployment. Appl. Energy 2019, 236, 662–680. [Google Scholar] [CrossRef]
  2. Garcia-Garcia, G.; Fernandez, M.C.; Armstrong, K.; Woolass, S.; Styring, P. Analytical review of life-cycle environmental impacts of carbon capture and utilization technologies. ChemSusChem 2021, 14, 995–1015. [Google Scholar] [CrossRef] [PubMed]
  3. Jarvis, S.M.; Samsatli, S. Technologies and infrastructures underpinning future CO2 value chains: A comprehensive review and comparative analysis. Renew. Sustain. Energy Rev. 2018, 85, 46–68. [Google Scholar] [CrossRef]
  4. Vo, C.H.; Mondelli, C.; Hamedi, H.; Pérez-Ramírez, J.; Farooq, S.; Karimi, I.A. Sustainability assessment of thermocatalytic conversion of CO2 to transportation fuels, methanol, and 1-propanol. ACS Sustain. Chem. Eng. 2021. [Google Scholar] [CrossRef]
  5. Struis, R.P.W.J.; Stucki, S.; Wiedorn, M. A membrane reactor for methanol synthesis. J. Membr. Sci. 1996, 113, 93–100. [Google Scholar] [CrossRef]
  6. Barbieri, G.; Marigliano, G.; Golemme, G.; Drioli, E. Simulation of CO2 hydrogenation with ch3oh removal in a zeolite membrane reactor. Chem. Eng. J. 2002, 85, 53–59. [Google Scholar] [CrossRef]
  7. Chen, G.; Yuan, Q. Methanol synthesis from CO2 using a silicone rubber/ceramic composite membrane reactor. Sep. Purif. Technol. 2004, 34, 227–237. [Google Scholar] [CrossRef]
  8. Gallucci, F.; Paturzo, L.; Basile, A. An experimental study of CO2 hydrogenation into methanol involving a zeolite membrane reactor. Chem. Eng. Process. Process. Intensif. 2004, 43, 1029–1036. [Google Scholar] [CrossRef]
  9. Raso, R.; Tovar, M.; Lasobras, J.; Herguido, J.; Kumakiri, I.; Araki, S.; Menéndez, M. Zeolite membranes: Comparison in the separation of H2O/H2/CO2 mixtures and test of a reactor for CO2 hydrogenation to methanol. Catal. Today 2020, 364, 270–275. [Google Scholar] [CrossRef]
  10. Yue, W.; Li, Y.; Wei, W.; Jiang, J.; Caro, J.; Huang, A. Highly selective CO2 conversion to methanol in a bifunctional zeolite catalytic membrane reactor. Angew. Chem. Int. Ed. 2021, 60, 18289–18294. [Google Scholar] [CrossRef]
  11. Juarez, E.; Lasobras, J.; Soler, J.; Herguido, J.; Menéndez, M. Polymer–ceramic composite membranes for water removal in membrane reactors. Membranes 2021, 11, 472. [Google Scholar] [CrossRef] [PubMed]
  12. Diban, N.; Aguayo, A.T.; Bilbao, J.; Urtiaga, A.; Ortiz, I. Membrane reactors for in situ water removal: A review of applications. Ind. Eng. Chem. Res. 2013, 52, 10342–10354. [Google Scholar] [CrossRef]
  13. Dzuryk, S.; Rezaei, E. Intensification of the reverse water gas shift reaction by water-permeable packed-bed membrane reactors. Ind. Eng. Chem. Res. 2020, 59, 18907–18920. [Google Scholar] [CrossRef]
  14. Saeidi, S.; Najari, S.; Hessel, V.; Wilson, K.; Keil, F.J.; Concepción, P.; Suib, S.L.; Rodrigues, A.E. Recent advances in CO2 hydrogenation to value-added products—Current challenges and future directions. Prog. Energy Combust. Sci. 2021, 85, 100905. [Google Scholar] [CrossRef]
  15. Brunetti, A.; Migliori, M.; Cozza, D.; Catizzone, E.; Giordano, G.; Barbieri, G. Methanol conversion to dimethyl ether in catalytic zeolite membrane reactors. ACS Sustain. Chem. Eng. 2020, 8, 10471–10479. [Google Scholar] [CrossRef]
  16. Hamedi, H.; Brinkmann, T. Rigorous and customizable 1d simulation framework for membrane reactors to, in principle, enhance synthetic methanol production. ACS Sustain. Chem. Eng. 2021, 9, 7620–7629. [Google Scholar] [CrossRef]
  17. Van-Dal, É.S.; Bouallou, C. Design and simulation of a methanol production plant from CO2 hydrogenation. J. Clean. Prod. 2013, 57, 38–45. [Google Scholar] [CrossRef]
  18. Qadir, S.; Hussain, A.; Ahsan, M. A computational fluid dynamics approach for the modeling of gas separation in membrane modules. Processes 2019, 7, 420. [Google Scholar] [CrossRef] [Green Version]
  19. Giacinti Baschetti, M.; De Angelis, M.G. 8-vapour permeation modelling. In Pervaporation, Vapour Permeation and Membrane Distillation; Basile, A., Figoli, A., Khayet, M., Eds.; Woodhead Publishing: Oxford, UK, 2015; pp. 203–246. [Google Scholar]
  20. Poto, S.; Gallucci, F.; Fernanda Neira d’Angelo, M. Direct conversion of CO2 to dimethyl ether in a fixed bed membrane reactor: Influence of membrane properties and process conditions. Fuel 2021, 302, 121080. [Google Scholar] [CrossRef]
  21. Bussche, K.M.V.; Froment, G.F. A steady-state kinetic model for methanol synthesis and the water gas shift reaction on a commercial cu/zno/al2o3catalyst. J. Catal. 1996, 161, 1–10. [Google Scholar] [CrossRef]
  22. Dieterich, V.; Buttler, A.; Hanel, A.; Spliethoff, H.; Fendt, S. Power-to-liquid via synthesis of methanol, dme or fischer–tropsch-fuels: A review. Energy Environ. Sci. 2020, 13, 3207–3252. [Google Scholar] [CrossRef]
  23. Mignard, D.; Sahibzada, M.; Duthie, J.M.; Whittington, H.W. Methanol synthesis from flue-gas CO2 and renewable electricity: A feasibility study. Int. J. Hydrogen Energy 2003, 28, 455–464. [Google Scholar] [CrossRef]
  24. Leonzio, G. Mathematical modeling of a methanol reactor by using different kinetic models. J. Ind. Eng. Chem. 2020, 85, 130–140. [Google Scholar] [CrossRef]
  25. Wang, N.; Liu, Y.; Huang, A.; Caro, J. Hydrophilic sod and lta membranes for membrane-supported methanol, dimethylether and dimethylcarbonate synthesis. Microporous Mesoporous Mater. 2015, 207, 33–38. [Google Scholar] [CrossRef]
  26. Wang, N.; Liu, Y.; Huang, A.; Caro, J. Supported sod membrane with steam selectivity by a two-step repeated hydrothermal synthesis. Microporous Mesoporous Mater. 2014, 192, 8–13. [Google Scholar] [CrossRef]
  27. Sawamura, K.-I.; Shirai, T.; Takada, M.; Sekine, Y.; Kikuchi, E.; Matsukata, M. Selective permeation and separation of steam from water–methanol–hydrogen gas mixtures through mordenite membrane. Catal. Today 2008, 132, 182–187. [Google Scholar] [CrossRef]
  28. Rohde, M.P.; Schaub, G.; Khajavi, S.; Jansen, J.C.; Kapteijn, F. Fischer–tropsch synthesis with in situ H2O removal–Directions of membrane development. Microporous Mesoporous Mater. 2008, 115, 123–136. [Google Scholar] [CrossRef]
  29. Escorihuela, S.; Tena, A.; Shishatskiy, S.; Escolástico, S.; Brinkmann, T.; Serra, J.M.; Abetz, V. Gas separation properties of polyimide thin films on ceramic supports for high temperature applications. Membranes 2018, 8, 16. [Google Scholar] [CrossRef] [PubMed] [Green Version]
  30. Weigelt, F.; Escorihuela, S.; Descalzo, A.; Tena, A.; Escolástico, S.; Shishatskiy, S.; Serra, J.M.; Brinkmann, T. Novel polymeric thin-film composite membranes for high-temperature gas separations. Membranes 2019, 9, 51. [Google Scholar] [CrossRef] [Green Version]
  31. Khajavi, S.; Jansen, J.C.; Kapteijn, F. Application of hydroxy sodalite films as novel water selective membranes. J. Membr. Sci. 2009, 326, 153–160. [Google Scholar] [CrossRef]
  32. Rahimpour, M.R.; Mirvakili, A.; Paymooni, K. A novel water perm-selective membrane dual-type reactor concept for fischer–tropsch synthesis of gtl (gas to liquid) technology. Energy 2011, 36, 1223–1235. [Google Scholar] [CrossRef]
  33. El Sibai, A.; Rihko Struckmann, L.K.; Sundmacher, K. Model-based optimal sabatier reactor design for power-to-gas applications. Energy Technol. 2017, 5, 911–921. [Google Scholar] [CrossRef]
  34. Hamedi, H.; Karimi, I.A.; Gundersen, T. Simulation-based approach for integrating work within heat exchange networks for sub-ambient processes. Energy Convers. Manag. 2020, 203, 112276. [Google Scholar] [CrossRef]
Figure 1. Carbon utilization pathways via thermocatalytic conversion with Technology Readiness Levels (TRLs) (blurred to sharp fonts denote low to high TRLs).
Membranes 11 00596 g001
Figure 2. Process flow diagram for a methanol production plant aided with a water-selective membrane reactor (MR).
Membranes 11 00596 g002
Figure 3. Comparison between adiabatic conventional reactors (CR) and MR-based processes with different membrane tube numbers using power consumption and exergy production (Nm = 0 corresponds to CR).
Membranes 11 00596 g003
Figure 4. Temperature profile changes for CR- and MR-based processes with different membrane tube numbers (Nm) (Nm = 0 corresponds to CR).
Membranes 11 00596 g004
Figure 5. Carbon monoxide (CO) mole fraction through the adiabatic reactor’s length (Nm = 0 corresponds to CR).
Membranes 11 00596 g005
Figure 6. Species’ concentration profiles through the adiabatic reactor’s length at 7500 kPa (Nm = 0 corresponds to CR).
Membranes 11 00596 g006
Figure 7. Comparison between isothermal CR- and MR-based processes with different membrane tube numbers using power consumption and exergy production (Nm = 0 corresponds to CR).
Membranes 11 00596 g007
Figure 8. CO mole fraction through the isothermal reactor length (Nm = 0 corresponds to CR).
Membranes 11 00596 g008
Figure 9. Species’ concentration profiles through the isothermal reactor length at 7500 kPa (Nm = 0 corresponds to CR).
Membranes 11 00596 g009
Figure 10. Power consumption/exergy production for isothermal-MR-based process at 7500 kPa with different Nm versus H2O/H2 permselectivity.
Membranes 11 00596 g010
Table 1. Kinetic parameters for Equations (4)–(8) [16].
ParametersValue
A1, kmol/(h kPa2 kgcat)3.852 × 10⁻⁴
B1, kJ/kmol40,000
A23453.38
B2, kJ/kmol0
A3, kmol/(h kPa0.5 kgcat)4.99 × 10⁻²
B3, kJ/kmol17,197
A4, kmol/(h kPa kgcat)6.62 × 10⁻¹³
B4, kJ/kmol124,119
A5, kmol/(h kPa kgcat)4.392 × 10⁸
B5, kJ/kmol−98,084
Table 2. Design data and specifications.
ParametersValue
CO2 feed flowrate, kmol/h50
H2/CO2 feed ratio2.974
H2/CO2 feed temperature, K308
H2/CO2 feed pressure, kPa5020 and 7520
reactor feed pressure, kPa5000 and 7500
reactor’s inlet temperature for adiabatic reactors, K483.15
reactor’s inlet temperature for nonadiabatic reactors, K513.15
heat exchanger pressure drop, kPa20
separator pressure drop, kPa0
water product purity %≥99.0
methanol product purity %99.0
reactor length, m10.0
reactor diameter, m1.0
membrane water permeance, mol/(s m2 Pa)10−6
membrane tube diameter, m0.05
catalyst particle diameter, m0.002
apparent catalyst density, kgcat/m3cat1775
porosity0.4
sphericity1.0
number of distillation column trays 20
feed tray number for distillation column10
ambient temperature, K298.15
Publisher’s Note: MDPI stays neutral with regard to jurisdictional claims in published maps and institutional affiliations.