Article

The Functional Significance of Hydrophobic Residue Distribution in Bacterial Beta-Barrel Transmembrane Proteins

1
Department of Bioinformatics and Telemedicine, Jagiellonian University Medical College, Medyczna 7, 30-688 Kraków, Poland
2
Institute of Computer Science, Silesian University of Technology, Akademicka 16, 44-100 Gliwice, Poland
3
Medical College, Jagiellonian University, Kopernika 7, 31-034 Kraków, Poland
*
Author to whom correspondence should be addressed.
Membranes 2021, 11(8), 580; https://doi.org/10.3390/membranes11080580
Submission received: 18 June 2021 / Revised: 25 July 2021 / Accepted: 27 July 2021 / Published: 30 July 2021
(This article belongs to the Collection Feature Papers in Membranes in Life Sciences)

Abstract

:
β-barrel membrane proteins have several important biological functions, including transporting water and solutes across the membrane. They are active in the highly hydrophobic environment of the lipid membrane, as opposed to soluble proteins, which function in a more polar, aqueous environment. Globular soluble proteins typically have a hydrophobic core and a polar surface that interacts favorably with water. In the fuzzy oil drop (FOD) model, this distribution is represented by the 3D Gauss function (3DG). In contrast, membrane proteins expose hydrophobic residues on the surface, and, in the case of ion channels, the polar residues face inwards towards a central pore. The distribution of hydrophobic residues in membrane proteins can be characterized by means of 1–3DG, a complementary 3D Gauss function. Such an analysis was carried out on the transmembrane proteins of bacteria, which, despite the considerable similarities of their super-secondary structure (β-barrel), have highly differentiated properties in terms of stabilization based on hydrophobic interactions. The biological activity and substrate specificity of these proteins are determined by the distribution of the polar and nonpolar amino acids. The present analysis allowed us to compare the ways in which the different proteins interact with antibiotics and helped us understand their relative importance in the development of the resistance mechanism. We showed that beta barrel membrane proteins with a hydrophobic core interact less strongly with the molecules they transport.

1. Introduction

β-barrel transmembrane proteins are expressed in the outer membrane of bacterial cells. Since mutations in these proteins have been implicated in conferring antibiotic resistance, knowledge of their structures and functions is important for the development of clinical therapies [1,2,3]. The prevalence of drug resistance, especially in bacteria strains observed in hospital-acquired infections, have important implications for modern medicine [4,5,6,7,8,9,10,11,12,13,14]. New solutions for overcoming resistance, which commonly arises from the misuse and over-prescription of antibiotics, are required [4,15,16].
At the present stage in the development of therapeutic techniques for which the introduction of personalized medicine methods poses a new challenge, the search for new solutions is becoming a necessity [4,17,18]. Systems’ biology approaches that integrate the knowledge from structural and functional studies of transport proteins and related signaling molecules must be employed in the development of new antibiotics [19,20].
To enter the cell of a Gram-negative bacterium, an antibiotic must penetrate the outer membrane. A molecular understanding of how drug molecules pass through the channels in this membrane is essential when endeavoring to develop new therapeutic compounds [21,22,23,24,25]. The analysis of this phenomenon at the molecular level focuses on the mechanism involved in the penetration of the designed antibiotic into the transmembrane channels. Proteins from the group, known as OmpX (outer membrane protein X), play an essential role at this stage. These proteins are located in the outer membrane of the bacteria and connect the periplasm with the outside world. The subject of the current analysis is a set of bacterial proteins from the OmpX group. We focused on their structures, characterized by the presence of regular beta-barrels, analyzing their adaptation to the hydrophobic environment of the membrane and preparation for the transport of various molecules. Our analysis is based on the use of the fuzzy oil drop (FOD) model and, in particular, the modified version of this model—the FOD-M model, where M expresses the membrane environment. With the help of this analysis, it is possible to explain the specific features of the proteins in question, such as their differentiated resistance to some forms of antibiotics and their specificity in relation to the transported molecule, such as oil transport through a membrane.
The aim of the study is to demonstrate the applicability of the fuzzy oil drop model as a tool for analyzing transmembrane proteins that act as transport channels not only for the various compounds necessary for the life of bacteria but also for potential drugs in the form of antibiotics. The set of proteins in question include examples of various structures, structural forms, and the role of bacteria, although proteins with the helical transmembrane part are discussed in reference [26]. Here, only one representative of this group is discussed. The fuzzy oil drop model has been proven to be a suitable platform for the evaluation and structural–functional characterization of transmembrane proteins.

2. Materials and Methods

2.1. Data

Table 1 shows the membrane proteins of the OmpX group that act as channels for various molecules and are the object of the present analysis. The analysis of these proteins was performed using a modified form of the fuzzy oil drop model (FOD-M), for which hydrophobicity distribution is the key criterion.

2.2. Fuzzy Oil Drop Model and Its Modification Taking into Account the Influence of Factors Other Than the Aqueous Environment

Both the fuzzy oil drop model (FOD) and its modified form (FOD-M), which takes into account the influence of the nonpolar environment on the membrane protein structure, have been presented in numerous papers [26,39,40,41]. The short model description provided here is intended to facilitate the interpretation of the presented results. The FOD model uses a 3D Gaussian function to describe the distribution of hydrophobic amino acid residues in globular proteins. The value of this function (spread over the protein body and expressed by appropriately selected parameters sigmaX, sigmaY, and sigmaZ) at the position of the effective atom (averaged position of atoms belonging to a given amino acid) determines the idealized level of hydrophobicity for a given amino acid, designated as Ti.
At the same time, the value of the actual hydrophobicity level resulting from hydrophobic interactions (depending on the distance between the effective atoms and the intrinsic hydrophobicity of the interacting amino acids) is determined—Oi [42] The analysis also takes into account the R distribution, which is the opposite of the T distribution. It represents a state in which each residue is assigned an identical level of hydrophobicity = 1/N, where N is the number of residues in the chain. Such a distribution presupposes a uniform distribution of hydrophobicity throughout the protein body without identifying the hydrophobic core in particular. Normalization of all the discussed distributions (T, O and R) enables a comparison of them by means of divergence entropy—DKL [43]:
D K L ( P | Q ) = i = 1 N P i log 2 P i Q i
where P expresses the analyzed distribution—in our case, the O distribution—Q, the reference distribution, and, in our case, the T or R distribution.
The application of the above definition to the T, O and R distributions results in the following formula:
D K L ( O | T ) = i = 1 N O i log 2 O i T i
The DKL value thus determined expresses the distance between the idealized distribution and the distribution observed in a given protein. On the other hand, the distance between the O and the R distributions is calculated as follows:
D K L ( O | R ) = i = 1 N O i log 2 O i R i
In this formula, the reference distribution is the R distribution representing the state with a uniform distribution of hydrophobicity throughout the protein’s body.
The DKL value expresses the distance between the two compared distributions on the entropy scale. As a consequence, the final analysis is based on a comparison of DKL for the O|T and the O|R relations, respectively. The relation DKL (O|T) < DKL (O|R) suggests a compatibility of the O and T distributions, which is interpreted as the presence of a hydrophobic core with the simultaneous exposure of hydrophilic residues on the surface (in accordance with the Gaussian function characteristics). To eliminate the need for two quantities, the parameter RD (Relative Distance) was introduced, expressed as follows:
R D = D K L ( O | T ) D K L ( O | T ) + D K L ( O | R )
An RD value <0.5 is interpreted as the presence of a hydrophobic core.
In addition to the polar (water) environment, proteins also function in the hydrophobic environment of the cell membrane. Here, the nonpolar character of the lipid environment is expected to promote the exposure of hydrophobic residues on the protein surface. Additionally, if the membrane protein acts as a channel, and especially if it acts as an ion channel, polar residues are expected to point inwards to stabilize a water-filled internal pore. Therefore, to describe the hydrophobicity distribution in the membrane proteins, the distribution expressed by the complement to the Gaussian function value is assumed to be TMAXTi, where TMAX is the maximum value obtained for the T distribution for a given protein.
Due to the universality of the aqueous environment, its influence is taken into account by introducing a certain consensus between the influence of the polar aqueous environment and the hydrophobic environment. As a result, the external field for the activity of the channel membrane protein is determined by the distribution of M in the form:
Mi = [Ti + K ∗ (TMAXTi)n]n
where index n denotes normalization.
The introduced parameter K expresses the participation of the hydrophobic environment, which was previously defined as an expression of the consensus between these two external fields: the polar field coming from water and the nonpolar field coming from the membrane. The value of the K parameter turns out to be specific for a given protein, characterizing the distinctiveness and diversity of the world of proteins.
The characteristics of the proteins discussed here depend on the value of the RD parameter for the TOR relationship, with the T and R distributions as reference distributions, as well as the value of the K parameter defining the participation of the nonpolar factors in the hydrophobicity distribution within a given protein. The K parameter determines the conditions of the consensus between the two environments: polar (water) and hydrophobic membranes, regardless of the factors causing it.
The identification of the K value for which the DKL value for the O|M relation (where M denotes an adequately modified T distribution) makes it possible to determine the status of a given protein in relation to the hydrophobic environment of the membrane. K values close to zero denote the predominant (or even the only) participation of the aqueous environment. K values close to 1 or even above 1 denote a significant participation of the hydrophobic environment, thereby creating the conditions for the biological activity of a given protein and probably the participation of nonpolar factors in shaping the protein structure. The value of the K parameter determined for a given protein determines the form of the external field in which a given structure is enfolded or in which the protein functions and demonstrates its biological activity.
Analogously to the relation of TOR, the parameter RD can be introduced for the relation of TOM and, based on DKL, determined for the distribution M treated as the reference distribution:
D K L ( O | M ) = i = 1 N O i log 2 O i M i
The RD parameter for the relations of TOM can be calculated as:
R D = D K L ( O | T ) D K L ( O | T ) + D K L ( O | M )
It defines the degree of compatibility between the O distribution and the modified M distribution. The higher the value of RD for this relation, the closer the distribution O to the distribution M. The M distribution replaces the previous reference distribution R, which expresses the complete absence of hydrophobicity diversity, including the complete absence of the hydrophobic core. The degree of compatibility between the O and M distributions reveals the type of hydrophobicity diversity present in a given protein.
Figure 1 presents the relationships between the distributions.

3. Results

Table 2 summarizes the results of the FOD-M analysis for membranes of the OmpX beta barrel membrane family.
The items in Table 2 may be interpreted as follows.
  • The RD value for the TOR relationship determines the degree of hydrophobic core presence compared to a system completely devoid of this presence. RD values <0.5 for this relationship suggest the presence of a hydrophobic core.
  • The K values indicate the degree of participation of a factor other than polar in shaping the structure. The higher the value of K, the greater the proportion of the factor different from the aqueous environment, including the hydrophobic environment of the membrane in particular.
  • The RD values for the MOT relationship express the degree of adjustment of the O distribution to the modified T distribution called M with the reference T distribution. Low RD values for MOT indicate that O is “approaching” the modified distribution, where the degree of modification is expressed by the value of parameter K.
  • The value of K is determined using the step-wise procedure for successive K values, which involves looking for the minimum DKL for the O|M relationship.

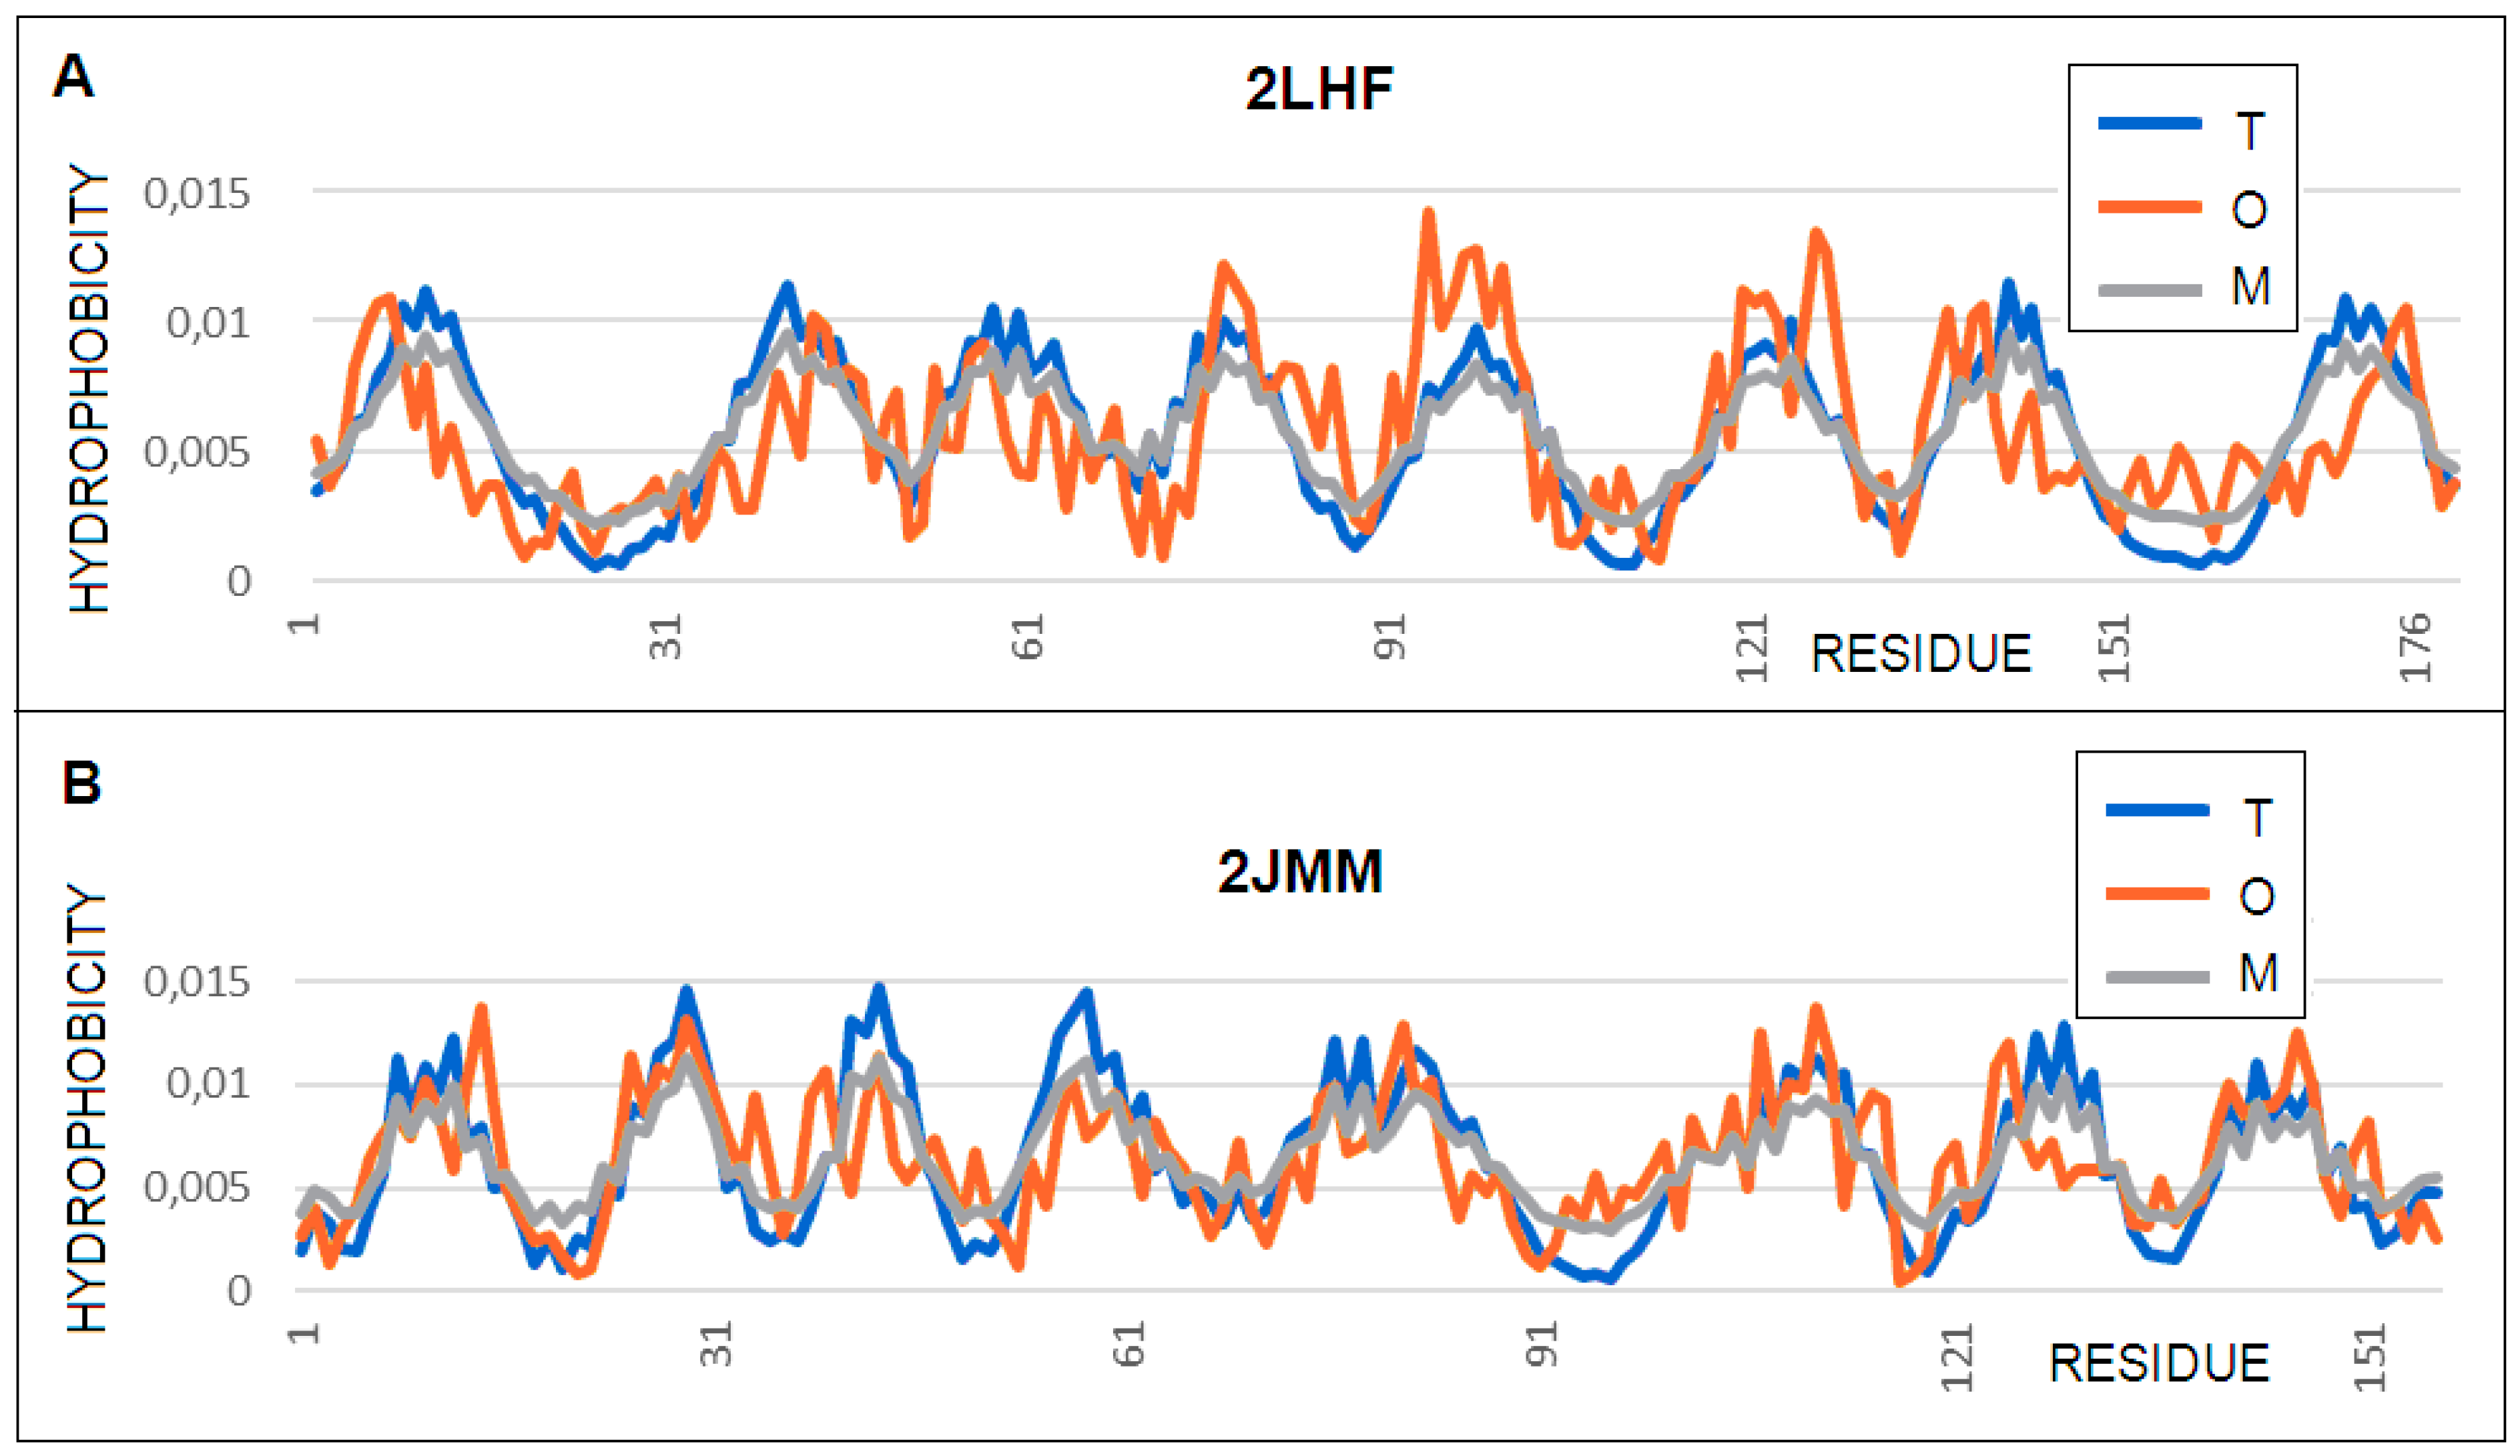
3.1. Proteins Implicated in Antibiotic Resistance (OprH and OmpA)

Both of these proteins show (contrary to what was predicted) a hydrophobicity distribution consistent with the 3D Gauss distribution, which can be interpreted as structures with a central hydrophobic core and polar residue exposure (Figure 2A). This solution is surprising for membrane proteins. Hydrophobic residue exposure in beta-barrel segments in contact with the membrane was expected instead (Figure 3). Moreover, despite the visible channel in the central part of the beta-barrel, the T and O profiles do not show a hydrophobicity deficit (i.e., the compatibility of hydrophobicity maxima). The beta-barrel status in the case of the 2LHF protein shows a high RD value for the TOR relationship, which suggests an arrangement different from the centric hydrophobic core. For this beta-barrel, an increased K value in relation to the 0.4 value occurs (the complete molecule is described as K = 0.2), which means the need to modify the form of the outer field for the beta-barrel itself. A different situation is observed in the case of 2JMM, where the status of the beta-barrel itself is even more consistent with the distribution featuring a centric hydrophobic core than in the case of the molecule as a whole. The experimental modification shortening the loop length introduced in 2JMM [28], the purpose of which was to examine the role of these loops in resistance phenomenon, did not change the status of this protein (according to the fuzzy oil drop model), with a hydrophobic core being present despite the channel in the central part of the molecule
Mutations in Protein H (OprH; PDB ID 2LHF) are implicated as a cause of antibiotic resistance in Pseudomonas aeruginosa. This bacterium is a major nosocomial pathogen that infects cystic fibrosis and immunocompromised patients [27]. An analysis of the structure of the hydrophobic core and the characteristics of the 2JMM structure appear to suggest and explain the higher resistance to binding of any molecule compared to 2LHF. The agreement of the T and O distributions in this protein is expressed by a high correlation coefficient of 0.969.
Based on the previous analyses, a structure with a hydrophobic centric core poorly interacts with other molecules. The binding site of the ligands (substrates) in proteins was identified in the profile as a local hydrophobicity deficit resulting from the presence of a polar cavity [44]. The secondary binding site for substrates is often associated with the hydrophobic region of the protein [45]. Complete coverage of the protein surface with polar groups eliminates the possibility of interactions with molecules other than water.
For example, antifreeze proteins show similar characteristics to the proteins discussed here. Antifreeze proteins that only interact with water show similar characteristics to the proteins discussed here [45]. This similarity suggests a very low probability that the proteins in question can interact outside an aqueous environment.
The distribution of polar and nonpolar residues in OprH and OmpA suggests that they interact weakly with the substrate molecules, including antibiotic molecules, which is consistent with previously published research evidence.
The fuzzy oil drop model does not explain the absence of any correlation between the hydrophobic residue resistance and the structure of the transmembrane beta-barrel. On the other hand, the very compatibility of the T and O distributions may explain the reason for resistance in the case of these proteins.

3.2. Oil Transport (6QAM, 6QWR)

The protein AlkL increases the permeability of the Pseudomonas oleovorans outer membrane for hydrophobic molecules. Two structures, one soluble in the presence of a lipid (6QWR) and one in the presence of a detergent (6QAM) were analyzed in this study to determine the importance of the composition of a hydrophobic environment. The proteins represent identical sequences that additionally support the investigation of the environment’s impact on a structure. Different hydrophobic environments (lipid and detergent) have been shown to influence the membrane protein structure [29], and AlkL provides an opportunity to test the application of the FOD-M analysis in two structures obtained using different NMR methodologies [30]. The status of the molecule as a whole seems to be comparable for both forms (RD and K), although the detergent environment produces a greater deviation than the T distribution. The status of the beta-barrels themselves is different from an RD point of view. However, the modification of the reference distribution at the level K = 0.4 in both cases results in a significantly increased similarity between the O and M distributions in the case of the lipid environment (RD for low MOT low), while, in the detergent RD environment for MOT, the similarity is much less (Figure 4). However, the status of the non-beta-barrel part is different. In the case of the detergent environment, the deformation of the starting field (3DG) was considerable (K = 1.2), while, in the case of lipids, this deformation was expressed with the value of K = 0.7. The modification expressed by the distribution of M in both cases was significant, leading to a decrease in the RD for MOT down to almost 0.3 and, in the case of the lipid environment, to a level of 0.2.
A comparison of the T and O profiles in both the proteins in question revealed the redundancy of hydrophobicity in the outer sections in relation to the expected level. This signified adaptation to the membrane environment. On the other hand, the expectations of the centric core were, so it seemed, partially realized. Most of the local expected peaks were only partially reconstructed. In addition to the clear adjustment of some local peaks, there was a significant deficit of about half the width of a given maximum (sections 15–30, 70–85, 160–175, or 185–200). A comparison of the T and O profiles with the RD and K values for the two structural forms of AlkL (6QWR lipid and the 6QAM detergent) present in the environment showed the stronger influence of the detergent on the structure of the system (Figure 5). The status of segment 30–40 is characteristic, which, in both cases, shows (as was expected in the case of the membrane proteins) a significant local excess of hydrophobicity on the surface. Section 115–130 shows a significantly higher level of hydrophobicity than was expected within this local maximum. This signifies its adaptation for the transport of a highly hydrophobic molecule, an interaction which, inside the channel, is probably beneficial.
The significant differences in the position of the out-barrel loops, visible in Figure 5, are reflected in the parameters calculated in this analysis, presented in Table 2.

3.3. Beta Barrel Proteins of Higher Diameter (OmpA, BamA)

The beta-barrel proteins described in this section are characterized by a much larger barrel cross-section diameter (Table 3) than those discussed previously. It turns out, however, that even in this group with a clearly high degree of similarity at the super-secondary structure level, differentiation can be observed. The summary includes a protein with a diameter comparable to those previously discussed. There are considerable variations in the hydrophobicity profiles of members of this group, as shown in the differences in the K values calculated in this analysis. The 1QJP structure of OmpA (average internal diameter = 15. 9 Å; K = 0.4) closely resembles other beta-barrel proteins with a clear hydrophobic core, whereas the 3K3C structure of BamA (average internal diameter = 35.2 Å; K = 1.2) has a more polar interior. Similarly, the status of the beta-barrel itself changes with K from 0.6 to 1.3. The beta-barrel status is expressed by a higher RD (TOR) value relative to the complete molecule. This results in an increasing fit of the O distribution to the M distribution (versus the reference T distribution). The proteins discussed here are classic examples of the so-called “inverted” field on the K = 1 scale. This means that the polar and hydrophobic environment equally influence the formation of this transmembrane beta-barrel. The T and O profiles show both the exposure of hydrophobic residues on the surface (increased levels of hydrophobicity in places of exposure) and lowered levels of hydrophobicity in those sections constituting channel components (Figure 6).
To visualize the differences in the barrel size characteristics of the discussed proteins, Table 3 presents the average diameters of the channels.
The summary presented in Table 3 shows the different values according to the size of the channel. The adaptation to the function performed becomes visible. A strong correlation exists between the sizes of the diameters and the sizes of the possible molecules or drug transport. The data given here will be discussed in the next parts of this paper.
The profile summary for the proteins discussed here reveals a gradual match with the expected distribution typical for a transmembrane protein. The T and O distributions in the case of OmpA (PDB: 1QJP) show relatively strong agreement (RD for TOR exceeding the cut-off level of 0.5) up to the level of RD = 0.726 for 4N75. An increase in the O values occurs in the sections of the protein exposed to the environment. A wide range of sections show a large deficit between the T and O maxima [46].
Differences can also be observed in the M distributions, which move ever closer to the straight line. The straight line parallel to the x-axis represents the R distribution. This distribution expresses the uniform distribution of the level of hydrophobicity throughout the protein body. This is interpreted as independence from environmental influences. This means that no environment (either polar to generate a centric hydrophobic core or hydrophobic, aiming at hydrophobicity exposure on the surface) has an effect on the molecule’s shape. The composition of the amino acid of such a molecule is an environmental field in itself. The presence of an R-type distribution in the protein is interpreted as constituting a field generated by the molecule itself, thus eliminating both effects of targeting. This is exactly the case with the 4N74 and 4K3C BamA structures. They are large molecules (379 and 532 amino acids, respectively). It is the number of molecules that, with their size dominance, can create an auto-environment that makes such a molecule independent of environmental influences. However, using the reference (idealized) distributions of T and M, we can quantify the state of the consensus present between these two idealized environments, leading to the generation of the structure present in these two membrane proteins. Figure 7 presents a comparison of the 3D structures of the proteins in question.
The present analysis indicates that, based on the hydrophobicity distribution characteristics, no barrier exists in the transport of antibiotics through the BamA pore (PDB: 6FSU, 4K3C, and 4N75).

3.4. Experimentally Modified Proteins (OprF, CarO1, and CarO2) (PDB: 4RLC, 4RL9I, and 4RLB)

The 4RL9, 4RLB, and 4RLC proteins are discussed together as they were developed by experimental sequence modification for the purpose of understanding the reasons for the observed resistance to antibiotics. In particular, one area of interest in experimental work is the uptake of ornithine and carbapenem [35].
Proteins with ID 4RL9, 4RLB, and 4RLC structures are characterized by the presence of a beta-barrel. The first two feature an additional domain containing the beta sheet and a single helix (Figure 7). As a consequence, in these two proteins (4RL9 and 4RLB), the properties of the beta-barrel itself and its associated domain, which is not present in 4RLC are discussed separately.
The status of the complete molecules is described, with the K values ranging from 1.3 for 4RLB to 0.3 for 4RLC. This wide range reveals the influence of the structural changes deliberately introduced by the experimenters. What is interesting to note is the status of the off-barrel helix, which, in the 4RL9 structure, matches the T distribution, while, in the case of 4RLB, its status clearly differs from the T distribution. The beta-barrel itself shows a significant deviation from the T distribution and only the modification at the level of K = 1.1 leads to the representation of the O distribution. Based on the analysis carried out here, the 4RLC structure, as predicted, showed the highest level of resistance, which is consistent with the experimental results [35]. The out-barrel domain of CarO2 (PDB: 4RLB) diverged dramatically from the standard T distribution, requiring its modification at the level of K = 1.8 and leading (similar to the 4N75 protein discussed above) to an O distribution similar to the R distribution, which, as was described in the discussion above, suggests that this molecule is independent of the influence of any external environment, thus providing the conditions for folding by itself. This is revealed by a set of profiles (Figure 8) with the structural diversity shown in Figure 9.

3.5. Autotransporters (Hbp and EspP) (PDB: 3AEH + 2QOM)

Autotransporters such as Hbp (PDB 3AEH) and EspP (PDB 2QOM) have an N-terminal “passenger” domain, which they can move through their central pore. Although the exact mechanism of autotransport is unclear, the beta barrel domain has been shown to exhibit proteolytic activity. The process is associated with the secretion of the N-terminal “passenger” domain. The beta-barrel exhibits proteolytic activity by digesting the N-terminal domain (“passenger”). The highly specific cut-off site was found between the two adjacent concentrations of asparagine displaying very high levels of conservation. A mutation at this position excludes proteolysis [36]. The location of the “passenger” domains within the beta-barrels of the E. coli autotransporters Hbp and EspP are shown in Figure 10.
Figure 11 shows the T, O and M distributions for the two discussed autotransporters: 3AEH and 2QOM.
The profiles show significant deviations from the T distribution (Table 2). These deviations are characteristic of proteins located in the membrane environment, showing hydrophobicity exposure in the surface sections (low expected T values) and decreased hydrophobicity values in the central sections, where a high hydrophobicity is expected (although it is characterized by significant point variations in the level of hydrophobicity in the subsequent residues).
Worth noting is the status of the “passenger” domain, which shows a significantly lower level of hydrophobicity than expected, which is due to the central position of the high hydrophobicity level. The status of the molecule changes as a whole (ranging from high K values > 1.0) to levels 0.7 and 0.8 following the cut-off of the N-terminal “passenger” fragment.
It is unlikely that the beta-barrel structure will change significantly in the post-cleaved version. Hence, the correction of the T distribution to K = 0.7 and 0.8 can be assumed to be typical for the membrane portions of these proteins.
Based on the example provided by these proteins, the application of the modified FOD model to the FOD-M version, taking into account the influence of the environment on the transmembrane protein structure with the present channel in the central part of the protein yields positive results. These proteins are further examples of the positive application of the FOD-M model as a tool for characterizing these proteins.

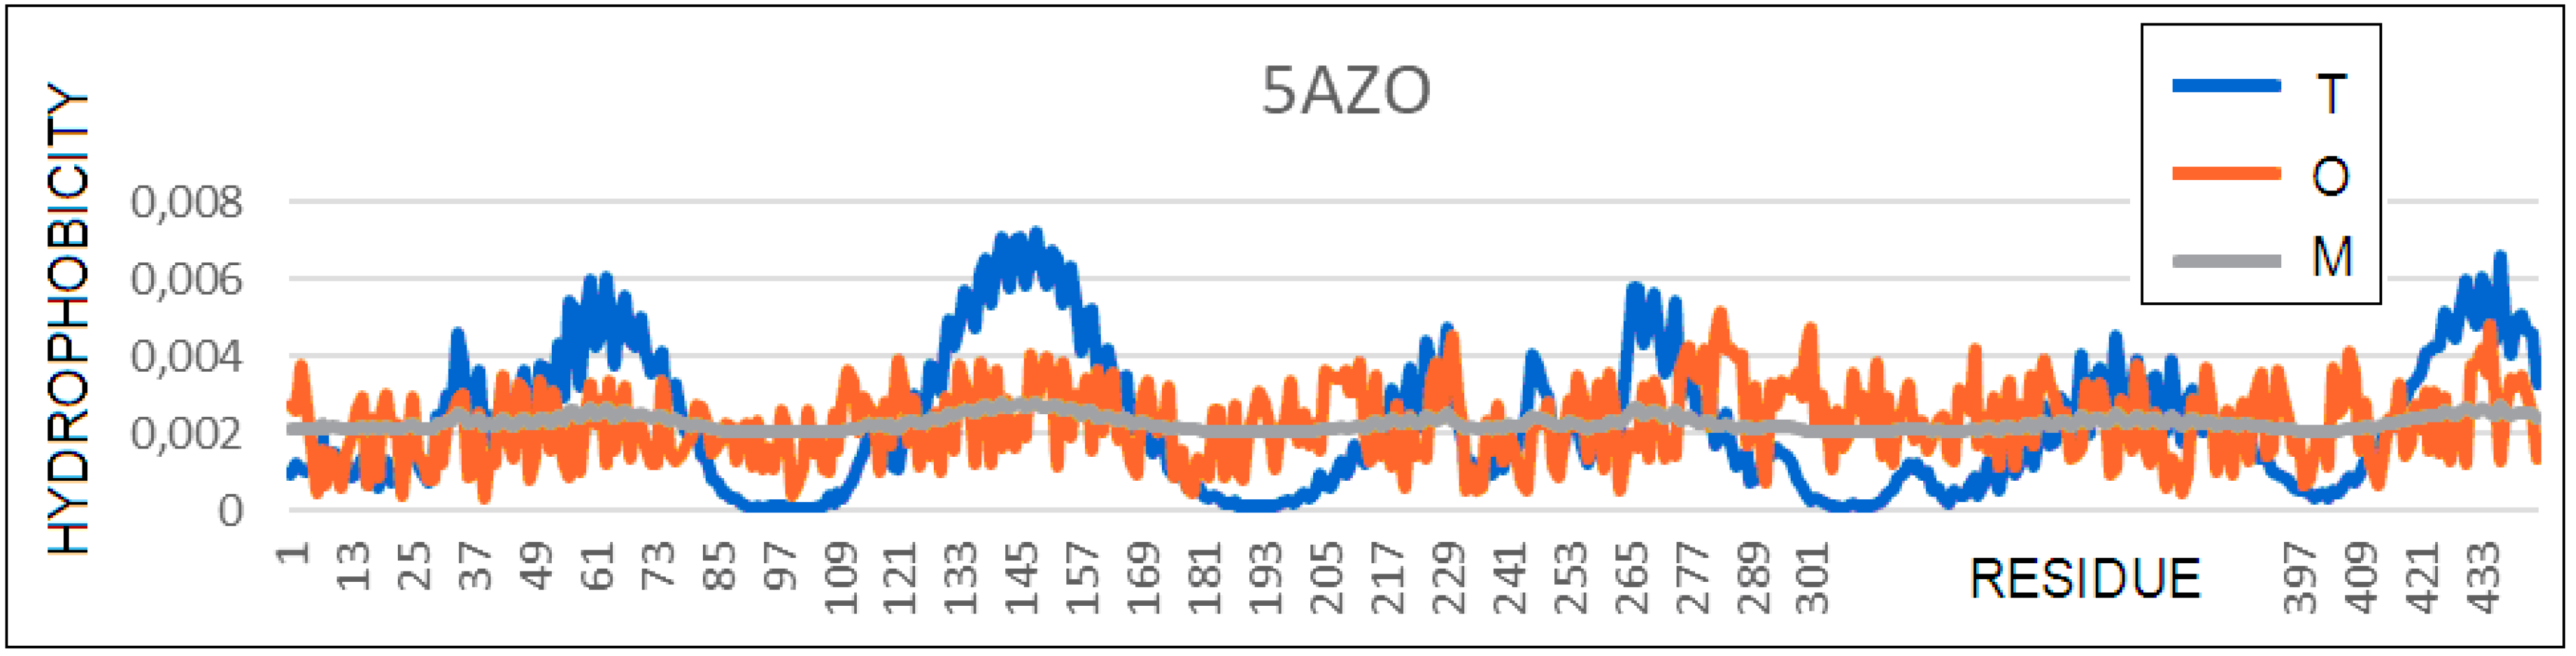
3.6. A Transmembrane Protein with a Helical Bundle (PAO1) (PDB 5AZO)

The PAO1 protein from Pseudomonas aeruginosa is a multidrug efflux pump and is anchored in the membrane by means of a helical bundle. Only part of the complex is available in the PDB, which consists of only two chains out of the six that constitute a complete complex (Figure 12). The status of the yellow and red outside membrane parts can only be judged from the point of view of a single chain. Previous studies [41] show that, in the final complete structure, the beta-barrel composed of extra-membrane parts exhibits a low RD for TOR, demonstrating significant adaptation to the centric hydrophobicity distribution with considerable discrepancies from the point of view of a single chain.
It can be assumed that this is probably also the case here.
It is difficult to draw any specific conclusions from the 5AZO structure regarding the role of PAO1 in the antibiotic resistance, since the structure is not that of a complete protein complex. Nevertheless, the high K values for the entire dimer, the single chain, and the helix system clearly suggest the need for an environmental factor that would stabilize a significantly different hydrophobicity distribution compared to what appears to be common in an aqueous environment (Figure 13).

4. Discussion

The analysis presented above aims to correlate the distribution of hydrophobic amino acid residues in bacterial beta-barrel membrane proteins with their function and ability to transport antibiotics. The work revealed that some members of this protein group have a hydrophobicity profile that closely resembles that of globular, soluble proteins. In the case of transmembrane proteins, the exposure of hydrophobic residues to the outside of the molecule is expected with the hydrophobicity deficit in the central part due to the presence of the channel. The opposite distribution to that expected, surprisingly from the point of view of the specific environment in which these proteins are active, explains the bacterial resistance to antibiotics. The structure with a central hydrophobic core with a polar surface does not enable any interaction with other molecules, probably including with antibiotics. For this group of membrane proteins, a potential “antibiotic” should have a structure appropriate to the “target” molecule, whose properties are adjusted to the specificity disclosed here.
The magnitude of the particular K parameter reveals the degree of deviation in the distribution with a centric hydrophobic core. The value of this parameter also measures the proportion of the factor that distorts the hydrophobicity distribution from the micelle-like form. In particular, the values of K > 1 explain the characteristics of an environment analogous to a “vacuum”, thereby revealing the complete independence of the protein from the influence of a natural water or membrane environment, leading to a form of decomposition close to R decomposition. It can also be interpreted as an environment for intramolecular diffusion in the case of autotransporter proteins. Bacterial proteins are the subject of the analysis in the present work.
Numerous bacterial species live on or inside the human body, including those that facilitate the functioning of the digestive system and are of critical importance for human health [47,48]. The proper functioning of this environment is a vital factor determining the condition of the human body [49]. The aim of the present work was not to solve a specific biological problem. The analysis only showed that the application of the fuzzy oil drop model can serve as a tool for solving the problems of protein–ligand interactions, including the therapeutic purposes in the drug design. The fuzzy oil drop model indicates the presence of a cavity (a local hydrophobicity deficit, as demonstrated in reference [50]). The fuzzy oil drop model was also used in the design of “stoppers” for the propagation of amyloid fibrils [51,52]. When analyzing analogous solutions for naturally occurring and functioning solenoids with a possible tendency to unrestricted complexation, the characterization of “stopper” segments was used to design peptides that could play a similar role for amyloid fibrils.

5. Conclusions

The present analysis aimed to demonstrate the validity of the modifications made to the FOD model that take into account the influence (presence) of a hydrophobic environmental factor. The selected proteins are transmembrane proteins and, therefore, have a common environment in the form of a hydrophobic cell membrane. The different values of the K parameter (from 0.2 to 1.6) indicate the varying degrees to which the hydrophobic environment shapes their structures, despite the common environment of their activity. In some cases, it is possible to characterize the proteins in question, resulting from the specificity of the distribution of T, O and M in particular. A phenomenon such as a resistance to antibiotics appears to be explained by the status of a given membrane protein, which, contrary to the preliminary assumptions, represents a micelle-like structure (with a hydrophobic core present) and, as such, does not show a tendency to interact with other molecules. A protein that fully represents the hydrophobicity distribution consistent with the Gaussian 3D distribution, apart from local interactions with ions or polar low-molecular compounds, does not exhibit wider interaction possibilities. Such interactions require local inconsistency between the O and T distributions [44,45]. The analysis of the proteins presented here is a test of the applicability of the FOD model in its modified FOD-M version, revealing the specificity of the proteins from the OmpX group and making it possible to measure the adjustment of the hydrophobicity distribution to the activity environment of these proteins (cell membrane) [53]. This study also showed the usefulness of the FOD and FOD-M models for characterizing the protein structure, especially the relationship with biological activities and/or their possible modifications, including possible drug designs.

Author Contributions

Conceptualization, I.R. and L.K.; methodology, K.S.; software, P.F.; validation, K.S.; formal analysis, K.S.; investigation, I.R.; resources, P.F.; data curation, P.F.; writing—original draft preparation, I.R.; writing—review and editing, K.S. and I.R.; visualization, I.R.; supervision, IR.; project administration, I.R.; and funding acquisition, I.R. All authors have read and agreed to the published version of the manuscript.

Funding

This research was funded by Jagiellonian University—Medical College, grant number N41/DBS/000722.

Institutional Review Board Statement

Not applicable.

Data Availability Statement

All data is available on request from the corresponding author. The program enabling the calculation of RD is accessible on request from the CodeOcean platform: https://codeocean.com/capsule/3084411/tree assessed on 28 July 2021. Please contact the corresponding author to gain access to the private program.

Conflicts of Interest

The authors declare no conflict of interest.

References

  1. Plantinga, N.L.; Wittekamp, B.H.J.; Van Duijn, P.J.; Bonten, M.J.M. Fighting antibiotic resistance in the intensive care unit using antibiotics. Future Microbiol. 2015, 10, 391–406. [Google Scholar] [CrossRef]
  2. Zinner, S.H. Antibiotic use: Present and future. New Microbiol. 2007, 30, 321–325. [Google Scholar]
  3. Mohr, K.I. History of Antibiotics Research. How Overcome Antibiot. Crisis 2016, 398, 237–272. [Google Scholar] [CrossRef]
  4. Yoneyama, H.; Katsumata, R. Antibiotic Resistance in Bacteria and Its Future for Novel Antibiotic Development. Biosci. Biotechnol. Biochem. 2006, 70, 1060–1075. [Google Scholar] [CrossRef]
  5. Planson, A.-G.; Carbonell, P.; Grigoras, I.; Faulon, J.-L. Engineering antibiotic production and overcoming bacterial resistance. Biotechnol. J. 2011, 6, 812–825. [Google Scholar] [CrossRef] [PubMed]
  6. Wright, G.D. Bacterial resistance to antibiotics: Enzymatic degradation and modification. Adv. Drug Deliv. Rev. 2005, 57, 1451–1470. [Google Scholar] [CrossRef] [PubMed]
  7. Power, E. Impact of antibiotic restrictions: The pharmaceutical perspective. Clin. Microbiol. Infect. 2006, 12, 25–34. [Google Scholar] [CrossRef] [PubMed] [Green Version]
  8. Barger, A.; Fuhst, C.; Wiedemann, B. Pharmacological indices in antibiotic therapy. J. Antimicrob. Chemother. 2003, 52, 893–898. [Google Scholar] [CrossRef] [PubMed] [Green Version]
  9. Kim, R.Y.; Ng, A.M.; Persaud, A.K.; Furmanek, S.; Kothari, Y.N.; Price, J.D.; Wiemken, T.L.; Saad, M.A.; Guardiola, J.J.; Cavallazzi, R.S. Antibiotic Timing and Outcomes in Sepsis. Am. J. Med. Sci. 2018, 355, 524–529. [Google Scholar] [CrossRef]
  10. Jordan, S.; Tait, M. Antibiotic therapy. Nurs. Stand 1999, 7, 33–38. [Google Scholar] [CrossRef]
  11. Olesen, S.W.; Lipsitch, M.; Grad, Y.H. The role of “spillover” in antibiotic resistance. Proc. Natl. Acad. Sci. USA 2020, 117, 29063–29068. [Google Scholar] [CrossRef] [PubMed]
  12. Bengtsson, B.; Greko, C. Antibiotic resistance—Consequences for animal health, welfare, and food production. Upsala J. Med. Sci. 2014, 119, 96–102. [Google Scholar] [CrossRef]
  13. Machowska, A.; Lundborg, C.S. Drivers of Irrational Use of Antibiotics in Europe. Int. J. Environ. Res. Public Health 2018, 16, 27. [Google Scholar] [CrossRef] [Green Version]
  14. Årdal, C.; Blix, H.S.; Plahte, J.; Røttingen, J.-A. An antibiotic’s journey from marketing authorization to use, Norway. Bull. World Health Organ. 2017, 95, 220–226. [Google Scholar] [CrossRef]
  15. Walsh, C.T. Where will new antibiotics come from? Nat. Rev. Genet. 2003, 1, 65–70. [Google Scholar] [CrossRef]
  16. Mohamed, N.S.; Wilkie, W.A.; Remily, E.; Nace, J.; Delanois, R.E.; Browne, J.A. Antibiotic Choice: The Synergistic Effect of Single vs Dual Antibiotics. J. Arthroplast. 2020, 35, S19–S23. [Google Scholar] [CrossRef] [Green Version]
  17. Moser, C.; Lerche, C.J.; Thomsen, K.; Hartvig, T.; Schierbeck, J.; Jensen, P.; Ciofu, O.; Høiby, N. Antibiotic therapy as personalized medicine—general considerations and complicating factors. APMIS 2019, 127, 361–371. [Google Scholar] [CrossRef]
  18. Singh, S.B.; Young, K.; Silver, L.L. What is an “ideal” antibiotic? Discovery challenges and path forward. Biochem. Pharmacol. 2017, 133, 63–73. [Google Scholar] [CrossRef]
  19. Wenzel, M.; Bandow, J.E. Proteomic signatures in antibiotic research. Proteomics 2011, 11, 3256–3268. [Google Scholar] [CrossRef]
  20. Rokem, J.S.; Lantz, A.E.; Nielsen, J. Systems biology of antibiotic production by microorganisms. Nat. Prod. Rep. 2007, 24, 1262–1287. [Google Scholar] [CrossRef]
  21. Davies, J.; Davies, D. Origins and Evolution of Antibiotic Resistance. Microbiol. Mol. Biol. Rev. 2010, 74, 417–433. [Google Scholar] [CrossRef] [PubMed] [Green Version]
  22. Munita, J.M.; Arias, C.A. Mechanisms of Antibiotic Resistance. Microbiol. Spectr. 2016, 4. [Google Scholar] [CrossRef] [PubMed] [Green Version]
  23. Martinez, J.L. General principles of antibiotic resistance in bacteria. Drug Discov. Today Technol. 2014, 11, 33–39. [Google Scholar] [CrossRef] [PubMed]
  24. Dodds, D.R. Antibiotic resistance: A current epilogue. Biochem. Pharmacol. 2017, 134, 139–146. [Google Scholar] [CrossRef]
  25. Gilmore, M.S. The CRISPR–Antibiotic Resistance Connection. CRISPR J. 2019, 2, 199–200. [Google Scholar] [CrossRef]
  26. Roterman, I.; Stapor, K.; Fabian, P.; Konieczny, L.; Banach, M. Model of Environmental Membrane Field for Transmembrane Proteins. Int. J. Mol. Sci. 2021, 22, 3619. [Google Scholar] [CrossRef]
  27. Edrington, T.C.; Kintz, E.; Goldberg, J.B.; Tamm, L.K. Structural Basis for the Interaction of Lipopolysaccharide with Outer Membrane Protein H (OprH) from Pseudomonas aeruginosa. J. Biol. Chem. 2011, 286, 39211–39223. [Google Scholar] [CrossRef] [Green Version]
  28. Johansson, M.U.; Alioth, S.; Hu, K.; Walser, R.; Koebnik, R.; Pervushin, K. A Minimal Transmembrane β-Barrel Platform Protein Studied by Nuclear Magnetic Resonance. Biochemistry 2007, 46, 1128–1140. [Google Scholar] [CrossRef]
  29. Cross, T.A.; Murray, D.T.; Watts, A. Helical membrane protein conformations and their environment. Eur. Biophys. J. 2013, 42, 731–755. [Google Scholar] [CrossRef] [Green Version]
  30. Schubeis, T.; Le Marchand, T.; Daday, C.; Kopec, W.; Movellan, K.T.; Stanek, J.; Schwarzer, T.S.; Castiglione, K.; de Groot, B.L.; Pintacuda, G.; et al. A β-barrel for oil transport through lipid membranes: Dynamic NMR structures of AlkL. Proc. Natl. Acad. Sci. USA 2020, 117, 21014–21021. [Google Scholar] [CrossRef] [PubMed]
  31. Pautsch, A.; Schulz, G.E. High-resolution structure of the OmpA membrane domain. J. Mol. Biol. 2000, 298, 273–282. [Google Scholar] [CrossRef] [Green Version]
  32. Noinaj, N.; Kuszak, A.; Gumbart, J.C.; Lukacik, P.; Chang, H.; Easley, N.C.; Lithgow, T.; Buchanan, S.K. Structural insight into the biogenesis of β-barrel membrane proteins. Nat. Cell Biol. 2013, 501, 385–390. [Google Scholar] [CrossRef] [PubMed] [Green Version]
  33. Hartmann, J.-B.; Zahn, M.; Burmann, I.M.; Bibow, S.; Hiller, S. Sequence-Specific Solution NMR Assignments of the β-Barrel Insertase BamA to Monitor Its Conformational Ensemble at the Atomic Level. J. Am. Chem. Soc. 2018, 140, 11252–11260. [Google Scholar] [CrossRef] [PubMed]
  34. Woodard, J.; Srivastava, K.R.; Rahamim, G.; Grupi, A.; Hogan, S.; Witalka, D.J.; Nawrocki, G.; Haas, E.; Feig, M.; Lapidus, L.J. Intramolecular Diffusion in α-Synuclein: It Depends on How You Measure It. Biophys. J. 2018, 115, 1190–1199. [Google Scholar] [CrossRef] [Green Version]
  35. Zahn, M.; D’Agostino, T.; Eren, E.; Baslé, A.; Ceccarelli, M.; Berg, B.V.D. Small-Molecule Transport by CarO, an Abundant Eight-Stranded β-Barrel Outer Membrane Protein from Acinetobacter baumannii. J. Mol. Biol. 2015, 427, 2329–2339. [Google Scholar] [CrossRef]
  36. Tajima, N.; Kawai, F.; Park, S.-Y.; Tame, J.R. A Novel Intein-Like Autoproteolytic Mechanism in Autotransporter Proteins. J. Mol. Biol. 2010, 402, 645–656. [Google Scholar] [CrossRef] [PubMed]
  37. Barnard, T.J.; Dautin, N.; Lukacik, P.; Bernstein, H.D.; Buchanan, S.K. Autotransporter structure reveals intra-barrel cleavage followed by conformational changes. Nat. Struct. Mol. Biol. 2007, 14, 1214–1220. [Google Scholar] [CrossRef]
  38. Yonehara, R.; Yamashita, E.; Nakagawa, A. Crystal structures of OprN and OprJ, outer membrane factors of multidrug tripartite efflux pumps of P seudomonas aeruginosa. Proteins Struct. Funct. Bioinform. 2016, 84, 759–769. [Google Scholar] [CrossRef]
  39. Kalinowska, B.; Banach, M.; Konieczny, L.; Roterman, I. Application of Divergence Entropy to Characterize the Structure of the Hydrophobic Core in DNA Interacting Proteins. Entropy 2015, 17, 1477–1507. [Google Scholar] [CrossRef] [Green Version]
  40. Roterman, I.; Stapor, K.; Fabian, P.; Konieczny, L. The possible molecular basis for differentiation of COVID-19 pandemy. 2021; submitted. [Google Scholar]
  41. Roterman, I.; Stapor, K.; Fabian, P.; Konieczny, L. Characteristics of amyloids in context of environment. 2021; submitted. [Google Scholar]
  42. Levitt, M. A simplified representation of protein conformations for rapid simulation of protein folding. J. Mol. Biol. 1976, 104, 59–107. [Google Scholar] [CrossRef]
  43. Kullback, S.; Leibler, R.A. On Information and Sufficiency. Ann. Math. Stat. 1951, 22, 79–86. [Google Scholar] [CrossRef]
  44. Banach, M.; Konieczny, L.; Roterman, I. Ligand binding cavity encoded as a local hydrophobicity deficiency. In From Globular Proteins to Amyloids; Roterman-Konieczna, I., Ed.; Elsevier: Amsterdam, The Netherlands; Oxford, UK; Cambridge, MA, USA, 2020; pp. 91–95. [Google Scholar]
  45. Banach, M.; Roterman, I. Recognition of protein complexation based on hydrophobicity distribution. Bioinformation 2009, 4, 98–100. [Google Scholar] [CrossRef] [PubMed] [Green Version]
  46. Banach, M.; Konieczny, L.; Roterman, I. Why do antifreeze proteins require a solenoid? Biochimie 2018, 144, 74–84. [Google Scholar] [CrossRef] [PubMed]
  47. Adak, A.; Khan, M.R. An insight into gut microbiota and its functionalities. Cell. Mol. Life Sci. 2018, 76, 473–493. [Google Scholar] [CrossRef] [PubMed]
  48. Tarasiuk, A.; Fichna, J. Gut microbiota: What is its place in pharmacology? Expert Rev. Clin. Pharmacol. 2019, 12, 921–930. [Google Scholar] [CrossRef]
  49. Fan, Y.; Pedersen, O. Gut microbiota in human metabolic health and disease. Nat. Rev. Genet. 2020, 19, 55–71. [Google Scholar] [CrossRef]
  50. Dygut, J.; Kalinowska, B.; Banach, M.; Piwowar, M.; Konieczny, L.; Roterman, I. Structural Interface Forms and Their Involvement in Stabilization of Multidomain Proteins or Protein Complexes. Int. J. Mol. Sci. 2016, 17, 1741. [Google Scholar] [CrossRef] [PubMed] [Green Version]
  51. Banach, M.; Roterman, I. Solenoid—An amyloid under control. In From Globular Proteins to Amyloids; Roterman-Konieczna, I., Ed.; Elsevier: Amsterdam, The Netherlands; Oxford, UK; Cambridge, MA, USA, 2020; pp. 96–116. [Google Scholar]
  52. Roterman, I.; Banach, M.; Konieczny, L. Towards the design of anti-amyloid short peptide helices. Bioinformation 2018, 14, 1–7. [Google Scholar] [CrossRef] [Green Version]
  53. Vogt, J.; Schulz, G.E. The structure of the outer membrane protein OmpX from Escherichia coli reveals possible mechanisms of virulence. Structure 1999, 7, 1301–1309. [Google Scholar] [CrossRef] [Green Version]
Figure 1. The O distribution in relation to the T, M and R distributions (randomly constructed distributions for the 1-dimensional Gauss distribution); (A) T distribution (navy), O (pink), R (turquoise), and M (yellow); and (B) DKL values for different values of K—the optimal K values for the discussed example are marked with red. The RD values for the TOR and TOM relationships are equal to 0.760 and 0.873, respectively. (C) The scale of the RD values for the reference distributions versus the O distribution. The determined values of RD (as given in B) located on the variation axis of the RD parameter show significant compatibility with the M distribution compared to the reference distribution R.
Membranes 11 00580 g001
Figure 2. Profiles T (blue), O (red), and M (gray) for: (A)—2LHF, with the profile M for K = 0.2 and (B)—2JMM, with the profile M for K = 0.3.
Membranes 11 00580 g002
Figure 3. 3D structure presentation revealing a different pattern of loops in proteins showing a distribution consistent with the distribution corresponding to the presence of a hydrophobic core. (A) 2LHF and (B) 2JMM.
Membranes 11 00580 g003
Figure 4. Profiles T (blue), O (red), and M (gray) for: (A) the 6QWR–lipid. Profile M for K = 0.4 and (B) 6QAM detergent. Profile M for K = 0.5.
Membranes 11 00580 g004
Figure 5. Comparison of the AlkL structures: (A) 6QAM detergent environment (gray) and (B) 6QWR, lipid environment (gray), according to reference [30].
Membranes 11 00580 g005
Figure 6. Profiles: T (blue), O (red), and M (gray) for the membrane proteins with a larger tunnel diameter. (A) 1QJP, profile M for K = 0.4; (B) 6FSU, profile M for K = 0.9; (C) 4K3C, profile M for K = 1.2; and (D) 4N75, profile M for K = 1.2.
Membranes 11 00580 g006
Figure 7. 3D presentation of the following proteins: (A) 1QJP, (B) 6FSU, (C) 4K3C with out-of-barrel fragments highlighted in red, and (D) 4N75.
Membranes 11 00580 g007
Figure 8. Profiles: T (blue), O (red), and M (gray) for: (A) 4RL9, profile M for K = 1.2; (B) 4RLB, profile M for K = 1.3; and (C) 4RLC, profile M for K = 0.3.
Membranes 11 00580 g008
Figure 9. 3D presentation of experimentally modified membrane protein structures showing the different statuses of the out-barrel part red. The helix distinguisher is in yellow. (A) 2RLC, (B) 2RL9, and (C) 2RLB.
Membranes 11 00580 g009
Figure 10. A 3D presentation of the proteins referred to as autotransporters in two different projections. Parts distinguished as red are “passengers”. (A) 3AEH and (B) 2QOM.
Membranes 11 00580 g010
Figure 11. Profiles T (blue), O (red), and M (gray) for: (A) 3AEH with a “passenger” present (profile M for K = 1.3), (B) 3AEH lacking an N-terminal helix (“passenger”) (profile M for K = 0.7), and (C) 2QOM without a “passenger” (profile M for K = 0.8).
Membranes 11 00580 g011
Figure 12. Two different orientations of the dimer structure: a 6-mer section with distinguished extra-membrane parts (red and yellow depending on whether or not they belong to the monomer) and fragments anchored in the membrane (navy blue).
Membranes 11 00580 g012
Figure 13. Profiles T (blue), O (red), and M (gray) (K = 1.6) of a helical transmembrane protein.
Membranes 11 00580 g013
Table 1. List of the outer membrane proteins analyzed in the study.
PDB–ID + Chain LengthProtein Source OrganismRef.
2LHF–128 aaOuter membr–oprhPseudomonas aeruginosa[27]
2JMM–165 aaOuter membrEscherichia coli[28,29]
6QWR–211 aaOuter membr–alklPseudomonas oleovorans[30]
Oil transporter-lipid
6QAM–211 aaOuter membr–alklPseudomonas oleovorans[30]
Oil transporter-detergent
1QJP–137 aaOuter membr-ompaEscherichia coli[31]
4K3C–532 aaOuter membr-factor bamaHaemophilus ducreyi[32]
6FSU–388 aaOuter membr-factor bamaEscherichia coli[33]
4N75–379 aaOuter membr-biogenesisEscherichia coli[34]
4RLC–135 aaOuter membr-oprfPseudomonas aeruginosa[35]
4RL9–205 aaOuter memb–carbapenem associatedAcinetobacter baumannii[35]
4RLB-213 aaOuter memb–carbapenem associatedAcinetobacter baumannii[35]
3AEH–277 aaAutotransporter-hydrolaseEscherichia coli[36]
2QOM–265 aaAutotransporter-hydrolaseEscherichia coli[37]
5AZO–444 aaEfflux pump–oprn Pseudomonas aeruginosa[38]
Table 2. The value of RD for the TOR relationship and the value of the K parameter, which determines the influence of a nonaqueous environment on protein folding, are given. The RD values for the MOT relationship are also shown, indicating the effect of approximating the M distribution to the O distribution at the reference T distribution. For the selected proteins, a set of parameters was given for the distinguished structural parts, including, in particular, beta-barrels.
PDB-IDProtein
Characteristics
RD
TOR
KRD
MOT
Length (aa)
HIGH RESISTANCE
2LHFprotein H (OprH)0.4720.20.404178
β-barrel 0.6030.40.37774
2JMMpr. A (OmpA)–modif.0.4720.30.386156
β-barrel 0.4610.20.48684
DIFFERENT EXTERNAL CONDITIONS
6QWROil transport–lipid0.5560.40.384211
β-barrel AlkL0.5370.40.166110
Loops 0.5990.70.213101
6QAM 0.5750.50.365211
β-barrel Oil transport–detergent0.5820.40.41575
LoopsAlkL0.6761.20.318136
HIGHER DIAMETER BARREL
1QJP 0.5580.40.382137
β-barrel 0.6430.60.349107
6FSU 0.6640.90.310388
β-barrel 0.7180.90.281197
4K3C 0.6991.20.291532
β-barrel 0.7261.30.273195
4N75 0.7271.20.261379
β-barrel 0.7431.30.255191
DIFFERENT RESISTANCE
4RL9Small mol. transport 0.7451.20.239205
β-barrel 0.8181.10.18076
β-sheet 0.7361.20.26246
Helix 0.4480.50.44819
4RLBSmall mol. Transport 0.7411.30.245213
β-barrel 0.8011.10.19678
β-sheet 0.8061.80.19397
Helix 0.6511.80.34821
4RLCSmall mol. Transport0.5030.30.409135
β-barrel 0.5030.30.409135
AUTOTRANSPORTER
3AEHautotransporter0.7071.30.289277
β-barrel 0.6440.70.336234
2QOMautotransporter0.6961.40.298265
β-barrel 0.6410.80.346186
EFFLUX PUMP
5AZOefflux pump0.8251.60.169444
Helices0.7881.20.206314
β-sheet0.8371.50.15457
Table 3. The averaged channel diameters in the discussed proteins.
StructureAverage Diameter (Å)Protein Name
2HLF14.2OprH
6QAM18.4AlkL
6QWR16.3AlkL
1QJP15.9OmpA
6FSU31.4BamA
4K3C35.2BamA
4N7532.9BamA
4RL918.3CarO1
4RLB12.6CarO2
4RLC17.1OprF
3AEH24.9Hbp
2QOM24.8EspP
Publisher’s Note: MDPI stays neutral with regard to jurisdictional claims in published maps and institutional affiliations.

