
Quantitative Analysis of the Membrane Affinity of Local Anesthetics Using a Model Cell Membrane

 , ,
, ,  and
and 
Abstract
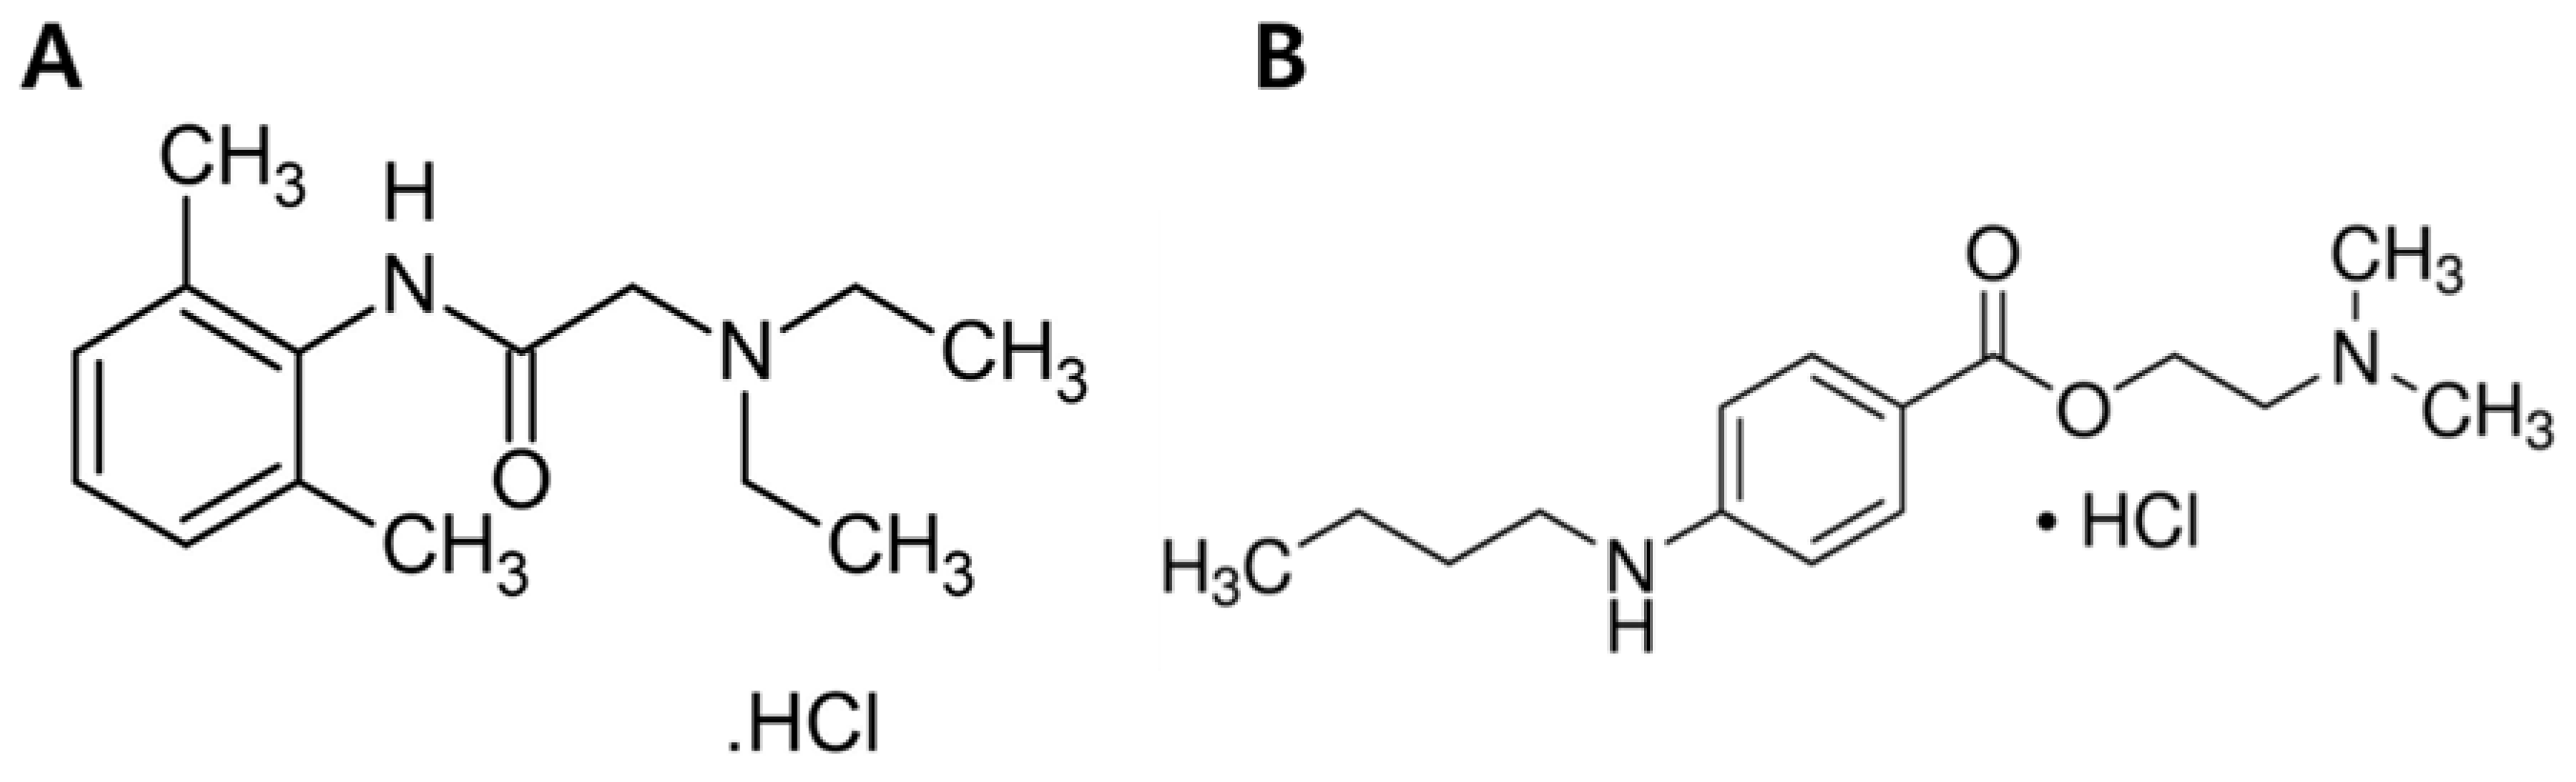
:1. Introduction
2. Materials and Methods
2.1. Cell Culture
2.2. LDH Assay
2.3. CCK-8 Assay
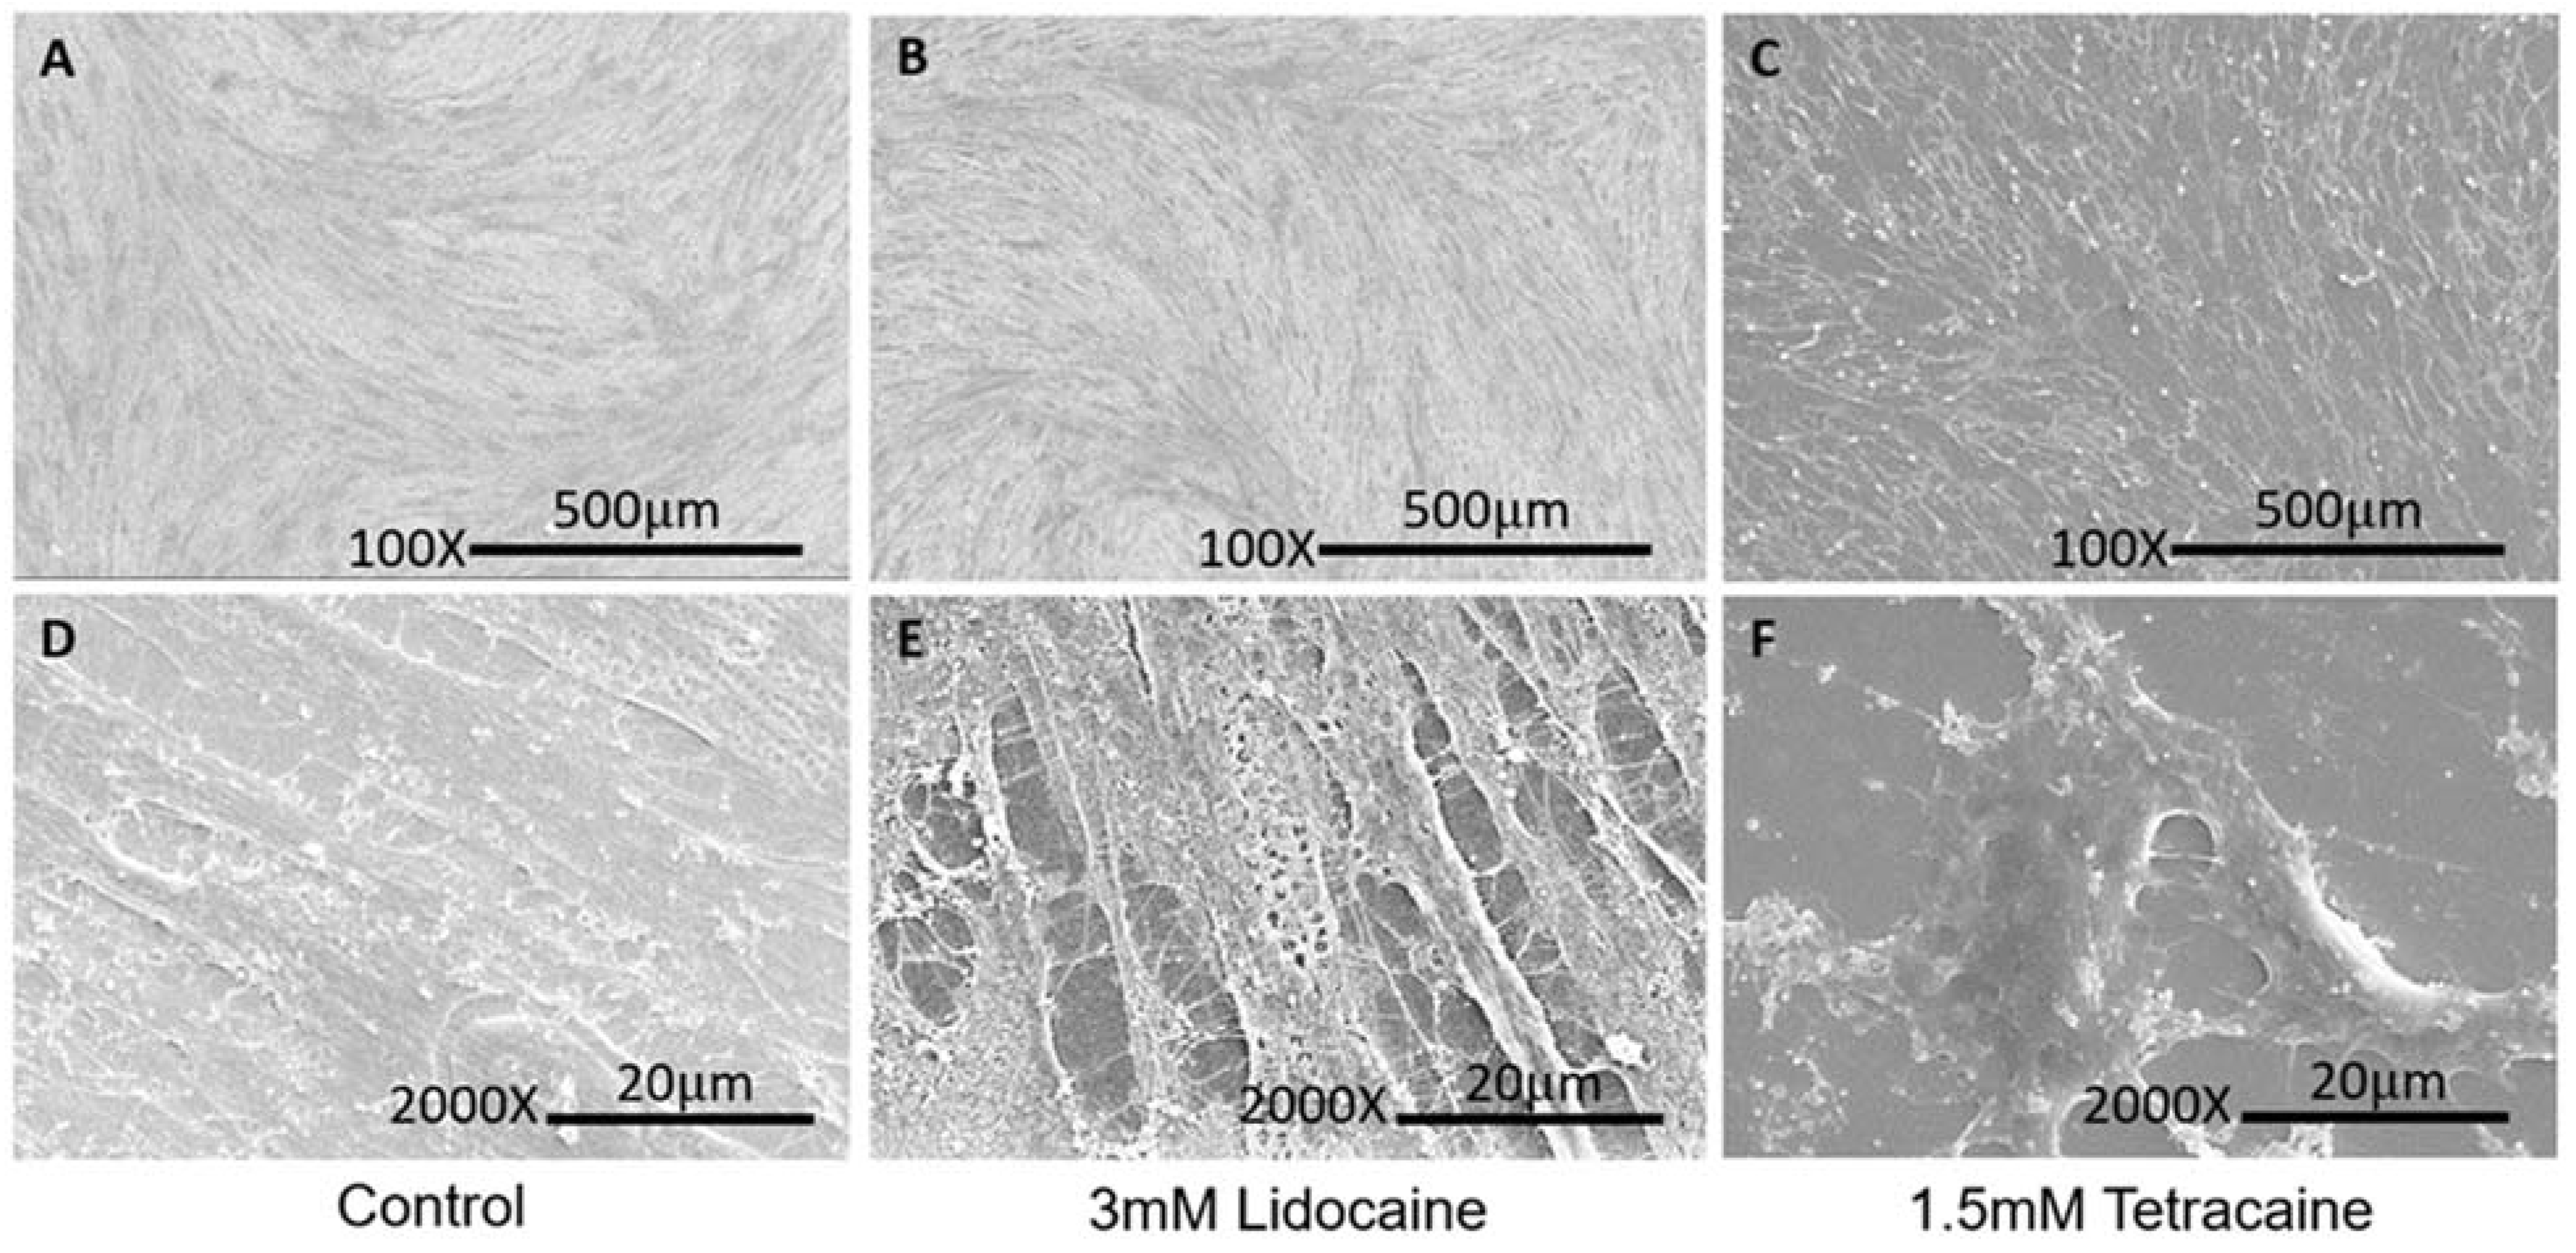
2.4. Surface Morphological Analysis
2.5. Colorimetric Assay
2.6. Data Analysis
2.7. Electrophysiology Assay with the Model Protein gA
3. Results and Discussion
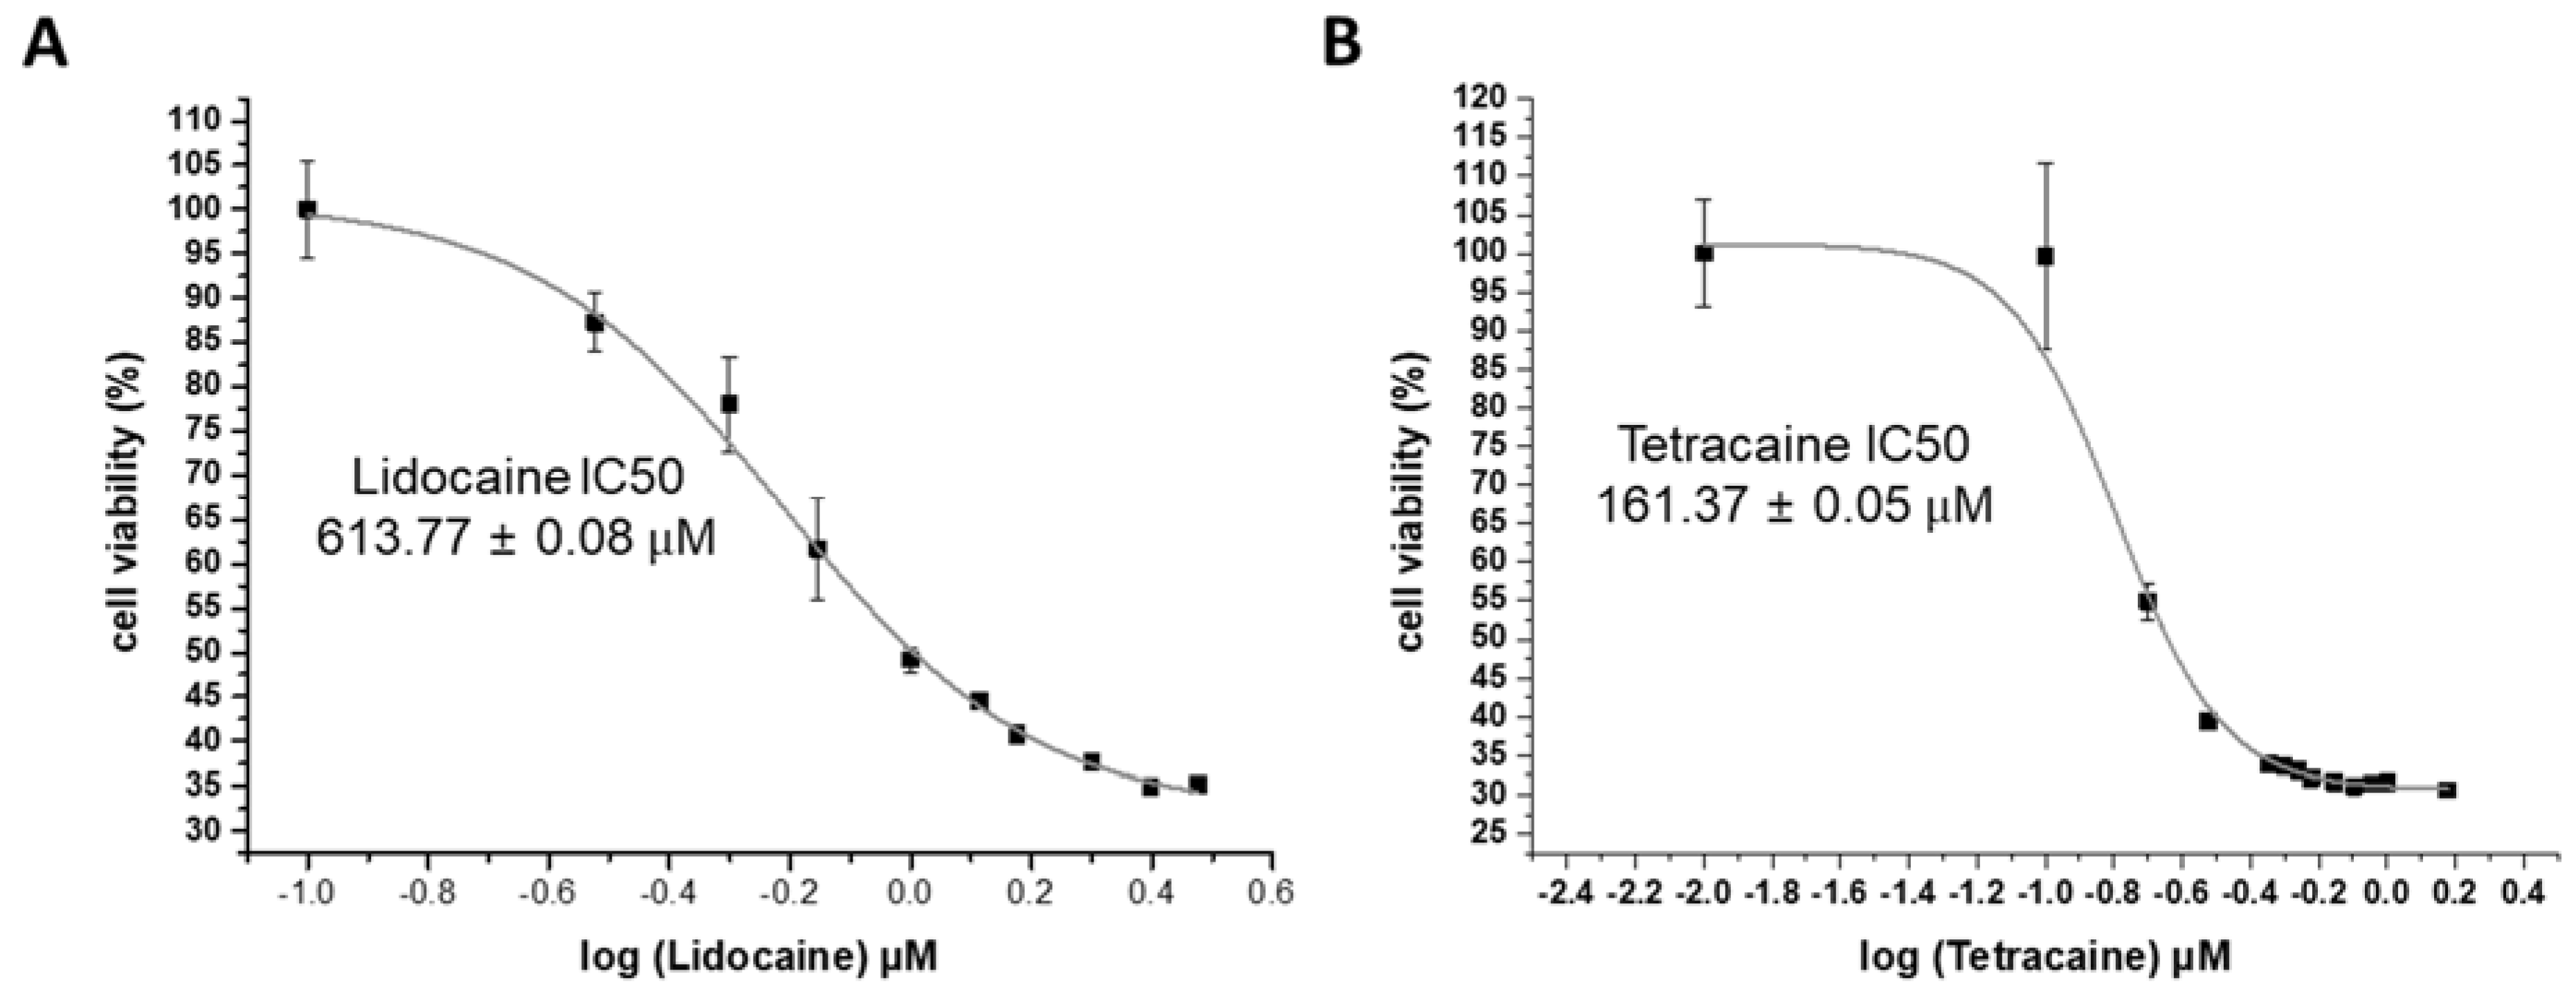
3.1. Cell Cytotoxicity Analysis
3.2. Membrane Affinity Analysis
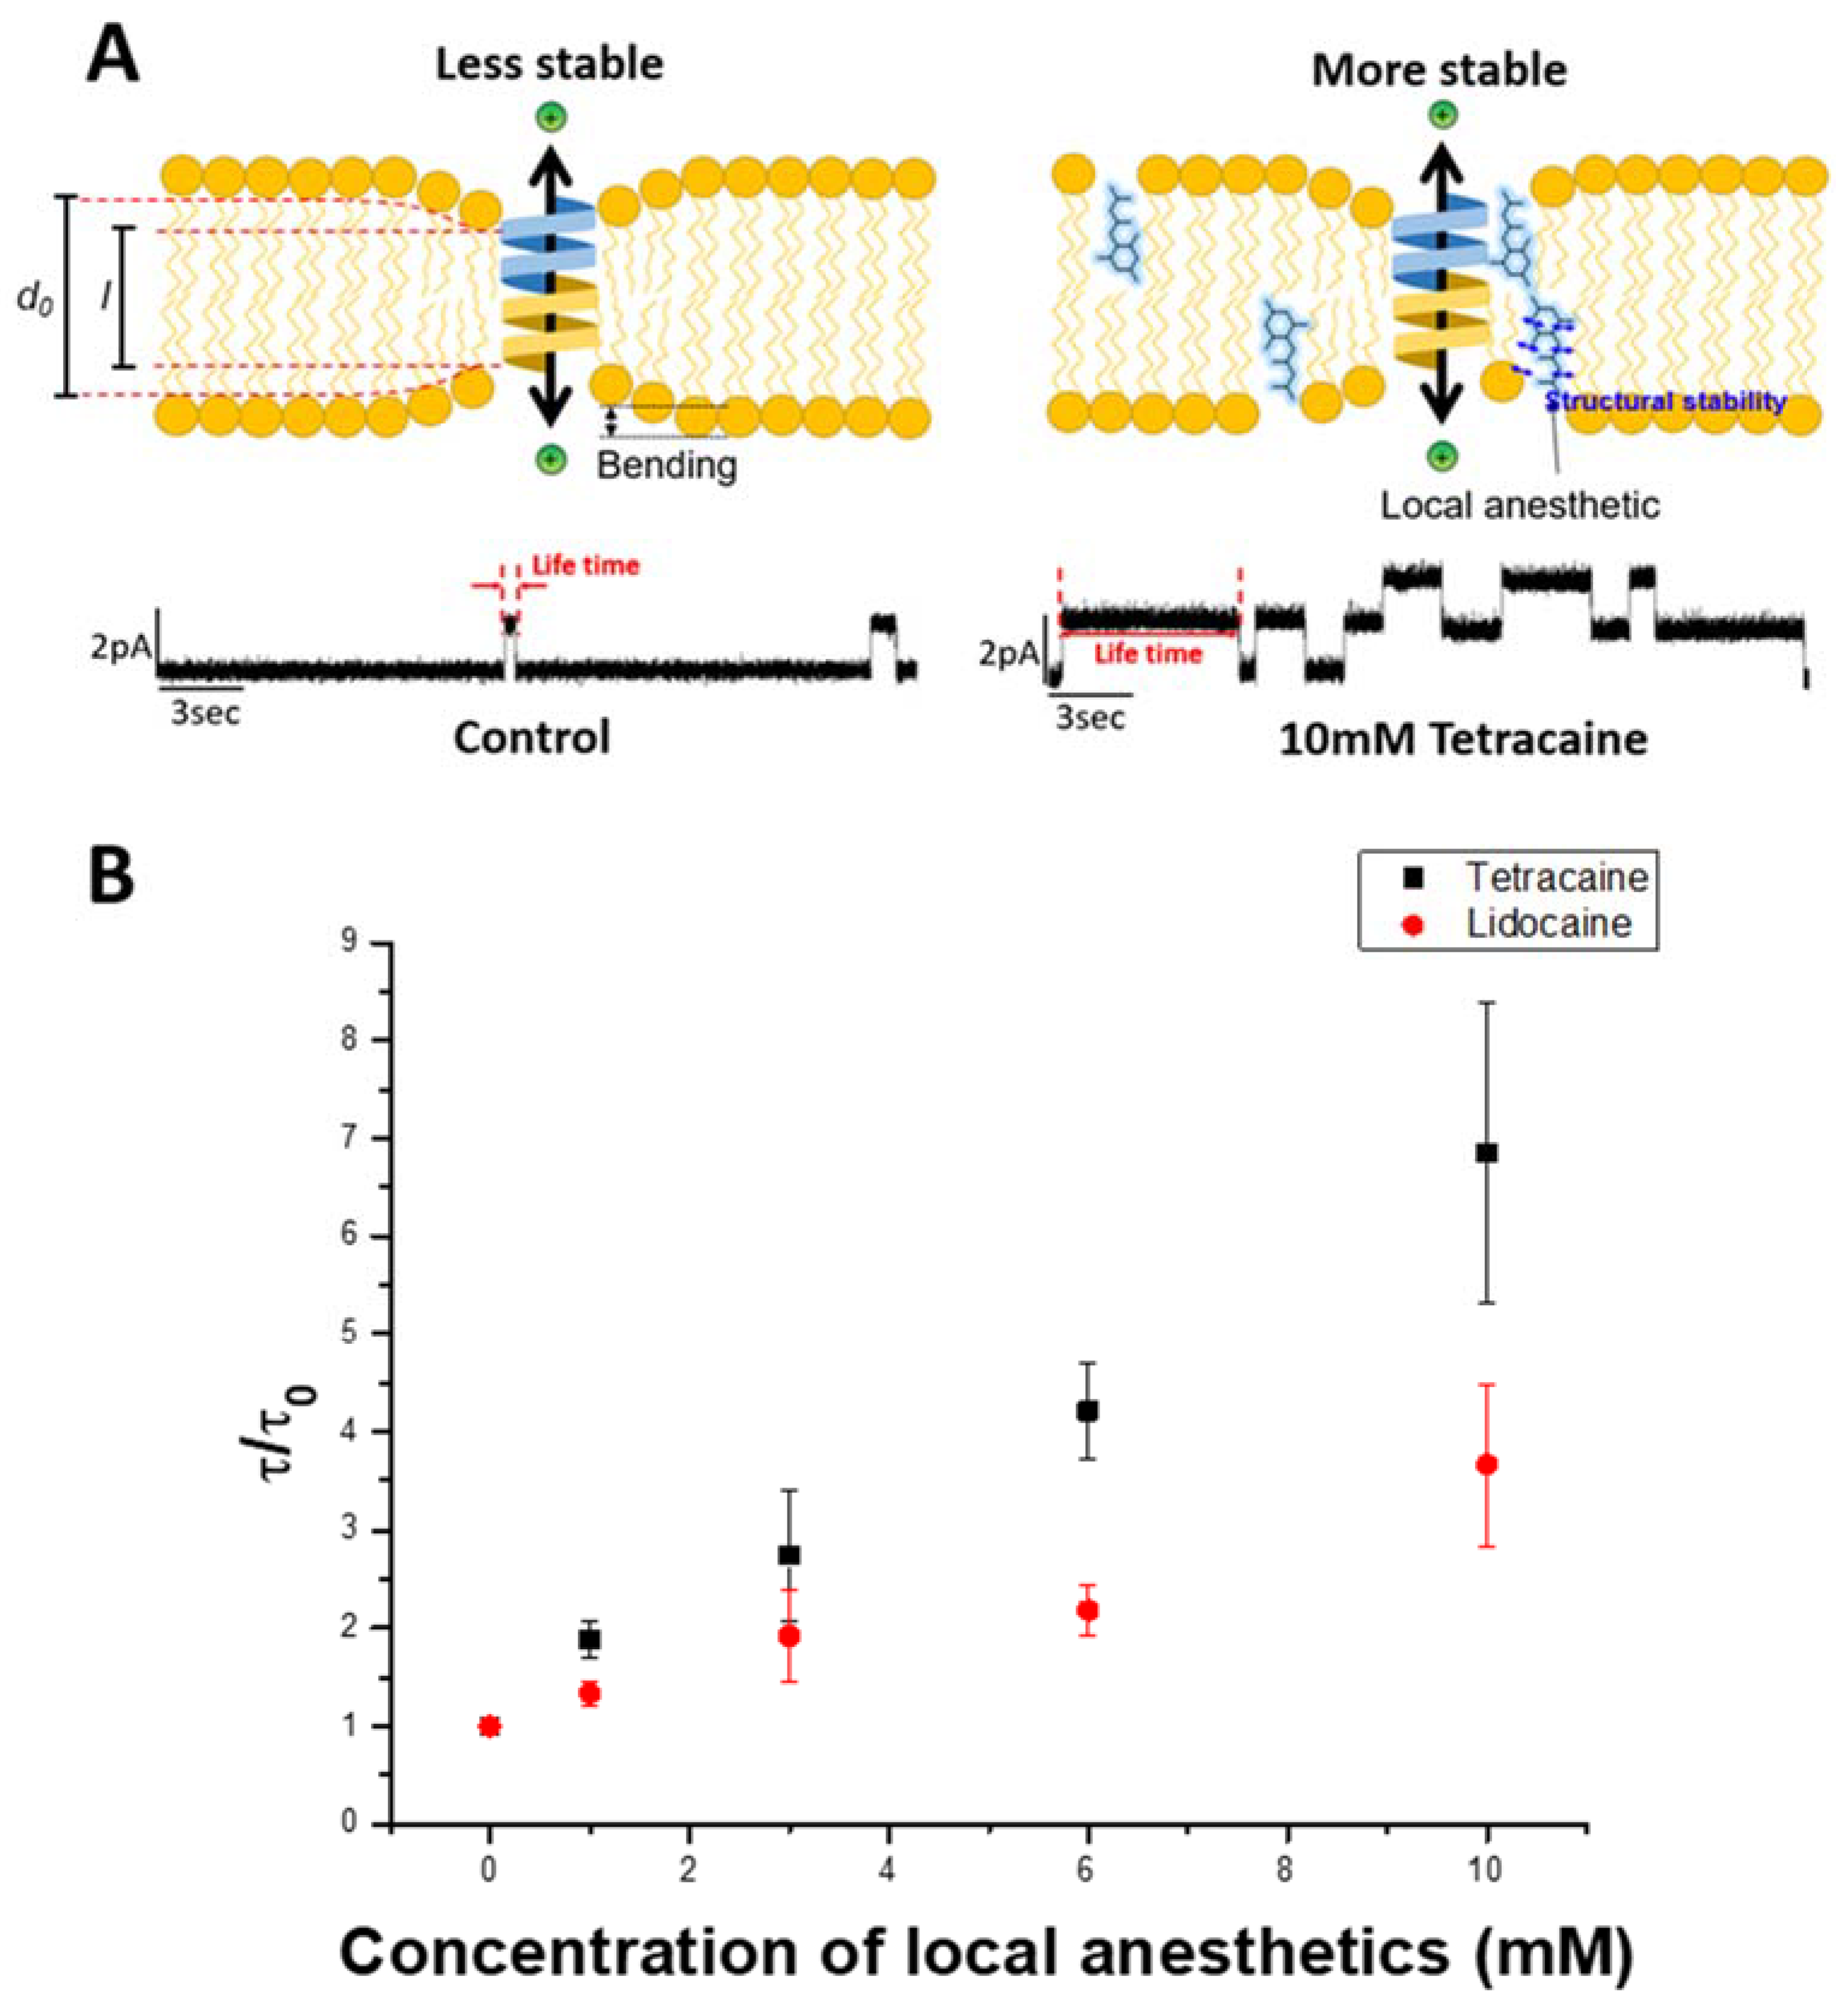
3.3. Electrophysiological Analysis
4. Conclusions
Author Contributions
Funding
Institutional Review Board Statement
Informed Consent Statement
Data Availability Statement
Conflicts of Interest
References
- Tsuchiya, H.; Mizogami, M. Interaction of Local Anesthetics with Biomembranes Consisting of Phospholipids and Cholesterol: Mechanistic and Clinical Implications for Anesthetic and Cardiotoxic Effects. Anesthesiol. Res. Pract. 2013, 2013, 1–18. [Google Scholar] [CrossRef] [PubMed] [Green Version]
- Manders, E.K.; Schenden, M.J.; Furrey, J.A.; Hetzler, P.T.; Davis, T.S.; Graham, W.P. Soft-Tissue Expansion: Concepts and Complications. Plast. Reconstr. Surg. 1984, 74, 493–507. [Google Scholar] [CrossRef] [PubMed]
- Wright, S.N.; Wang, S.Y.; Wang, G.K. Lysine point mutations in Na+ channel D4-S6 reduce inactivated channel block by local anesthetics. Mol. Pharmacol. 1998, 54, 733–739. [Google Scholar]
- Becker, D.E.; Reed, K.L. Essentials of Local Anesthetic Pharmacology. Anesth. Prog. 2006, 53, 98–109. [Google Scholar] [CrossRef]
- Clarkson, C.W.; Follmer, C.H.; Eick, R.E.T.; Hondeghem, L.M.; Yeh, J.Z. Evidence for two components of sodium channel block by lidocaine in isolated cardiac myocytes. Circ. Res. 1988, 63, 869–878. [Google Scholar] [CrossRef] [Green Version]
- Scholz, A. Mechanisms of (local) anaesthetics on voltage-gated sodium and other ion channels. Br. J. Anaesth. 2002, 89, 52–61. [Google Scholar] [CrossRef] [Green Version]
- Hara, K.; Sata, T. The Effects of the Local Anesthetics Lidocaine and Procaine on Glycine and ??-Aminobutyric Acid Receptors Expressed in Xenopus Oocytes. Anesth. Analg. 2007, 104, 1434–1439. [Google Scholar] [CrossRef]
- Kinoshita, M.; Chitose, T.; Matsumori, N. Mechanism of local anesthetic-induced disruption of raft-like ordered membrane domains. Biochim. Biophys. Acta (BBA)-Gen. Subj. 2019, 1863, 1381–1389. [Google Scholar] [CrossRef] [PubMed]
- Zapata-Morin, P.A.; Sierra-Valdez, F.; Ruiz-Suárez, J. The interaction of local anesthetics with lipid membranes. J. Mol. Graph. Model. 2014, 53, 200–205. [Google Scholar] [CrossRef]
- Ruokonen, S.-K.; Dusa, F.; Rantamäki, A.H.; Robciuc, A.; Holma, P.; Holopainen, J.M.; Abdel-Rehim, M.; Wiedmer, S.K. Distribution of local anesthetics between aqueous and liposome phases. J. Chromatogr. A 2017, 1479, 194–203. [Google Scholar] [CrossRef]
- Kim, Y.H.; Park, G.Y.; Rabinovitch, N.; Tarafder, S.; Lee, C.H. Effect of local anesthetics on viability and differentiation of various adult stem/progenitor cells. Stem Cell Res. Ther. 2020, 11, 1–13. [Google Scholar] [CrossRef]
- Kubrova, E.; Su, M.; Galeano-Garces, C.; Galvan, M.L.; Jerez, S.; Dietz, A.B.; Smith, J.; Qu, W.; Van Wijnen, A.J. Differences in Cytotoxicity of Lidocaine, Ropivacaine, and Bupivacaine on the Viability and Metabolic Activity of Human Adipose-Derived Mesenchymal Stem Cells. Am. J. Phys. Med. Rehabil. 2020, 100, 82–91. [Google Scholar] [CrossRef]
- Weizenmann, N.; Huster, D.; Scheidt, H.A. Interaction of local anesthetics with lipid bilayers investigated by 1H MAS NMR spectroscopy. Biochim. Biophys. Acta (BBA) Biomembr. 2012, 1818, 3010–3018. [Google Scholar] [CrossRef] [PubMed] [Green Version]
- Pardo, L.; Blanck, T.; Recio-Pinto, E. The neuronal lipid membrane permeability was markedly increased by bupivacaine and mildly affected by lidocaine and ropivacaine. Eur. J. Pharmacol. 2002, 455, 81–90. [Google Scholar] [CrossRef]
- Tsuchiya, H.; Ueno, T.; Mizogami, M.; Takakura, K. Local anesthetics structure-dependently interact with anionic phospholipid membranes to modify the fluidity. Chem. Interact. 2010, 183, 19–24. [Google Scholar] [CrossRef]
- Sugahara, K.; Shimokawa, N.; Takagi, M. Thermal Stability of Phase-Separated Domains in Multicomponent Lipid Membranes with Local Anesthetics. Membranes 2017, 7, 33. [Google Scholar] [CrossRef] [Green Version]
- Efimova, S.S.; Zakharova, A.A.; Schagina, L.V.; Ostroumova, O. Local Anesthetics Affect Gramicidin A Channels via Membrane Electrostatic Potentials. J. Membr. Biol. 2016, 249, 781–787. [Google Scholar] [CrossRef] [PubMed]
- Braet, F.; De Zanger, R.; Wisse, E. Drying cells for SEM, AFM and TEM by hexamethyldisilazane: A study on hepatic endothelial cells. J. Microsc. 1997, 186, 84–87. [Google Scholar] [CrossRef] [PubMed]
- Jung, S.-H.; Jang, H.; Lim, M.-C.; Kim, J.-H.; Shin, K.-S.; Kim, S.M.; Kim, H.-Y.; Kim, Y.-R.; Jeon, T.-J. Chromatic Biosensor for Detection of Phosphinothricin Acetyltransferase by Use of Polydiacetylene Vesicles Encapsulated within Automatically Generated Immunohydrogel Beads. Anal. Chem. 2015, 87, 2072–2078. [Google Scholar] [CrossRef]
- Fuwad, A.; Ryu, H.; Lee, J.-H.; Kim, D.; Yoo, Y.-E.; Kim, Y.-R.; Kim, S.M.; Jeon, T.-J. An electrokinetic approach to fabricating aquaporin biomimetic membranes for water purification. Desalination 2019, 452, 9–16. [Google Scholar] [CrossRef]
- Wei, M.; Xia, Y.; Liu, J.; Feng, F.; Zheng, F. A polydiacetylene-based fluorescence assay for the measurement of lipid membrane affinity. RSC Adv. 2015, 5, 66420–66425. [Google Scholar] [CrossRef]
- Park, J.; Ryu, H.; Shim, J.; Kim, S.M.; Kim, Y.-R.; Jeon, T.-J.; Lim, M. Nanopore based detection of Bacillus thuringiensis HD-73 spores using aptamers and versatile DNA hairpins. Nanoscale 2018, 10, 11955–11961. [Google Scholar] [CrossRef]
- Ryu, H.; Choi, S.; Park, J.; Yoo, Y.-E.; Yoon, J.S.; Seo, Y.H.; Kim, Y.-R.; Kim, S.M.; Jeon, T.-J. Automated Lipid Membrane Formation Using a Polydimethylsiloxane Film for Ion Channel Measurements. Anal. Chem. 2014, 86, 8910–8915. [Google Scholar] [CrossRef] [PubMed]
- Kumar, P.; Nagarajan, A.; Uchil, P. Analysis of Cell Viability by the Lactate Dehydrogenase Assay. Cold Spring Harb. Protoc. 2018, 2018. [Google Scholar] [CrossRef] [PubMed]
- Pang, X.; Fan, T.-J. Cytotoxic effect and possible mechanisms of Tetracaine on human corneal epithelial cells in vitro. Int. J. Ophthalmol. 2016, 9, 497–504. [Google Scholar] [CrossRef]
- Charoenthai, N.; Pattanatornchai, T.; Wacharasindhu, S.; Sukwattanasinitt, M.; Traiphol, R. Roles of head group architecture and side chain length on colorimetric response of polydiacetylene vesicles to temperature, ethanol and pH. J. Colloid Interface Sci. 2011, 360, 565–573. [Google Scholar] [CrossRef]
- Ikonen, M.; Murtomäki, L.; Kontturi, K. An electrochemical method for the determination of liposome–water partition coefficients of drugs. J. Electroanal. Chem. 2007, 602, 189–194. [Google Scholar] [CrossRef]
- Lundbæk, J.A.; Collingwood, S.A.; Ingólfsson, H.I.; Kapoor, R.; Andersen, O.S. Lipid bilayer regulation of membrane protein function: Gramicidin channels as molecular force probes. J. R. Soc. Interface 2009, 7, 373–395. [Google Scholar] [CrossRef] [PubMed] [Green Version]
- Bamberg, E.; Läuger, P. Channel formation kinetics of gramicidin A in lipid bilayer membranes. J. Membr. Biol. 1973, 11, 177–194. [Google Scholar] [CrossRef]
- Veatch, W.; Mathies, R.; Eisenberg, M.; Stryer, L. Simultaneous fluorescence and conductance studies of planar bilayer membranes containing a highly active and fluorescent analog of gramicidin A. J. Mol. Biol. 1975, 99, 75–92. [Google Scholar] [CrossRef]
- Harroun, T.; Heller, W.; Weiss, T.M.; Yang, L.; Huang, H.W. Experimental Evidence for Hydrophobic Matching and Membrane-Mediated Interactions in Lipid Bilayers Containing Gramicidin. Biophys. J. 1999, 76, 937–945. [Google Scholar] [CrossRef] [Green Version]
- Huang, H. Deformation free energy of bilayer membrane and its effect on gramicidin channel lifetime. Biophys. J. 1986, 50, 1061–1070. [Google Scholar] [CrossRef] [Green Version]
- Lundbæk, J.A.; Birn, P.; Hansen, A.J.; Søgaard, R.; Hélix-Nielsen, C.; Girshman, J.; Bruno, M.J.; Tape, S.E.; Egebjerg, J.; Greathouse, D.V.; et al. Regulation of Sodium Channel Function by Bilayer Elasticity. J. Gen. Physiol. 2004, 123, 599–621. [Google Scholar] [CrossRef] [PubMed] [Green Version]
- Kondrashov, O.; Galimzyanov, T.; Pavlov, K.V.; Kotova, E.A.; Antonenko, Y.N.; Akimov, S.A. Membrane Elastic Deformations Modulate Gramicidin a Transbilayer Dimerization and Lateral Clustering. Biophys. J. 2018, 115, 478–493. [Google Scholar] [CrossRef] [Green Version]
- Nielsen, C.; Andersen, O.S. Inclusion-Induced Bilayer Deformations: Effects of Monolayer Equilibrium Curvature. Biophys. J. 2000, 79, 2583–2604. [Google Scholar] [CrossRef] [Green Version]
- Lundbæk, J.A. Lipid Bilayer–mediated Regulation of Ion Channel Function by Amphiphilic Drugs. J. Gen. Physiol. 2008, 131, 421–429. [Google Scholar] [CrossRef] [Green Version]


| Local Anesthetics | IC50 LDH Assay | IC50 CCK Assay | EC 50 PDA Assay | Normalized gA Dimer Lifetime at 10 mM |
|---|---|---|---|---|
| Lidocaine | 545.97 ± 0.02 μM | 613.77 ± 0.08 μM | 11.25 ± 0.64 mM | 3.66 ± 0.82 |
| Tetracaine | 219.36 ± 0.01 μM | 161.37 ± 0.05 μM | 2.11 ± 0.31 mM | 6.85 ± 1.53 |
Publisher’s Note: MDPI stays neutral with regard to jurisdictional claims in published maps and institutional affiliations. |
© 2021 by the authors. Licensee MDPI, Basel, Switzerland. This article is an open access article distributed under the terms and conditions of the Creative Commons Attribution (CC BY) license (https://creativecommons.org/licenses/by/4.0/).
Share and Cite
Choi, W.; Ryu, H.; Fuwad, A.; Goh, S.; Zhou, C.; Shim, J.; Takagi, M.; Kwon, S.; Kim, S.M.; Jeon, T.-J. Quantitative Analysis of the Membrane Affinity of Local Anesthetics Using a Model Cell Membrane. Membranes 2021, 11, 579. https://doi.org/10.3390/membranes11080579
Choi W, Ryu H, Fuwad A, Goh S, Zhou C, Shim J, Takagi M, Kwon S, Kim SM, Jeon T-J. Quantitative Analysis of the Membrane Affinity of Local Anesthetics Using a Model Cell Membrane. Membranes. 2021; 11(8):579. https://doi.org/10.3390/membranes11080579
Chicago/Turabian StyleChoi, Wanjae, Hyunil Ryu, Ahmed Fuwad, Seulmini Goh, Chaoge Zhou, Jiwook Shim, Masahiro Takagi, Soonjo Kwon, Sun Min Kim, and Tae-Joon Jeon. 2021. "Quantitative Analysis of the Membrane Affinity of Local Anesthetics Using a Model Cell Membrane" Membranes 11, no. 8: 579. https://doi.org/10.3390/membranes11080579
APA StyleChoi, W., Ryu, H., Fuwad, A., Goh, S., Zhou, C., Shim, J., Takagi, M., Kwon, S., Kim, S. M., & Jeon, T.-J. (2021). Quantitative Analysis of the Membrane Affinity of Local Anesthetics Using a Model Cell Membrane. Membranes, 11(8), 579. https://doi.org/10.3390/membranes11080579