
Molecular and Ionic Diffusion in Ion Exchange Membranes and Biological Systems (Cells and Proteins) Studied by NMR


 ,
,  and
and 
Abstract
1. Cation-Exchange Membranes. Structure, Hydration, Ionic, and Molecular Mobility
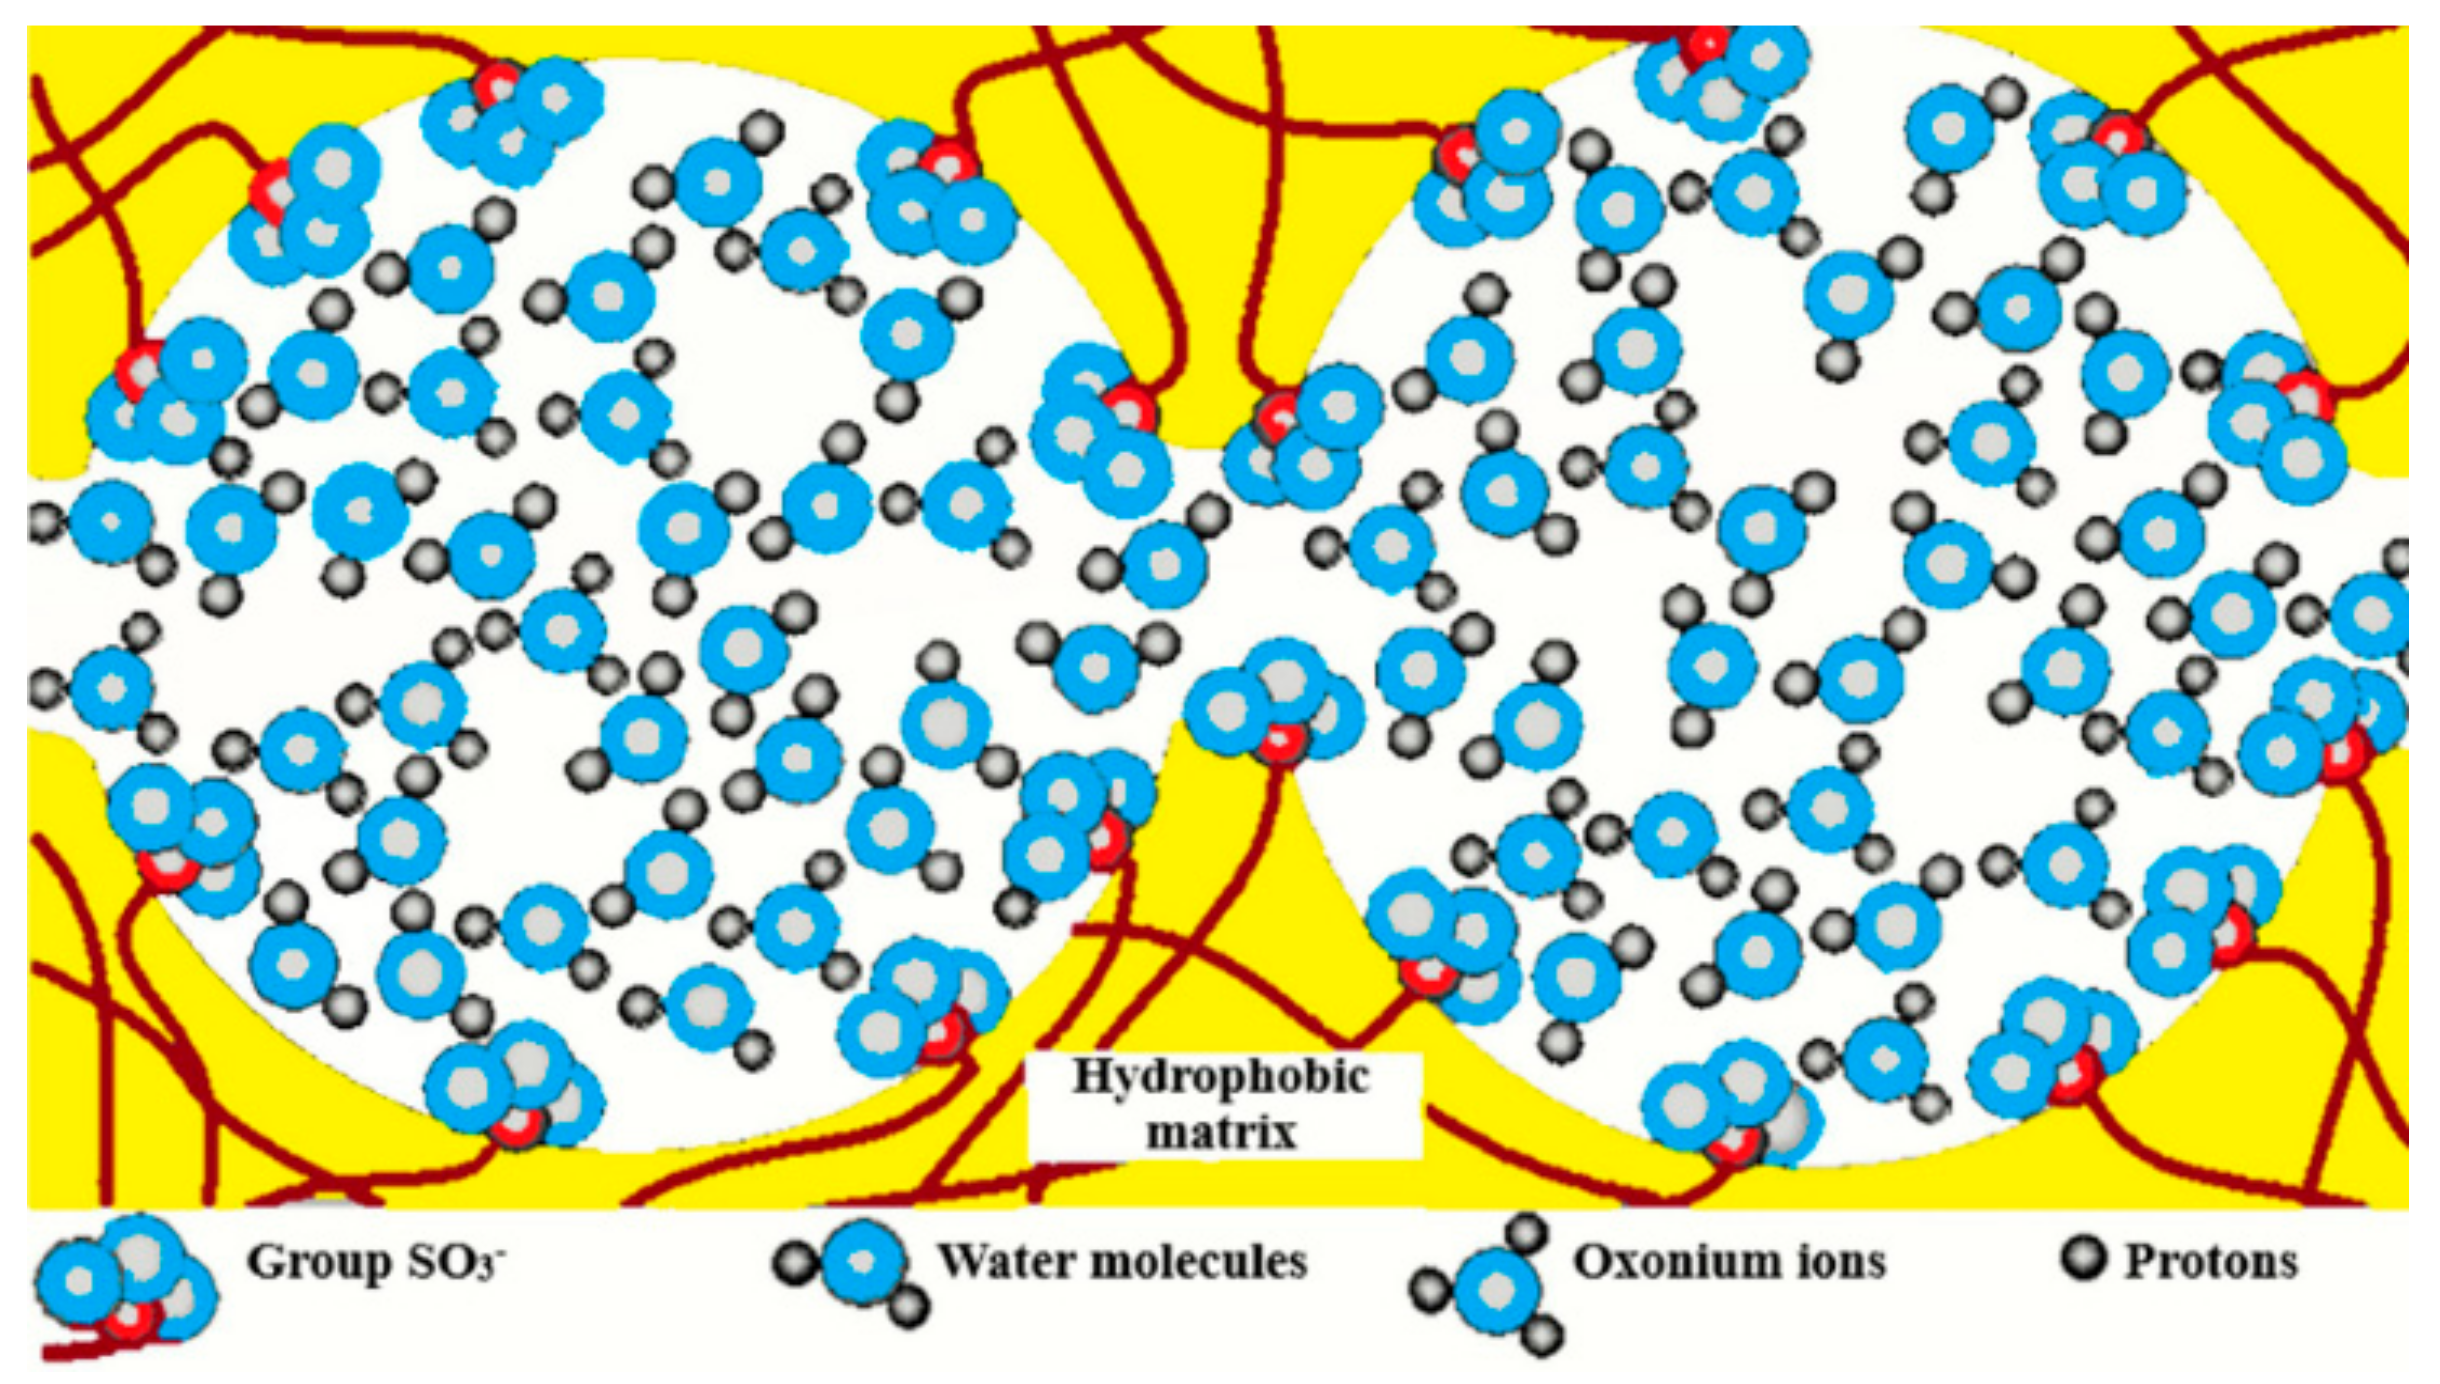
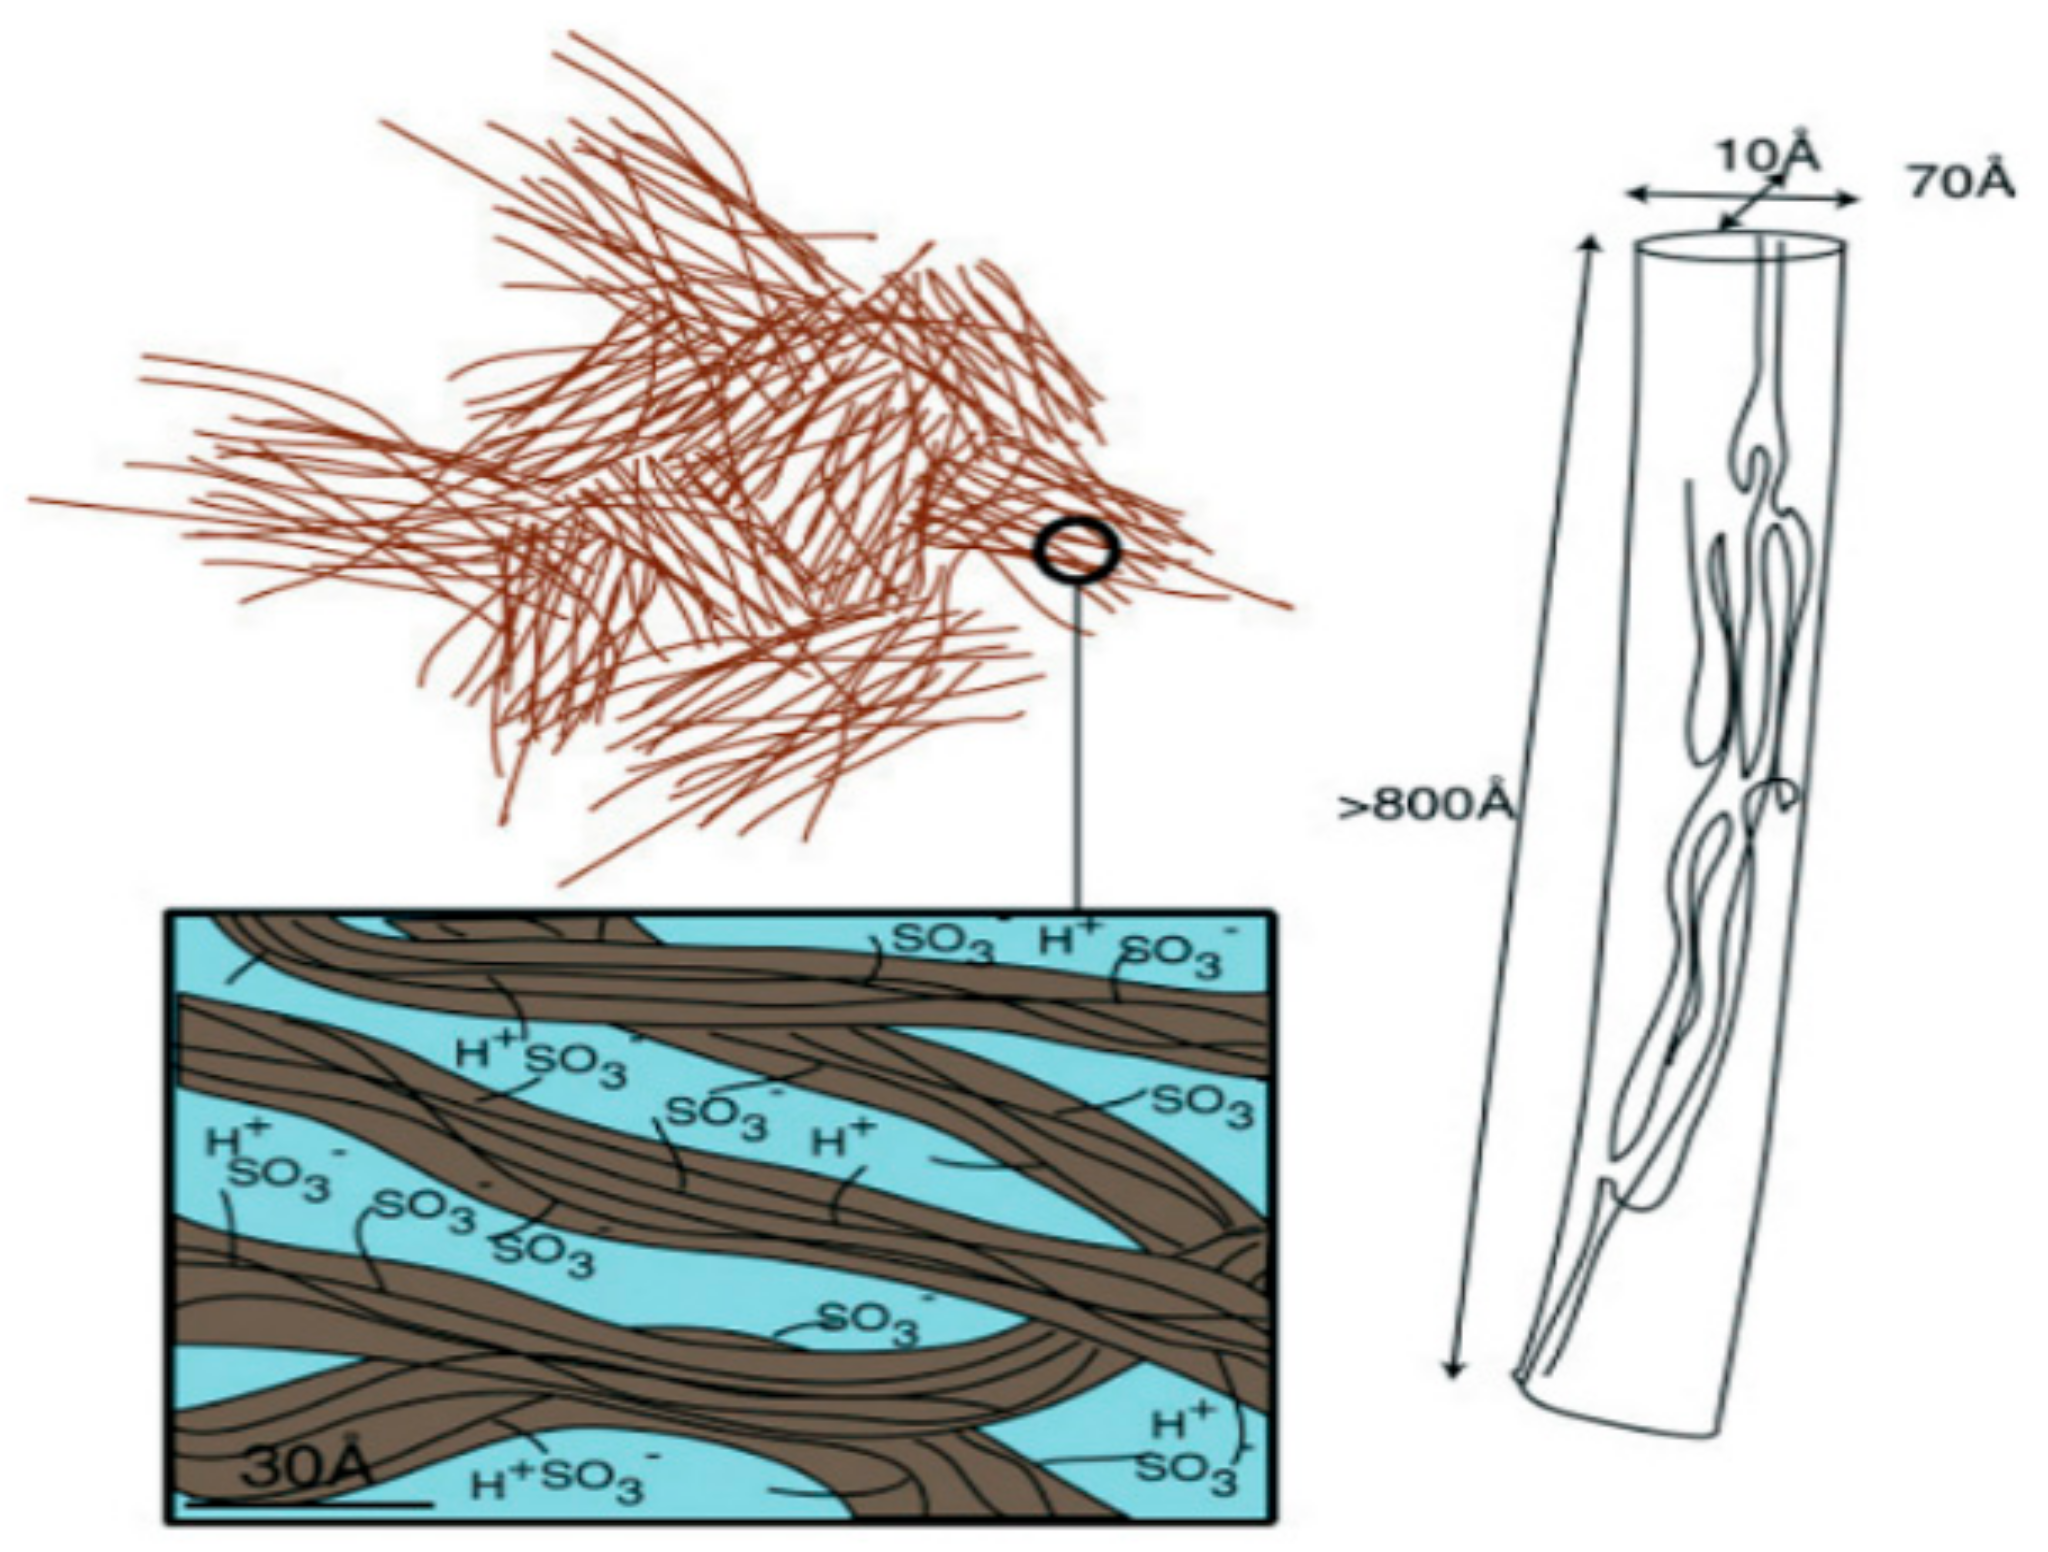
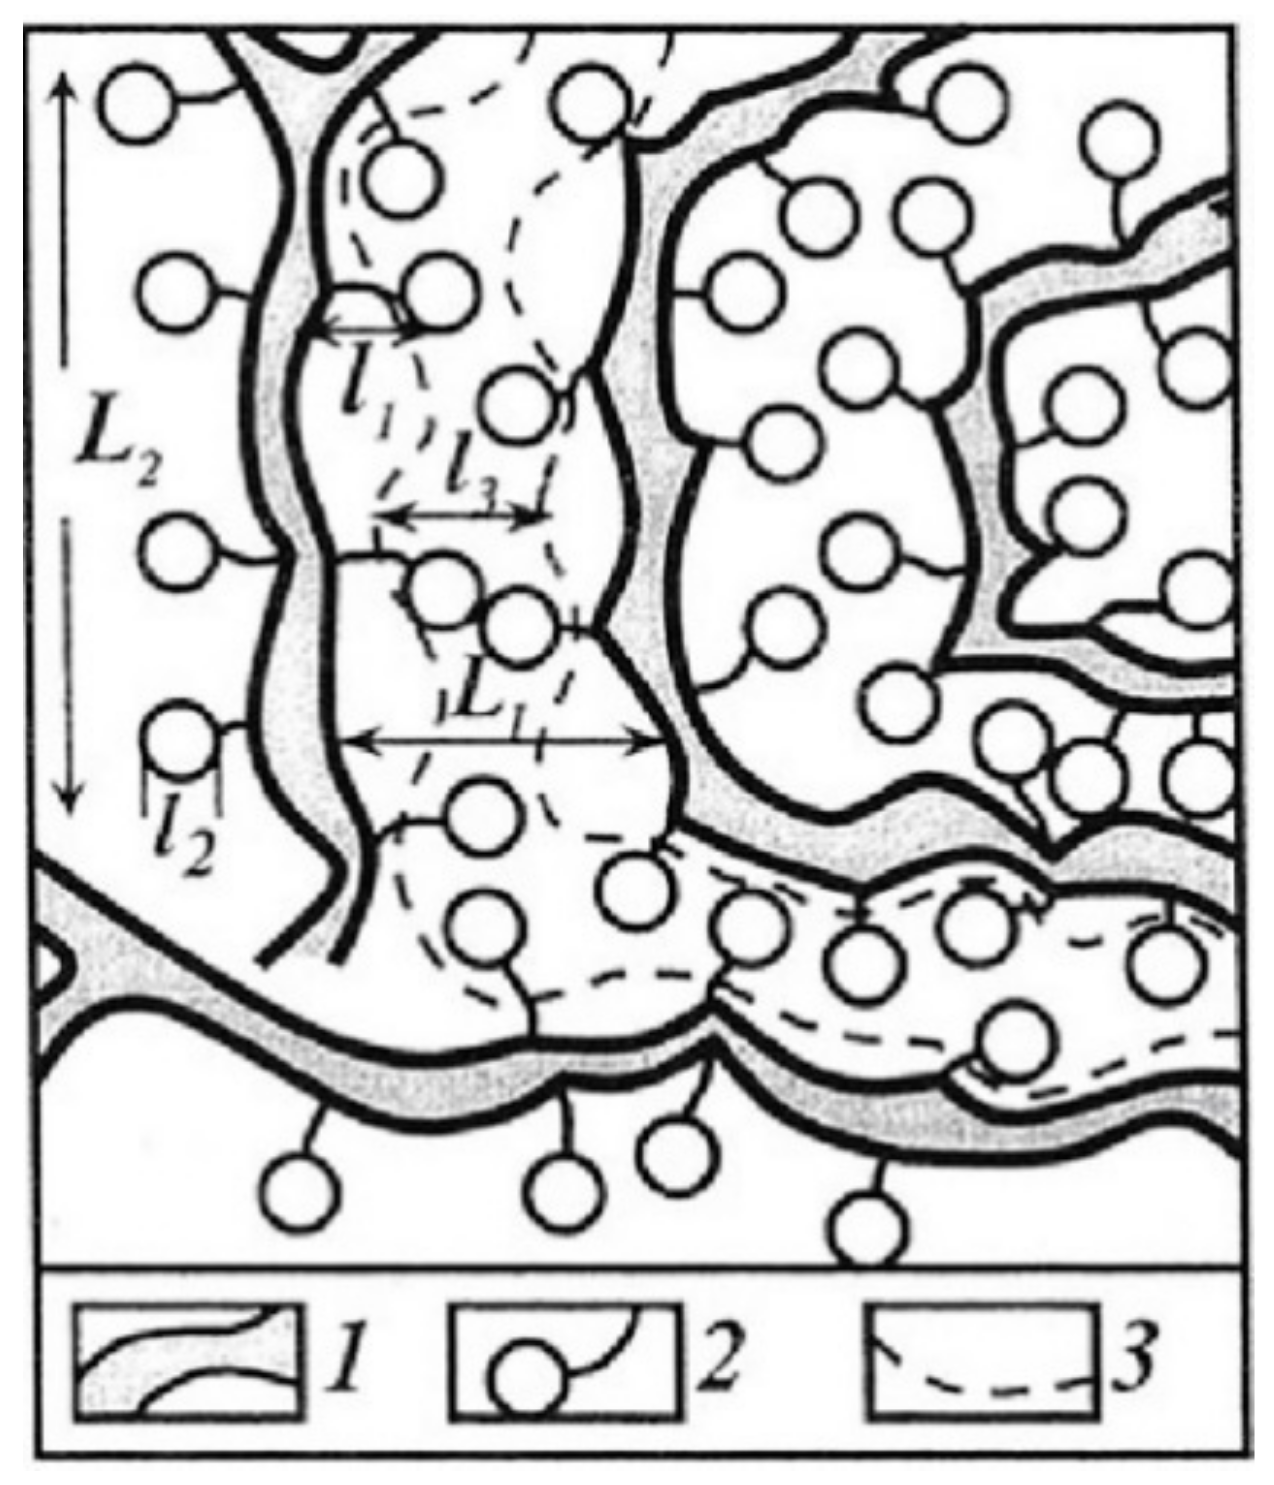
- The nanoscale structure of ion transport channels. The structure and dynamics of polymer matrix at the submicro level from several tenths of nanometer (sizes of solvated ions and molecules) to several nanometers or several tens of nanometers (characteristic lateral dimensions and lengths of ionic channels), determine the selective ion transport because these structural units form transport path for ion transfer by macroscopic distances. Studying the nanostructure opens up the prospects for targeted synthesis of ion exchange polymer, insofar as their preparation is accompanied by the formation of the nanostructure.
- The type of interaction of mobile ions and hydration water molecules with functional groups. Data on the structure of ionic complexes and on the mechanisms of interaction of ions and water molecules with the polymer matrix are necessary for understanding the mechanisms of selectivity of ion-exchange membranes and elementary steps of the diffusion transport of ions.
- The elementary steps of diffusion of ions and molecules, which can be characterized by the lifetime of a species on functional group, the time of translational displacement, the partial diffusion coefficient on various spatial scales (if diffusion occurs in a heterogeneous medium).
1.1. Ion-Exchange Membranes, Nanochannel Structure
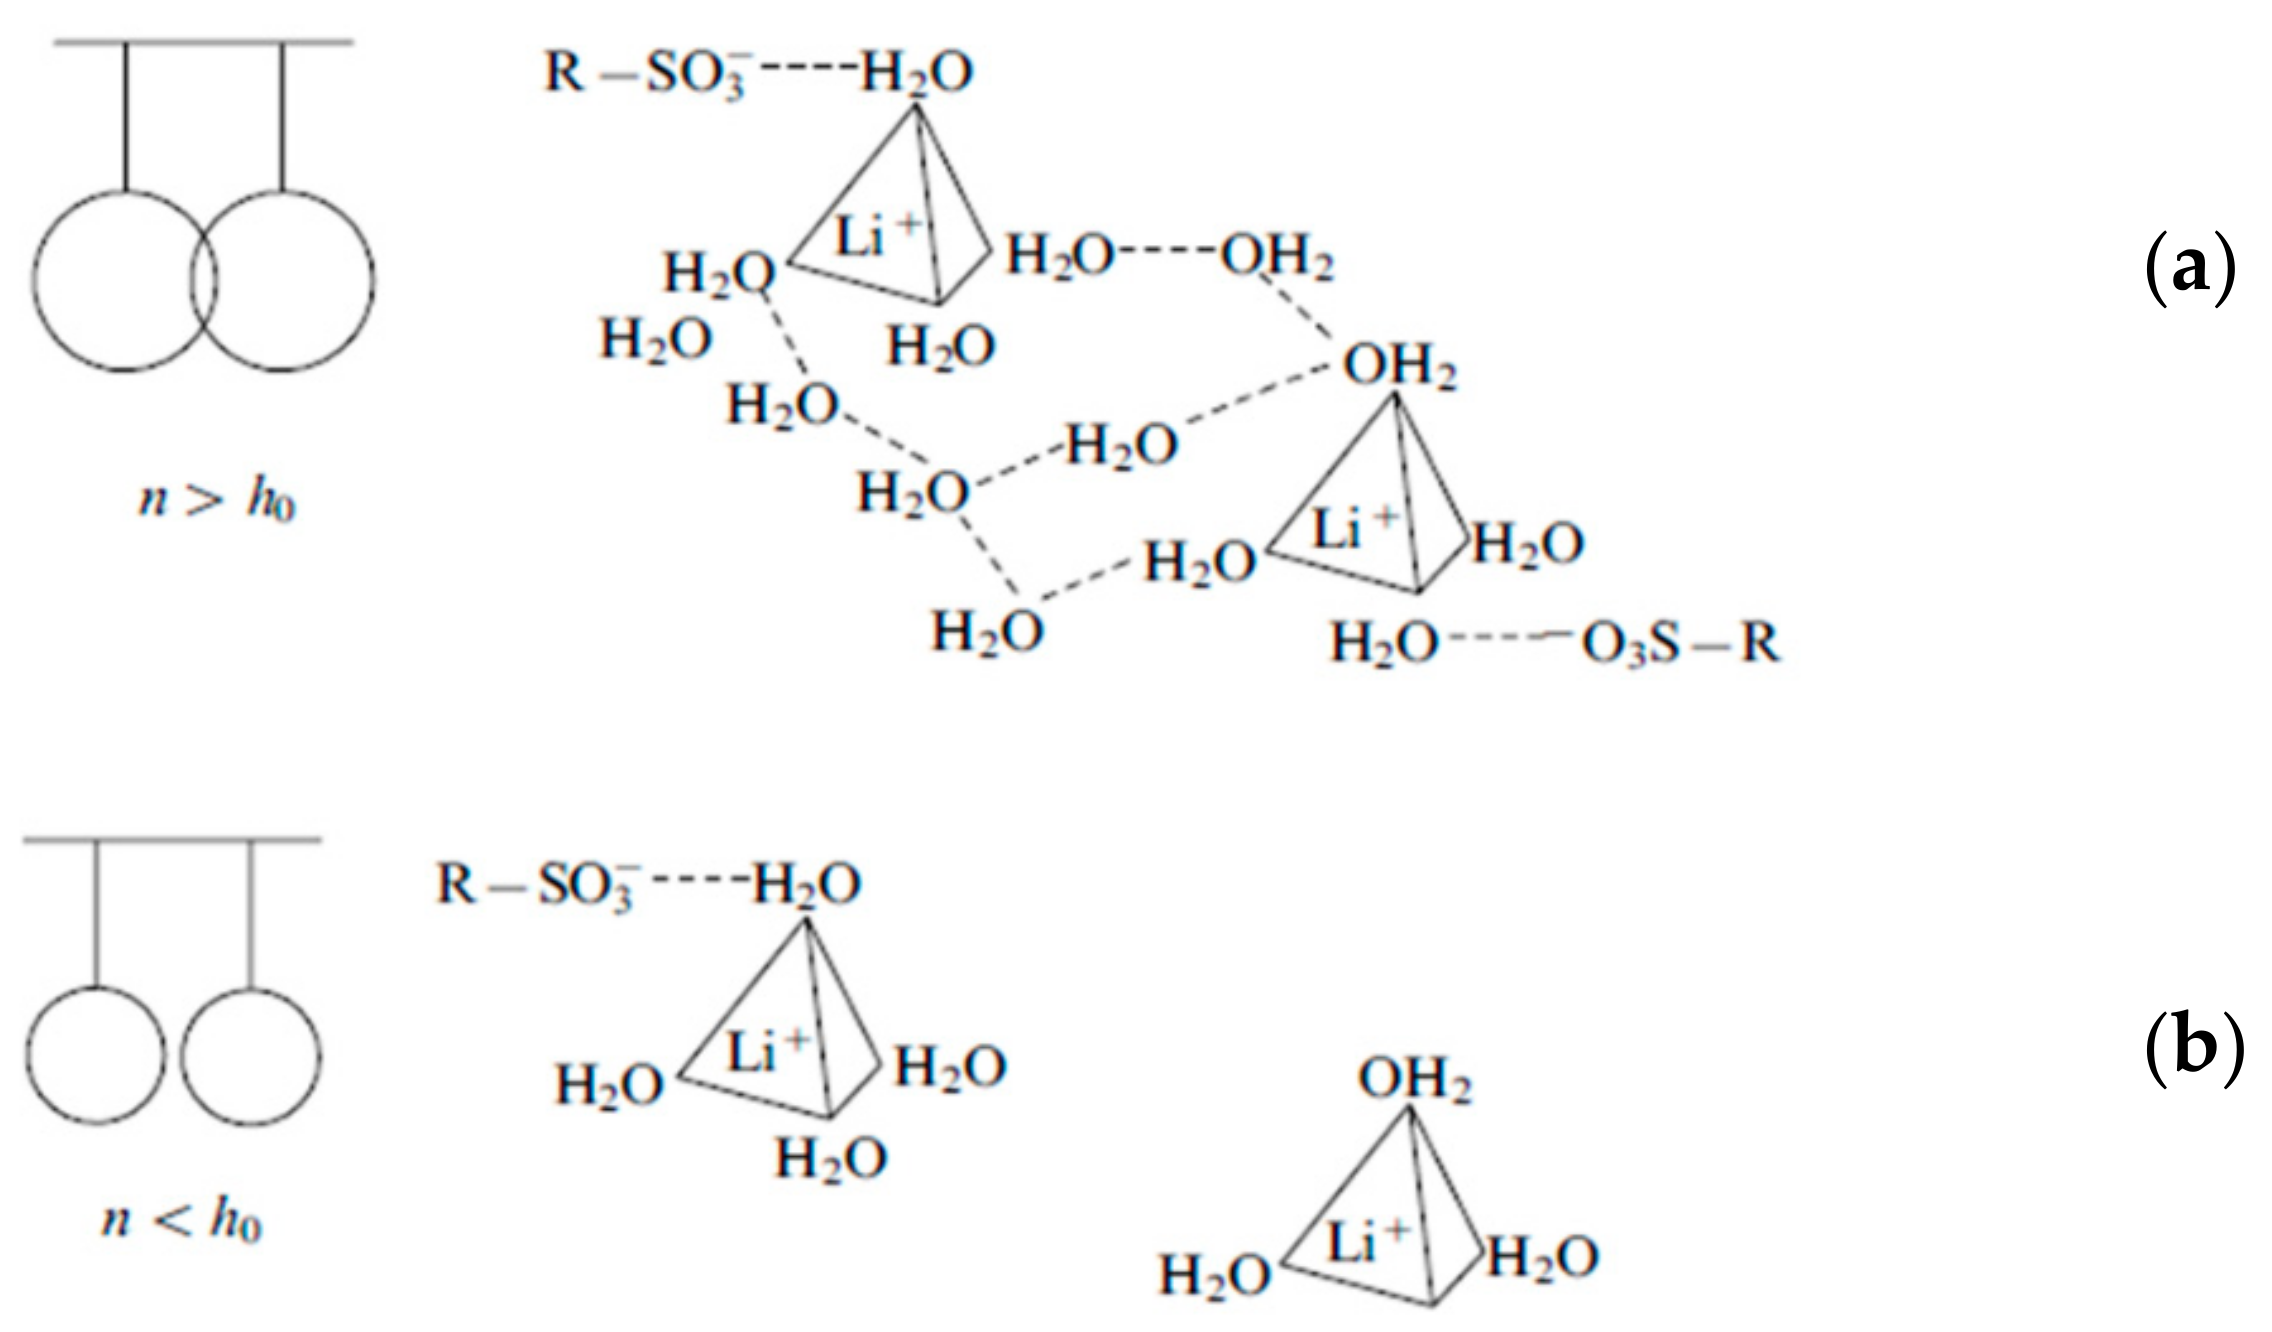
1.2. Specific Features of Cation Hydration. Mechanism of Cation—Functional Group Interaction
1.2.1. Cation Hydration
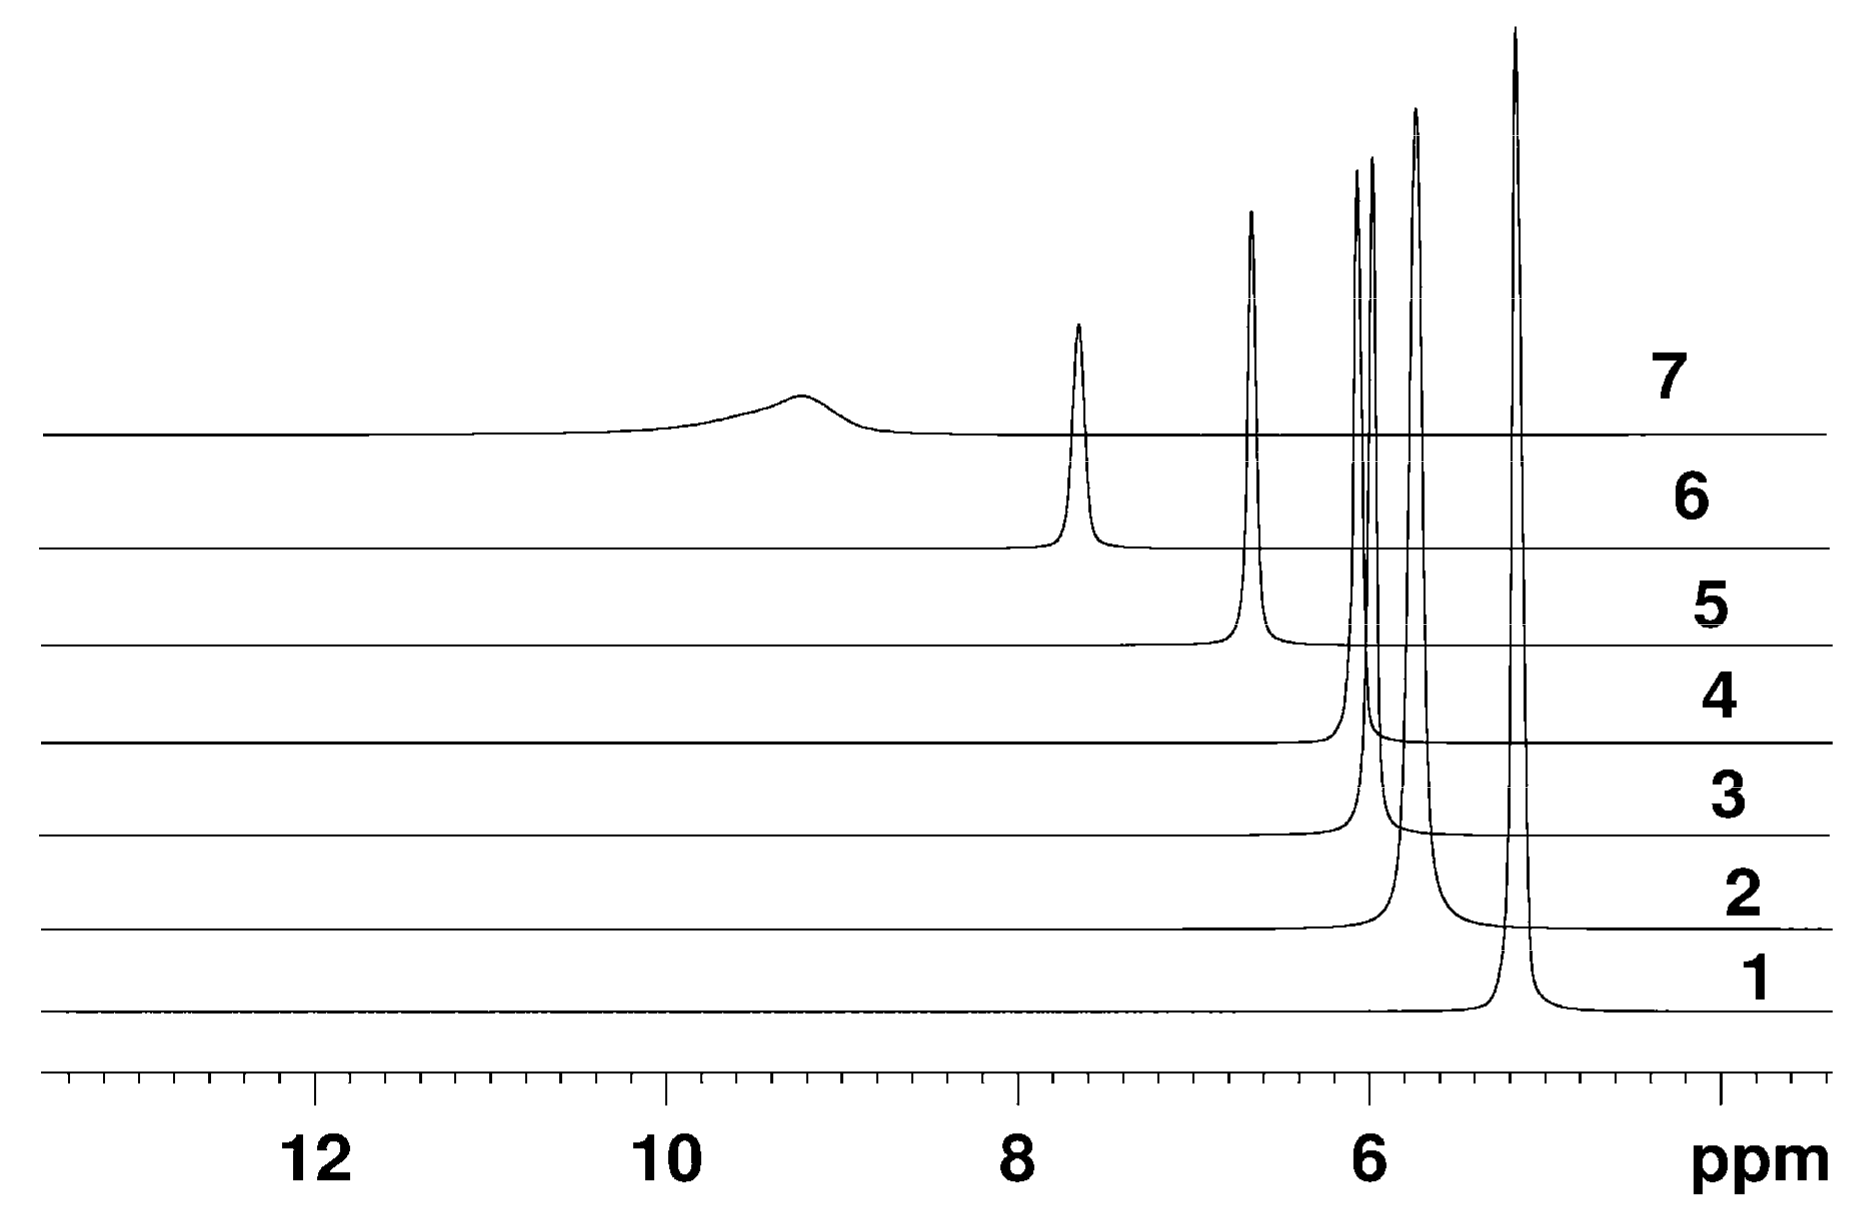
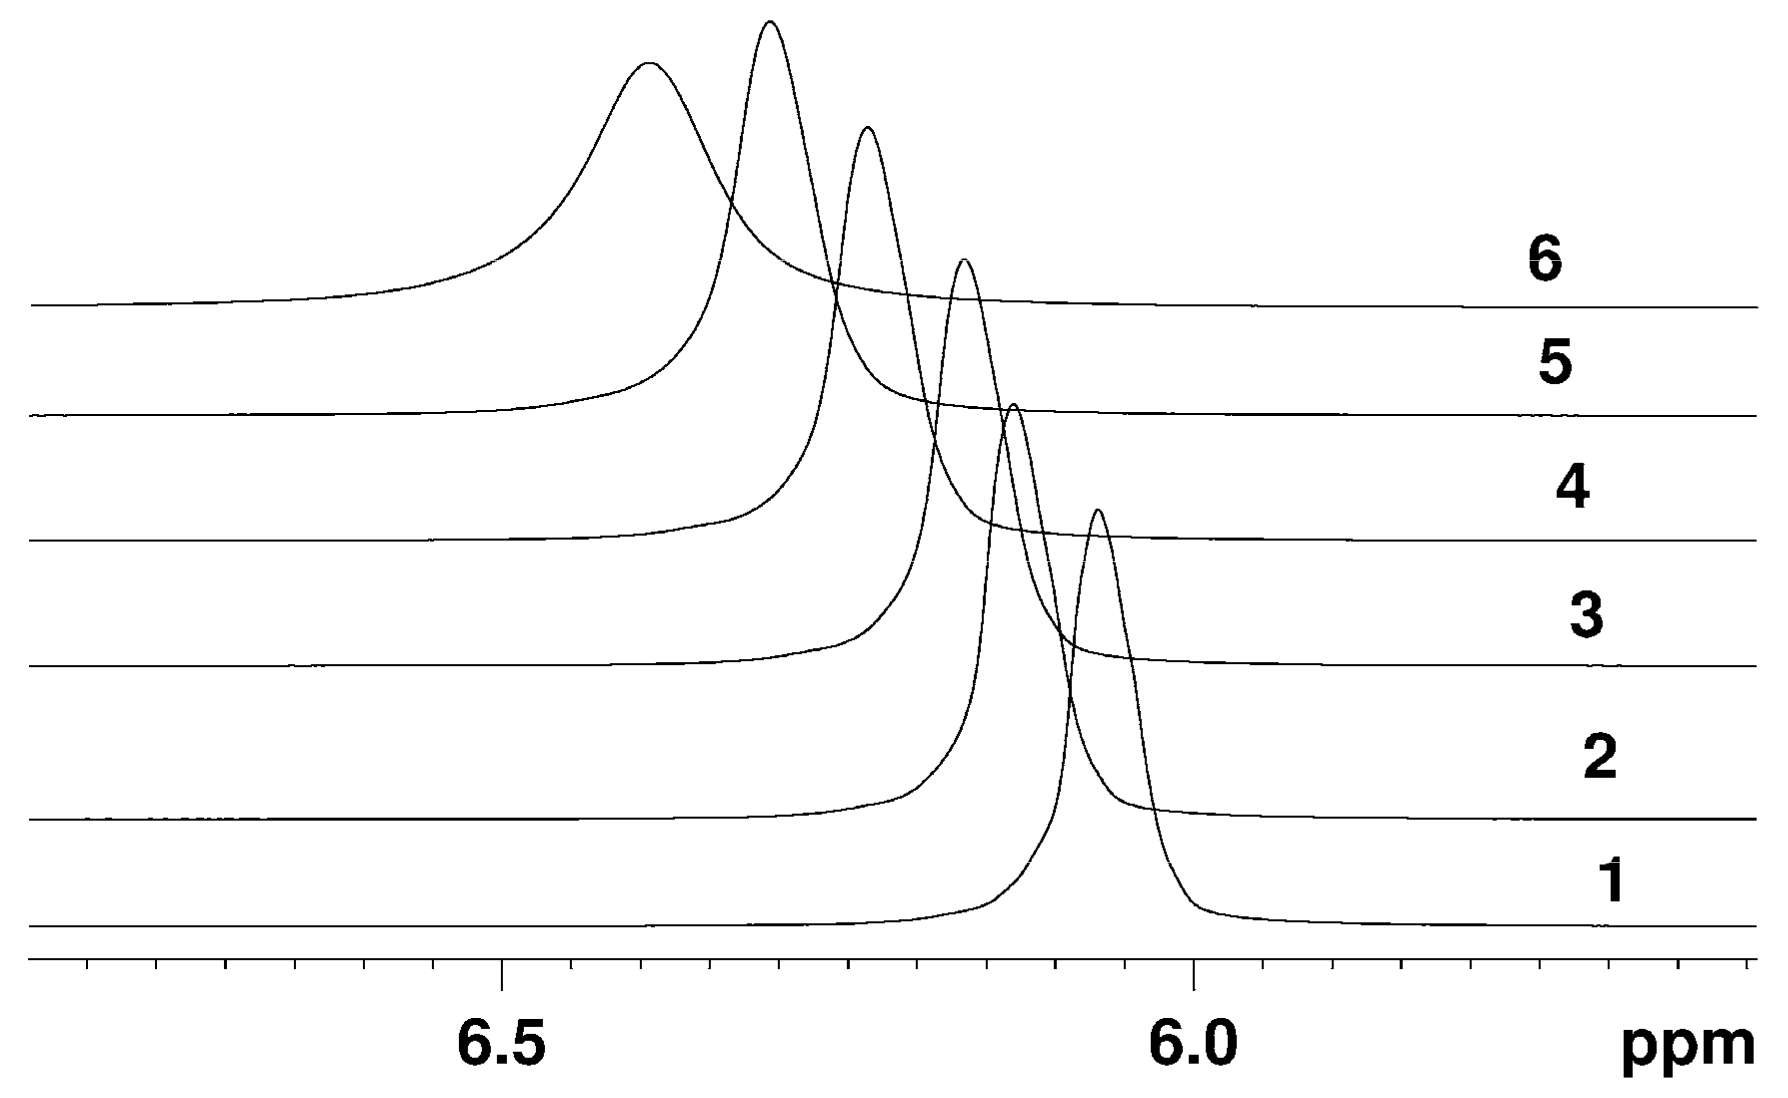
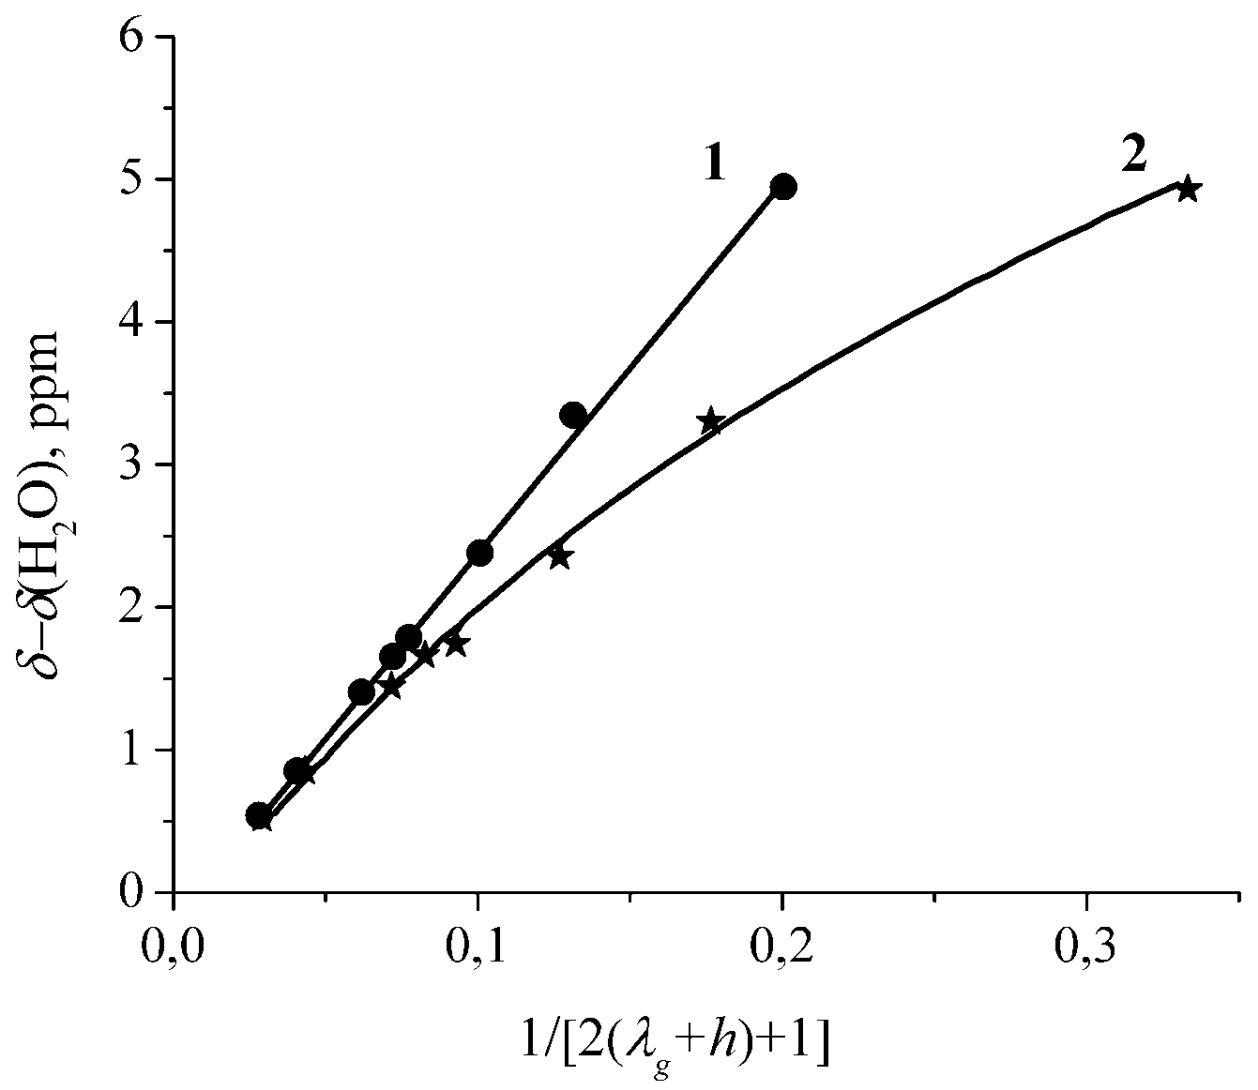
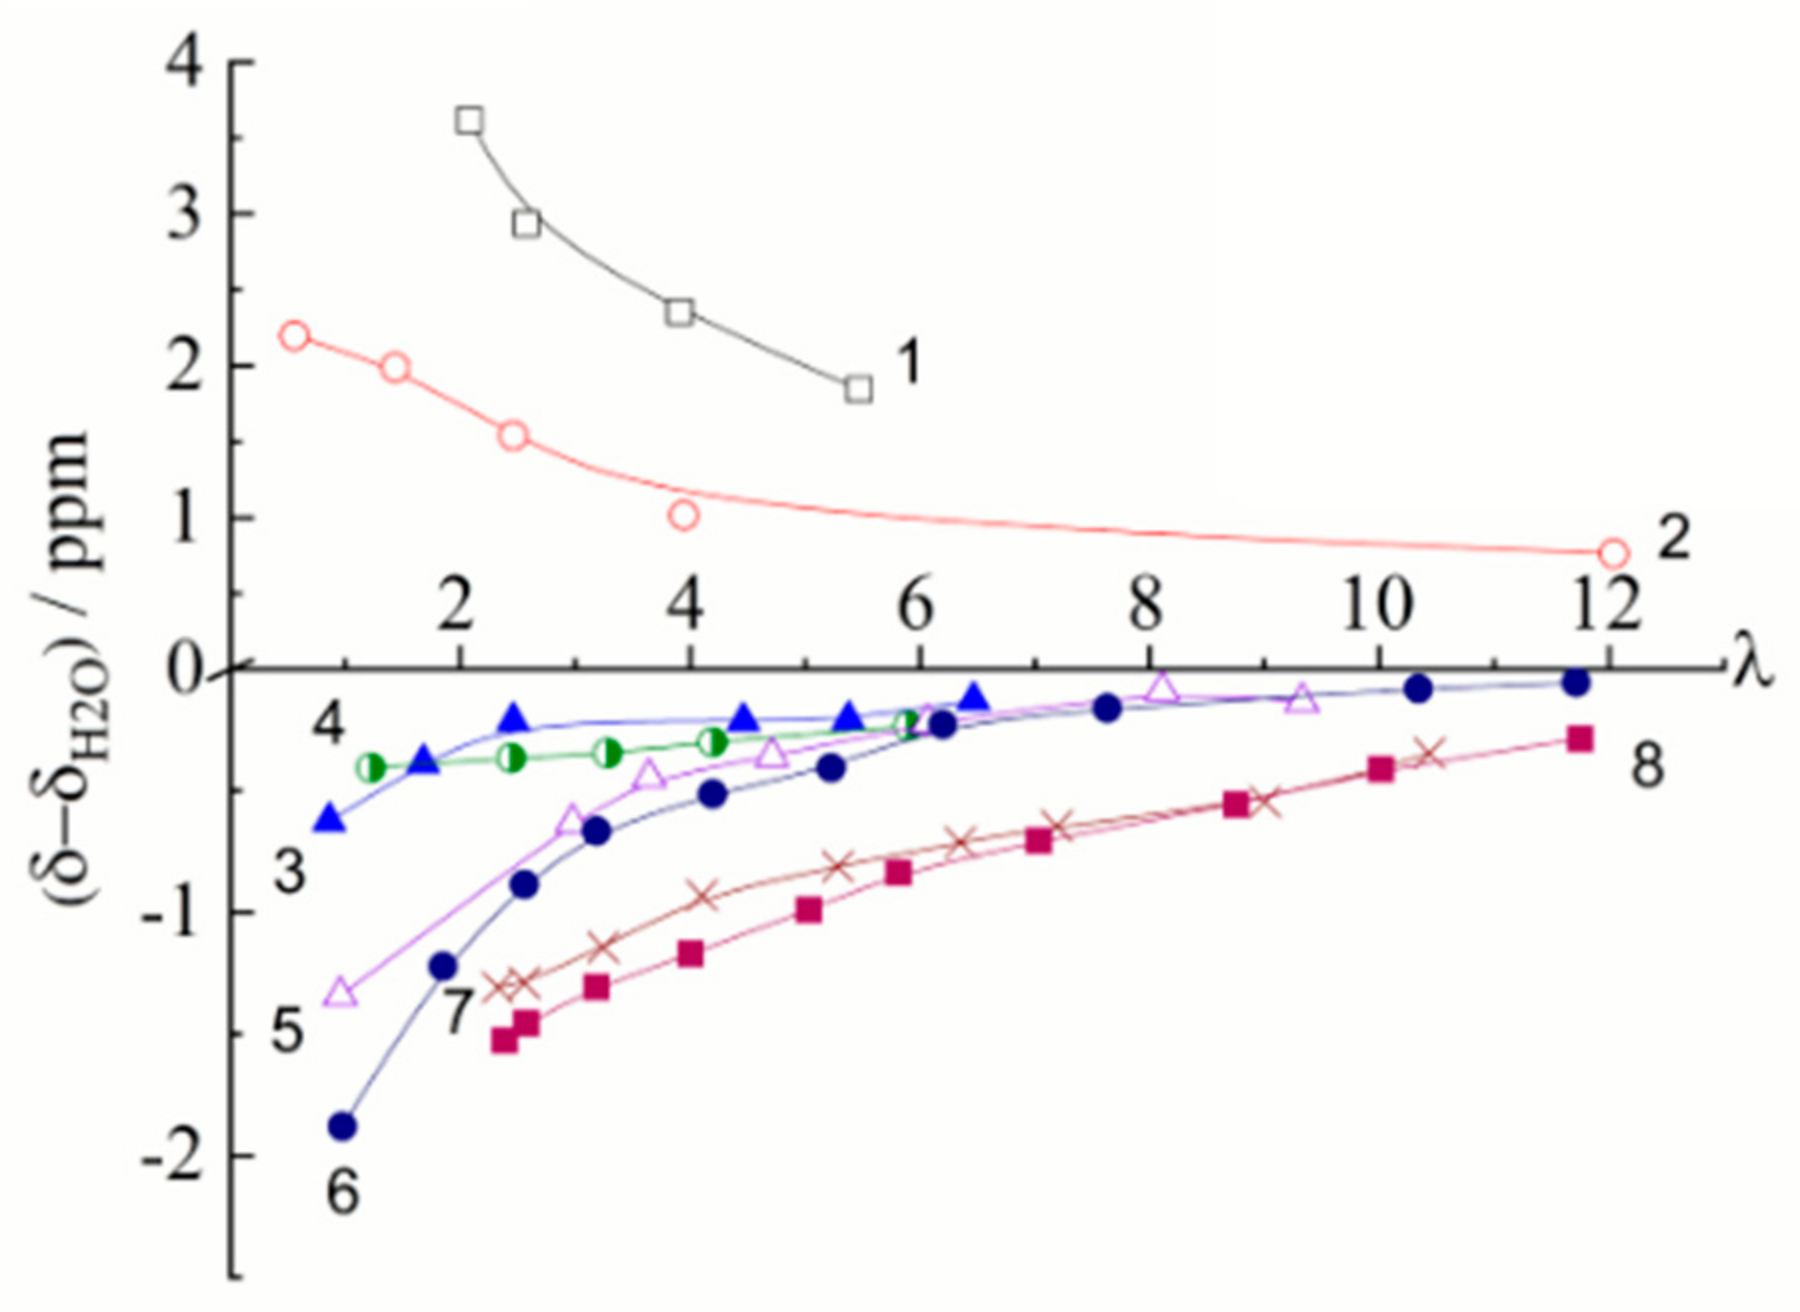
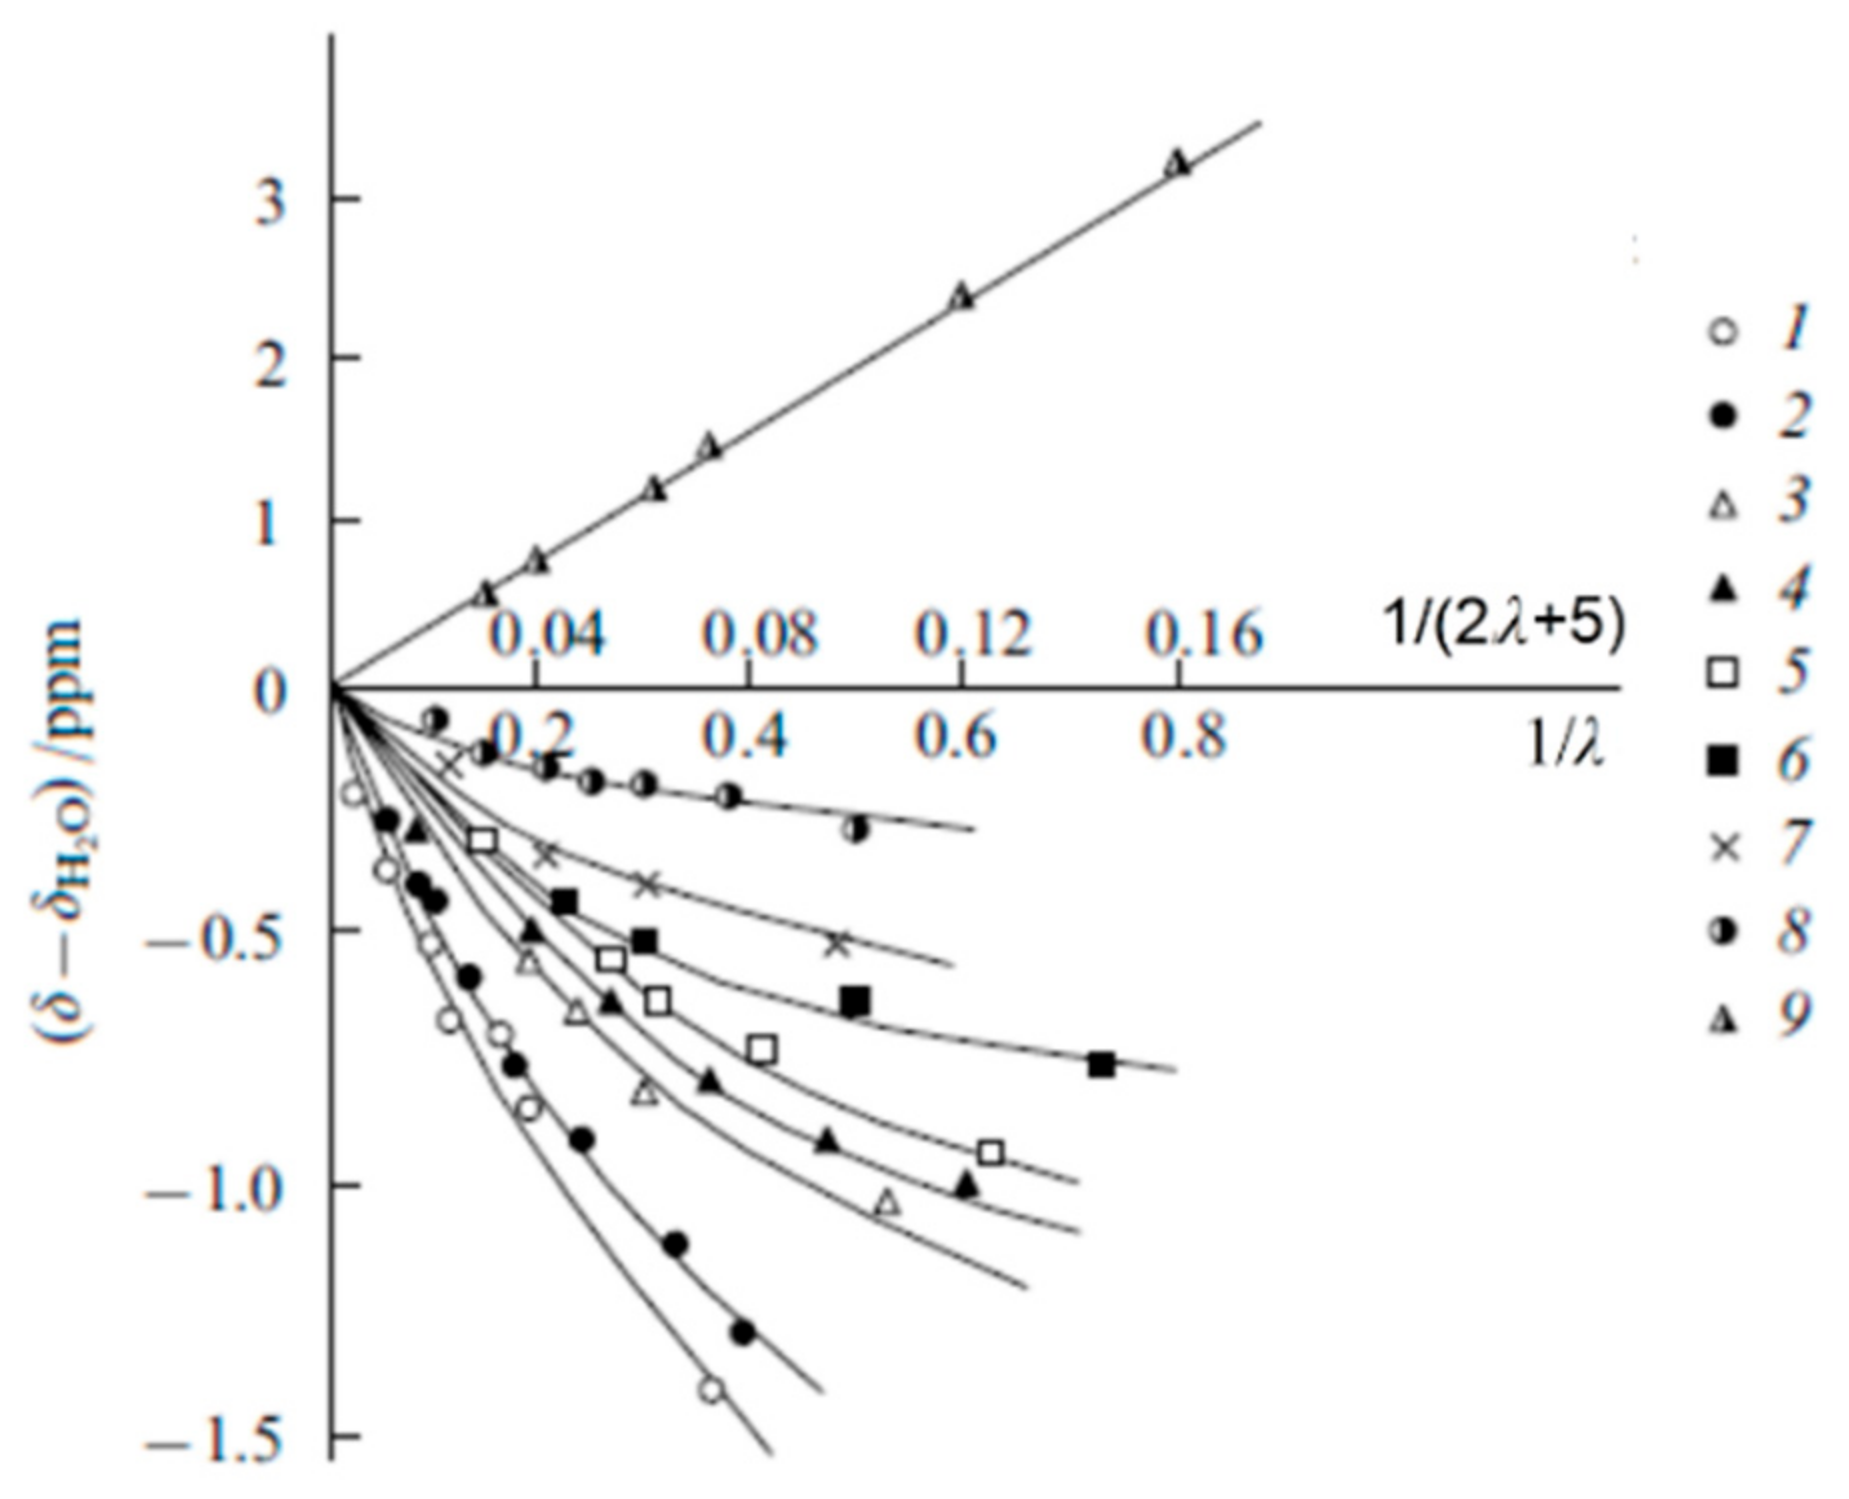
The Dependence of 1H Chemical Shift on the Humidity

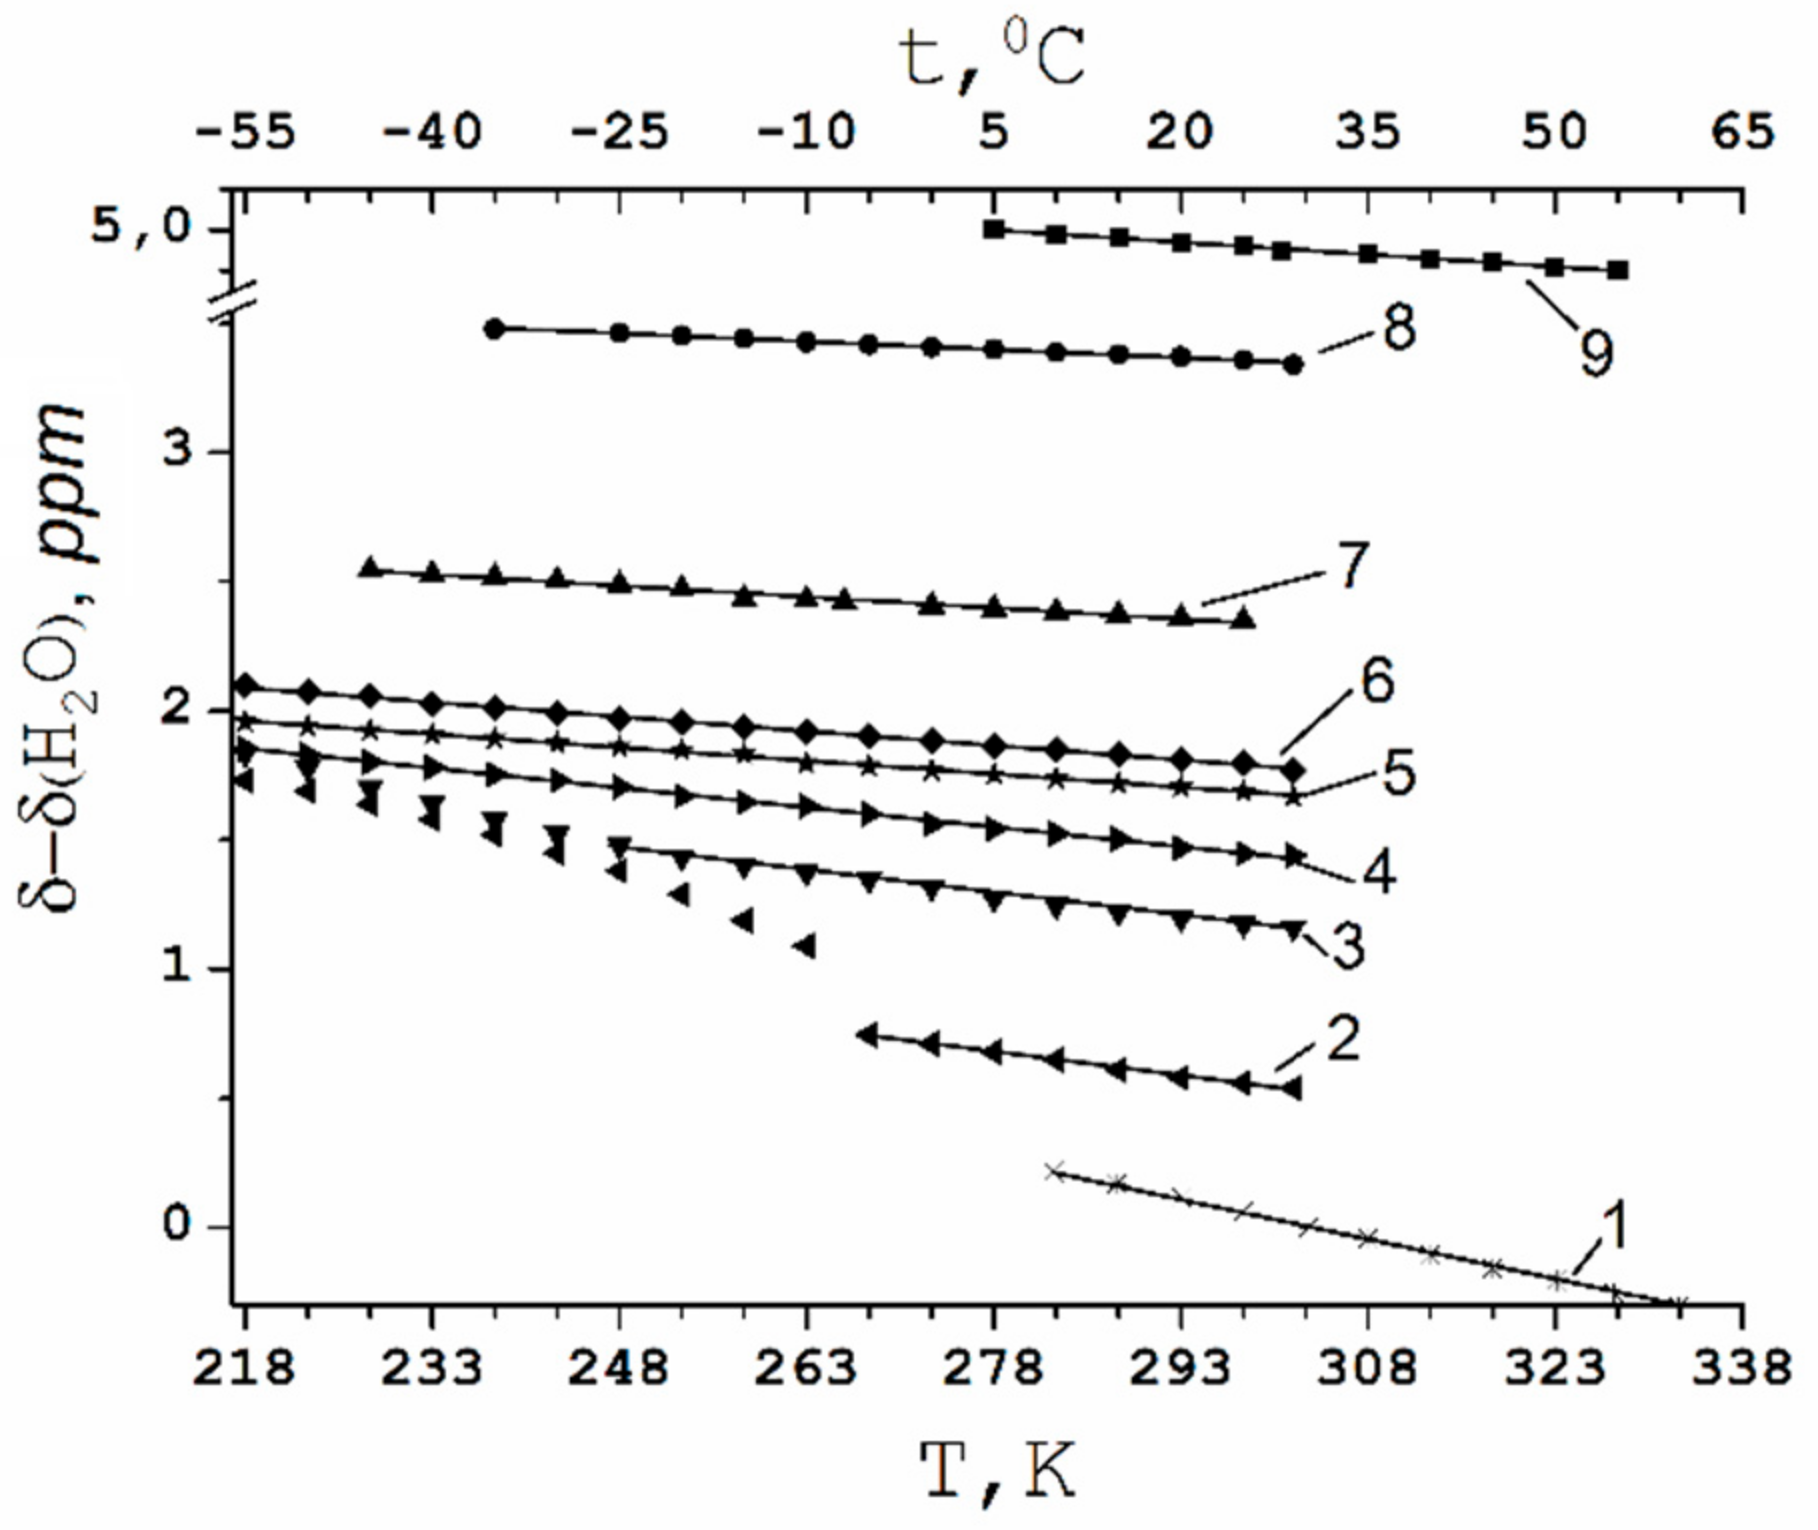
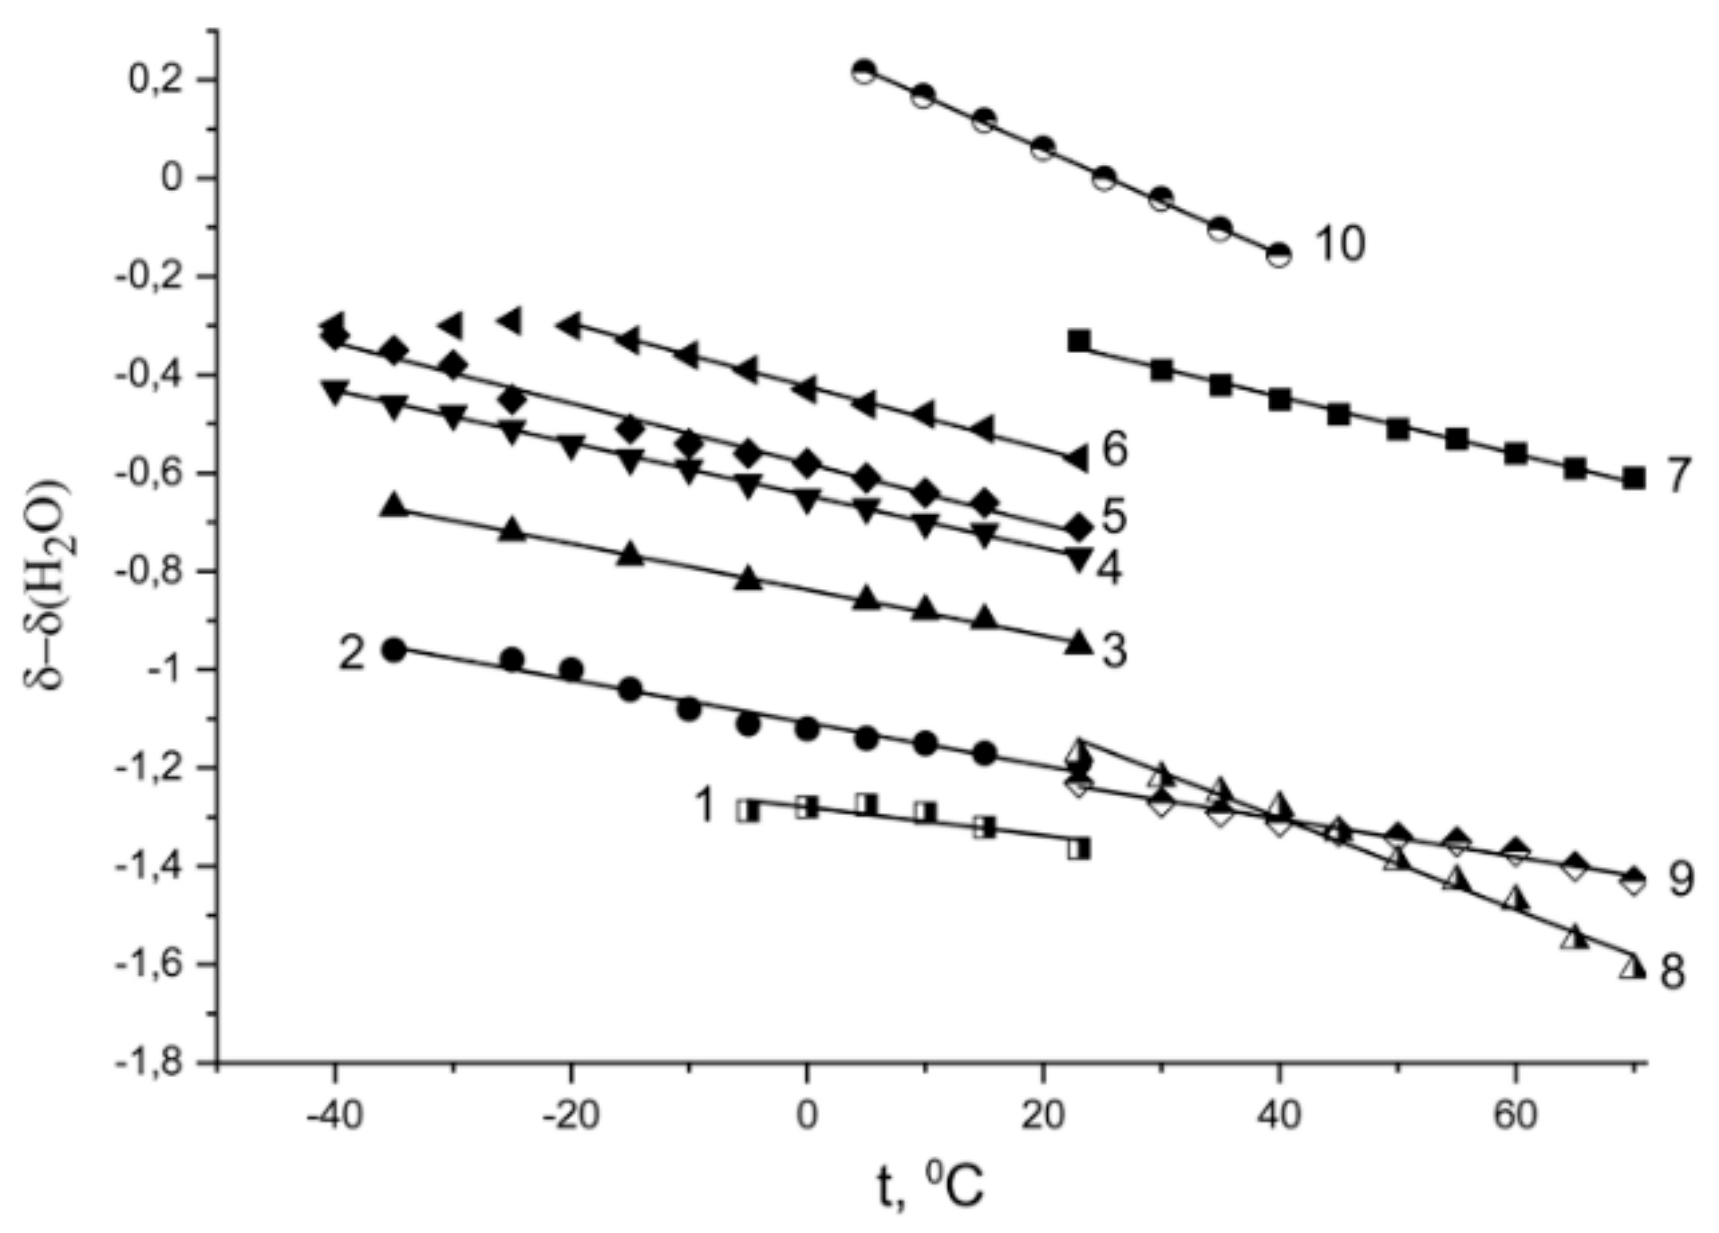
Temperature Dependence of 1H Chemical Shift
1.2.2. Water Behavior at Temperature Lower 0 °C
1.3. NMR Relaxation. Local Mobility of Molecules and Ions
H NMR Relaxation, Local Proton Motion
- quadrupole relaxation due to interactions between the quadrupole moment of a nucleus with the fluctuating electric field gradient induced by the charge distribution around this nucleus;
- dipole–dipole relaxation caused by random fluctuations of magnetic moments of nuclei.
1.4. Pulsed Field Gradient NMR. Diffusion and Ionic Conductivity
1.4.1. Pulsed Field Gradient 1 H NMR, Water Molecule Self-Diffusion and Ionic Conductivity
1.4.2. Pulsed Field Gradient 7 Li, 23 Na, 133 Cs NMR, Alkaline Metal Cation Self-Diffusion
1.4.3. Lithium, Sodium, Cesium Cation Self-Diffusion and Ionic Conductivity
1.4.4. Li+, Na+, and Cs+ Hydration and Diffusion in Chloride Aqueous Solutions
1.4.5. Specific Features of Translational Mobility of Water Molecules and Ions at a Low Moisture Content
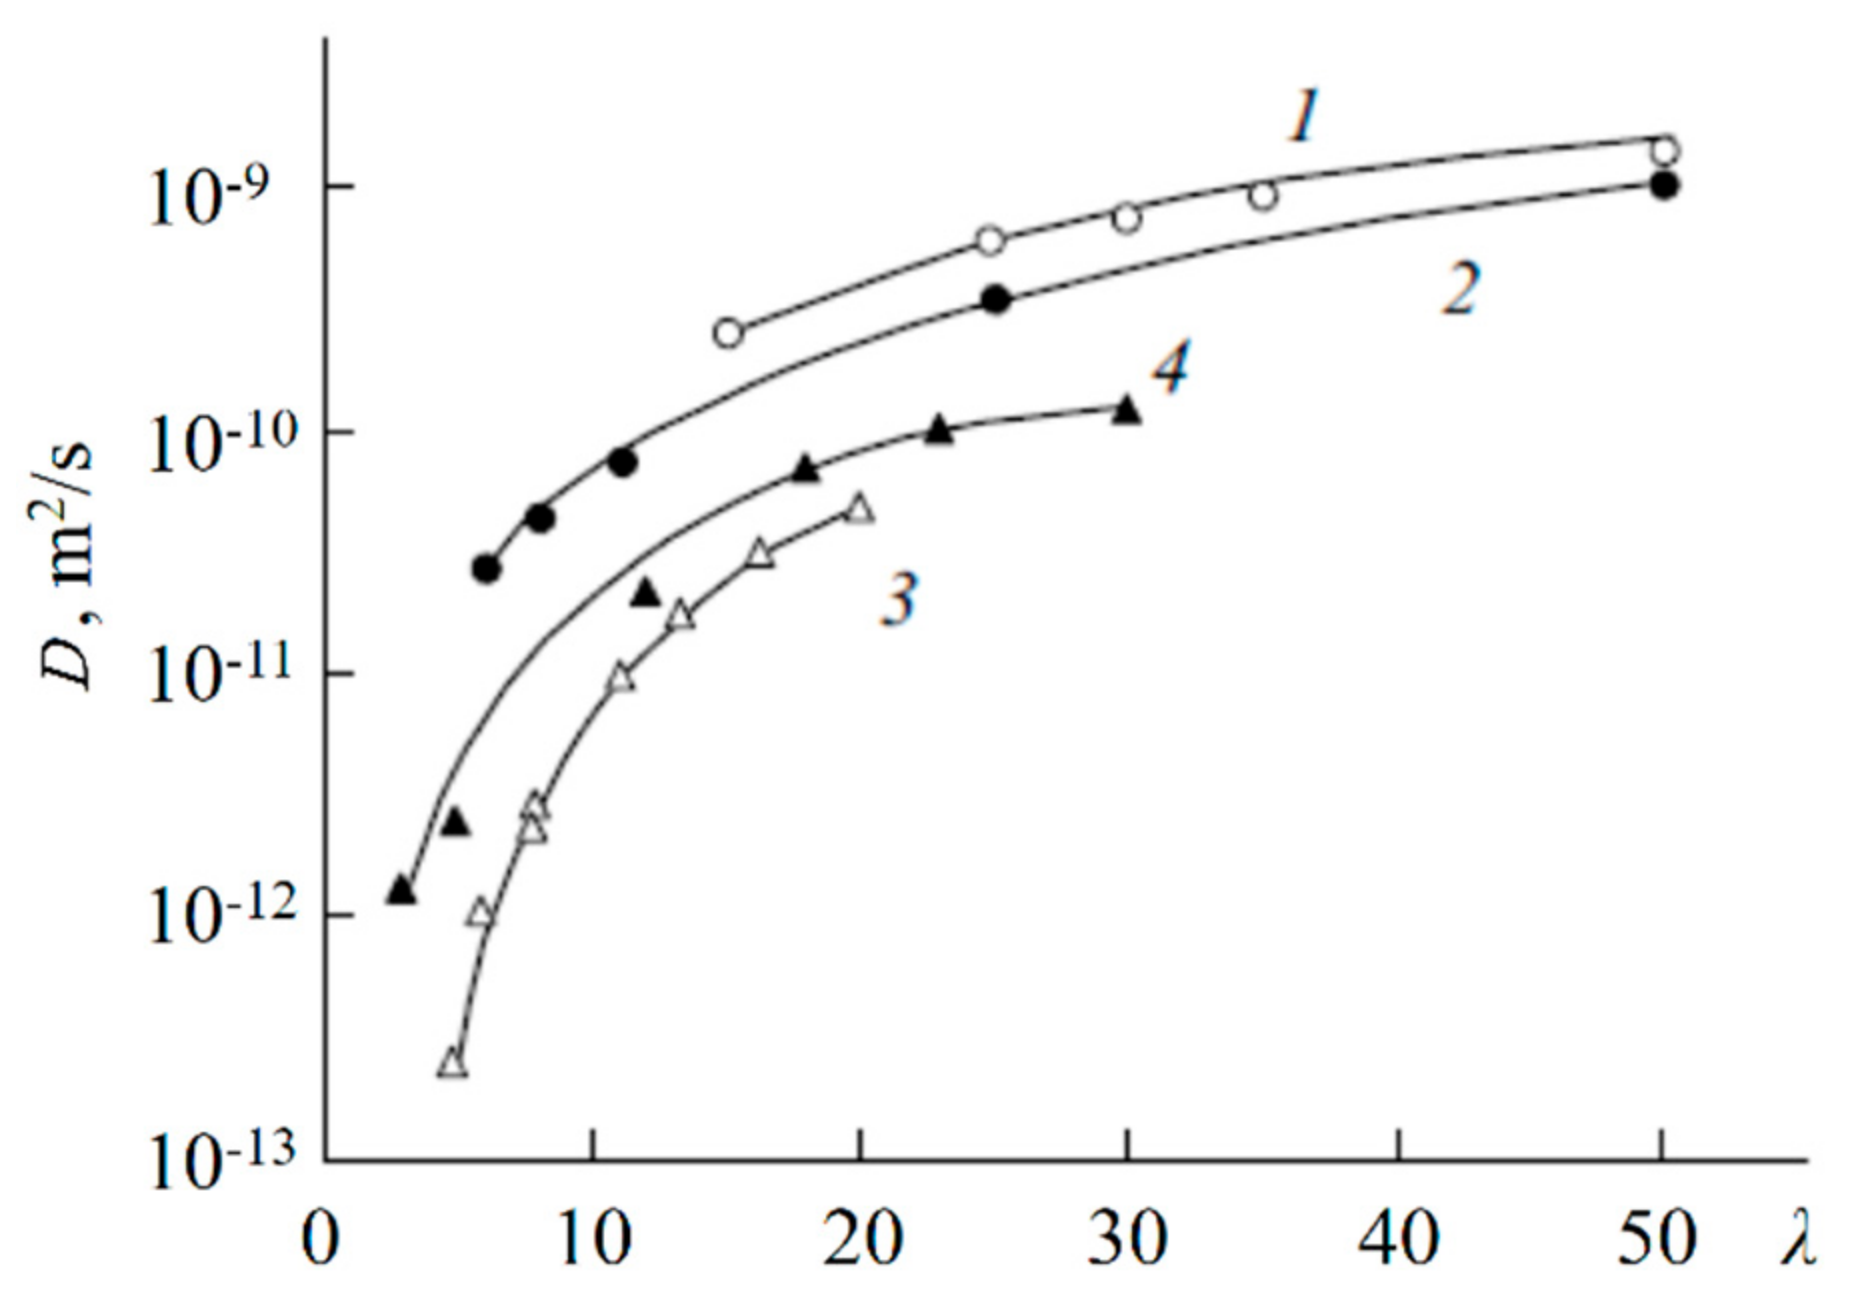
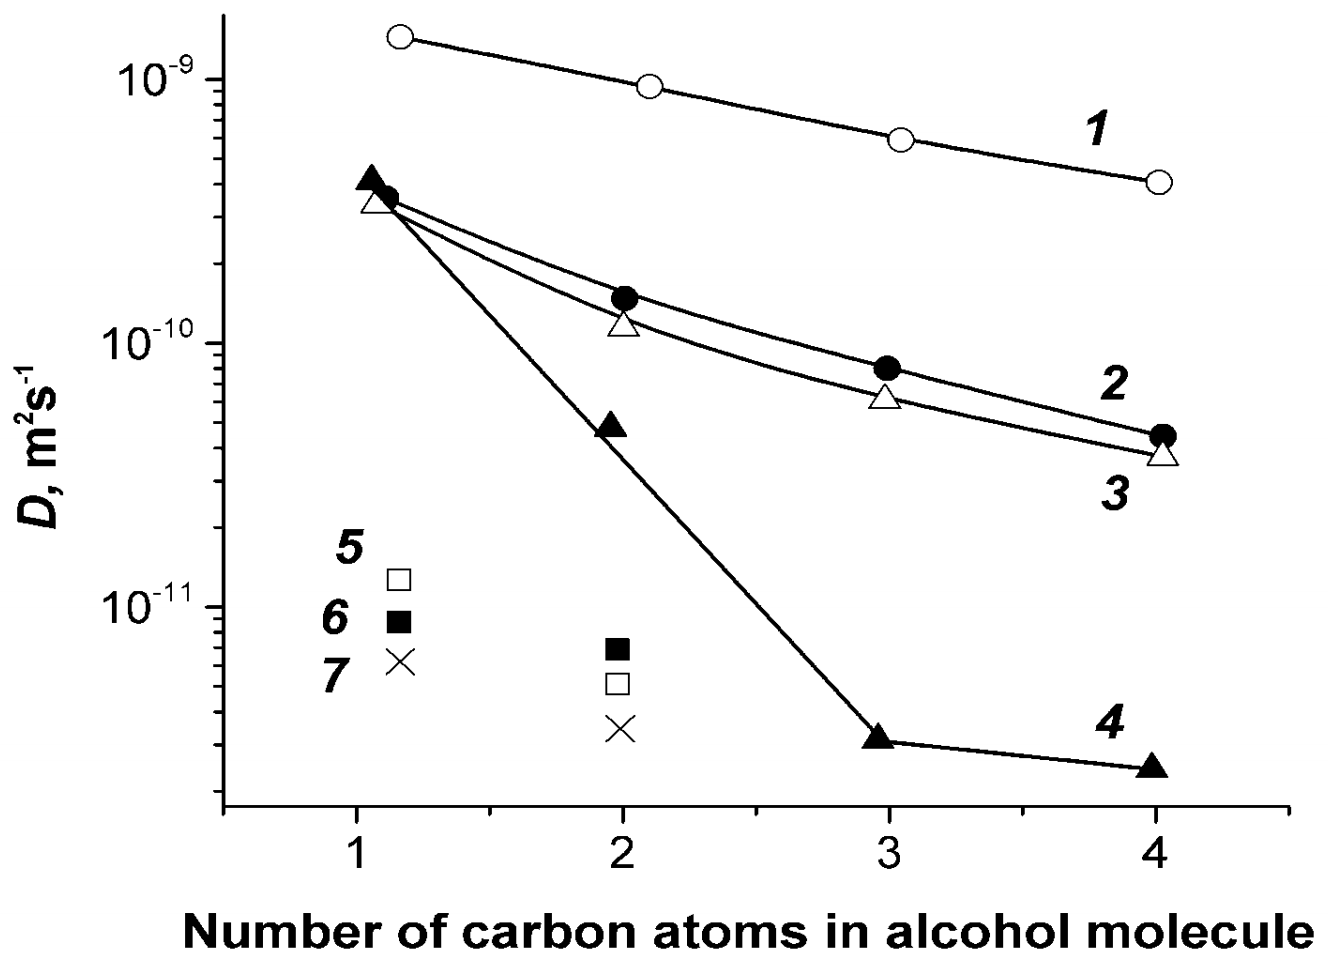
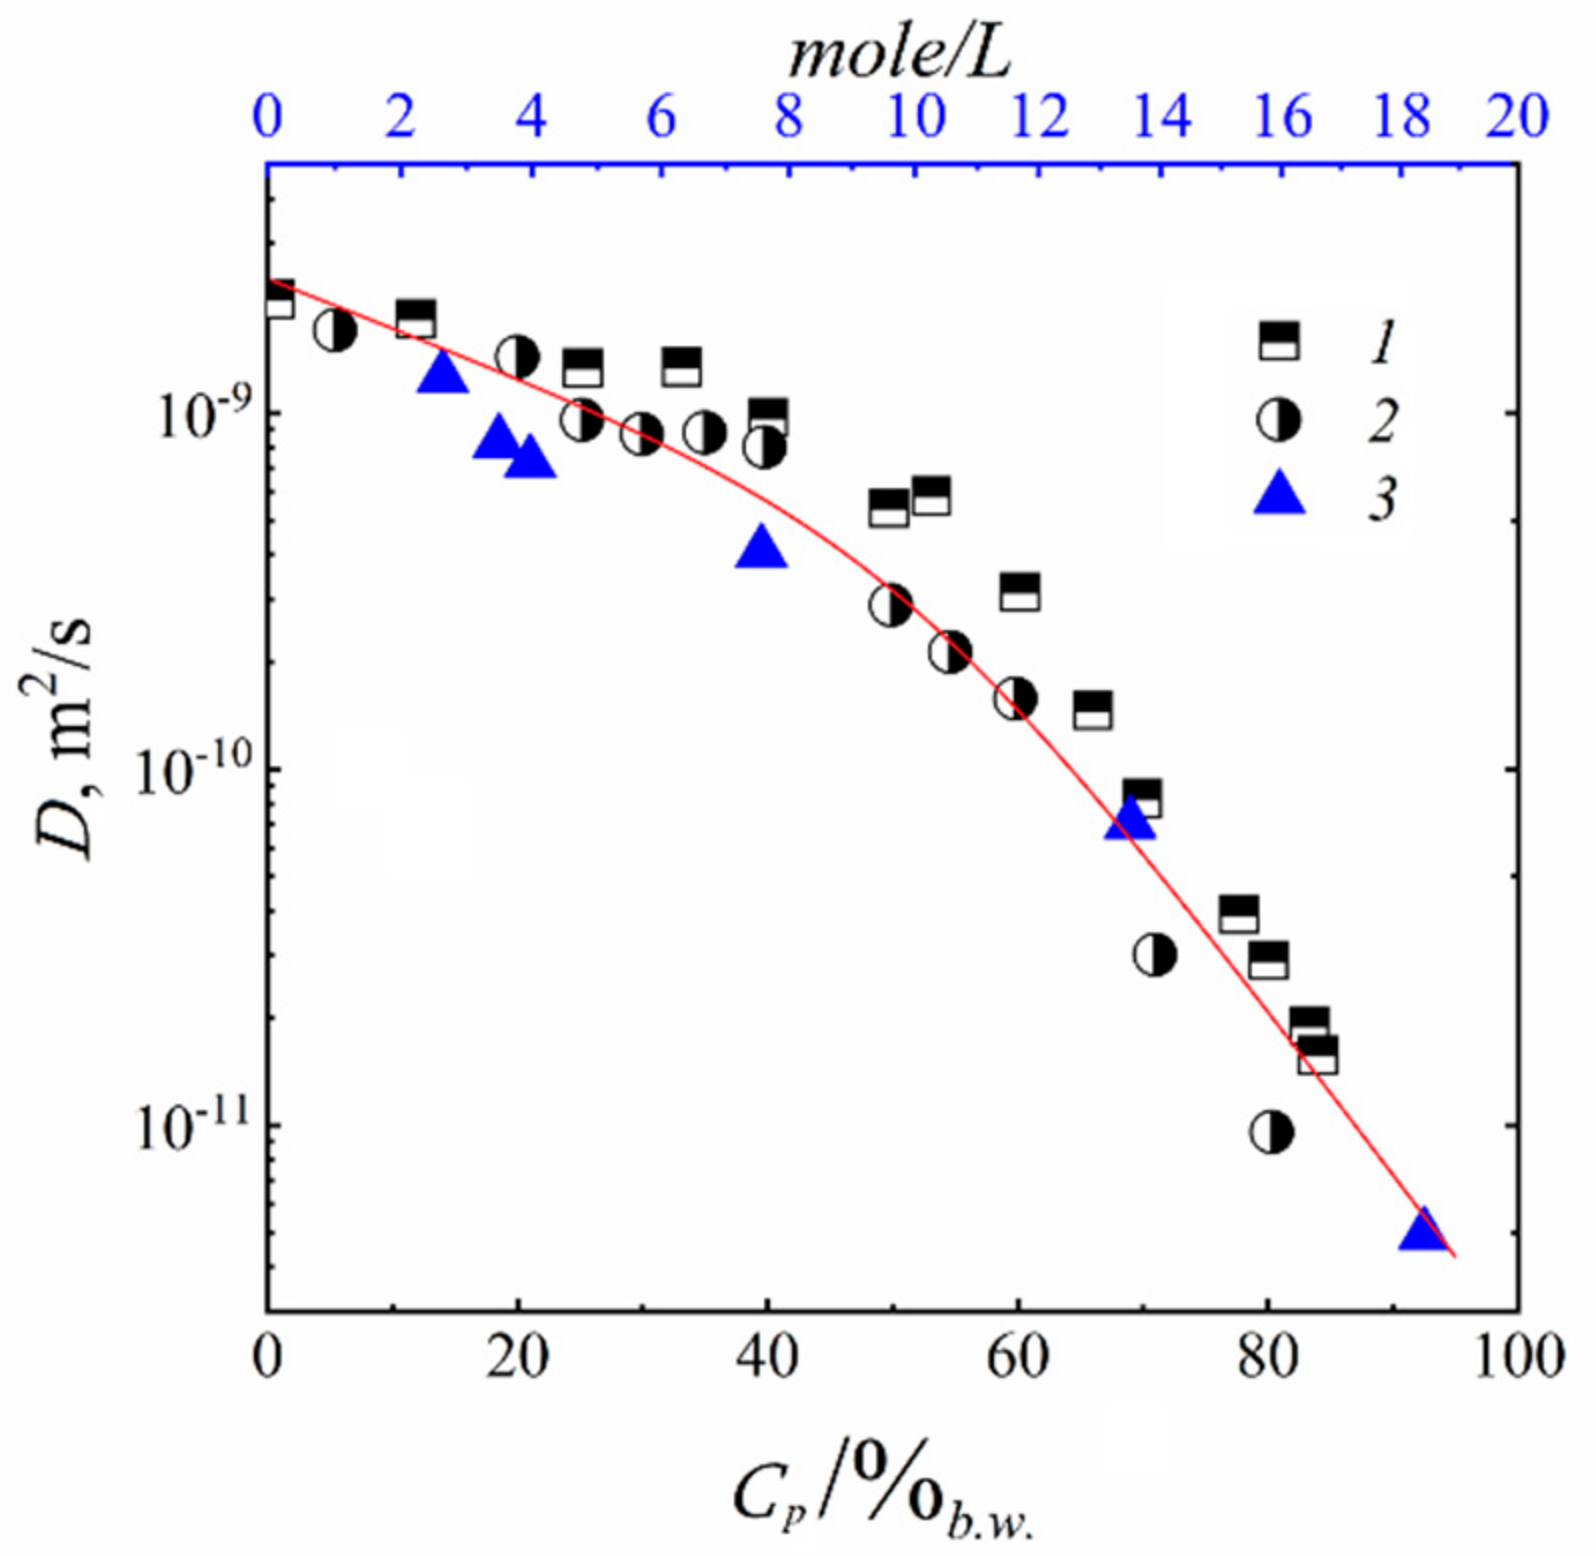
1.4.6. Diffusion of Saturated Monatomic Alcohols and Water–Alcohol Mixtures
2. Conclusions
3. Biological Systems: Protein and Cell Membranes
3.1. Protein Association
3.2. Water and Biological Active Substances Self-Diffusion in Red Blood Cells
3.2.1. RBC Water Permeability Studied by Paramagnetic Doping Technique
3.2.2. Self-Diffusion of Water Molecules in a RBCs Suspension
3.2.3. Lateral Diffusion in the RBCc Membrane
3.2.4. Self-Diffusion of Fullerene C60 Derivative Molecules in a RBCs Suspension
4. Summaries
Author Contributions
Funding
Conflicts of Interest
Appendix A
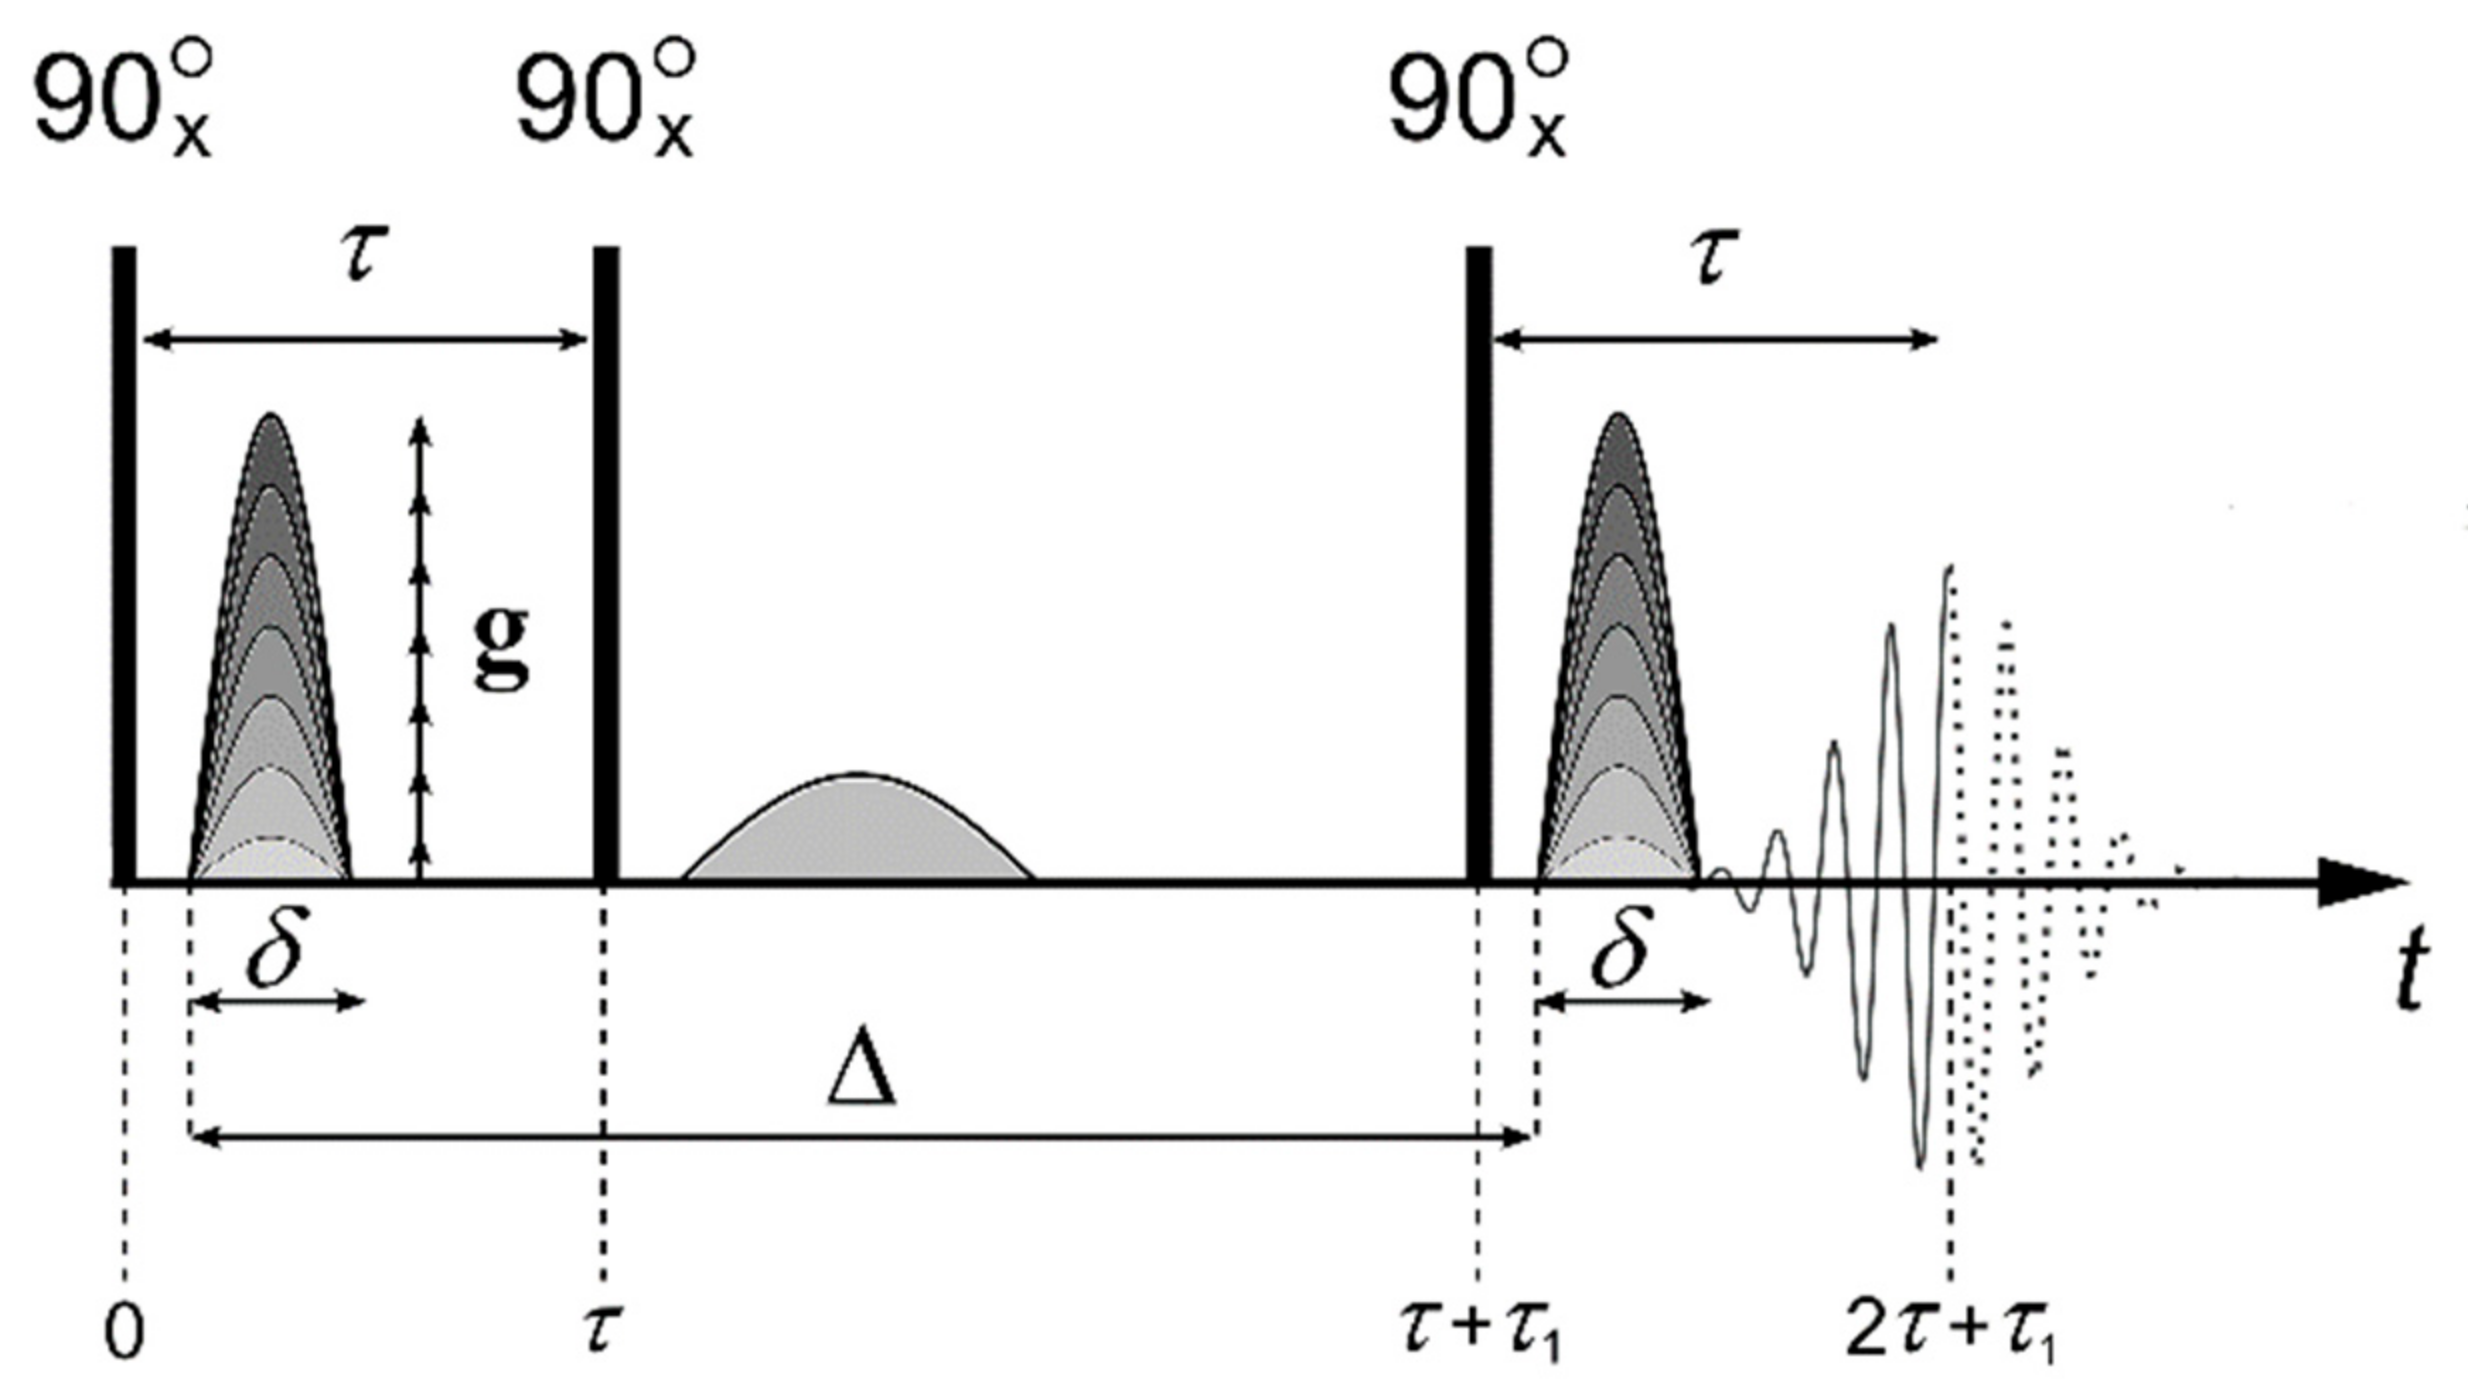
Pulsed Field Gradient NMR Technique


References
- Hwang, S.-T.; Kemmermeyer, K. Membranes in Separations; John Wiley & Sons: Hoboken, NJ, USA, 1975; p. 654. [Google Scholar]
- Chalykh, A.E. Diffuziya v Polimernykh Sistemakh (Diffusion in Polymer Systems); Khimiya: Moscow, Russia, 1987; p. 276. [Google Scholar]
- Shaposhnik, V.A. Kinetika Elektrodializa (Kinetics of Electro- dialysis); Voronezh State University: Voronezh, Russia, 1989; p. 187. [Google Scholar]
- Nikolaev, N.I. Diffuziya v Membranakh (Diffusion in Membranes); Khimiya: Moscow, Russia, 1980; p. 221. [Google Scholar]
- Timashev, S.F. Physical Chemistry of Membrane Processes; Ellis Horwood Series in Physical Chemistry Series; Ellis Horwood: New York, NY, USA; London, UK; Toronto, ON, Canada; Sydney, Australia; Tokyo, Japan; Singapore, 1991; p. 246. [Google Scholar]
- Yaroslavtsev, A.B. Khimiya Tverdogo Tela (The Chemistry of Solid); Nauchnyi Mir: Moscow, Russia, 2009; p. 312. [Google Scholar]
- Zabolotskii, V.I.; Nikonenko, V.V. Perenos Ionov v Membranakh (Ion Transfer in Membranes); Nauka: Moscow, Russia, 1996; p. 342. [Google Scholar]
- Creekmore, R.W.; Reilley, C.N. Nuclear Magnetic Resonance Study of Ion-Exchange Resins. Anal. Chem. 1970, 42, 570–575. [Google Scholar] [CrossRef]
- Gough, T.E.; Sharma, H.D.; Subramanian, N. Proton magnetic resonance studies of ionic solvation in ion-exchange resins. Part I. Sulfonated cation-exchange resins. Can. J. Chem. 1970, 48, 917–923. [Google Scholar] [CrossRef]
- Bystrov, G.S.; Grigor’eva, G.A.; Nikovaev, N.I. Nuclear Magnetic Resonance Study of Ion-exchange Resin-Solvent Systems. Russ. Chem. Rev. 1976, 45, 823–846. [Google Scholar] [CrossRef]
- Mank, V.V.; Kurilenko, O.D. Issledovanie Mezhmolekulyarnykh Vzaimodeistvii v Ionoobmennykh Smolakh Metodom YaMR (Investigation of Intermolecular Interactions in Ion-Exchange Resins by NMR); Naukova Dumka: Kiev, Ukraine, 1976; p. 79. [Google Scholar]
- Mank, V.V.; Lebovka, N.I. Voda v Dispersnykh Sistemakh (Water in Dispersion Systems); Khimiya: Moscow, Russia, 1989; p. 203. [Google Scholar]
- Khutsishvili, V.G.; Bogachev, Y.S.; Volkov, V.I.; Serebryanskaya, A.I.; Shapet’ko, N.N.; Timashev, S.F.; Orman, M.L. Water state investigation in sulfocationite CU-2 phase by proton magnetic resonance technique. Russ. J. Phys. Chem. 1983, 57, 2524–2527. [Google Scholar]
- Saldadze, G.K.; Tagirova, R.I.; Volkov, V.I.; Chizhanov, S.A. The structure of one charge cation and water mass transfer in sulfocationexchangers on NMR data. Russ. J. Phys. Chem. 1993, 67, 1818–1823. [Google Scholar]
- Volkov, V.I.; Saldadze, G.K.; Tagirova, R.I.; Kropotov, L.V.; Khutsishvili, V.G.; Shapet’ko, N.N. Water state and diffusion mobility in ion exchange membrane MC-40 studied by NMR. Russ. J. Phys. Chem. 1989, 63, 1005–1009. [Google Scholar]
- Volkov, V.I.; Chernyak, A.V.; Golubenko, D.V.; Shevlyakova, N.V.; Tverskoy, V.A.; Yaroslavtsev, A.B. Mobility of cations and water molecules in sulfocation-exchange membranes based on polyethylene and sulfonated grafted polystyrene. Membr. Membr. Technol. 2020, 1, 54–62. [Google Scholar] [CrossRef]
- Volkov, V.I.; Chernyak, A.V.; Golubenko, D.V.; Tverskoy, V.A.; Lochin, G.A.; Odjigaeva, E.S.; Yaroslavtsev, A.B. Hydration and diffusion of H+, Li+, Na+, Cs+ ions in cation-exchange membranes based on polyethylene and sulfonated-grafted polystyrene studied by NMR technique and ionic conductivity measurements. Membranes 2020, 10, 272. [Google Scholar] [CrossRef]
- Khutsishvili, V.G.; Bogachev, Y.S.; Volkov, V.I.; Tarasova, B.V.; Dreiman, N.A.; Shapetko, N.N.; Timashev, S.F. Water state investigation in perfluorinated sulfo cation exchange membranes by proton magnetic resonance technique. Russ. J. Phys. Chem. 1984, 58, 2633. [Google Scholar]
- Volkov, V.I.; Sidorenkova, E.A.; Timashev, S.F.; Lakeev, S.G. State and diffusive mobility of water in perfluorinated sulfocationite membranes according to proton magnetic resonance data. Russ. J. Phys. Chem. 1993, 67, 914–918. [Google Scholar]
- Skirda, V.D.; Volkov, V.I. Pulsed field gradient NMR for the molecular system physical-chemistry processes investigations. Russ. J. Phys. Chem. 1999, 73, 323–342. [Google Scholar]
- Volkov, V.I.; Volkov, E.V.; Sanginov, E.A.; Pavlov, A.A.; Timofeev, S.V.; Safronova, E.Y.; Stenina, I.A.; Yaroslavtsev, A.B. Diffusion mobility of alkali metals in perfluorinated sulfocationic and carboxylic membranes as probed by 1H, 7Li, 23Na, and 133Cs NMR spectroscopy. Russ. J. Inorg. Chem. 2010, 55, 318–324. [Google Scholar] [CrossRef]
- Bunce, N.J.; Sondheimer, S.J.; Fyle, C.A. Proton NMR Method for the Quantitative Determination of the Water Content of the Polymeric Fluorosulfonic Acid Nafion-H. Macromolecules 1986, 19, 333–339. [Google Scholar] [CrossRef]
- Ye, G.; Janzen, N.; Goward, G.R. Solid-State NMR Study of Two Classic Proton Conducting Polymers: Nafion and Sulfonated Poly(ether ether ketone)s. Macromolecules 2006, 39, 3283–3290. [Google Scholar] [CrossRef]
- Shestakov, S.L.; Pavlov, A.A.; Maksimychev, A.V.; Chernyak, A.V.; Volkov, V.I.; Timofeev, S.V. A NMR study of the hydration of sulfo and carboxyl groups in perfluorinated cation exchange membranes. Russ. J. Phys. Chem. B 2010, 4, 1005–1013. [Google Scholar] [CrossRef]
- Chernyak, A.V.; Vasiliev, S.G.; Avilova, I.A.; Volkov, V.I. Hydration and Water Molecules Mobility in Acid Form of Nafion Membrane Studied by 1H NMR Techniques. Appl. Magn. Reson. 2019, 5, 677–693. [Google Scholar] [CrossRef]
- Hammer, R.; Schönhoff, M.; Hansen, M.R. Comprehensive Picture of Water Dynamics in Nafion Membranes at Different Levels of Hydration. J. Phys. Chem. B 2019, 123, 8313–8324. [Google Scholar] [CrossRef]
- Komoroski, R.A.; Mauritz, K.A. A sodium-23 nuclear magnetic resonance study of ionic mobility and contact ion pairing in a perfluorosulfonate ionomer. J. Am. Chem. Soc. 1978, 100, 7487–7489. [Google Scholar] [CrossRef]
- Komoroski, R.A. A Multinuclear Fourier Transform NMR Study of Perfluorosulfonate Ionomers. Adv. Chem. Ser. 1980, 187, 155–168. [Google Scholar]
- Volkov, V.I.; Sidorenkova, E.A.; Korochkova, S.A.; Novikov, N.A.; Sokol’skaya, I.B.; Timashev, S.F. The nature of selectivity of perfluorinated sulfocation exchanger membranes to alkiline metal ions on 7Li, 23Na, 133Cs NMR. Russ. J. Phys. Chem. 1994, 68, 309–316. [Google Scholar]
- Volkov, V.I.; Sidorenkova, E.A.; Korochkova, S.A.; Novikov, N.A.; Sokol’skaya, I.B.; Timashev, S.F. Effect of electrolyte sorbed by nonion-exchange mechanism on the state and diffusive mobility of water and alkali metal ions in perfluorinated sulfocationic membranes from NMR data. Russ. J. Phys. Chem. 1994, 68, 559–564. [Google Scholar]
- Nesterov, I.A.; Volkov, V.I.; Pukhov, K.K.; Timashev, S.F. Magnetic-relaxation of 7Li+ nuclei and dynamics of movements of lithium counter-ions and water-molecules in perfluorinated sulfocationite membranes. Russ. J. Chem. Phys. 1990, 10, 1155–1162. [Google Scholar]
- Tromp, R.H.; Van der Maarel, J.R.C.; De Bleijser, J.; Leyte, J.C. Counter-ion dynamics in crosslinked poly( styrene sulfonate) systems studied by NMR. Biophys. Chem. 1991, 41, 81–100. [Google Scholar] [CrossRef]
- Halle, B.; Bratko, D.; Piculell, L. Interpretetion of Counterion Spin Relaxation in Polyelectrolyte Solutions. II. Effects of Finite Polyion Lenght. Ber. Bunsenges. Phys. Chem. 1985, 89, 1254–1260. [Google Scholar] [CrossRef]
- Halle, B.; Wennerstrom, H.; Piculell, L. Interpretation of Counterion Spin Relaxation in Polyelectrolyte Solutions. J. Phys. Chem. 1984, 88, 2482–2494. [Google Scholar] [CrossRef]
- Boyle, N.G.; McBrierty, V.J.; Douglass, D.C. The behavior of water in Nafion membranes. Macromolecules 1983, 16, 75–80. [Google Scholar] [CrossRef]
- Volkov, V.I.; Nesterov, I.A.; Chichagov, A.V.; Muromtsev, V.I.; Timashev, S.F. NMR methods for studying ion and molecular transport in polymer electrolytes. Russ. J. Chem. Phys. 1985, 4, 644–650. [Google Scholar] [CrossRef]
- Volkov, V.I.; Nesterov, I.A.; Sundukov, V.I.; Kropotov, L.V.; Timashev, S.F. The diffusion transfer of water in perfluorinated sulfocation exchange membranes as studied by pulse NMR. Russ. J. Chem. Phys. 1989, 8, 209. [Google Scholar]
- Volkov, V.I.; Vasilyak, S.L.; Park, I.-W.; Kim, H.J.; Ju, H.; Volkov, E.V.; Choh, S.H. Water Behavior in Perfluorinated Ion-Exchange Membranes. Appl. Magn. Reson. 2003, 25, 43–53. [Google Scholar] [CrossRef]
- Volkov, V.I.; Volkov, E.V.; Timashev, S.F. The Mechanism for Ionic and Water Transport in Nafion Membranes from Resonance Data. In Magnetic Resonance in Colloid and Interface Science; Kluwer Academic Publishers: Amsterdam, The Netherlands, 2002; p. 267. [Google Scholar]
- Volkov, V.I.; Volkov, E.V.; Vasilyak, S.L.; Hong, Y.S.; Lee, C.H. The Ionic and Molecular Transport in Polymeric and Biological Membranes on Magnetic Resonance Data. In Fluid Transport in Nanoporous Materials; Springer: New York, NY, USA, 2006; p. 48. [Google Scholar]
- Volkov, V.I.; Eliseev, Y.G.; Kirsh, Y.E.; Fedotov, Y.A.; Timashev, S.F. Water and lithium self-diffusion in bi-sulfocontaining aromatic polyamides. Russ. J. Phys. Chem. 1992, 66, 1618–1622. [Google Scholar]
- Stejskal, E.O.; Tanner, J.E. Spin Diffusion Measurements: Spin Echoes in the Presence of a Time Dependent Field Gradient. J. Chem. Phys. 1965, 42, 288. [Google Scholar] [CrossRef]
- Maklakov, A.; Skirda, V.; Fatkullin, N. Selfdiffusion in Polymer Solutions and Melts (Samodiffisia v Rastvorakh i Rasplavakh Polymerov); Soloviev, U., Chalykh, A., Eds.; Kazan University Press: Kazan, USSR, 1987; p. 224. (In Russian) [Google Scholar]
- Saldadze, G.K.; Tagirova, R.I.; Volkov, V.I.; Chizhanov, S.A. Self-Diffusion Of Li+ Counter-ions And Water Molecules In CU-23 Macroporous Sulfocationites According To Pulse Nuclear-Magnetic-Resonance. Russ. J. Phys. Chem. 1993, 67, 1941–1943. [Google Scholar]
- Saldadze, G.K.; Volkov, V.I.; Tagirova, R.I.; Chizhanov, S.A. Water Diffusion in Heterogeneous Sulfocationite Systems According to Proton Magnetic-Resonance. Russ. J. Phys. Chem. 1993, 67, 773–776. [Google Scholar]
- Volkov, V.I.; Korochtkova, S.A.; Nesterov, I.A.; Kirsh, Y.E.; Timashev, S.F. Diffusion Mobility Of Water-Molecules In Cation-Exchange Membranes Based On Sulfonate-Containing Polyphenylenephthalamides. Russ. J. Phys. Chem. 1994, 68, 1310–1316. [Google Scholar]
- Volkov, V.I.; Korochtkova, S.A.; Timashev, S.F. Characteristics of Self-Diffusion of Aliphatic Monoatomic Alcohols in Perfluorinated Sulfocationite Membranes. Russ. J. Phys. Chem. 1995, 69, 1124–1129. [Google Scholar]
- Volkov, V.I.; Korotchkova, S.A.; Ohya, H.; Guo, Q. Self-diffusion of water-ethanol mixtures in polyacrylic acid-polysulfone composite membranes obtained by pulsed-field gradient nuclear magnetic resonance spectroscopy. J. Membr. Sci. 1995, 100, 273–286. [Google Scholar] [CrossRef]
- Sokolova, S.A.; Djakonova, O.V.; Kotov, V.V.; Hong, Y.S.; Volkov, V.I.; Lee, C.H. The self-diffusion of water and membrane structure in the new type of cation-exchange polyamide-acid membrane. Magn. Res. Imag. 2001, 19, 588–589. [Google Scholar] [CrossRef]
- Volkov, V.I.; Korotchkova, S.A.; Nesterov, I.A.; Ohya, H.; Guo, Q.; Huang, J.; Chen, J. The self-diffusion of water and ethanol in cellulose derivative membranes and particles with the pulsed field gradient NMR data. J. Membr. Sci. 1996, 110, 1–11. [Google Scholar] [CrossRef]
- Volkov, V.I.; Pavlov, A.A.; Sanginov, E.A. Ionic transport mechanism in cation-exchange membranes studied by NMR technique. Solid State Ion. 2011, 188, 124–128. [Google Scholar] [CrossRef]
- Volkov, V.I.; Popkov, Y.M.; Timashev, S.F.; Bessarabov, D.G.; Sanderson, R.D.; Twardowski, Z. Self-diffusion of water and fluorine ions in anion-exchange polymeric materials (membranes and resin) as determined by pulsed-field gradient nuclear magnetic resonance spectroscopy. J. Membr. Sci. 2000, 180, 1–13. [Google Scholar] [CrossRef]
- Kotov, V.V.; Dyakonova, O.V.; Sokolova, S.A.; Volkov, V.I. Struktura i elektrokhimicheskie svoistva kationoobmennykh membran na osnove chastichno imidizirovannoi poliamidokisloty [Structure and electrochemical properties of cation exchange membranes based on partially imidizated polyamide acid. Elektrokhimiya 2002, 38, 994–997. [Google Scholar]
- Volkov, V.I.; Kotov, V.V.; Netesova, G.A. The self-diffusion of water and saturated aliphatic alcohols in cation-exchange membranes. Russ. J. Phys. Chem. 2008, 82, 1184–1188. [Google Scholar] [CrossRef]
- Ponomarev, A.N.; Dobrovol’skii, Y.A.; Abdrashitov, E.F.; Bokun, V.C.; Sanginov, E.A.; Volkov, E.V.; Volkov, V.I. The new approach to the modification of the per fluorinated ion-ex changing membranes promising in hydrogen energy. Bull. RAS Energetika 2008, 3, 124–134. [Google Scholar]
- Volkov, V.I.; Dobrovolsky, Y.A.; Nurmiev, M.S.; Sanginov, E.A.; Volkov, E.V.; Pisareva, A.V. Charge and mass transport in the phenol-2,4-disulfonic acid-polyvinyl alcohol ion exchange membranes studied by pulsed field gradient NMR and impedance spectroscopy. Solid State Ion. 2008, 179, 148–153. [Google Scholar] [CrossRef]
- Volkov, V.I.; Ponomarev, A.N.; Yaroslavtsev, A.B.; Sanginov, E.A.; Pavlov, A.A. NMR investigation of proton conductive ion-exchange membranes transport behaviour. ISJAEE 2008, 2, 101–106. [Google Scholar]
- Voropaeva, E.Y.; Sanginov, E.A.; Volkov, V.I.; Pavlov, A.A.; Shalimov, A.S.; Stenina, I.A.; Yaroslavtsev, A.B. Transport Properties of MF-4SC Membranes Modified with Inorganic Dopants. Russ. J. Inorg. Chem. 2008, 53, 1536–1541. [Google Scholar] [CrossRef]
- Volkov, V.I.; Pavlov, A.A.; Fedotov, Y.A.; Marinin, A.A. Self-diffusion of water and alkaline cations in bisulfur-containing aromatic polyamides-water systems. Russ. J. Phys. Chem. 2010, 84, 1705–1711. [Google Scholar] [CrossRef]
- Volkov, V.I.; Volkov, E.V.; Timofeev, S.V.; Sanginov, E.A.; Pavlov, A.A.; Safronova, E.Y.; Stenina, I.A.; Yaroslavtsev, A.B. Water self-diffusion and ionic conductivity in perfluorinated sulfocationic membranes MF4SK. Russ. J. Inorg. Chem. 2010, 55, 355–360. [Google Scholar] [CrossRef]
- Safronova, E.Y.; Volkov, V.I.; Yaroslavtsev, A.B. Ion mobility and conductivity of hybrid ion-exchange membranes incorporating inorganic nanoparticles. Solid State Ion. 2011, 188, 129–131. [Google Scholar] [CrossRef]
- Volkov, V.I.; Volkov, E.V. Ionic and molecular Self-Diffusion in Ion-Exchange materials for fuel energetics studied by pulsed field gradient NMR. Appl. Magn. Reson. 2005, 29, 495–501. [Google Scholar] [CrossRef]
- Tsushima, S.; Teranishi, K.; Hirai, S. Water diffusion measurement in fuel-cell SPE membrane by NMR. Energy 2005, 30, 235–245. [Google Scholar] [CrossRef]
- Baglio, V.; Arico, A.S.; Antonucci, V.; Nicotera, I.; Oliviero, C.; Coppola, L.; Antonucci, P.L. An NMR spectroscopic study of water and methanol transport properties in DMFC composite membranes: Influence on the electrochemical behaviour. J. Power Sources 2006, 163, 52–55. [Google Scholar] [CrossRef]
- Edmondson, C.A.; Stallworth, P.E.; Chapman, M.E.; Fontanella, J.J.; Wintersgill, M.C.; Chung, S.H.; Greenbaum, S.G. Complex impedance studies of proton-conducting membranes. Solid State Ion. 2000, 135, 419–423. [Google Scholar] [CrossRef]
- Every, H.A.; Hickner, M.A.; McGrath, J.E.; Zawodzinski, T.A., Jr. An NMR study of methanol diffusion in polymer electrolyte fuel cell membranes. J. Membr. Sci. 2005, 250, 183–188. [Google Scholar] [CrossRef]
- Jayakody, J.R.P.; Khalfan, A.; Mananga, E.S.; Greenbaum, S.G.; Dang, T.D.; Mantz, R. NMR investigation of water and methanol transport in sulfonated polyareylenethioethersulfones for fuel cell applications. J. Power Sources 2006, 156, 195–199. [Google Scholar] [CrossRef]
- Freger, V.; Korin, E.; Wisniak, J.; Korngold, E.; Ise, M.; Kreuer, K.D. Diffusion of water and ethanol in ion-exchange membranes: Limits of the geometric approach. J. Membr. Sci. 1999, 160, 213–224. [Google Scholar] [CrossRef]
- Gong, X.; Bandis, A.; Tao, A.; Meresi, G.; Wang, Y.; Inglefield, P.T.; Jones, A.A.; Wen, W.-Y. Self-diffusion of water, ethanol and decafluropentane in perfluorosulfonate ionomer by pulse field gradient NMR. Polymer 2001, 42, 6485–6492. [Google Scholar] [CrossRef]
- Khalfan, A.N.; Sanchez, L.M.; Kodiweera, C.; Greenbaum, S.G.; Bai, Z.; Dang, T.D. Water and proton transport properties of hexafluorinated sulfonated poly(arylenethioethersulfone) copolymers for applications to proton exchange membrane fuel cells. J. Power Sources 2007, 173, 853–859. [Google Scholar] [CrossRef]
- Huang, Y.F.; Chuang, L.C.; Kannan, A.M.; Lin, C.W. Proton-conducting membranes with high selectivity from cross-linked poly (vinyl alcohol) and poly (vinyl pyrrolidone) for direct methanol fuel cell applications. J. Power Sources 2009, 186, 22–28. [Google Scholar] [CrossRef]
- Hallberg, F.; Vernersson, T.; Pettersson, E.T.; Dvinskikh, S.V.; Lindbergh, G.; Furo, I. Electrokinetic transport of water and methanol in Nafion membranes as observed by NMR spectroscopy. Electrochim. Acta 2010, 55, 3542–3549. [Google Scholar] [CrossRef]
- Kritskaya, D.A.; Abdrashidov, E.F.; Bokun, V.C.; Ponomarev, A.N.; Chernyak, A.V.; Vasil’ev, S.G.; Volkov, V.I. An NMR Study of Sorption-Diffusion Properties of MF-4SK-Carbon Composite Membranes in Aqueous Methanol Solutions. Pet. Chem. 2011, 1, 266–272. [Google Scholar] [CrossRef]
- Guillermo, A.; Gebel, G.; Mendil-Jakani, H.; Pinton, E. NMR and pulsed field gradient NMR approach of water sorption properties in Nafion at low temperature. J. Phys. Chem. B 2009, 113, 6710–6717. [Google Scholar] [CrossRef]
- Ma, Z.; Jiang, R.; Myers, M.E.; Thompson, E.L.; Gittleman, C.S. NMR studies of proton transport in fuel cell membranes at sub-freezing conditions. J. Mater. Chem. 2011, 21, 9302–9311. [Google Scholar] [CrossRef]
- Kusoglu, A.; Weber, A.Z. New Insights into Perfluorinated Sulfonic-Acid Ionomers. Chem. Rev. 2017, 117, 987–1104. [Google Scholar] [CrossRef]
- Zhao, Q.; Majsztrik, P.; Benziger, J. Diffusion and Interfacial Transport of Water in Nafion. J. Phys. Chem. B 2011, 115, 2717–2727. [Google Scholar] [CrossRef]
- Zawodzinski, T.A.; Derouin, C.; Radzinski, S.; Sherman, R.J.; Smith, V.T.; Springer, T.E.; Gottesfeld, S. Water Uptake by and Transport Through Nafion 117 Membranes. J. Electrochem. Soc. 1993, 140, 1041–1047. [Google Scholar] [CrossRef]
- Zawodzinski, T.A.; Springer, T.E.; Davey, J.; Jestel, R.; Lopez, C.; Valerio, J.; Gottesfeld, S. A Comparative Study of Water Uptake by and Transport through Ionomeric Fuel Cell Membranes. J. Electrochem. Soc. 1993, 140, 1981–1985. [Google Scholar] [CrossRef]
- Cappadonia, M.; Erning, J.W.; Niaki, S.M.S.; Stimming, U. Conductance of Nafion 117 membranes as a function of temperature and water content. Solid State Ion. 1995, 77, 65–69. [Google Scholar] [CrossRef]
- Nicotera, I.; Coppola, L.; Rossi, C.O.; Youssry, M.; Ranieri, G.A. NMR Investigation of the Dynamics of Confined Water in Nafion-Based Electrolyte Membranes at Subfreezing Temperatures. J. Phys. Chem. B 2009, 113, 13935–13941. [Google Scholar] [CrossRef]
- Suh, K.-J.; Hong, Y.-S.; Skirda, V.D.; Volkov, V.I.; Lee, C.-Y.; Lee, C.-H. Water self-diffusion behavior in yeast cells studied by pulsed field gradient NMR. Biophys. Chem. 2003, 104, 121–130. [Google Scholar] [CrossRef]
- Cho, C.-H.; Hong, Y.-S.; Kang, K.; Volkov, V.I.; Skirda, V.D.; Lee, C.-Y.J.; Lee, C.H. Water self-diffusion in Chlorella sp. studied by pulse field gradient NMR. Magn. Reson. Imaging 2003, 21, 1009–1017. [Google Scholar] [CrossRef]
- Ozerin, A.N.; Rebrov, A.V.; Yakunin, A.N.; Bogovtseva, L.P.; Timashev, S.F.; Bakeev, N.F. Structural changes in perfluorinated membranes in the processes of saponification and orientation stretching. Polym. Sci. USSR 1986, 28, 275–282. [Google Scholar] [CrossRef]
- Ozerin, A.N.; Rebrov, A.V.; Yakunin, A.N.; Bessonova, N.P.; Dreiman, N.A.; Sokolov, L.F.; Bakeev, N.F. Effect of low molecular weight fractions on the structure of the perfluorinated sulphocationite ion-exchange membrane. Polym. Sci. USSR 1986, 28, 2559–2565. [Google Scholar] [CrossRef]
- Eisenberg, A.; King, A.E. Ion Containing Polymers: Physical Properties and Structure; Academic Press: New York, NY, USA, 1977; p. 287. [Google Scholar]
- Yaroslavtsev, A.B. Perfluorinated ion-exchange membranes. Polym. Sci. Ser. A 2013, 55, 674–698. [Google Scholar] [CrossRef]
- Fujimura, M.; Hashimoto, T.; Kawai, H. Small-angle x-ray scattering study of perfluorinated ionomer membranes. 2. Models for ionic scattering maximum. Macromolecules 1982, 15, 136–144. [Google Scholar] [CrossRef]
- Gierke, T.D.; Munn, G.E.; Wilson, F.C. The morphology in nafion perfluorinated membrane products, as determined by wide-and small-angle x-ray studies. J. Polym. Sci. Polym. Phys. Ed. 1981, 19, 1687. [Google Scholar] [CrossRef]
- Hsu, W.Y.; Gierke, T.D. Ion transport and clustering in nafion perfluorinated membranes. J. Membr. Sci. 1983, 13, 307–326. [Google Scholar] [CrossRef]
- Mauritz, K.A.; Moore, R.B. State of Understanding of Nafion. Chem. Rev. 2004, 104, 4535–4586. [Google Scholar] [CrossRef]
- Mologin, D.A.; Khalatur, P.G.; Khokhlov, A.R. Structural Organization of Water-Containing Nafion: A Cellular-Automaton-Based Simulation. Macromol. Theor. Simul. 2001, 11, 587–607. [Google Scholar] [CrossRef]
- Chibirova, F.K.; Zakharin, D.S.; Sedov, V.E.; Timashev, S.F.; Popkov, Y.M.; Reiman, S.I. Characteristics Of The Perfluorinated Ion-Exchange Sulfocation Membrane-Structure According To Mossbauer-Spectroscopy Data. Russ. J. Chem. Phys. 1987, 6, 1137–1145. [Google Scholar]
- Volfkovich, Y.M.; Luzhin, V.K.; Vanyulin, A.N.; Shkolnikov, E.I.; Blinov, I.A. Application of the standard porometry method to investigation of the porous structure of ion-exchange membranes. Elektrokhimiya 1984, 20, 656. [Google Scholar]
- Rubatat, L.; Diat, O.; Gebel, G. New structural model for Nafion® membranes. In Laboratoire Léon Brillouin Scientific Report 2003–2004; Imprilith S.A.: Pringy, France, 2005; p. 218. [Google Scholar]
- Volkov, V.I.; Gladkikh, S.N.; Timashev, S.F.; Smirnov, N.I.; Muromtsev, V.I.; Andreeva, A.I.; Timofeev, S.V. Perfluorinated sulfocation exchange membrane structure studied by NMR relaxation 19F and paramagnetic probe techniques. Russ. J. Chem. Phys. 1983, 13, 49–53. [Google Scholar]
- Volkov, V.I.; Timashev, S.F. Magnetic-Resonance Method in The Study of Perfluorinated Ion-Exchange Membranes. Russ. J. Phys. Chem. 1989, 63, 209–220. [Google Scholar]
- Volkov, V.I.; Muromtsev, V.I.; Pukhov, K.K.; Timashev, S.F.; Balaev, G.A. Issledovanie structury perftorirovannyh kationitovyh membran metodom matrichnogo dvoinogo elektronno-yadernogo resonansa. Dokl. Akad. Nauk SSSR 1984, 276, 395. (In Russian) [Google Scholar]
- Volkov, V.I.; Pukhov, K.K.; Choh, S.H.; Park, I.-W.; Volkov, E.V. Matrix ENDOR of ion-exchange systems. Appl. Magn. Reson. 2003, 24, 177. [Google Scholar] [CrossRef]
- Vishnevskaya, G.P.; Molochnikov, L.S.; Safin, R.S. EPR v Ionitakh (ESR in Ionites); Nauka: Moscow, Russia, 1992; p. 166. [Google Scholar]
- Hindman, J.C. Nuclear Magnetic Resonance Effects in Aqueous Solutions of 1-1 Electrolytes. J. Chem. Phys. 1962, 36, 1000. [Google Scholar] [CrossRef]
- Knapp, P.S.; Waite, R.O.; Malinowski, E.R. NMR Studies of Aqueous Electrolyte Solutions. Hydration of Sodium Perchlorate, Hydrochloric Acid, and Perchloric Acid from Temperature Effects on Proton Shifts. J. Chem. Phys. 1968, 49, 5459–5463. [Google Scholar] [CrossRef]
- Creekmore, R.W.; Reilley, C.N. Nuclear Magnetic Resonance Determination of Hydration Numbers of Electrolytes in Concentrated Aqueous Solutions. J. Phys. Chem. 1969, 73, 1563–1568. [Google Scholar] [CrossRef]
- Malinowski, E.R.; Knapp, P.S.; Feuer, B. NMR Studies of Aqueous Electrolyte Solutions. I. Hydration Number of NaCI Determined from Temperature Effects on Proton Shift. J. Chem. Phys. 1966, 45, 4274–4279. [Google Scholar] [CrossRef]
- Volkov, V.I.; Marinin, A.A. NMR methods for studying ion and molecular transport in polymer electrolytes. Russ. Chem. Rev. 2013, 82, 248–272. [Google Scholar] [CrossRef]
- Maldonado, L.; Perrin, J.-C.; Dillet, J.; Lottin, O. Characterization of polymer electrolyte Nafion membranes: Influence of temperature, heat treatment and drying protocol on sorption and transport properties. J. Membr. Sci. 2012, 389, 43–56. [Google Scholar] [CrossRef]
- Iwamoto, R.; Oguro, K.; Sato, M.; Iseki, Y. Water in perfluorinated, sulfonic acid Nafion membranes. J. Phys. Chem. B 2002, 106, 6973–6979. [Google Scholar] [CrossRef]
- Batamack, P.; Fraissard, J. Proton NMR studies on concentrated aqueous silfuric acid solutions and Nafion-H. Catal. Lett. 1997, 49, 129–136. [Google Scholar] [CrossRef]
- Chernyak, A.V.; Gnezdilov, O.I.; Skirda, V.D.; Volkov, V.I. Hydration, self-diffusion and ionic conductivity of Li+, Na+ and Cs+ cations in Nafion membrane studied by NMR. Solid State Ion. 2021, 364, 115627. [Google Scholar]
- Marcus, Y. Thermodynamics of solvation of ions. Part 6.—The standard partial molar volumes of aqueous ions at 298.15 K. J. Chem. Soc. 1993, 89, 713–718. [Google Scholar] [CrossRef]
- Moster, A.L.; Mitchell, B.S. Hydration and Proton Conduction in Nafion/Ceramic Nanocomposite Membranes Produced by Solid-State Processing of Powders from Mechanical Attrition. Appl. Polym. Sci. 2009, 113, 243. [Google Scholar] [CrossRef]
- Thompson, E.L.; Capehart, T.W.; Fuller, T.J.; Jorne, J. Investigation of Low-Temperature Proton Transport in Nafion Using Direct Current Conductivity and Differential Scanning Calorimetry. J. Electrochem. Soc. 2006, 153, A2351–A2362. [Google Scholar] [CrossRef]
- Kononenko, N.; Nikonenko, V.; Grande, D.; Larchet, C.; Dammak, L.; Fomenko, M.; Volfkovich, Y. Porous structure of ion exchange membranes investigated by various techniques. Adv. Colloid Interface Sci. 2017, 246, 196–216. [Google Scholar] [CrossRef]
- Plazanet, M.; Sacchetti, F.; Petrillo, C.; Deme, B.; Bartolini, P.; Torre, R. Water in a Palymeric Electrolyte Membrane: Sorption/Desorption and Freezing phenomena. J. Membr. Sci. 2014, 453, 419. [Google Scholar] [CrossRef]
- Galitskaya, E.; Privalov, A.F.; Weigler, M.; Vogel, M.; Kashin, A.; Ryzhkin, M.; Sinitsyn, V. NMR diffusion studies of proton-exchange membranes in wide temperature range. J. Membr. Sci. 2020, 596, 117691. [Google Scholar] [CrossRef]
- Yaroslavtsev, A.B. Solid electrolytes: Main prospects of research and development. Russ. Chem. Rev. 2016, 85, 1255–1276. [Google Scholar] [CrossRef]
- Yaroslavtsev, A.B.; Stenina, I.A.; Golubenko, D.V. Membrane materials for energy production and storage. Pure Appl. Chem. 2020, 92, 1147–1157. [Google Scholar] [CrossRef]
- Lide, D.R. CRC Handbook of Chemistry and Physics; CRC Press: Boca Raton, FL, USA, 2004; p. 2660. [Google Scholar]
- Stenina, I.A.; Yaroslavtsev, A.B. Ionic Mobility in Ion-Exchange Membranes. Membranes 2021, 11, 198. [Google Scholar] [CrossRef] [PubMed]
- Alberts, B.; Johnson, A.; Lewis, J.; Raff, M.; Roberts, K.; Walter, P. Molecular Biology of the Cell, 5th ed.; Garland Science: New York, NY, USA, 2008; p. 1616. [Google Scholar]
- Van Den Bedem, H.; Fraser, J.S. Integrative, dynamic structural biology at atomic resolution—It’s about time. Nat. Methods 2015, 12, 307. [Google Scholar] [CrossRef]
- Mao, A.H.; Lyle, N.; Pappu, R.V. Describing sequence–ensemble relationships for intrinsically disordered proteins. Biochem. J. 2013, 449, 307–318. [Google Scholar] [CrossRef]
- Wright, P.E.; Dyson, H.J. Intrinsically disordered proteins in cellular signaling and regulation. Nat. Rev. Mol. Cell Biol. 2015, 16, 18–29. [Google Scholar] [CrossRef]
- Hong, M.; Zhang, Y.; Hu, F. Membrane protein structure and dynamics from NMR spectroscopy. Annu. Rev. Phys. Chem. 2012, 63, 1–24. [Google Scholar] [CrossRef]
- Buffy, J.J.; Waring, A.J.; Hong, M. Determination of peptide oligomerization in lipid bilayers using 19F spin diffusion NMR. J. Am. Chem. Soc. 2005, 127, 4477–4483. [Google Scholar] [CrossRef]
- Frei, J.N.; Broadhurst, R.W.; Bostock, M.J.; Solt, A.; Jones, A.J.; Gabriel, F.; Tandale, A.; Shrestha, B.; Nietlispach, D. Conformational plasticity of ligand-bound and ternary GPCR complexes studied by 19F NMR of the β 1-adrenergic receptor. Nat. Commun. 2020, 11, 1–14. [Google Scholar] [CrossRef]
- McFeeters, R.L.; Oswald, R.E. Structural mobility of the extracellular ligand-binding core of an ionotropic glutamate receptor. Analysis of NMR relaxation dynamics. Biochemistry 2002, 41, 10472–10481. [Google Scholar] [CrossRef]
- de Gennes, P.G. Scaling Concepts in Polymer Physics, 1st ed.; Cornell University Press: Ithaca, NY, USA, 1979; p. 324. [Google Scholar]
- Grosberg, A.Y.; Khokhlov, A.R.; Stanley, H.E.; Mallinckrodt, A.J.; McKay, S. Statistical physics of macromolecules. Comput. Phys. 1995, 9, 171–172. [Google Scholar] [CrossRef]
- Nesmelova, I.V.; Skirda, V.D.; Fedotov, V.D. Generalized concentration dependence of globular protein self-diffusion coefficients in aqueous solutions. Biopolymers 2002, 63, 132–140. [Google Scholar] [CrossRef]
- Brune, D.; Kim, S. Predicting protein diffusion coefficients. Proc. Natl. Acad. Sci. USA 1993, 90, 3835–3839. [Google Scholar] [CrossRef]
- Skirda, V.D.; Sundukov, V.I.; Maklakov, A.I.; Zgadzai, O.E.; Gafurov, I.R.; Vasiljev, G.I. On the generalized concentration and molecular mass dependencies of macromolecular self-diffusion in polymer solutions. Polymer 1988, 29, 1294–1300. [Google Scholar] [CrossRef]
- Tokuyama, M.; Oppenheim, I. Dynamics of hard-sphere suspensions. Phys. Rev. E 1994, 50, R16. [Google Scholar] [CrossRef]
- Lowe, C.P.; Masters, A.J. The viscoelastic response of Brownian suspensions. J. Chem. Phys. 1999, 111, 8708–8720. [Google Scholar] [CrossRef]
- Dyson, H.J.; Wright, P.E. Intrinsically unstructured proteins and their functions. Nat. Rev. Mol. Cell Biol. 2005, 6, 197–208. [Google Scholar] [CrossRef]
- Ward, J.J.; Sodhi, J.S.; McGuffin, L.J.; Buxton, B.F.; Jones, D.T. Prediction and Functional Analysis of Native Disorder in Proteins from the Three Kingdoms of Life. J. Mol. Biol. 2004, 337, 635–645. [Google Scholar] [CrossRef]
- Li, J.I.E.; Zhu, M.I.N.; Manning-Bog, A.B.; Di Monte, D.A.; Fink, A.L. Dopamine and L-dopa disaggregate amyloid fibrils: Implications for Parkinson’s and Alzheimer’s disease. FASEB J. 2004, 18, 962–964. [Google Scholar] [CrossRef]
- Lu, J.X.; Qiang, W.; Yau, W.M.; Schwieters, C.D.; Meredith, S.C.; Tycko, R. Molecular structure of β-amyloid fibrils in Alzheimer’s disease brain tissue. Cell 2013, 154, 1257–1268. [Google Scholar] [CrossRef]
- Melnikova, D.L.; Skirda, V.D.; Nesmelova, I.V. Effect of Intrinsic Disorder and Self-Association on the Translational Diffusion of Proteins: The Case of α-Casein. J. Phys. Chem. B 2017, 121, 2980–2988. [Google Scholar] [CrossRef]
- Gafurov, I.R.; Skirda, V.D.; Maklakov, A.I.; Perevezentseva, S.P.; Zimkin, Y.A. NMR Study of the Structure of Aqueous Gelatine Gels and the Process of Their Formation. Polym. Sci. USSR 1989, 31, 292–300. [Google Scholar] [CrossRef]
- Skirda, V.D.; Gafurov, I.R.; Maklakov, A.I.; Doroginitskii, M.M.; Flyaisher, G. Translational Mobility of Macromolecules in Networks. Vysokomol. Soedin. B 1988, 30, 313–314. [Google Scholar]
- Skirda, V.D.; Doroginizkij, M.M.; Sundukov, V.I.; Maklakov, A.I.; Fleischer, G.; Häusler, K.G.; Straube, E. Detection of Spatial Fluctuations of Segments in Swollen Polybutadiene Networks by Nuclear Magnetic Resonance Pulsed Field Gradient Technique. Makromol. Chem. 1988, 9, 603–607. [Google Scholar] [CrossRef]
- Marchesseau, S.; Mani, J.C.; Martineau, P.; Roquet, F.; Cuq, J.L.; Pugniere, M. Casein Interactions Studied by the Surface Plasmon Resonance Technique. J. Dairy Sci. 2002, 85, 2711–2721. [Google Scholar] [CrossRef]
- Horne, D.S. Casein Interactions: Casting Light on the Black Boxes, the Structure in Dairy Products. Int. Dairy J. 1998, 8, 171–177. [Google Scholar] [CrossRef]
- Euston, S.R.; Naser, M.A. Simulating the Equation of State of Model Globular Proteins Adsorbed at a Surface. Langmuir 2005, 21, 4227–4235. [Google Scholar] [CrossRef]
- Burchard, W. Filamentous Supramolecular Structures. Macromol. Symp. 2010, 295, 49–58. [Google Scholar] [CrossRef]
- Antonov, V.F. Membrannyi transport. Sorosovskii obrazovatel’nyi zhurnal 1997, 6, 14–20. (In Russian) [Google Scholar]
- Agre, P.; Preston, G.; Smith, B.; Jung, J.; Raina, S.; Moon, C.; Guggino, W.; Nielsen, S. Aquaporin CHIP: The Archetypal Molecular Water Channel. Am. J. Physiol. 1993, 265, F463–F476. [Google Scholar] [CrossRef] [PubMed]
- Agre, P. The Aquaporin Water Channels. Proc. Am. Thorac. Soc. 2006, 3, 5–13. [Google Scholar] [CrossRef] [PubMed]
- Kozono, D.; Yasui, M.; King, L.S.; Agre, P. Aquaporin water channels: Atomic structure molecular dynamics meet clinical medicine. J. Clin. Investig. 2002, 109, 1395–1399. [Google Scholar] [CrossRef] [PubMed]
- Carbrey, J.M.; Agre, P. Discovery of the Aquaporins and Development of the Field. Aquaporins 2009, 190, 3–28. [Google Scholar]
- Outhred, R.; Conlon, T. The volume dependence of the erythrocyte water diffusion permeability. BBA—Biomembranes 1973, 318, 446–450. [Google Scholar] [CrossRef]
- Macey, R.I. Transport of water and urea in red blood cells. Am. J. Physiol. Cell Physiol. 1984, 246, C195–C203. [Google Scholar] [CrossRef]
- Boss, D.; Kühn, J.; Jourdain, P.; Depeursinge, C.; Magistretti, P.J.; Marqueta, P. Measurement of absolute cell volume, osmotic membrane water permeability, and refractive index of transmembrane water and solute flux by digital holographic microscopy. J. Biomed. Opt. 2013, 18, 036007-1–036007-9. [Google Scholar] [CrossRef]
- Zhurova, M.; Olivieri, A.; Holt, A.; Acker, J. A method to measure permeability of red blood cell membrane to water and solutes using intrinsic fluorescence. Clin. Chim. Acta 2014, 431, 103–110. [Google Scholar] [CrossRef]
- Benga, G. Comparative studies of water permeability of red blood cells from humans and over 30 animal species: An overview of 20 years of collaboration with Philip Kuchel. Eur. Biophys. J. 2013, 42, 33–46. [Google Scholar] [CrossRef]
- Conlon, T.; Outhred, T. Water diffusion permeability of erythrocytes using an NMR technique. Biochim. Biophys. Acta 1972, 288, 354–361. [Google Scholar] [CrossRef]
- Morariu, V.V.; Benga, G. Water Diffusion through Erythrocyte Membranes in Normal and Pathological Subjects: Nuclear Magnetic Resonance Investigations. In Membrane Processes; Benga, G., Ed.; Springer: New York, NY, USA, 1984; pp. 121–140. [Google Scholar]
- Himmelreich, U.; Chapman, B.E.; Kuchel, P.W. Membrane permeability of formate in human erythrocytes: NMR measurements. Eur. Biophys. J. 1999, 28, 158–165. [Google Scholar] [CrossRef]
- Chapman, B.E.; Kuchel, P.W. Diffusion-Ordered (DOSY) NMR of Solute Exchange Across the Human Erythrocyte Membrane: Including an application of PostWidder Laplace inversion. Diffus. Fundam. 2007, 4, 8.1–8.15. [Google Scholar]
- Gianolio, E.; Ferrauto, G.; Gregorio, E.D.; Aime, S. Re-evaluation of the water exchange lifetime value across red blood. Biochim. Biophys. Acta 2016, 1858, 627–631. [Google Scholar] [CrossRef]
- Herbst, M.-D.; Goldstein, J.-H. A review of water diffusion measurement by NMR in human red blood cells. Am. J. Physiol. 1989, 256, C1097–C1104. [Google Scholar] [CrossRef]
- Anisimov, A.; Suslov, M. Estimating the MRI Contrasting Agents Effect on Water Permeability of Plant Cell Membranes Using the 1H NMR Gradient Technique. Appl. Magn. Reson. 2021, 52, 235–246. [Google Scholar] [CrossRef]
- Andrasko, J. Water diffusion permeability of human erythrocytes studied by a pulsed gradient NMR technique. Biochim. Biophys. Acta 1976, 428, 304–311. [Google Scholar] [CrossRef]
- Waldeck, A.R.; Nouri-Sorkhabi, M.H.; Sullivan, D.R.; Kuchel, P.W. Effects of cholesterol on transmembrane water diffusion in human erythrocytes measured using pulsed field gradient NMR. Biophys. Chem. 1995, 55, 197–208. [Google Scholar] [CrossRef]
- Waldeck, A.R.; Kuchel, P.W.; Lennon, A.J.; Chapman, B.E. NMR diffusion measurements to characterise membrane transport and solute binding. Progr. Nucl. Magn. Reson. Spectr. 1997, 30, 39–68. [Google Scholar] [CrossRef]
- Larkin, T.J.; Kuchel, P.W. Erythrocyte orientational and cell volume effects on NMR q-space analysis: Simulations of restricted diffusion. Eur. Biophys. 2009, 39, 139–148. [Google Scholar] [CrossRef]
- Hong, K.S.; Yeom, G.-S.; Cho, J.-H.; Kim, E.-H.; Lee, C.; Lee, S.D.; Cheong, C. PFG NMR Study of Intra-cellular Drug Uptake in Xenopus laevis Oocyte. J. Korean Magn. Reson. Soc. 2005, 9, 29. [Google Scholar]
- Babsky, A.M.; Topper, S.; Zhang, H.; Gao, Y.; James, J.R.; Hekmatyar, S.K.; Bansal, N. Evaluation of extra-and intracellular apparent diffusion coefficient of sodium in rat skeletal muscle: Effects of prolonged ischemia. Magn. Reson. Med. 2008, 59, 485. [Google Scholar] [CrossRef]
- Avilova, I.A.; Vasil’ev, S.G.; Rimareva, L.V.; Serba, E.M.; Volkova, L.D.; Volkov, V.I. Water metabolism in cells of Saccharomyces cerevisiae of races Y-3137 and Y-3327, according to pulsed-field gradient NMR data. Russ. J. Phys. Chem. A 2015, 89, 710. [Google Scholar] [CrossRef]
- Avilova, I.A.; Smolina, A.V.; Kotelnikov, A.I.; Kotelnikova, R.A.; Loskutov, V.V.; Volkov, V.I. Self-diffusion of water and blood lipids in mouse erythrocytes. Appl. Magn. Reson. 2016, 47, 335–347. [Google Scholar] [CrossRef]
- Avilova, I.A.; Khakina, E.A.; Kraevaya, O.A.; Kotelnikov, A.I.; Kotelnikova, R.A.; Troshin, P.A.; Volkov, V.I. Self-diffusion of water-soluble fullerene derivatives in mouse erythrocytes. BBA—Biomembranes 2018, 1860, 1537–1543. [Google Scholar] [CrossRef] [PubMed]
- Avilova, I.A.; Soldatova, Y.V.; Kraevaya, O.A.; Zhilenkov, A.V.; Dolgikh, E.A.; Kotel’nikova, R.A.; Troshin, P.A.; Volkov, V.I. Self-Diffusion of Fullerene C60 Derivatives in Aqueous Solutions and Suspensions of Erythrocytes According to Pulsed Field Gradient NMR Data. Russ. J. Phys. Chem. A 2021, 95, 285–291. [Google Scholar] [CrossRef]
- Mitra, P.P.; Sen, P.N.; Schawartz, L.M. Short-time behavior of the diffusion coefficient as a geometrical probe of porous media. Phys. Rev. B 1993, 47, 8565. [Google Scholar] [CrossRef] [PubMed]
- Anisimov, A.V.; Sorokina, N.Y.; Dautova, N.R. Water diffusion in biological porous systems: A NMR approach. Magn. Reson. Imaging 1998, 16, 565–568. [Google Scholar] [CrossRef]
- Crick, F. Diffusion in embryogenesis. Nature 1970, 225, 420–422. [Google Scholar] [CrossRef]
- Karger, J.; Pheifer, H.; Heink, W. Principles and Application of Self-diffusion Measurements by Nuclear Magnetic Resonance. Adv. Magn. Reson. 1988, 12, 1–89. [Google Scholar]
- Hong, Y.S.; Kim, K.C.; Volkov, V.I.; Skirda, V.D.; Lee, C.-H. Structural and dynamic properties of polyoxyethylene sorbitan monooleate micelle in water dispersion studied by pulsed field gradient NMR. Appl. Magn. Reson. 2005, 29, 351. [Google Scholar] [CrossRef]
- Filippov, A.; Oradd, G.; Lindblom, G. The Effect of Cholesterol on the Lateral Diffusion of Phospholipids in Oriented Bilayers. Biophys. J. 2003, 84, 3079. [Google Scholar] [CrossRef]
- Beuerle, F.; Lebovitz, R.; Hirsch, A. Antioxidant Properties of Water-Soluble Fullerene Derivatives. In Medicinal Chemistry and Pharmacological Potential of Fullerenes and Carbon Nanotubes. Carbon Materials: Chemistry and Physics; Cataldo, F., Da Ros, T., Eds.; Springer: Dordrecht, The Netherlands, 2008; Volume 1, pp. 51–78. [Google Scholar]
- Khakina, E.A.; Kraevaya, O.A.; Popova, M.L.; Peregudov, A.S.; Troyanov, S.I.; Chernyak, A.V.; Martynenko, V.M.; Kulikov, A.V.; Schols, D.; Troshin, P.A. Synthesis of different types of alkoxy fullerene derivatives from chlorofullerene C60Cl6. Org. Biomol. Chem. 2017, 15, 773–777. [Google Scholar] [CrossRef]
- Hsieh, F.-Y.; Zhilenkov, A.V.; Voronov, I.I.; Khakina, E.A.; Mischenko, D.V.; Troshin, P.A.; Hsu, S.-H. Water-Soluble Fullerene Derivatives as Brain Medicine: Surface Chemistry Determines If They Are Neuroprotective and Antitumor. ACS Appl. Mater. Interfaces 2017, 9, 11482–11492. [Google Scholar] [CrossRef]
- Valiullin, R.; Skirda, V. Time dependent self-diffusion coefficient of molecules in porous media. J. Chem. Phys. 2001, 114, 452–458. [Google Scholar] [CrossRef]
- Valiullin, R.R.; Skirda, V.D.; Stapf, S.; Kimmich, R. Molecular exchange processes in partially filled porous glass as seen with NMR diffusometry. R. Phys. Rev. 1996, 55, 2664. [Google Scholar] [CrossRef]
- Mutina, A.R.; Skirda, V.D. Porous media characterization by PFG and IMFG NMR. J. Magn. Reson. 2007, 188, 122–128. [Google Scholar] [CrossRef] [PubMed]


| Amount of Water Molecules per One Sulfonate Group | DcalcH2O m2/s | DexpH2O m2/s | DcalcLi+ m2/s | DexpLi+ m2/s |
|---|---|---|---|---|
| 4 | 5∙10−12 | 4∙10−12 | 2∙10−12 | 1∙10−12 |
| 20.5 | 3∙10−10 | 2∙10−10 | 4∙10−11 | 3∙10−11 |
| Type of Membrane | MF-4SC | |||
| Ionic Form | H+ | Li+ | Na+ | Cs+ |
| h ± 0.5 | 2.3 | 3.8 | 3.5 | 1.7 |
| Type of membrane | F-4CF | |||
| Ionic form | H+ | Li+ | Na+ | Cs+ |
| h ± 0.5 | 1.3 | 2.8 | 2.0 | 1.0 |
| λ, [H2O]/[SO3H] | Hydration Number h |
|---|---|
| 1.9 ± 0.4 | 1.4 ± 0.5 |
| 3.2 ± 0.4 | 2.4 ± 0.5 |
| 4.4 ± 0.4 | 3.0 ± 0.3 |
| 5.8 ± 0.4 | 3.5 ± 0.3 |
| 6.4 ± 0.4 | 4.1 ± 0.3 |
| 7.4 ± 0.4 | 3.4 ± 0.3 |
| 12.0 ± 0.4 | 3.9 ± 0.3 |
| 17.5 ± 0.4 | 4.5 ± 0.5 |
| λ, [H2O/SO3−] | 0.9 | 2.0 | 4.0 | 5.7 | 7.4 | 10.7 | 12 |
|---|---|---|---|---|---|---|---|
| H | 0.6 ± 0.3 | 1.2 ± 0.5 | 2.1 ± 0.5 | 2.6 ± 0.5 | 2.9 ± 0.5 | 4.2 ± 1.0 | 5.0 ± 1.0 |
| Cation | Li+ | Na+ | Cs+ |
|---|---|---|---|
| Crystallography ionic radius, Å [30] | 0.69 | 1.02 | 1.67 |
| Stokes–Einstein hydrodynamic ionic radius, Å [31] | 2.38 | 1.84 | 1.19 |
| Stokes–Einstein hydrodynamic radius, estimated from ionic diffusion coefficient in chloride aqueous solution at infinite dilute concentration | 2.70 | 2.20 | 1.50 |
| Total water uptake of membrane (λ) | 24.00 | 21.00 | 16.00 |
| Water amount per membrane sulfonate group (λs) | 13.80 | 10.30 | 8.10 |
| Hydration number of cations (h) in membrane | 4.10 ± 1.00 | 5.00 ± 1.00 | 3.10 ± 1.00 |
| Hydration number of cations (h) in aqueous solution [103,104] | 4.00 | 4.60 | 3.90 |
| Ionic Form | σMF-4SC/S∙cm−1 | σMF-4SC/S∙cm−1 | ||
|---|---|---|---|---|
| Experiment | Calculation | Experiment | Calculation | |
| H+ | 2.8·10−2 | 4.3·10−2 | 1.5·10−7 | 1.5·10−6 |
| Li+ | 6.2·10−3 | 1.1·10−2 (see a) | 1.0·10−3 | 4.3·10−3 |
| 6.5·10−3 (see b) | ||||
| Na+ | 6.1·10−3 | 1.2·10−2 | 1.2·10−3 | 4.6·10−3 |
| Cs+ | 3.4·10−4 | 8.3·10−4 | 3.7·10−4 | 7.2·10−4 |
| λ, [H2O/SO3−] | 0.9 | 2.0 | 4.0 | 5.7 | 7.4 | 10.7 |
|---|---|---|---|---|---|---|
| Ea Li+ cations self-diffusion, kJ/mol | 40.3 ± 2.0 | 38.4 ± 2.0 | 28.8 ± 2.0 | 25.0 ± 2.0 | 25 ± 2.0 | 27.8 ± 2.0 |
| Ea water molecules self-diffusion, kJ/mol | - | 28.8 ± 2.0 | 25.0 ± 2.0 | 23.0 ± 2.0 | 21.1 ± 2.0 | 19.2 ± 2.0 |
| Membrane Type | Cation | Moisture Content λ, Amount Water Molecules Per Cation | Cation Self-Diffusion Coefficient at 20 °C Ds, m2/s | Cation Self-Diffusion Activation Energy Ea, kJ/mol |
|---|---|---|---|---|
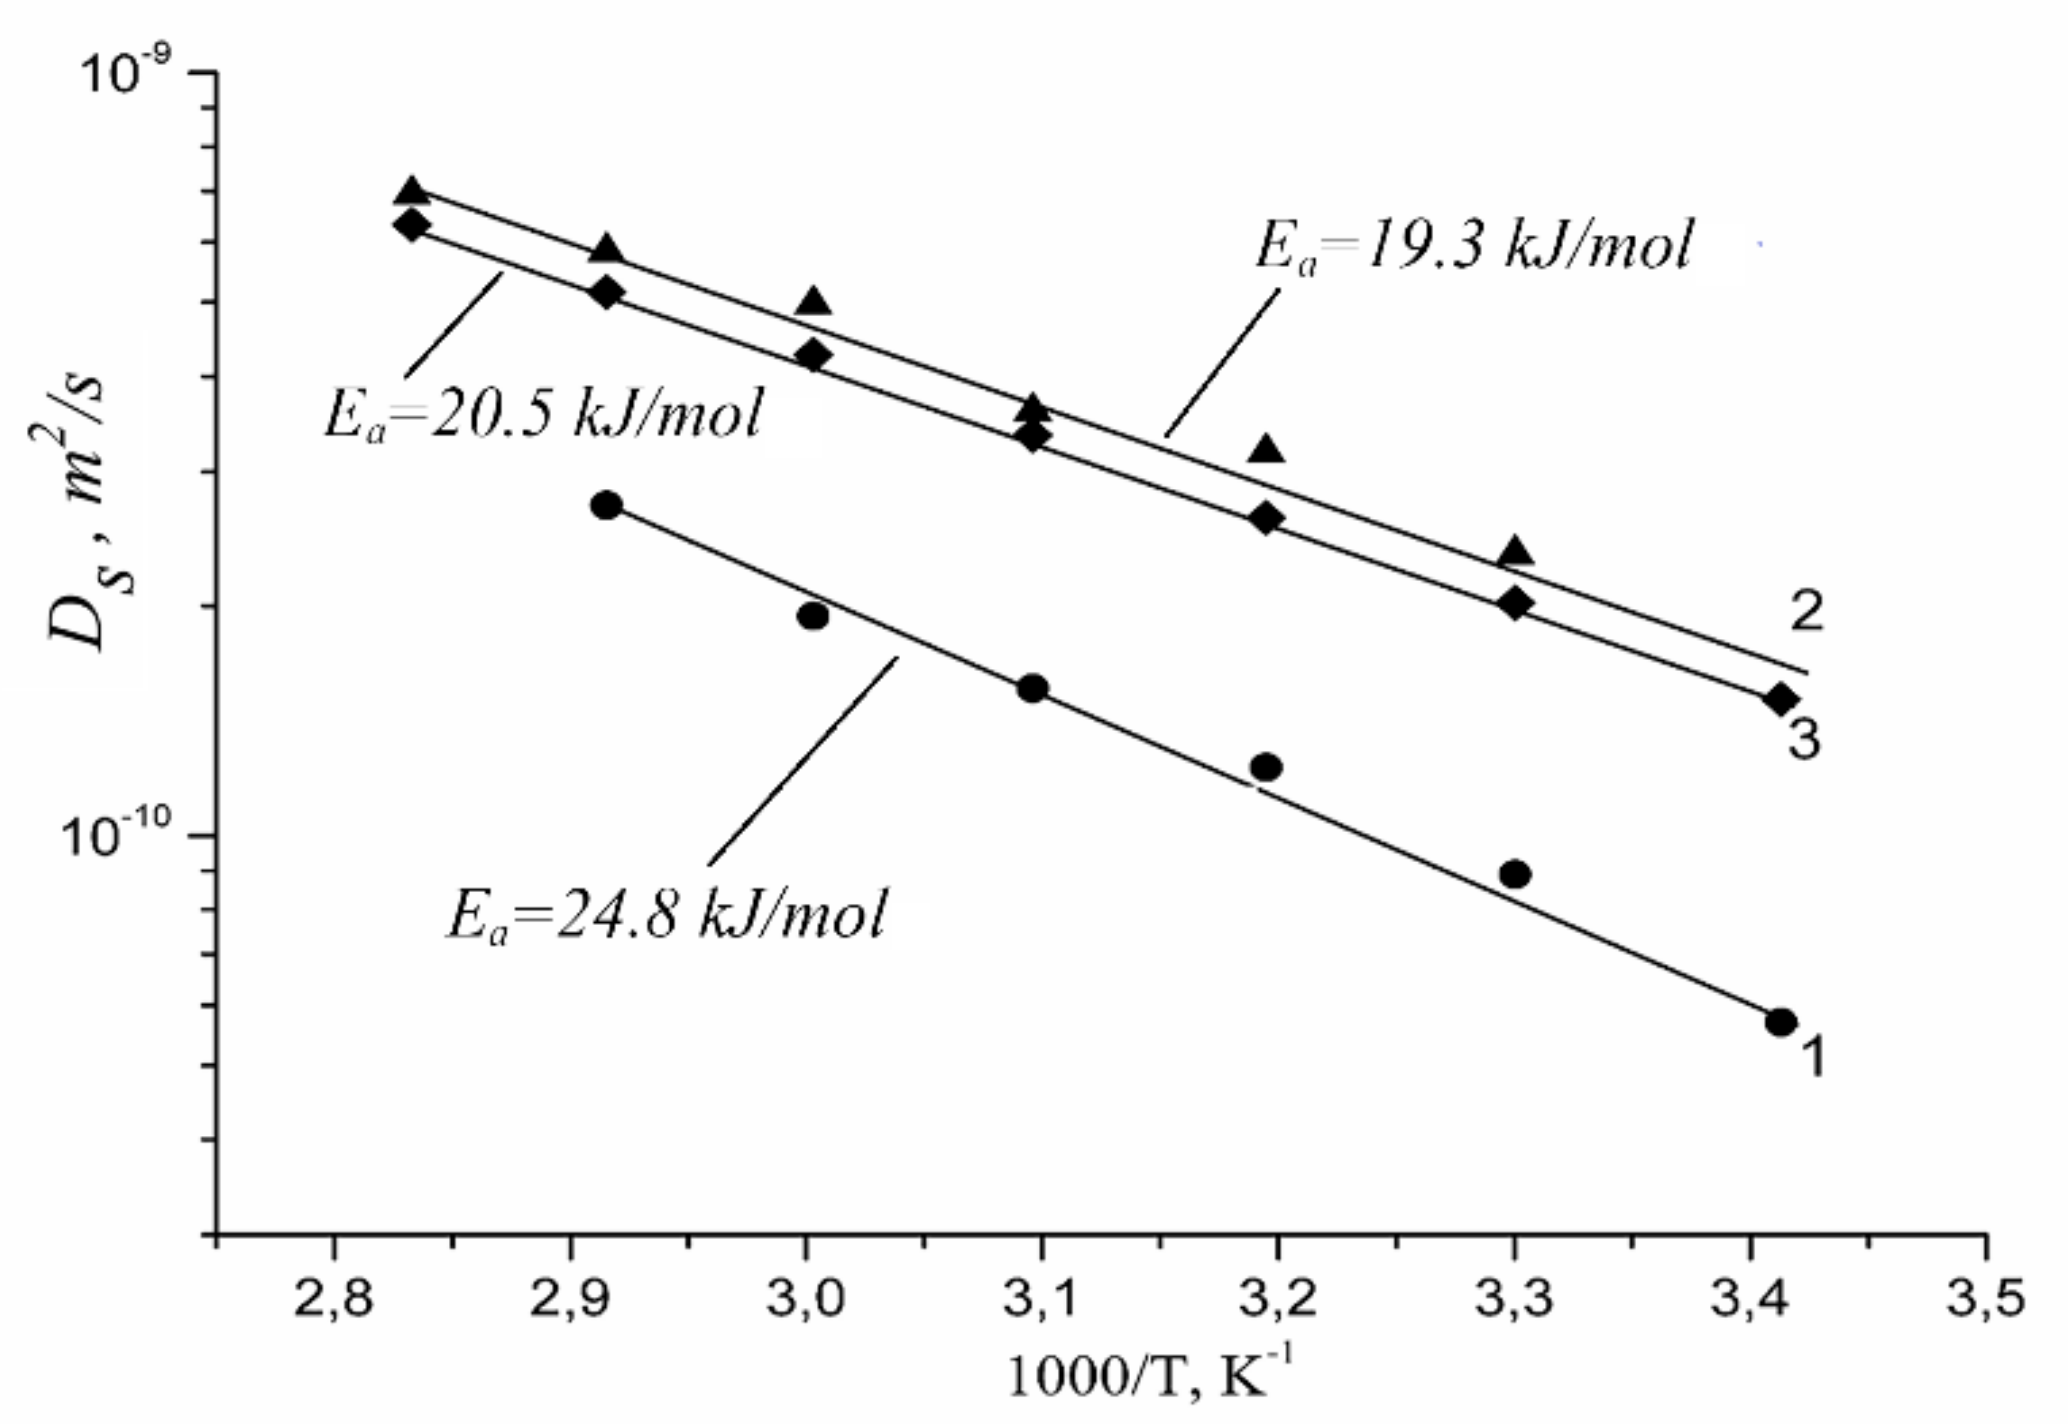
| Nafion | Li+ | 12 | (1.5 ± 0.1)10−10 | 20.5 ± 1.0 |
| Na+ | 10 | (2.1 ± 0.3)10−10 | 19.3 ± 1.5 | |
| Cs+ | 4 | (0.6 ± 0.2)10−10 | 24.8 ± 1.5 | |
| MSC [17] | Li+ | 24 | 3.7∙10−10 | 17.6 |
| Na+ | 21 | 4.4∙10−10 | 18.1 | |
| Cs+ | 16 | 8.3∙10−10 | 16.5 | |
| Chloride aqueous solution | Li+ | 24 | (8.2 ± 0.3)10−10 | 17.1 ± 0.5 |
| Na+ | 21 | (1.1 ± 0.2)10−9 | 18.3 ± 0.6 | |
| Cs+ | 16 | (1.7 ± 0.2)10−9 | 16.8 ± 0.6 |
| Ionic Form | Water Amount Per Sulfonated Group λ | Hydration Number h | Cation Self-Diffusion Coefficient Ds, m2/s | Calculated Ionic Conductivity, σc S/cm | Measured Ionic Conductivity, σe S/cm |
|---|---|---|---|---|---|
| Li+ | 12 | 5.0 ± 1.0 | (1.5 ± 0.1)10−10 | (1.6 ± 0.1)10−2 | (1.3 ± 0.1)10−2 |
| Na+ | 10 | 6.0 ± 1.0 | (2.0 ± 0.3)10−10 | (2.0 ± 0.3)10−2 | (1.1 ± 0.1)10−2 |
| Cs+ | 4 | 1.0 ± 0.2 | (0.6 ± 0.2)10−10 | (6.0 ± 0.2)10−3 | (2.3 ± 0.3)10−3 |
| RH, % | 95 | 75 | 58 | 32 | ||||
|---|---|---|---|---|---|---|---|---|
| Ionic Form | Ea, kJ/mol | σexp mS/cm | Ea, kJ/mol | σexp mS/cm | Ea, kJ/mol | σexp mS/cm | Ea, kJ/mol | σexp mS/cm |
| H | 4.3 | 7.8 | 11 | 6.0 | 12 | 3.0 | 23 | 0.600 |
| Li | 7.5 | 1.9 | 30 | 0.5 | 39 | 0.2 | 52 | 0.008 |
| Na | 26.0 | 3.4 | 31 | 0.7 | 40 | 0.2 | 68 | 0.010 |
| Cs | 17.0 | 4.6 | 32 | 0.8 | 37 | 0.3 | 60 | 0.020 |
| Membrane | DH2O·10−10/m2∙s−1 | DEtOH·10−10/m2∙s−1 | α |
|---|---|---|---|
| MF-4SC | 6.0 | 1.500 | 48 |
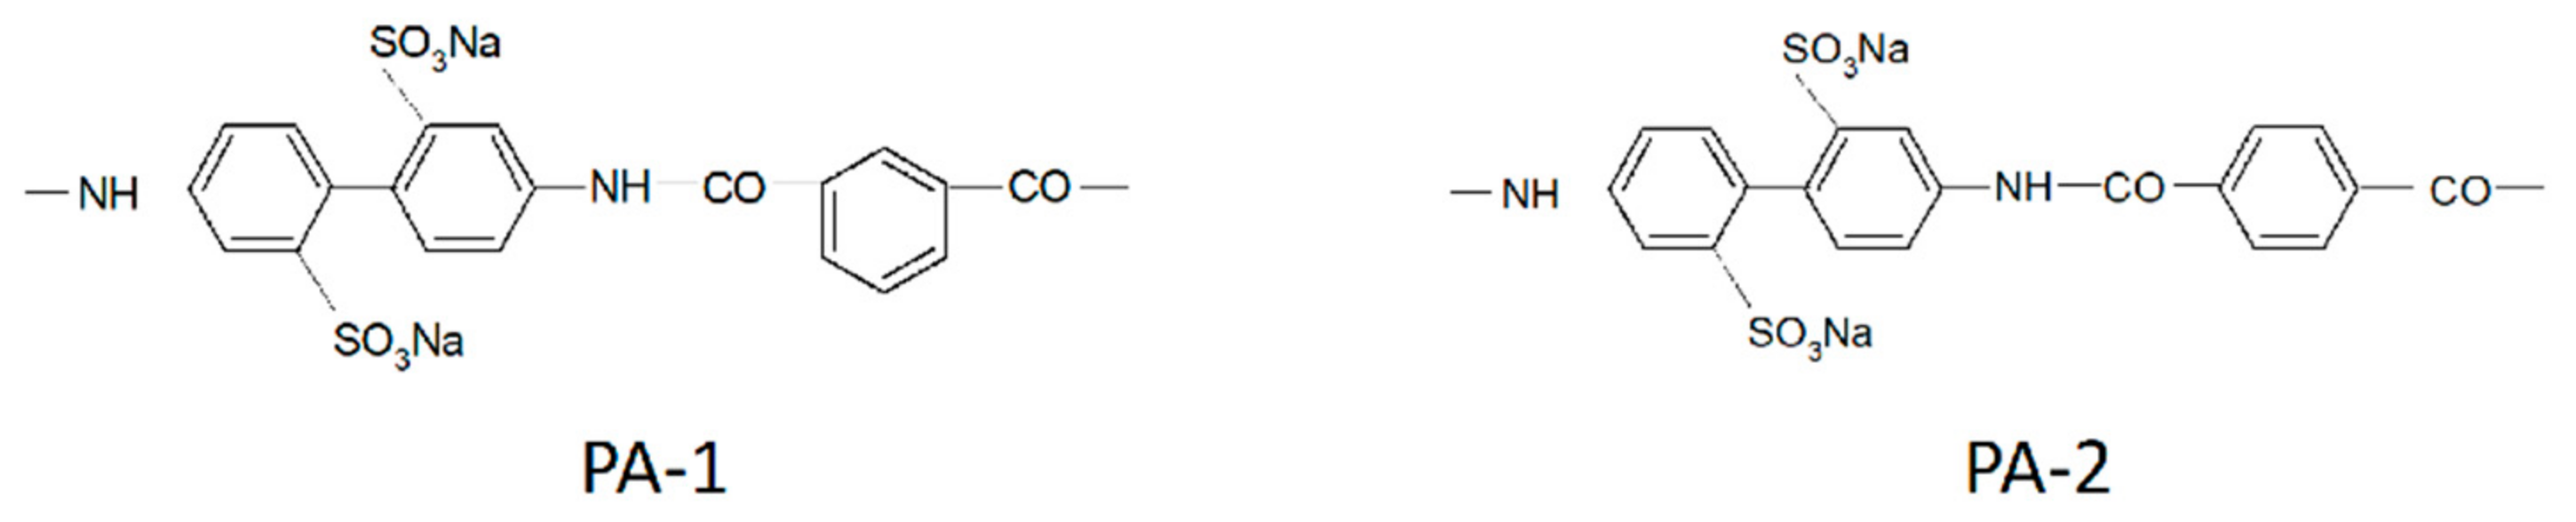
| PA-1 | 0.6 | 0.150 | 60 |
| PA-2 | 40.0 | 0.100 | 10,000 |
| PAA—PSF | 1.3 | 0.026 | 800 |
| Compound | Aqueous Solution | RBCs Suspension | |||
|---|---|---|---|---|---|
| Ds1w·1010, m2/s | Ds2w·1011, m2/s | Ds1s·1010, m2/s | Ds2s·1011, m2/s | Ds3s·1012, m2/s | |
| 1 | 4.1 ± 0.4 | 7.4 ± 0.7 | 5.5 ± 0.8 | 3.9 ± 0.6 | 5.5 ± 0.8 |
| 2 | 4.3 ± 0.8 | 7.5 ± 1.5 | 7.1 ± 1.4 | 4.4 ± 0.9 | 5.0 ± 1.0 |
| 3 | 1.2 ± 0.1 | 4.9 ± 0.5 | 8.0 ± 1.0 | 3.8 ± 0.6 | 6.0 ± 1.0 |
| Compound | Ds3s·1012, m2/s | p3(0) | τ, ms |
|---|---|---|---|
| 1 | 5.5 ± 0.8 | 0.33 | 440 ± 70 |
| 2 | 5.0 ± 1.0 | 0.13 | 470 ± 70 |
| 3 | 6.0 ± 1.0 | 0.06 | 1200 ± 300 |
Publisher’s Note: MDPI stays neutral with regard to jurisdictional claims in published maps and institutional affiliations. |
© 2021 by the authors. Licensee MDPI, Basel, Switzerland. This article is an open access article distributed under the terms and conditions of the Creative Commons Attribution (CC BY) license (https://creativecommons.org/licenses/by/4.0/).
Share and Cite
Volkov, V.I.; Chernyak, A.V.; Avilova, I.A.; Slesarenko, N.A.; Melnikova, D.L.; Skirda, V.D. Molecular and Ionic Diffusion in Ion Exchange Membranes and Biological Systems (Cells and Proteins) Studied by NMR. Membranes 2021, 11, 385. https://doi.org/10.3390/membranes11060385
Volkov VI, Chernyak AV, Avilova IA, Slesarenko NA, Melnikova DL, Skirda VD. Molecular and Ionic Diffusion in Ion Exchange Membranes and Biological Systems (Cells and Proteins) Studied by NMR. Membranes. 2021; 11(6):385. https://doi.org/10.3390/membranes11060385
Chicago/Turabian StyleVolkov, Vitaliy I., Alexander V. Chernyak, Irina A. Avilova, Nikita A. Slesarenko, Daria L. Melnikova, and Vladimir D. Skirda. 2021. "Molecular and Ionic Diffusion in Ion Exchange Membranes and Biological Systems (Cells and Proteins) Studied by NMR" Membranes 11, no. 6: 385. https://doi.org/10.3390/membranes11060385
APA StyleVolkov, V. I., Chernyak, A. V., Avilova, I. A., Slesarenko, N. A., Melnikova, D. L., & Skirda, V. D. (2021). Molecular and Ionic Diffusion in Ion Exchange Membranes and Biological Systems (Cells and Proteins) Studied by NMR. Membranes, 11(6), 385. https://doi.org/10.3390/membranes11060385