
Applicability of a Combined DAF-MF Process to Respond to Changes in Reservoir Water Quality through a Two-Year Pilot Plant Operation

 ,
,
Abstract
:1. Introduction
2. Materials and Methods
2.1. Raw Water Quality
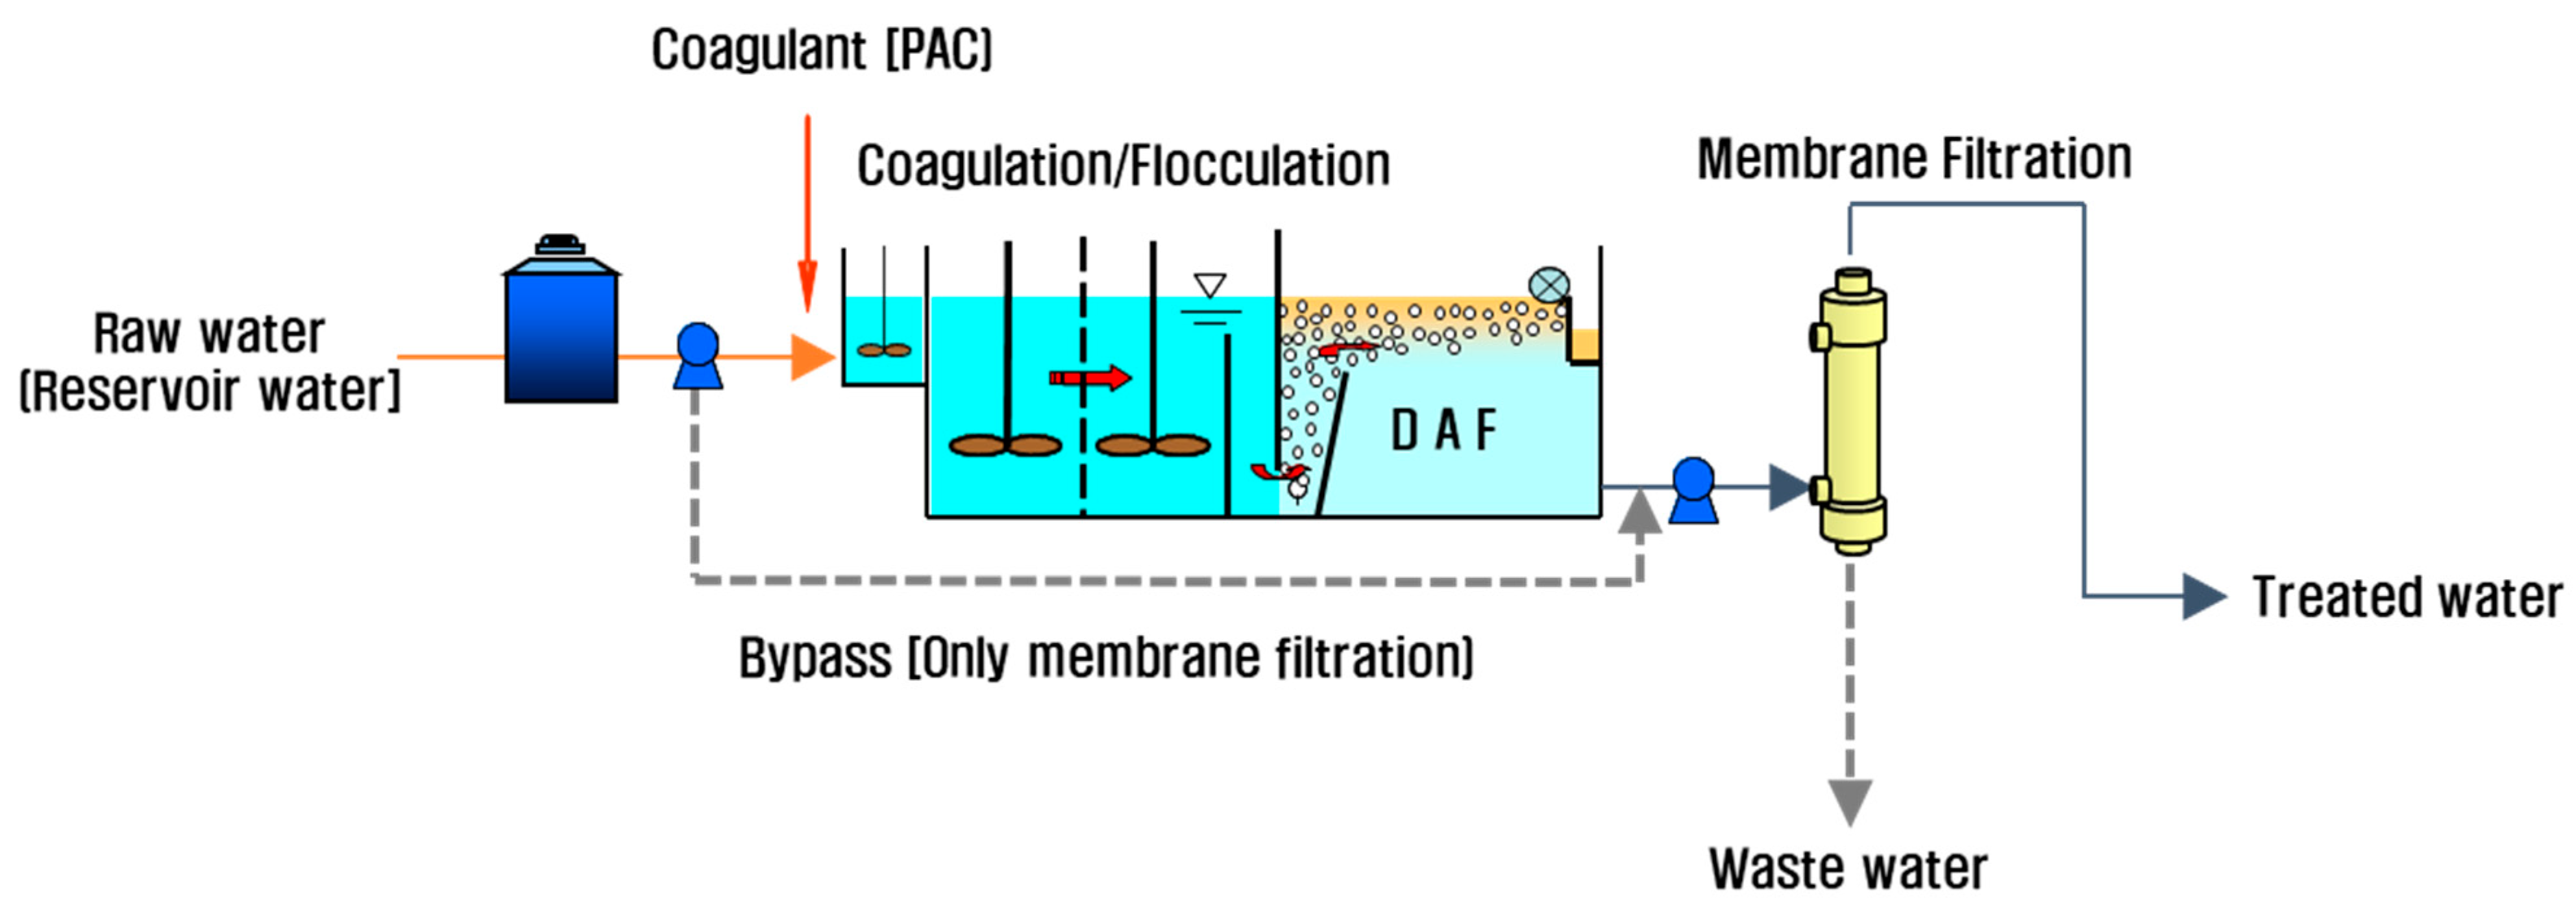
2.2. DAF-MF Combined Process
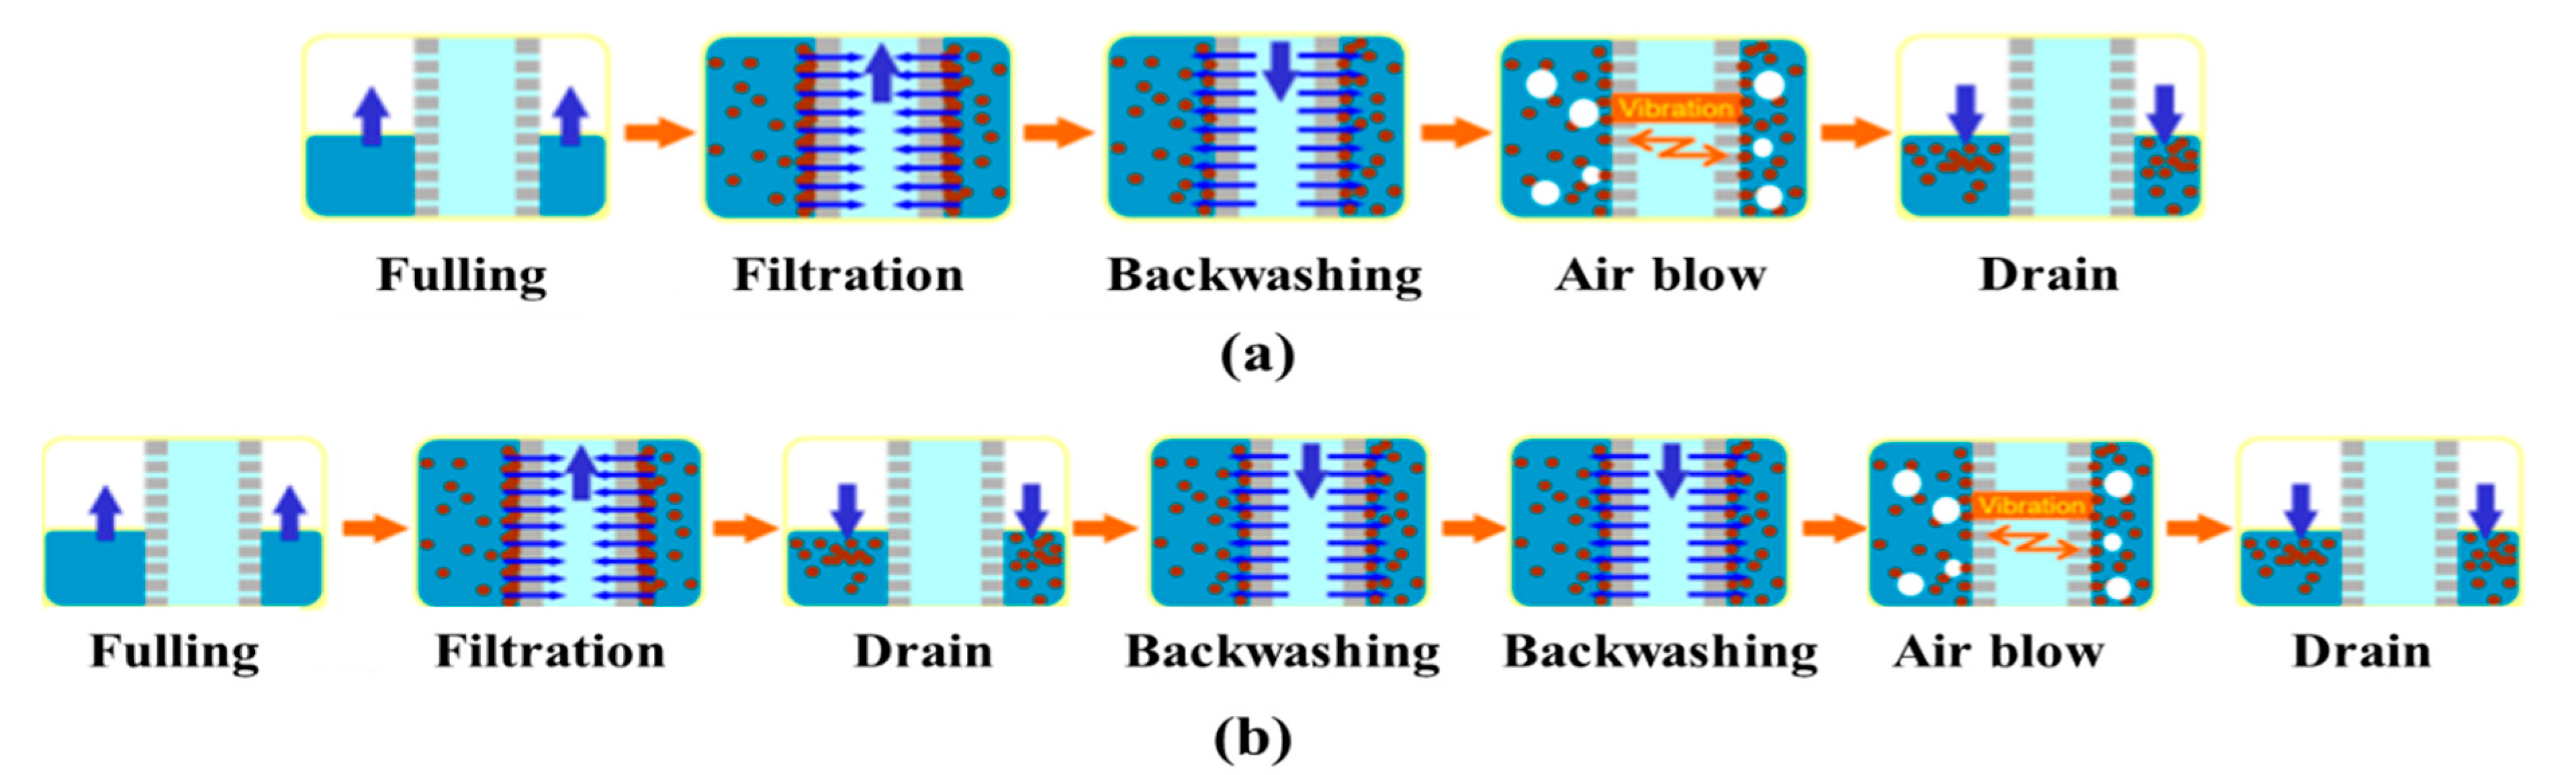
2.3. Operation and Maintenance of MF System
2.4. Analytic Measurements
2.5. Determination of MF Process Performance
3. Results and Discussion
3.1. Performance of MF-Alone Process for Low-Turbidity Raw Water
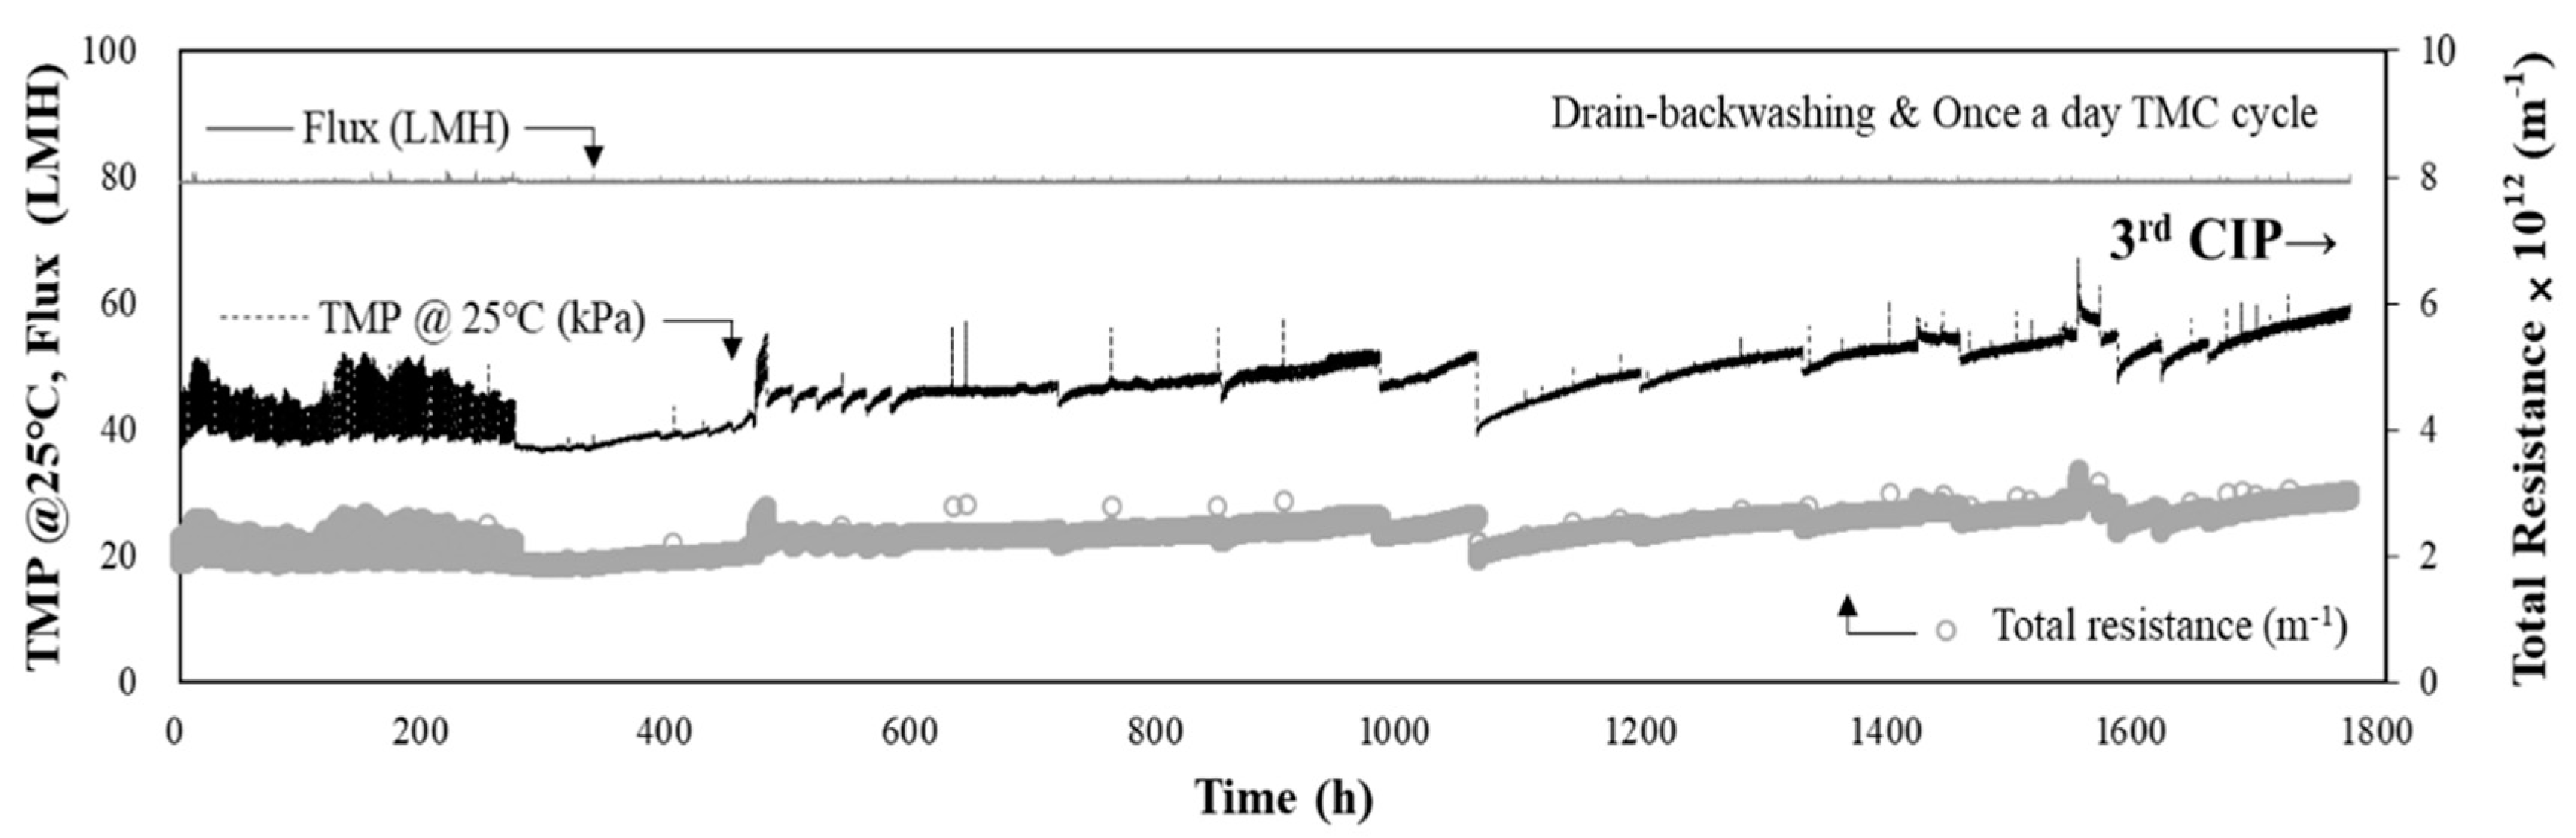
3.2. Performance of MF-Alone Process for High-Turbidity Raw Water
3.3. Performance of DAF-MF Combined Process for High-Turbidity Raw Water
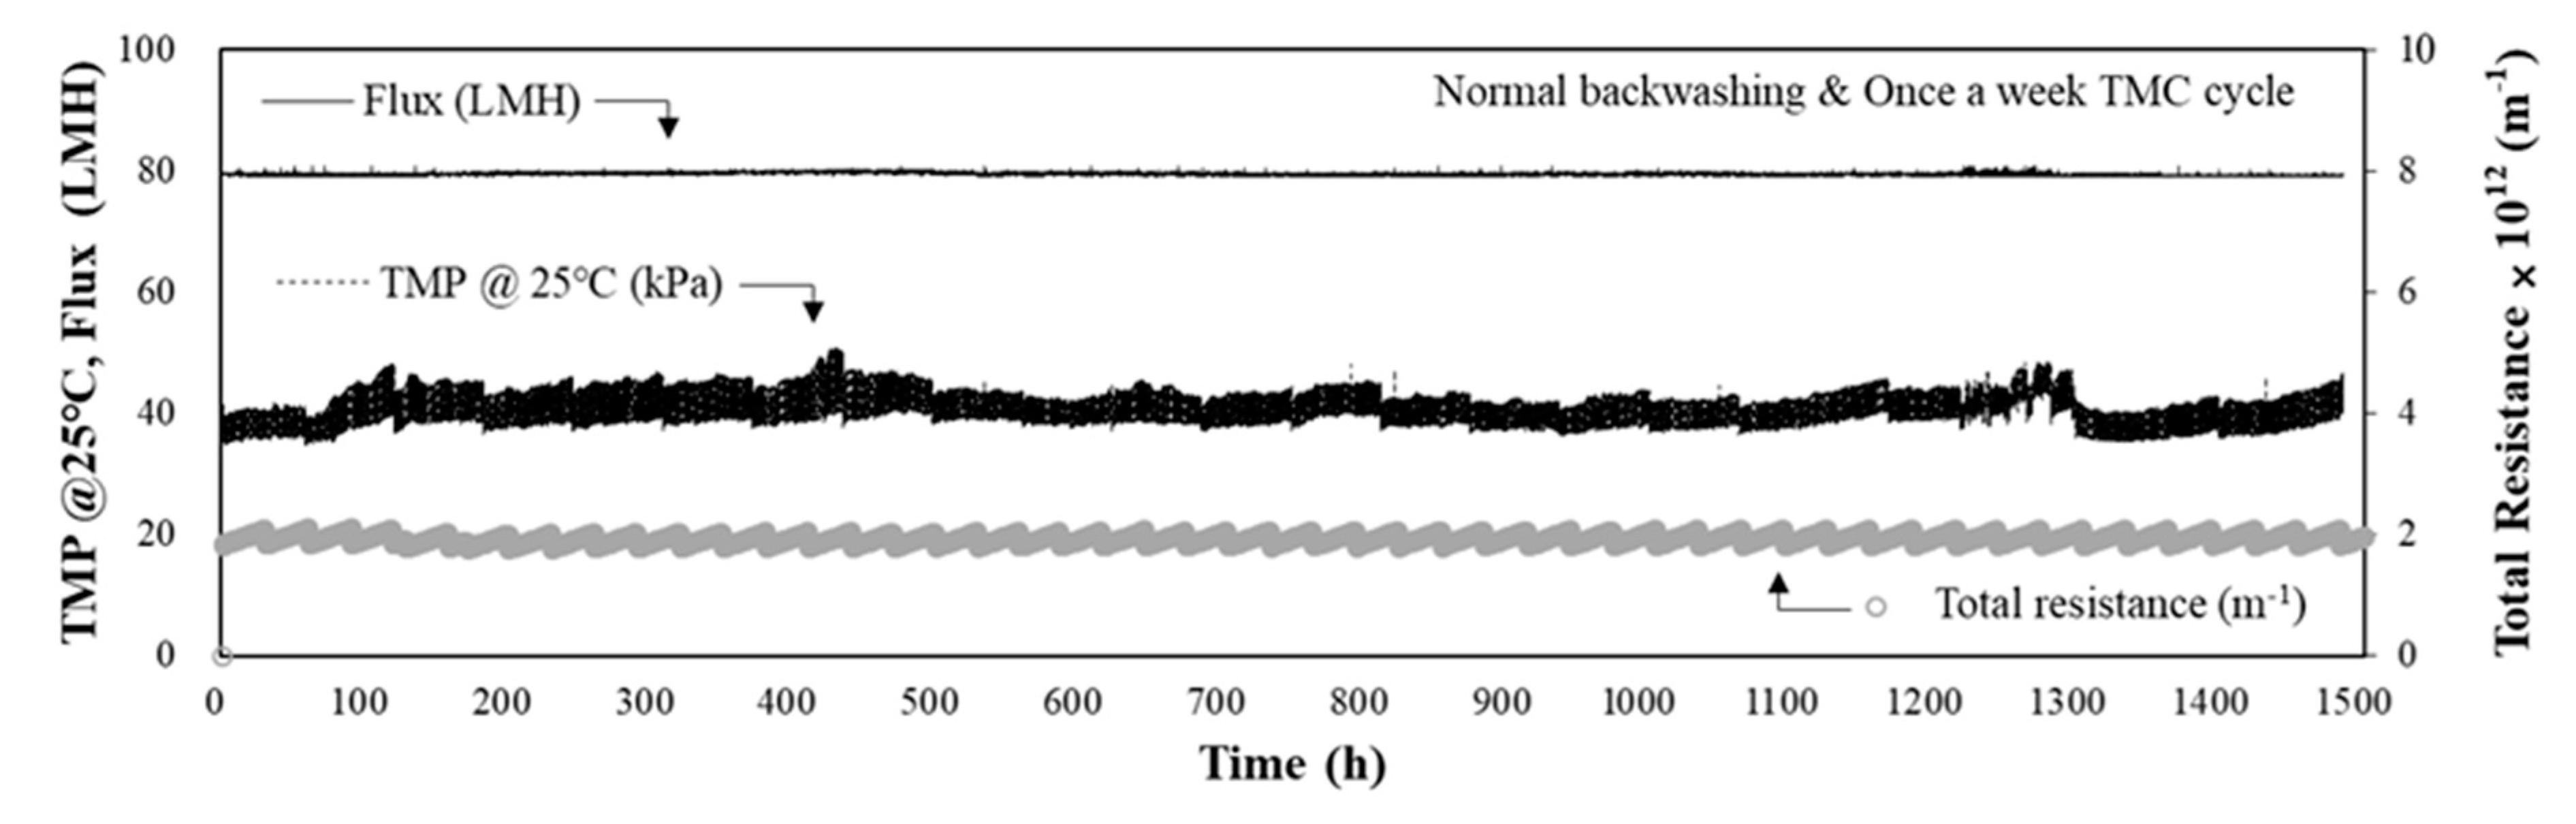
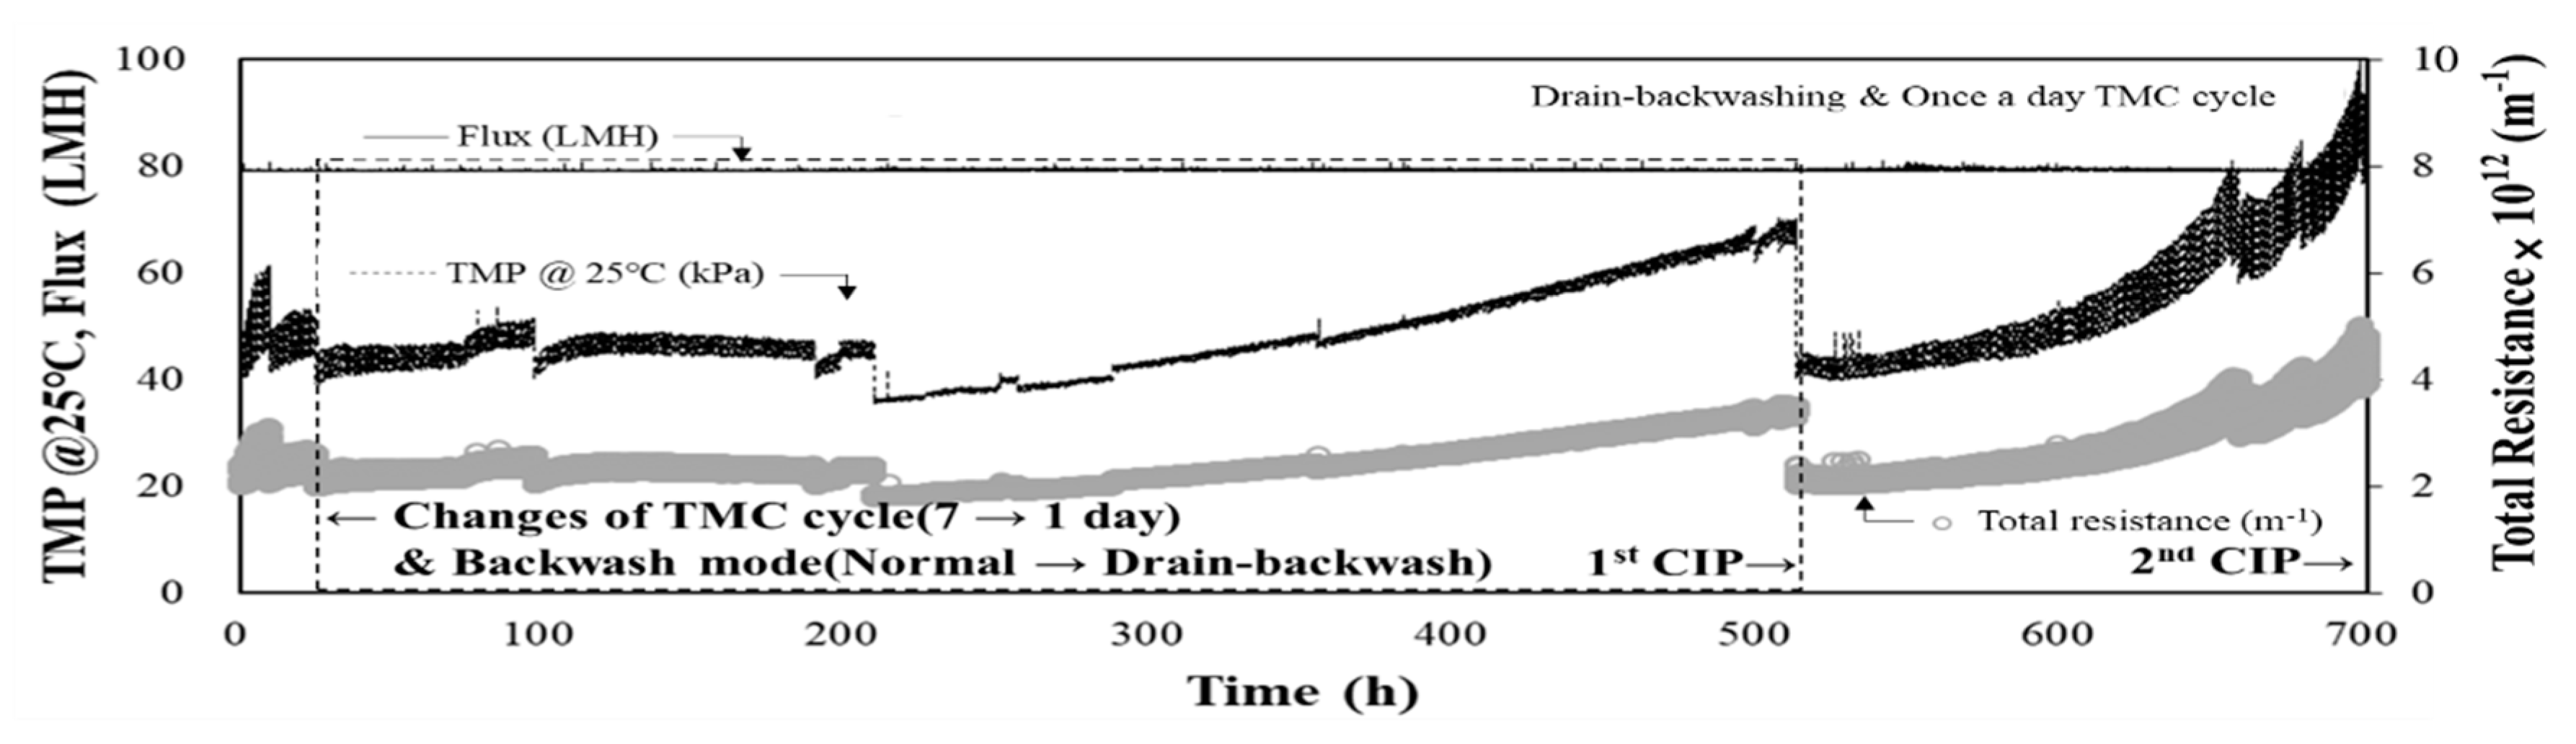
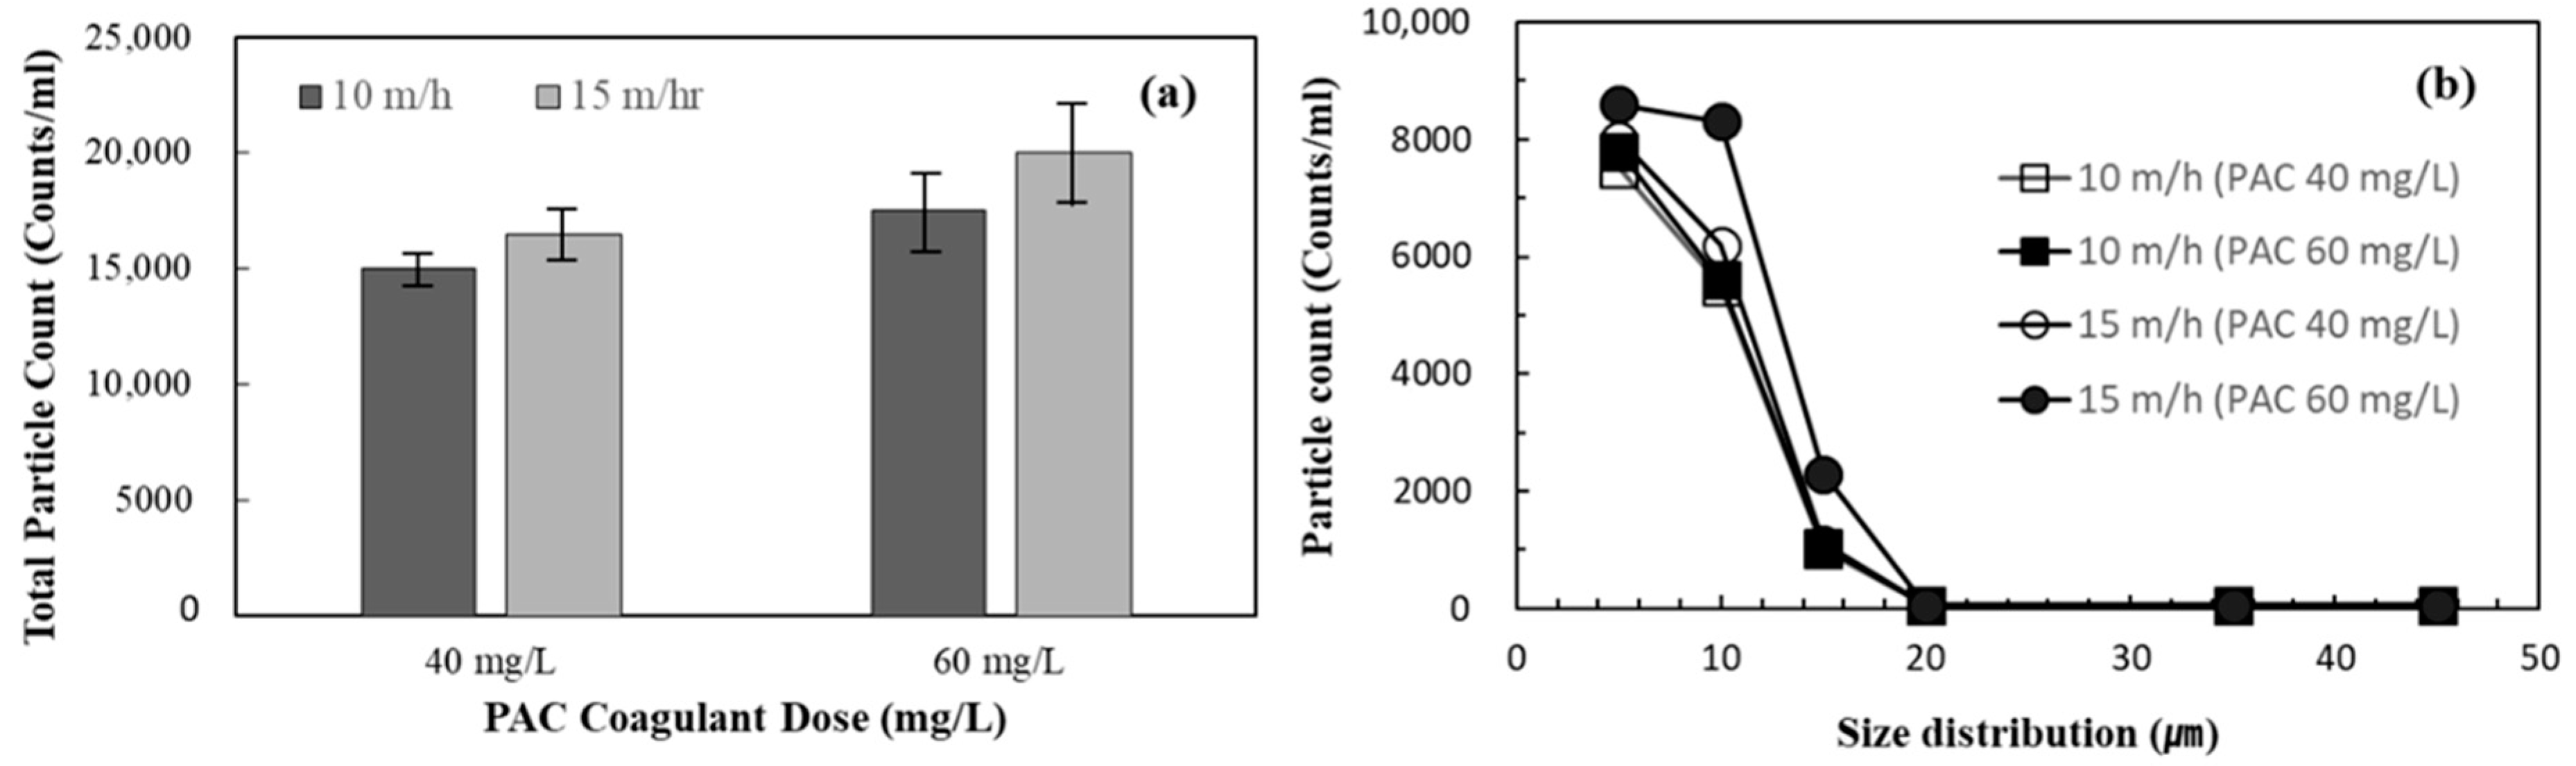
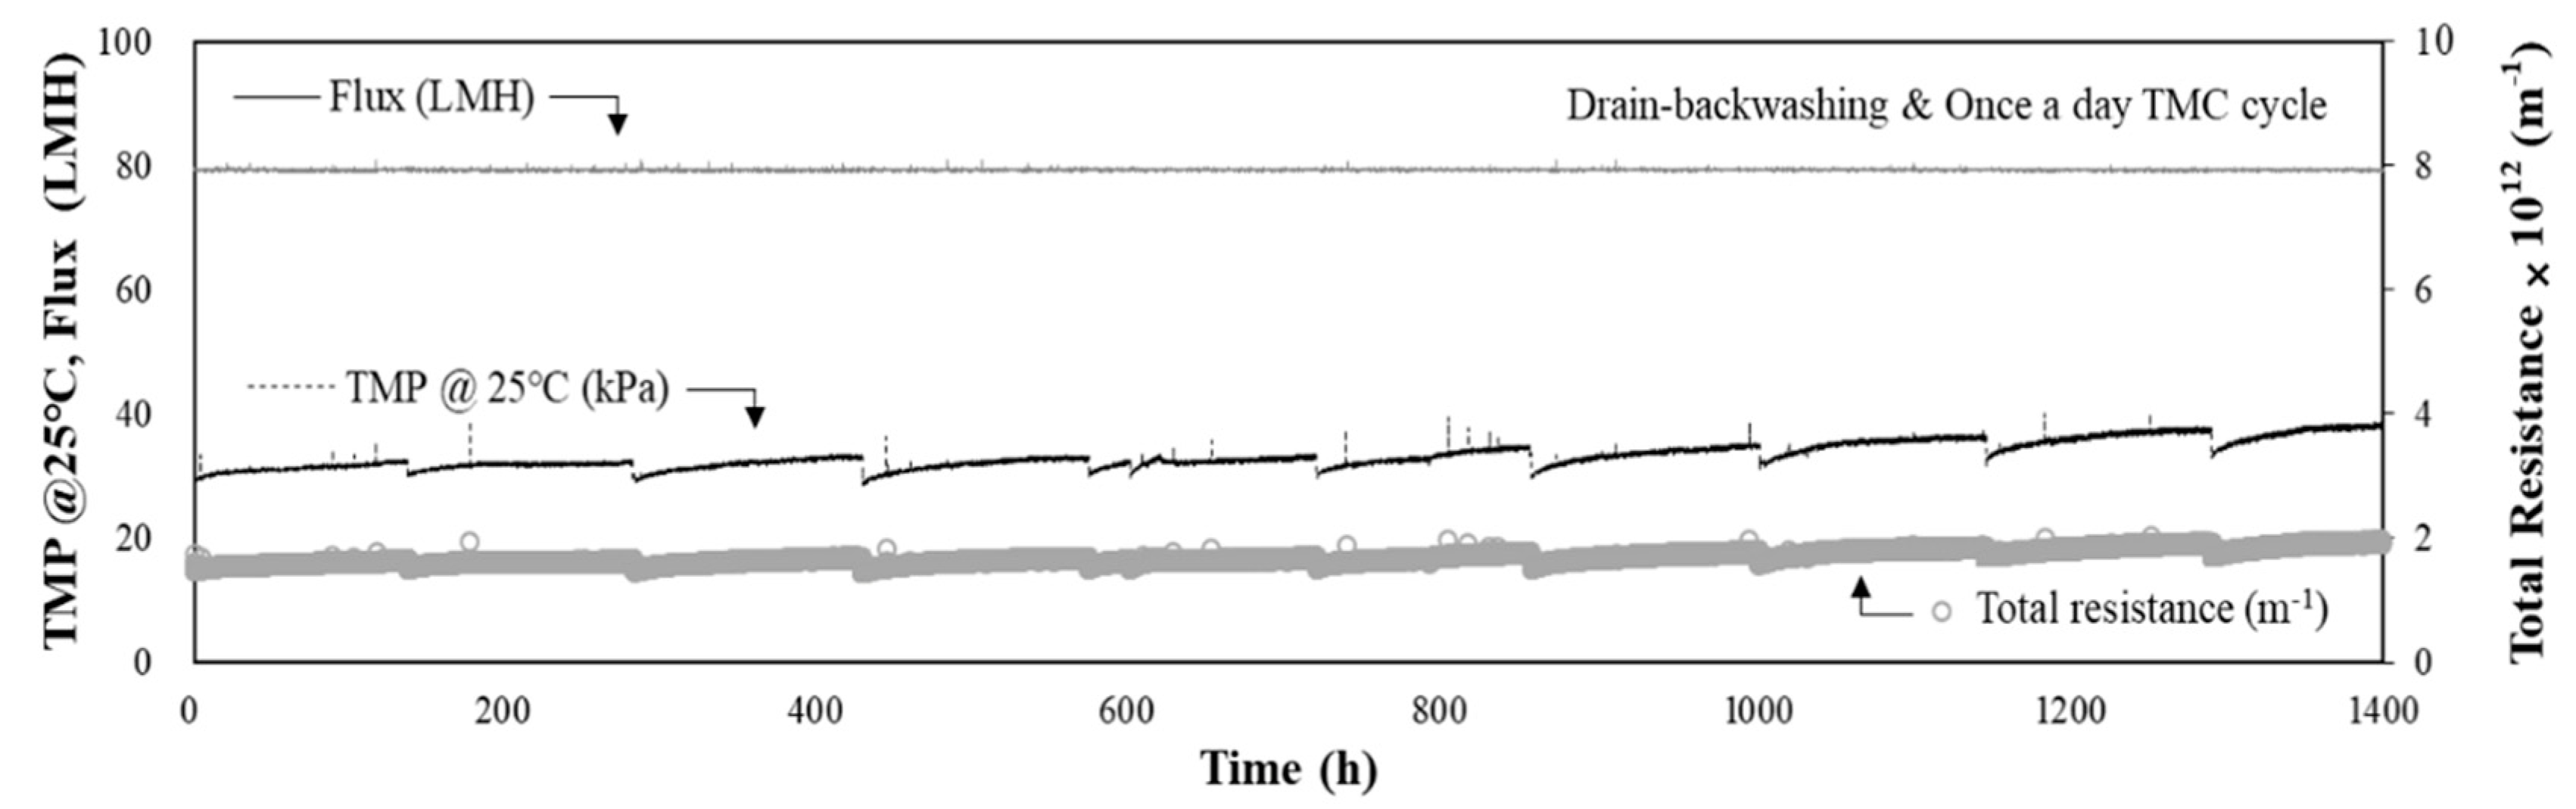
3.4. Performance of DAF-MF Combined Process after Optimising DAF Operating Conditions
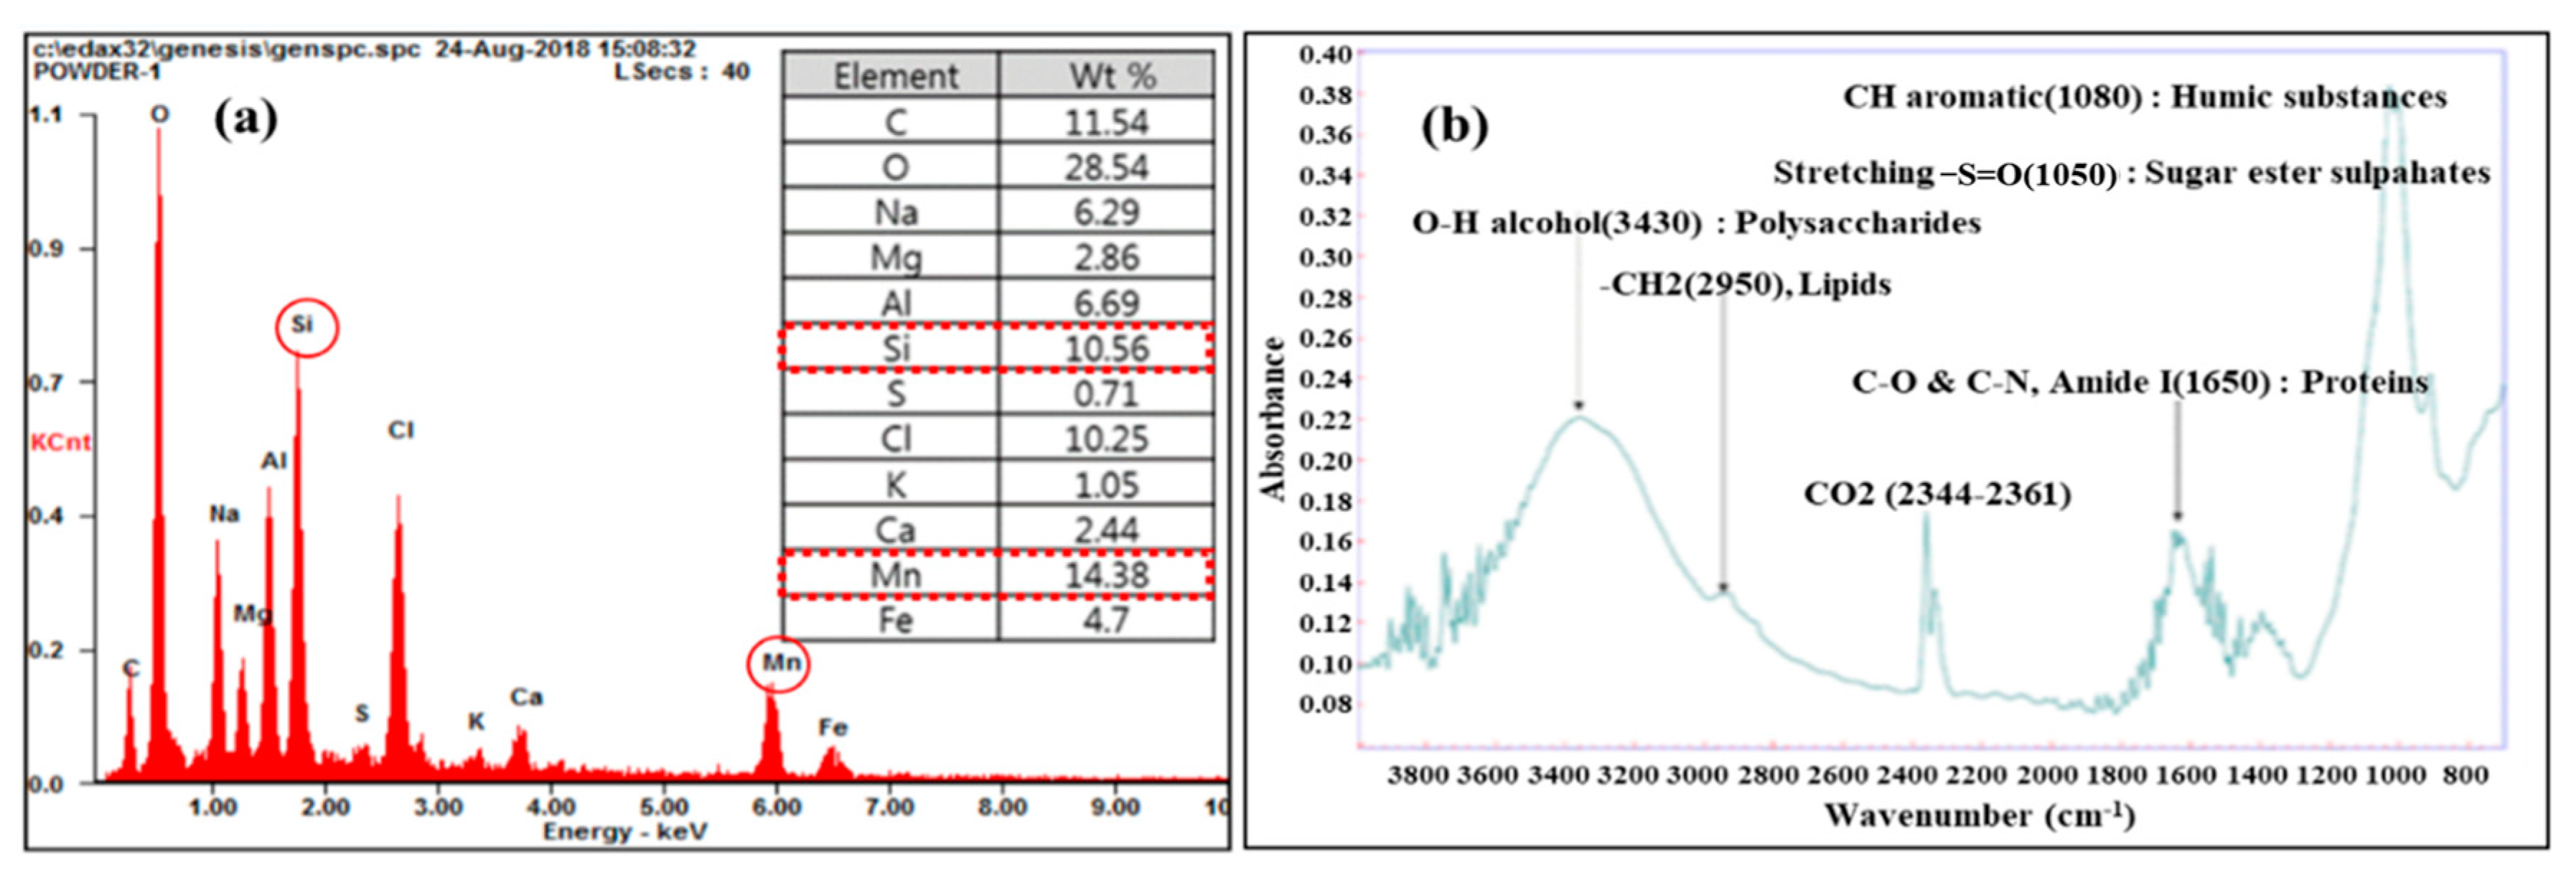
3.5. Water Quality Analysis and CIP Results
4. Conclusions
Author Contributions
Funding
Institutional Review Board Statement
Informed Consent Statement
Data Availability Statement
Conflicts of Interest
References
- Guigui, C.; Rouch, J.C.; Durand-Bourlier, L.; Bonnelye, V.; Aptel, P. Impact of coagulation conditions on the in-line coagulation/UF process for drinking water production. Desalination 2002, 147, 95–100. [Google Scholar] [CrossRef]
- Lee, Y.T.; Oh, J.K. A study on the Optimization of Process and Operation Condition for Membrane System in Tap Water Treatment. J. KOR. Korean Membr. 1999, 9, 193–201. [Google Scholar]
- Lee, B.G.; Lee, K.S.; Lee, K.K.; Kang, S.H. Characteristics of Long Term Period MF Membrane Pilot Plant Operation for Replacement of Sand Filtration. Korean Soc. Water Environ. 2007, B-3, 163–171. [Google Scholar]
- James, C.V.; Mark, A.T.; Uday, G.K. The use of membrane filtration in conjunction with coagulation processes for improved NOM removal. Desalination 1995, 102, 57–61. [Google Scholar]
- Lee, B.H.; Kim, J.G.; Lee, K.H. Membrane Fouling by Iron and Manganese in Hollow-fiber Microfiltration. J. KSCE 2000, 7, 591–597. [Google Scholar]
- Ministry of Environment. The Study for Applicability Evaluation and the Developmental Direction of Membrane Water Treatment Facilities; Ministry of Environment Report: Sejong, Korea, 2014.
- Kang, J.S.; Park, S.G.; Song, J.Y.; Jeong, A.Y.; Lee, J.J.; Kim, H.S. Evaluation of membrane fouling characteristics due to manganese and chemical cleaning efficiency in microfiltration membrane process. J. KSWW 2017, 31, 539–549. [Google Scholar] [CrossRef]
- Lee, S.H.; Kweon, J.H.; Choi, Y.H.; Ahn, K.H. Effects of characterisitics of Flocculent Aggregates on Membrane Fouling in Microfiltration with Coagulation Pretreatment. J. KSWW 2004, 18, 785–793. [Google Scholar]
- Lee, J.D.; Lee, S.H.; Jo, M.H.; Park, P.K.; Lee, C.H.; Kwak, J.W. Effect of Coagulation Conditions on Membrane Filtration characteristics in Coagulation-Microfiltration Process for Water Treatment. Environ. Sci. Technol. 2000, 34, 3780–3788. [Google Scholar] [CrossRef]
- Kim, J.H.; Mun, B.S.; Jang, H.J.; Kim, J.H.; Kim, B.S. Increase of Recovery Ratio by Two Stage Membrane Process (the Pressurized PVDF Membrane Followed by Submerged PE Membrane). Membr. J. 2013, 23, 45–53. [Google Scholar]
- Gregroy, J.; Duan, J. Hydrolysing metal salts as coagulants. Pure Appl. Chem. 2001, 73, 2017–2026. [Google Scholar] [CrossRef] [Green Version]
- Jin, Y.C.; Choi, Y.H.; Kweon, J.H. Impact of Characteristics of Polymeric Al Coagulants PACl and Alum on Membrane Flux and Fouling of Microfiltration. J. KSWW 2011, 25, 231–240. [Google Scholar]
- Pernitsky, D.J.; Edzwald, J.K. Solubility of polyaluminuium coagulants. J. Water Supply AQUA 2003, 52, 395–406. [Google Scholar] [CrossRef]
- Song, Y.K.; Jung, C.W.; Hwangbo, B.H.; Shon, I.S. Characteristics of Al(lll) Hydrolysis Species Distribution on Coagulation Process. Korean Chem. Eng. Res. 2001, 44, 547–554. [Google Scholar]
- Jung, C.W.; Shim, H.S.; Sohn, I.S. Effect of Metal Salt Coagulant on Membrane Fouling During Coagulation-UF Membrane Process. Korean Chem. Eng. Res. 2007, 45, 523–528. [Google Scholar]
- Gregory, J. Colloidal interactions. Mater. Sci. Forum 1998, 25–26, 125–144. [Google Scholar]
- Filho, J.A.; Azevedo, A.; Etchepare, R.; Rubio, J. Removal of sulfate ions by dissolved air flotation (DAF) following precipitation and flocculation. Int. J. Miner. Process 2016, 149, 1–8. [Google Scholar] [CrossRef]
- Jeong, I.G.; Yi, M.J.; Zhao, H.; Dockko, S. Characteristics of DBPs reduction of AOM by dissolved air flotation. Desalin. Water Treat. 2015, 54, 1436–1444. [Google Scholar] [CrossRef]
- Maeng, M.S.; Shahi, N.K.; Shin, G.Y.; Son, H.J.; Kwak, D.H.; Dockko, S. Formation characteristics of carbonaceous and nitrogenous disinfection by-products depending on residual organic compunds by CGS and DAF. Environ. Sci. Pollut. Res. 2018, 26, 34008–34017. [Google Scholar] [CrossRef] [PubMed]
- Oh, H.S.; Kang, S.H.; Nam, S.H.; Kim, S.H.; Hwang, T.M. CFD modeling of cyclonic-DAF (dissolved air flotation) reactor for algae removal. Eng. Sci. Technol. Int. J. 2019, 22, 477–481. [Google Scholar]
- Amato, T.; Park, K.; Yim, W.; Kim, T. SWRO pre-treatment design using high-rate dissolved air flotation including preliminary plot-scale result. Desalin. Water Treat. 2013, 51, 1804–1816. [Google Scholar] [CrossRef]
- Fernanda, C.P.; Rocha, E.S.; Nathalia, M.P.; Rocha, E.S.; Juliana, M.L.; Raquel, D.R.; Valdemir, A.S.; Leonie, A.S. Dissolved air flotation combined to biosurfactants: A clean and efficient alternative to treat industrial oily water. Rev. Environ. Sci. Biotechnol. 2018, 17, 591–602. [Google Scholar]
- Kim, Y.W.; Lee, J.H.; Park, T.J.; Byun, I.G. Variatio of water environment and algae occurrence characteristics after weirs construction at Mulgeum site in downstream of the Nakdong river. J. Korean Soc. Hazard Mitig. 2017, 17, 383–392. [Google Scholar] [CrossRef]
- Yulia, S.; Barun, L.K.; Adam, C.H.; Belinda, L.; Rita, K.H.; Pierre, L.C. Enhancing organic matter removal in desalination pretreatment systems by application of dissolved air flotation. Desalination 2016, 383, 12–21. [Google Scholar]
- Korea Environment Corporation. Development of Membrane Filtration Water Treatment Facility Technical Inspection Manual; Korea Environment Corporation Report: Incheon, Korea, 2017. [Google Scholar]
- Pauline, A.; Pera, D.A.; Lucila, A.C.; Maria, E.N.-H.; Tiago, J.B.; Flavio, R.L. Association of dissolved air floatation(DAF) with microfiltration for cyanobacterial removal in water supply. Desalin. Water Treat. 2013, 51, 1664–1671. [Google Scholar]
- Lu, L.; Chettiyappan, V. Membraen technology for surface water treatment: Advancement from microfiltration to membrane bioreactor. Rev. Environ. Sci. Biotechnol. 2017, 16, 737–760. [Google Scholar]
- Braghetta, A.; Jacangelo, J.G.; Chellam, S.; Hotaling, M.L.; Utne, B.A. DAF pretreatment: Its effect on MF performance. Am. Water Works Assoc. 1997, 89, 90–101. [Google Scholar] [CrossRef]
- Ahn, C.H.; Lee, S.; Park, J.R.; Hwang, T.M.; Joo, J.C. Harvested Microalgal Biomass from Different Water Treatment Facilities-Its Characteristics and Potential Use as Renewable Sources of Plant Biostimulation. Agronomy 2020, 10, 1882. [Google Scholar] [CrossRef]
- Kang, J.S.; Park, S.G.; Lee, J.J.; Kim, H.S. Effects of membrane fouling formation by feed water quality and membrane flux in water treatment process using ceramic membrane. J. KSWW 2018, 32, 77–87. [Google Scholar] [CrossRef]
- Ha, G.R.; Kim, H.S.; Oh, Y.G.; Kim, C.H.; Quang, C.X.; Tam, P.T.T.; Lee, Y.H. Determination of Optimal Coagulant dosage in Pre-coagulation/Submerged MF For Reducing Membrane Fouling. J. KSAE 2007, 2007, 2087–2091. [Google Scholar]
- Choi, Y.H.; Kweon, J.H. Investigation of Membrane Fouling in Microfiltration by Characterization of Flocculent Aggregates. J. KSEE 2005, 28, 337–344. [Google Scholar]
- Her, N.; Amy, G.; Park, H.-R.; Myoungsuk, S. Characterizing algogenic organic matter (AOM) and evaluating associated NF membrane fouling. Water Res. 2004, 38, 1427–1438. [Google Scholar] [CrossRef] [PubMed]
- Lee, N.; Amy, G.; CrouÈ, J.-P. Low-pressure membrane (MF/UF) fouling associated with allochthonous versus autochthonous natural organic matter. Water Res. 2006, 40, 2357–2368. [Google Scholar] [CrossRef] [PubMed]


| Water Quality | Membrane Feed Water | ||
|---|---|---|---|
| Raw Water (w/o DAF) | DAF Effluent | ||
| Turbidity (NTU) | Average | 5.62 | <1.0 |
| Maximum | 83.0 | 2.60 | |
| Minimum | 1.35 | 0.22 | |
| DOC (mg/L) | Average | 3.06 | 1.80 |
| Maximum | 4.86 | 2.67 | |
| Minimum | 2.31 | 1.55 | |
| Mn (mg/L) | Average | 0.07 | 0.02 |
| Maximum | 0.24 | 0.06 | |
| Minimum | 0.01 | 0.01 | |
| Chl-a (mg/m3) | Average | 5.82 | 0.00 |
| Maximum | 23.5 | 0.00 | |
| Minimum | 0.57 | 0.00 | |
| Parameters | Specifications | |
|---|---|---|
| Model | HFU-2020N | 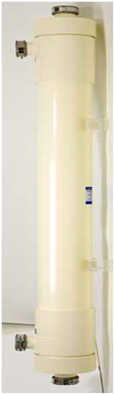 |
| Membrane type | Microfiltration | |
| Certifications | KWWA F 106 | |
| Module type | Outside-In | |
| Filtration type | Dead-end/Crossflow | |
| Permeate turbidity | Less than 0.05 NTU | |
| Membrane dimension (mm) | In 1.4 / Out 0.8 | |
| Module dimension (mm) | Ø216 X L2,160 | |
| Material | PVDF | |
| Module material | PVC | |
| Nominal pore size (μm) | 0.01 | |
| Membrane surface area (m2) | 72 | |
| Max. Operating pressure (kPa) | 300 | |
| Max. Operating TMP (kPa) | 300 | |
| Max. Temperature (°C) | 40 | |
| Adhesive | Polyurethane | |
| Manufactory | TORAY Advanced Materials Korea Inc. |
| Process | Parameter | Conditions |
|---|---|---|
| Filtration/air blowing/backwashing | Flux (LMH) | 40~100 |
| Backwashing (X flow flux, m3/m2·d) | 1.1~1.5 | |
| Air blow flow rate (N m3/h) | 6~8 | |
| Filtration time (min) | 20~60 | |
| Backwashing time (s) | 30~60 | |
| Air blow time (s) | 30~60 | |
| Toray maintenance cleaning (TMC) | NaOCl concentration(mg/L) | 300~500 |
| Submerged time (min) | 20~60 | |
| Period cycle (day) | 1~7 | |
| Clean-in-place (CIP) | 1500 mg/L, H2SO4 | 2 h |
| 1500 mg/L, NaOCl | 2 h | |
| 3000 mg/L, H2SO4 | 2 h |
| CIP Condition | TMP Recovery (%) | Al (mg/L) | Mn (mg/L) | Si (mg/L) | Ca (mg/L) | DOC (mg/L) | |
|---|---|---|---|---|---|---|---|
| 2nd CIP | 3000 mg/L NaOCl | 64.6 | 4.0 | 3.7 | 1.1 | 16 | 112 |
| 1500 mg/L H2SO4 | 2.9 | 12 | 9.4 | 1.2 | 78 | 10.8 | |
| 1% citric acid | 32.1 | 19 | 147 | 0.5 | 47 | - | |
| 3rd CIP | 1500 mg/L H2SO4 | 36.4 | 42 | 1.8 | 15 | 27 | 6.5 |
| 3000 mg/L NaOCl | 39.7 | 45 | 0.8 | 17 | 29 | 91 | |
| 1500 mg/L H2SO4 | 23.9 | 2.1 | 0.29 | 1.4 | 4.9 | 8.3 |
Publisher’s Note: MDPI stays neutral with regard to jurisdictional claims in published maps and institutional affiliations. |
© 2021 by the authors. Licensee MDPI, Basel, Switzerland. This article is an open access article distributed under the terms and conditions of the Creative Commons Attribution (CC BY) license (https://creativecommons.org/licenses/by/4.0/).
Share and Cite
Kang, J.-s.; Seong, J.; Yoo, J.; Kim, P.; Park, K.; Lee, J.; Cheon, J.; Kim, H.; Lee, S. Applicability of a Combined DAF-MF Process to Respond to Changes in Reservoir Water Quality through a Two-Year Pilot Plant Operation. Membranes 2021, 11, 964. https://doi.org/10.3390/membranes11120964
Kang J-s, Seong J, Yoo J, Kim P, Park K, Lee J, Cheon J, Kim H, Lee S. Applicability of a Combined DAF-MF Process to Respond to Changes in Reservoir Water Quality through a Two-Year Pilot Plant Operation. Membranes. 2021; 11(12):964. https://doi.org/10.3390/membranes11120964
Chicago/Turabian StyleKang, Joon-seok, Jayeong Seong, Jewan Yoo, Pooreum Kim, Kitae Park, Jaekyu Lee, Jihoon Cheon, Hyungsoo Kim, and Sangyoup Lee. 2021. "Applicability of a Combined DAF-MF Process to Respond to Changes in Reservoir Water Quality through a Two-Year Pilot Plant Operation" Membranes 11, no. 12: 964. https://doi.org/10.3390/membranes11120964
APA StyleKang, J.-s., Seong, J., Yoo, J., Kim, P., Park, K., Lee, J., Cheon, J., Kim, H., & Lee, S. (2021). Applicability of a Combined DAF-MF Process to Respond to Changes in Reservoir Water Quality through a Two-Year Pilot Plant Operation. Membranes, 11(12), 964. https://doi.org/10.3390/membranes11120964