Article

Dynamic Landscape of Extracellular Vesicle-Associated Proteins Is Related to Treatment Response of Patients with Metastatic Breast Cancer

1
Sarcoma Molecular Pathology Team, Institute of Cancer Research, Sutton SW7 3RP, UK
2
Department of Otorhinolaryngology, Head and Neck Surgery, Chinese University of Hong Kong, Hong Kong
3
School of Biomedical Sciences and Pharmacy, College of Health, Medicine and Wellbeing, University of Newcastle, Callaghan, NSW 2308, Australia
4
Hunter Medical Research Institute, Cancer Research Program, New Lambton Heights, NSW 2305, Australia
5
Exosome Biology Laboratory, Centre for Clinical Diagnostics, UQ Centre for Clinical Research, Royal Brisbane and Women’s Hospital, University of Queensland, Brisbane, QLD 4072, Australia
6
Departamento de Investigación, Postgrado y Educación Continua (DIPEC), Facultad de Ciencias de la Salud, Universidad del Alba, Santiago 8320000, Chile
7
Fiona Stanley Hospital, Perth, WA 6009, Australia
8
School of Medicine, University of Western Australia, Perth, WA 6009, Australia
9
Reproductive Science Group, College of Engineering, Science and Environment, University of Newcastle, Newcastle, NSW 2308, Australia
*
Author to whom correspondence should be addressed.
These authors contributed equally to this manuscript.
Membranes 2021, 11(11), 880; https://doi.org/10.3390/membranes11110880
Submission received: 7 September 2021 / Revised: 9 November 2021 / Accepted: 11 November 2021 / Published: 16 November 2021

Abstract

:
Breast cancer is the leading cause of cancer death in women. The majority of these deaths are due to disease metastasis, in which cancer cells disseminate to multiple organs and disrupt vital physiological functions. It is widely accepted that breast cancer cells secrete extracellular vesicles (EVs), which contain dynamic molecular cargo that act as versatile mediators of intercellular communication. Therefore, Evs. secreted by breast cancer cells could be involved in the development of metastatic disease and resistance to treatment. Moreover, changes in EV cargo could reflect the effects of therapy on their parent tumor cells. The aim of this feasibility study was to quantitatively profile the proteomes of Evs. isolated from blood samples taken from treatment sensitive and resistant metastatic breast cancer patients to identify proteins associated with responses. Three serial blood samples were collected from three patients with metastatic breast cancer receiving systemic therapy including a responder, a non-responder, and a mixed-responder. Evs. were isolated from plasma using size exclusion chromatography and their protein cargo was prepared for tandem mass tag (TMT)-labelling and quantitative analyses using two-dimensional high-performance liquid chromatography followed by tandem mass spectrometry. After filtering, we quantitatively identified 286 proteins with high confidence using a q value of 0.05. Of these, 149 were classified as EV associated candidate proteins and 137 as classical, high abundant plasma proteins. After comparing EV protein abundance between the responder and non-responder, we identified 35 proteins with unique de-regulated abundance patterns that was conserved at multiple time points. We propose that this proof-of-concept approach can be used to identify proteins which have potential as predictors of metastatic breast cancer response to treatment.

1. Introduction

Breast cancer is the most commonly diagnosed cancer and leading cause of cancer death in women [1]. This incidence is predicted to increase over the next decade, particularly in developed nations where there is a prevalence of breast cancer risk factors attributed to lifestyle [2,3]. Most cases of breast cancer are detected in earlier stages due to screening. However, up to 30% of these patients will experience metastatic relapse [4]. While meaningful improvements in survival have been seen thanks to the introduction of newer systemic therapies, metastatic breast cancer remains a largely incurable disease [4]. Up to 90% of breast cancer-associated deaths are related to metastatic disease, which is thought to be a result of disrupted physiological function in multiple organs due cancer cell dissemination [5].
The development of metastases is a complex process with multiple theories on its mechanism. One such theory is the invasion-metastasis cascade, a multi-step process whereby there is dissemination of cancer cells from primary tumors to distant tissues to form new tumor colonies [6]. This theory involves local invasion of primary tumor cells to the surrounding tissues, intravasation of cells into the circulatory system and survival during hematogenous spread, arrest and extravasation through vascular walls into the parenchyma of distant tissues, formation of micrometastatic colonies, and subsequent proliferation of microscopic colonies into apparent clinically detectable lesions [7]. Metastatic colonization is largely influenced by the microenvironment of the secondary organ, with certain organs producing soluble components that support metastatic behavior. Additionally, the primary tumor has the potential to “prime” or augment distant organ microenvironments to aid metastases. A large variety of soluble factors secreted by the primary tumor initiates priming [8,9]. These molecules target the bone marrow for recruitment and initiation of remodeling of the target secondary organ, creating a premature metastatic niche. Bone marrow derived cells and other immune regulatory cells are recruited to the secondary site by continual secretion of factors from the primary site. The immune-suppressed environment so created is conducive for cancer colonization. Some disseminated cancer cells may stay in a dormant state until conditions of the secondary site are compatible with supporting tumor outgrowth into micrometastases. Thereafter, tumor-secreted factors regulate the growth of micrometastases to macrometastases during a progressive state [8,9,10].
One such tumor-derived factor thought to be involved in the metastatic cascade are extracellular vesicles (EVs) [11,12,13]. Evs. are a population of small membranous vesicles released from cells, which carry a diverse array of proteins, lipids and nucleic acids [14]. Evs. can be transported to distant sites through the hemolymphatic system, where they can bring about physiological changes to recipient cells via unloading of their molecular cargo. In this manner, Evs. are known to play a significant role in tumor growth and progression, with several studies implicating EV-associated molecules in the process of metastasis [8,9]. In addition, Evs. have been linked to the resistance of breast cancer cells to treatment, which is another mechanism by which they can promote progression to metastatic disease [15]. As such, it stands to reason that changes in the EV cargo over time could reflect the response of tumors to therapy and hence investigations to characterize their molecular cargo could help to elucidate the mechanisms by which metastatic progression occurs. Accordingly, the aim of this proof-of-principle study was to quantitatively profile the proteomes of Evs. isolated from the plasma of three women with metastatic breast cancer throughout their treatment to identify EV-associated proteins that may be associated with therapeutic response.

2. Materials and Methods

2.1. Cohort

Participants with metastatic breast cancer were recruited at Sir Charles Gairdner Hospital, WA following ethical approval from the Human Research Ethics Committee (reference numbers SCGH HREC 2013-051 and 2013-222). Study participants provided written informed consent prior to study enrolment. Diagnoses were pathologically confirmed. Serial blood samples (20 mL) were collected at QEII, Pathwest laboratories from each patient at three different time points yielding in a total of nine plasma samples included for analysis. All samples were processed within 2 h of collection.

2.2. Extracellular Vesical Isolation

Whole blood from breast cancer patients was collected in EDTA Vacutainer® blood collection tubes (Becton Dickinson, Sydney, NSW, Australia) and processed within 2 h of collection. First, blood was centrifuged at 1600× g for 20 min. The plasma fraction was further clarified by centrifugation at 16,000× g for 10 min. Plasma (1 mL) was clarified once again by centrifugation at 10,000× g for 10 min and then diluted 1 in 4 with filtered PBS prior to loading onto a rinsed qEV column (Izon, Christchurch, New Zealand). Thirteen elution fractions of 500 µL were collected. Fractions 9 to 12 were pooled based on the presence of common EV markers CD9 and TSG101, as determined by Western blot. Ultracentrifugation was performed as per our previous studies [1,2].

2.3. Transmission Electron Microscopy

Evs. resuspended in PBS were fixed in 2% paraformaldehyde and transferred onto 200 mesh Formvar-carbon coated copper grids (ProSciTech, Brisbane, QLD, Australia). Samples were adsorbed for 20 min at RT prior to being washed twice in filtered PBS and four times in 50 mM glycine to quench free aldehyde groups. Samples were then blocked in 5% bovine serum albumin (BSA, Sigma, Sydney, NSW, Australia) for 10 min before being incubated with primary antibody solution (mouse anti-human CD9, clone MM2/57; 10 μg/mL, Merck, Perth, WA, Australia) for 30 min. Grids were then washed four times in 0.1% BSA and four times in 0.5% BSA before incubation with secondary antibody (goat anti-mouse IgG-gold conjugate, 1:24, Aurion, Wageningen, The Netherlands) for 20 min. Labelled samples were washed six times in PBS, fixed in 1% glutaraldehyde and washed six times in deionised water before counterstaining with 1% uranyl acetate. Following 2 min of counterstaining, grids were left overnight to dry. Grids were visualised on the JEOL JEM-2100 electron microscope (JEOL, Tokyo, Japan) at an operating voltage of 120 kV. Images were captured using an 11-megapixel Gatan Orius digital camera (Gatan, CA, USA).

2.4. Nanoparticle Tracking Analysis (NTA)

EV samples (100 μL) were diluted 1/1000 in PBS and injected into the analysis chamber of the NanoSight NS500 Instrument (Malvern Panalytical, Sydney, NSW, Australia) for particle size and concentration analysis. This instrument is equipped with a 405 nm laser and a sCMOS camera to detect the Brownian motion of light-scattering particles as they move through the solution. Sample analysis was performed at a camera level of 10 and gain of 250, with a detection threshold of 10 pixels. Settings for blur, minimum track length and minimum expected size were set to ‘auto’. Videos were recorded for 60 s at 30 frames/second in triplicate at 25 °C. All post-acquisition settings remained constant between samples. NTA software v3.0 was used to process and analyse the data. Each video was analysed to generate particle size (nm) distribution profiles and concentration values (particles/mL solution), which were downloaded as a report with the results of quality control analysis. The raw observational data was exported into Microsoft® Excel as a comma-separated values (CSV) file.

2.5. Western Blot

EV samples in 100 μL PBS were mixed with 100 μL of RIPA buffer (Sigma-Aldrich, Sydney, NSW, Australia) and protease inhibitors (Roche Diagnostics, Sydney, NSW, Australia) and incubated on ice for 1 h to lyse the vesicle membranes. EV proteins were collected by centrifugation at 16,000× g for 15 min. The EV proteins were diluted in 4× Laemmli Buffer (Bio-Rad, Sydney, NSW, Australia) for a final loading volume of 20 μL. Proteins were separated at 155V for 30 min on a Mini Protean® TGX 5–15% Stain-Free™ Precast Gel (Bio-Rad) using the Mini Protean® Tetra Cell (Bio-Rad, Sydney, NSW, Australia). Proteins were then transferred onto a Trans-Blot® Turbo™ Mini Nitrocellulose Membrane (Bio-Rad, Sydney, NSW, Australia) using the Trans-Blot® Turbo™ Transfer System (Bio-Rad, Sydney, NSW, Australia) at a constant voltage of 25V. The membrane was then probed for EV proteins using the iBind™ Flex Western Device (Thermo Fisher Scientific, Sydney, NSW, Australia), commencing with blocking for 20 min in iBind™ Flex Solution (Thermo Fisher Scientific, Sydney, NSW, Australia). Primary antibody solutions of mouse anti-human CD9 (clone MM2/57, Merck, Perth, WA, Australia), mouse anti-human Calnexin (clone 1563, Novus Biologicals, CO, USA), and rabbit anti-human TSG101 (clone EPR7130B, Abcam, Melbourne, VIC, Australia) were created, with dilutions of 1:250 and 1:500 for anti-CD9 and Calnexin/TSG101, respectively. Samples were incubated with primary antibody solution before being incubated with secondary antibodies (sheep anti-mouse IgG-HRP conjugate, 1:2000, GE Healthcare, Sydney, NSW, Australia; goat anti-rabbit IgG-HRP conjugate, 1:2000, Merck, Perth, WA, Australia) for a combined incubation time of 2.5 h. Signals were developed using Clarity™ Western ECL Blotting Substrates (Bio-Rad, Sydney, NSW, Australia) and were subsequently imaged using the ChemiDoc™ Touch Imaging System (Bio-Rad, Sydney, NSW, Australia). Images were processed using Image Lab™ software v6.0 (Bio-Rad, Sydney, NSW, Australia).

2.6. Extracellular Vesicle Protein Digestion and Labelling

EV protein preparations from three respective cases of metastatic breast cancer including a responder (n = 3 patients), a non-responder (n = 3), and a mixed responder (n = 3) were generated for analysis in this study. The proteins were precipitated with 4 volumes of cold acetone and incubated overnight at −20 °C. Precipitated proteins were centrifuged at 14,000× g for 15 min at 4 °C. Air dried protein pellets were prepared for MS by dissolving in 6 M urea and 2 M thiourea containing protease inhibitor cocktail (Sigma, Sydney, NSW, Australia) and phosphatase inhibitors (Roche, Sydney, NSW, Australia) [3]. The cysteine residues were reduced by adding 10 mM dithiothreitol (DTT) for 1 h at room temperature, and alkylated by adding 20 mM iodoacetamide (Sigma) for 1 h in the dark at room temperature. Proteins were then cleaved using 1:25 ratio Lys-C/trypsin (Promega) and incubated for 3 h at room temperature. The concentration of urea was then reduced below 0.75 M by adding 50 mM triethylammonium bicarbonate (TEAB, Sigma, Sydney, NSW, Australia), pH 7.8 and digested overnight at room temperature [4]. Lipid precipitation was achieved by centrifuging the acidified samples at 14,000× g for 10 min at room temperature, and further processed for trichloroacetic acid (TCA, Sigma, Sydney, NSW, Australia) precipitation. TCA precipitation of the remaining lipopeptides were then recombined with supernatant containing peptides before deglycosylation with PNGase F (New England Biolabs, MA, USA) and Glyko® Sialidase A (Agilent, Melbourne, Vic, Australia) [5]. Deglycosylation was performed overnight at 37 °C. Peptides were cleaned up using a modified StageTip microcolumn and solid phase extraction (SPE) columns (Oasis PRIME HLB, Waters, Rydalmere, NSW, Australia) [6]. Peptide concentrations were determined using a PierceTM quantitative fluorometric peptide assay (Thermo Fisher Scientific, Sydney, NSW, Australia). Peptides were dried by SpeedVac, and reconstituted in 50 mM TEAB pH 8. Reconstituted peptides were then processed according to the manufacturer’s protocol for tandem mass tag (TMT) 10 plex (Thermo Fisher Scientific, Sydney, NSW, Australia) for comparative and quantitative analyses (TMT 10 plex labels; mixed response patient time point 1 = 126, mixed response patient time point 2 = 127 N, mixed response patient time point 3 = 127 C, responder patient time point 1 = 128N, responder patient time point 2 = 128 C, responder patient time point 3 = 129 N, non-responder patient time point 1 = 129 C, non-responder patient time point 2 = 130 N, non-responder patient time point 3 = 130 C) [7]. Digestion and TMT labelling efficiency was determined by LC-MS/MS. Samples were then mixed in 1:1 ratio and fractionated by hydrophilic interaction chromatography (HILIC) using a Dionex UltiMate 3000 capLC system (Dionex, California, USA) prior to nanoLC-MS/MS.

2.7. Liquid Chromatography Tandem Mass Spectrometry Analysis

Hydrophilic interaction chromatography (HILIC) was performed on a Dionex UltiMate 3000 capLC system using a TSKgel Amide-80 HILIC columns packed with 3 μm particles (4.6 mm ID × 15 cm) (Tosoh Biosciences, Pennsylvania, USA) connected in line, with the following mobile phases: 0.1% TFA in HPLC water (solvent A) and 0.1% TFA in acetonitrile (Acn) (solvent B). Peptides were separated at a flow rate of 6 µL/min with a 35-min linear gradient from 98% to 25% solvent B. 14 fractions were collected into a deep 96-well LoBind plate (Eppendorf, Sydney, NSW, Australia), dried, and resuspended in 2% Acn containing 0.1% TFA [3,4,6]. HILIC fractionated peptides were then subjected to nanoflow LC instrument interfaced to a Q Exactive Plus Orbitrap mass spectrometer (Thermo Fisher Scientific, MA, USA), which is equipped with a nanoelectrospray ion source. Peptides were loaded onto a trapping column (Acclaim PepMapTM100, 75 µm × 2 cm, nanoViper fitting C18, 3 µm, 100 Å, Thermo Fisher Scientific, Sydney, NSW, Australia) for pre-concentration, and then resolved in the analytical column (EASY-Spray Column, PepMap, 75 µm × 15 cm, nanoviper fitting, C18, 2 µm, 100 Å, Thermo Fisher Scientific, MA, USA) for peptide separation. The separation of the peptides were achieved at a constant flow rate of 250 nL/min, using a linear gradient from 5% to 40% of solvent B (95% Acn, 0.1% TFA) over 95 min. Ions were generated by positive electrospray ionization via liquid junction into a Q Exactive mass spectrometer. Mass spectra were acquired over m/z 350–2000 at 70,000 resolution and data-dependent acquisition selected the top fifteen most abundant precursor ions for tandem mass spectrometry by HCD fragmentation, collision energy of 32.0, and a resolution of 35,000. A 1.4 m/z isolation window and a fixed first mass of 120 m/z was used for MS/MS scans. Automatic gain control targets were 3E6 ions for Orbitrap scans and 5E5 for MS/MS scans. Dynamic exclusion was set at 15 s, as well as rejection of precursor ions with charge state +1, +7 and greater than +8, were employed to minimize redundant MS/MS collection and maximize peptide identifications [3].

2.8. Data Analysis

The MS raw files were processed using Proteome Discoverer (PD) software (version 2.1, Thermo Fisher Scientific, Sydney, NSW, Australia). In the PD analysis, MS/MS spectra were search against the UniProt human protein database (73,653 sequences, updated 16 January 2019). The mass tolerance of precursor mass and fragment mass were set as 10 ppm and 0.02 Da respectively. S-carbamidomethylation of cysteine was set as a fixed modification; methionine oxidation, lysine acetylation, asparagine or glutamine deamidation and TMT labelling of amines and lysine were set as variable modifications. For digestion, trypsin was set as the digestion enzyme with two missed cleavage permitted. A fixed false discovery rate (FDR) was set at <1% for identification of peptides and proteins. Protein localisation and functions were interrogated using FunRich (version 3.1.3) and String (version 11.0) [8,9]. Principle components analysis and hierarchical clustering were performed using ClustVis [10].

3. Results

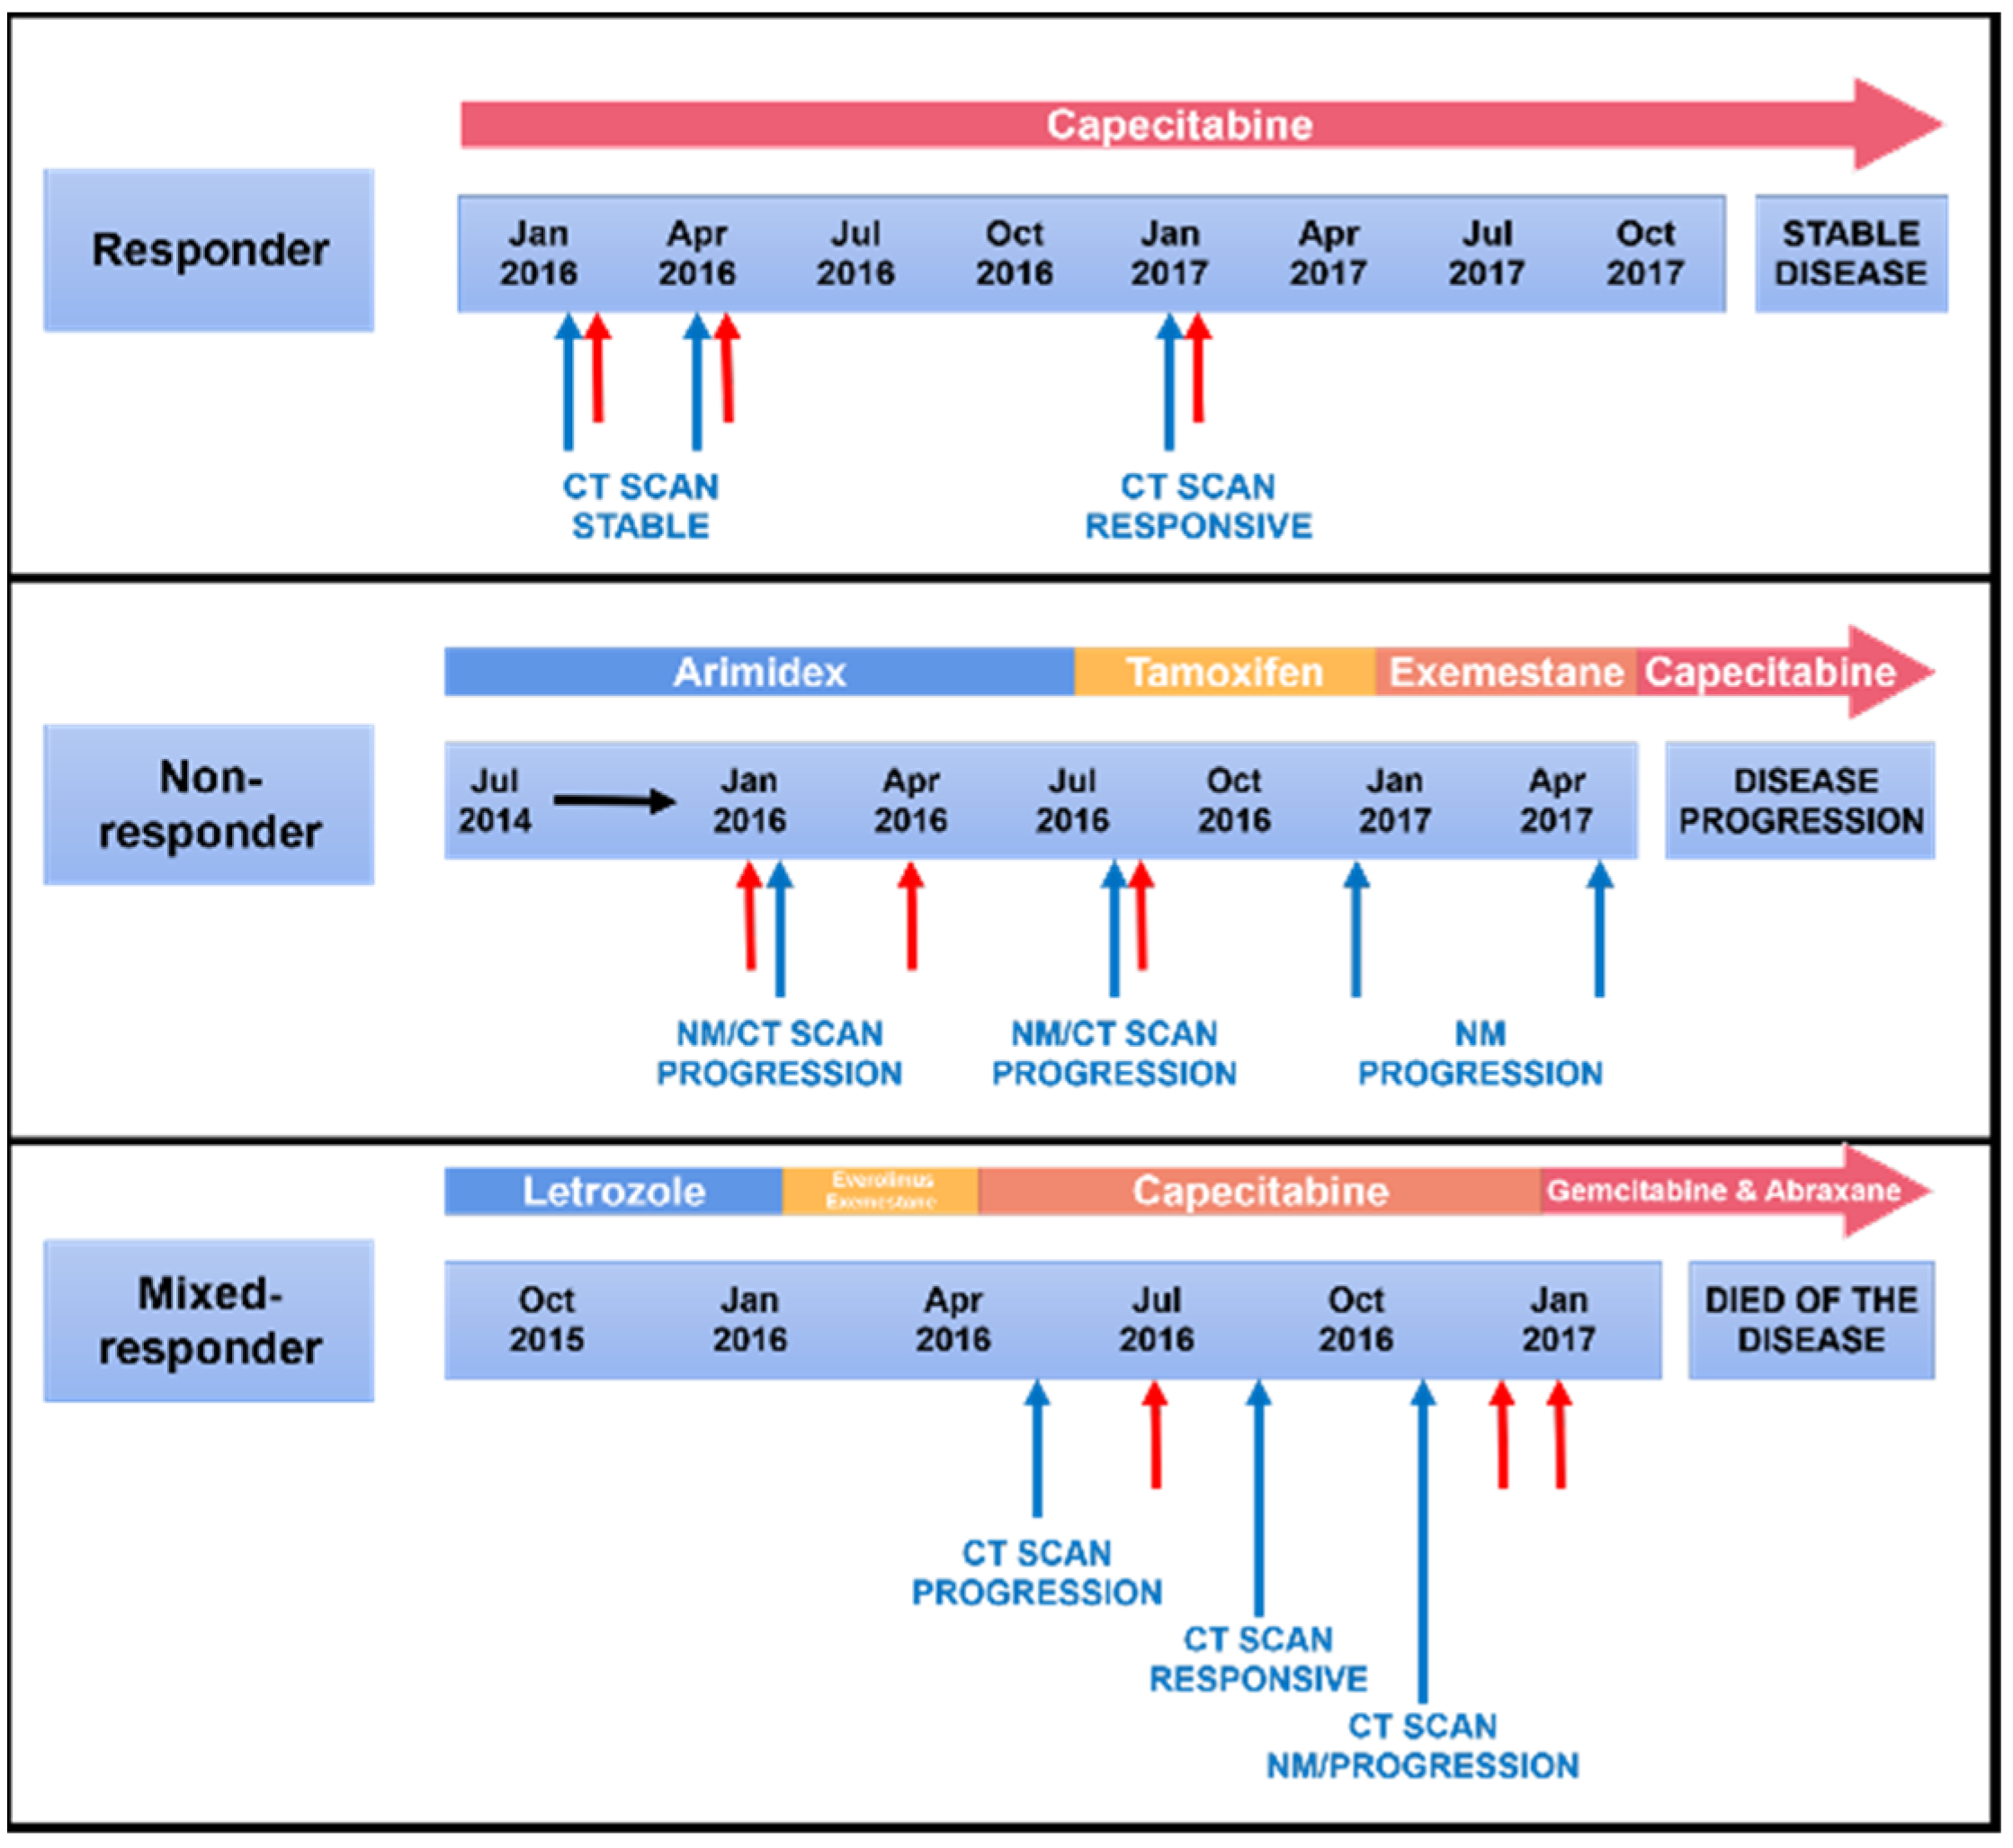
3.1. Patient and Clinical Characteristics

Evs. were isolated from the blood of three patients with metastatic breast cancer at three time points during treatment. Table 1 shows the clinical characteristics of the patients included in this study. Computerised tomography (CT) and nuclear medicine (NM) scans demonstrated the patients’ disease status (responding to treatment, stable disease or progressive disease as defined by RECIST 1.1 guidelines) at certain time points during treatment. Patients were classified as either a responder, non-responder or mixed responder according to their overall response to treatment during the study period. The time points of blood collection, scans, and treatment are shown in Figure 1. The responder was a 65-year-old female with stage IV ER+ and PR+ invasive ductal carcinoma (IDC). A CT scan performed in January 2016 indicated new metastatic disease after the patient had received a combination of adjuvant tamoxifen and capecitabine, which commenced in February 2016. A CT/NM scan in August 2016 and February 2017 showed stable disease and reduced metastases without new lesions, which suggested the patient had responded to the treatment. The non-responder was a 68-year-old female with stage IV ER+ and PR+ IDC, initially treated with anastrazole. A NM scan in February 2016 indicated stable bone metastasis but later in July of the same year, the metastases had expanded. Therefore, due to disease progression and rising cancer antigen 15.3 (a traditional serum marker for breast cancer monitoring), the treatment was changed to exemestane and everolimus. Unfortunately, CT/NM scans in both December 2016 and March 2017 showed an increase in size of primary tumour and enlarged nodules, which suggested the tumour had progressed further. The mixed responder was a 69-year-old female with stage IV ER+ and PR+ IDC. After three cycles of chemotherapy of capecitabine alone, a CT scan in June 2016 showed progressive metastatic disease. The patient received radiotherapy and a second CT scan was performed in September 2016, which revealed no residual disease within the thorax or abdomen. Bony metastases appeared generally more sclerotic and chemotherapy with gemcitabine and abraxane was commenced in December 2016. CT/NM scans in December 2016 showed progressive disease, illustrating that at the first time point of blood collection the patient had responded to the chemotherapy but then failed to respond to subsequent treatments.

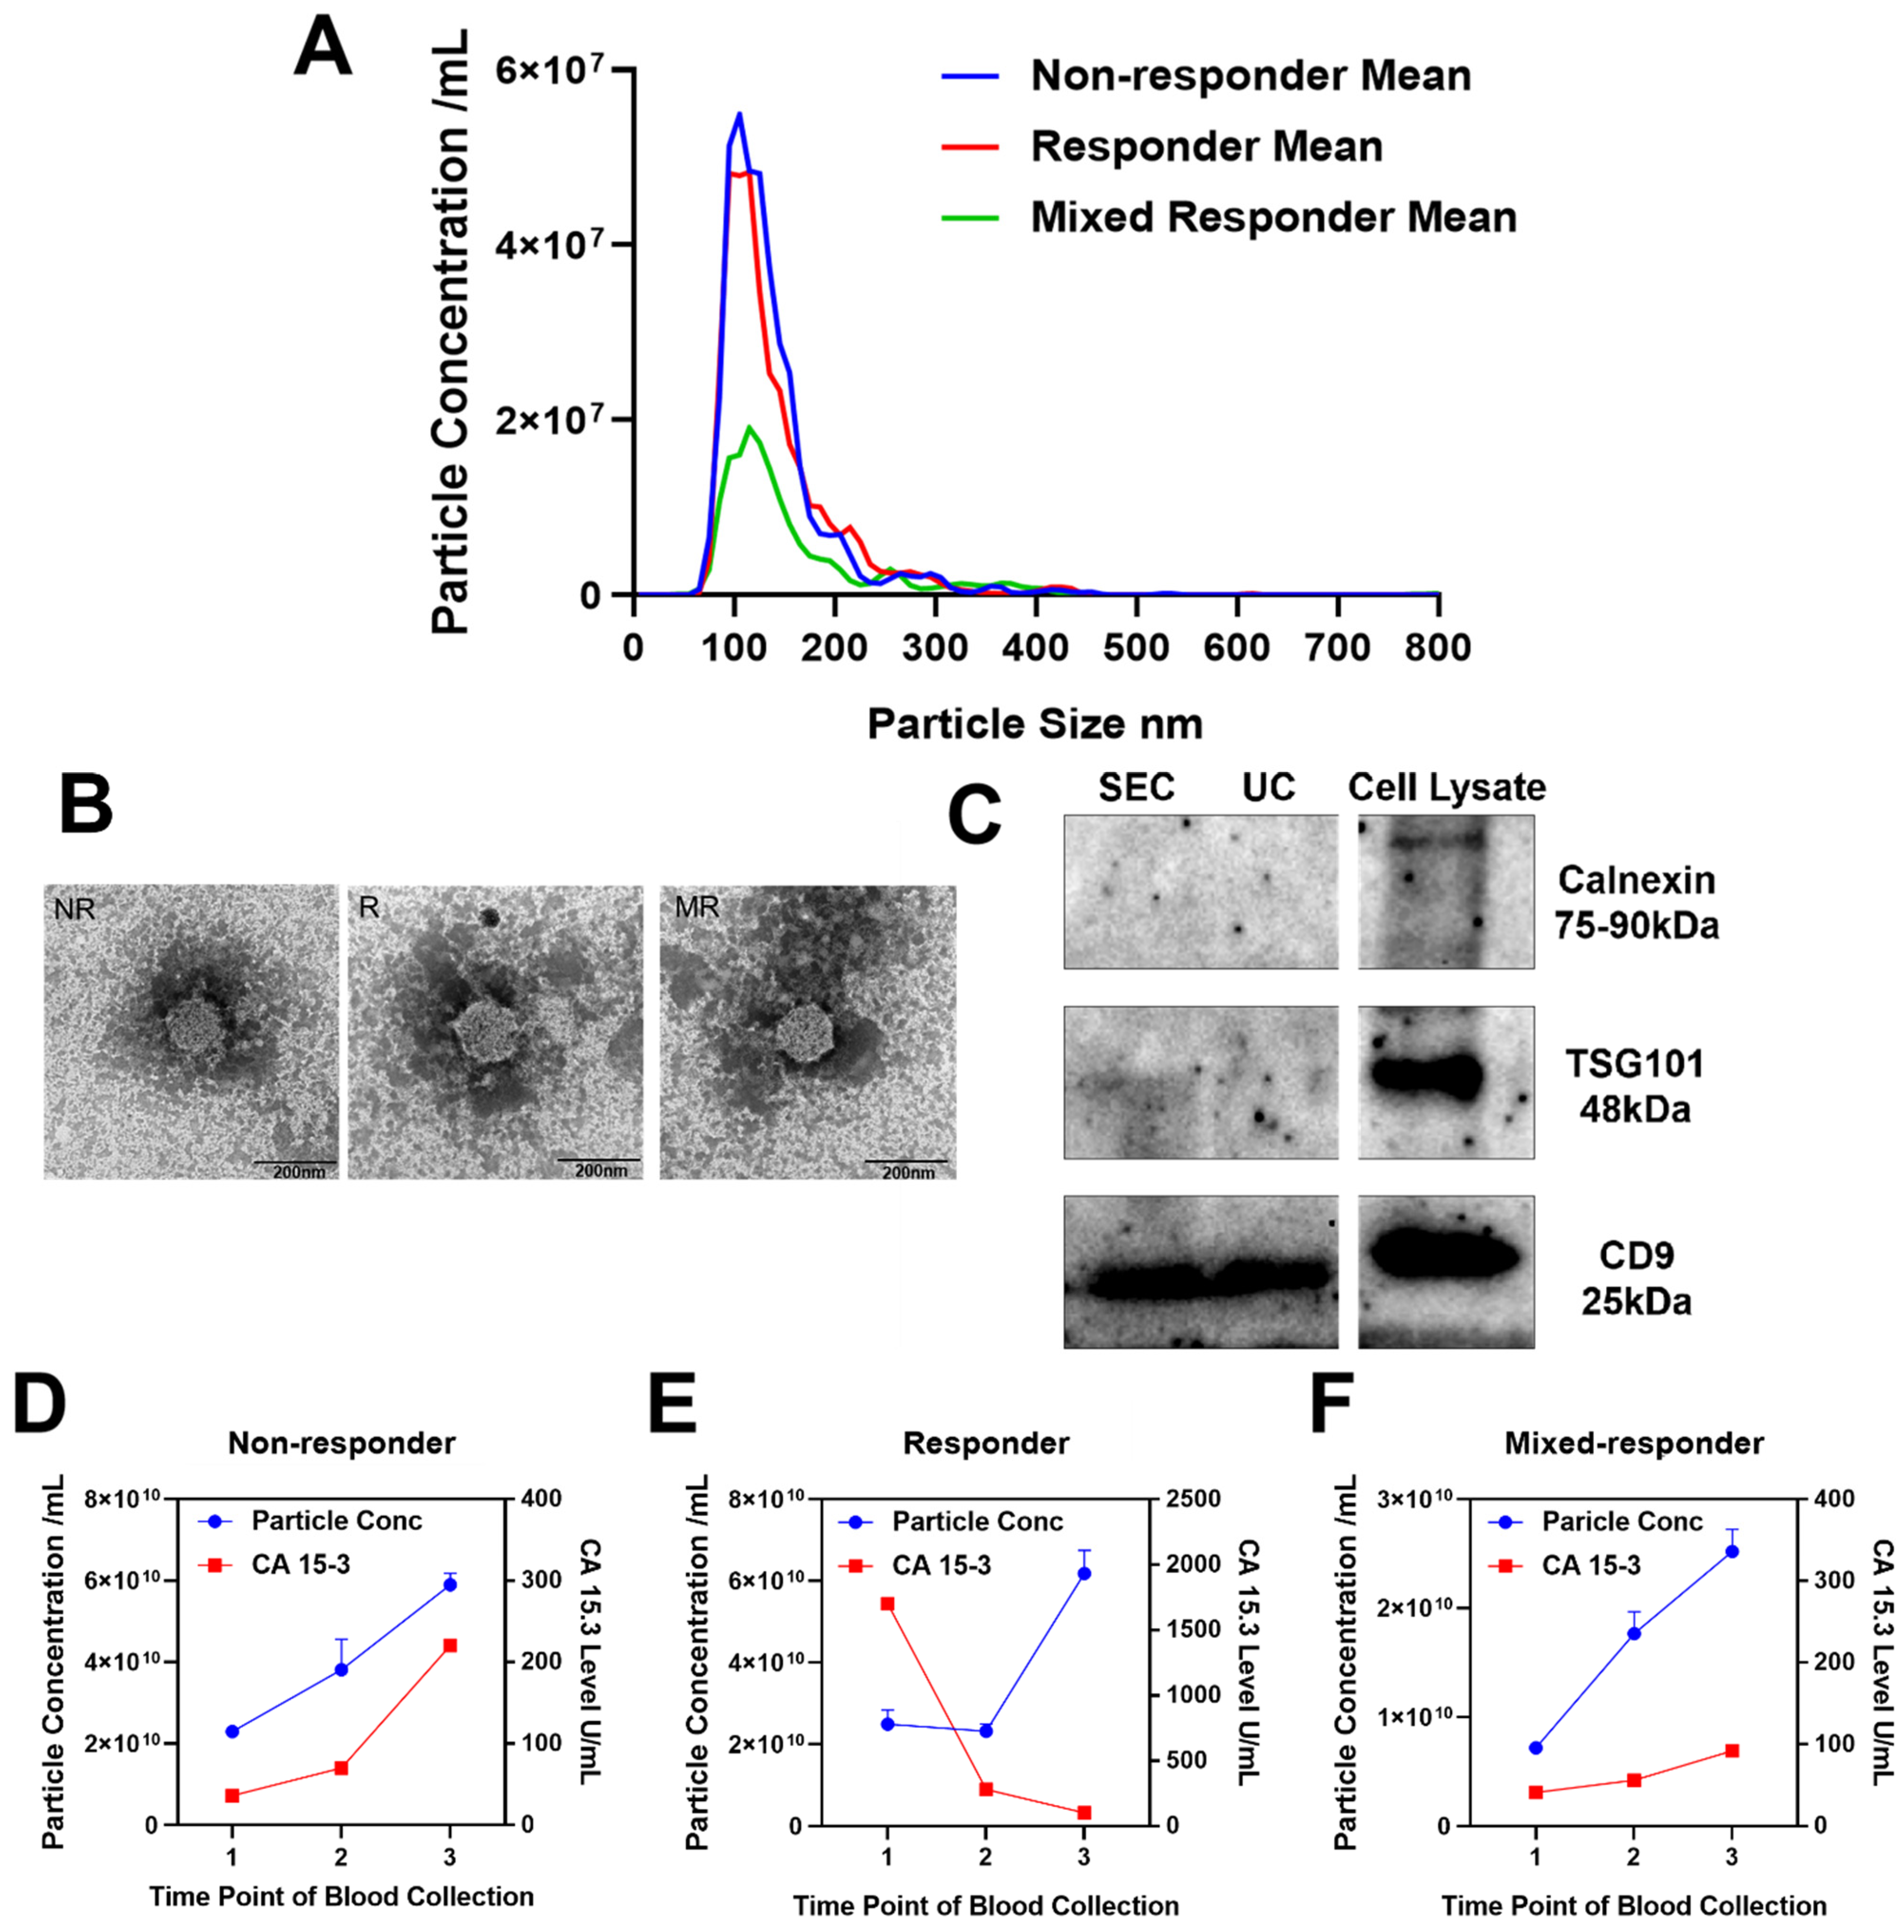
3.2. Validation of Successful Extracellular Vesicle Isolation

Plasma borne Evs. were enriched using size exclusion chromatography (SEC) from blood samples (Materials and Methods) of three patients with metastatic breast cancer at three time points during their treatment (Figure 1). Evs. were subjected to nanoparticle tracking analysis (NTA) revealing the mean size of isolated Evs. was approximately 146 nm (range 60–540 nm) and the concentration was approximately 3.11 × 10¹⁰ particles/mL of plasma (range 2.45 × 10¹⁰–6.83 × 10¹⁰ particles/mL plasma, Figure 2A). This is consistent with previous reports showing that the size and concentration of plasma Evs. from patients with breast cancer ranges from 80–160 nm and 6.00 × 10⁹–8.05 × 10¹¹ particles/mL respectively [11,12,13,14]. Transmission electron microscopy (TEM) analysis revealed spherical particles with a bilayer membrane in the size range of 50–150 nm consistent with previous reports (Figure 2B) [11,12,13,14]. Western blot analysis detected EV protein biomarkers according to internationally accepted guidelines (Figure 2C, Supplemental Data, Figure S1) [15]. CD9, a known EV marker involved in EV biogenesis, maturation, and secretion, was detected regardless of the isolation method. In contrast TSG101, another classical EV marker, was only detected in the pooled SEC EV preparation. Though these proteins were detected by western blot, they and some other classic EV markers were not detected by mass spectrometry. This may be due to the highly hydrophobic nature of tetraspanins and large membrane proteins, a feature that renders them difficult to analyse by mass spectrometry [16]. On the contrary, calnexin, an endoplasmic reticular protein, was not detected in the EV samples by western blot or mass spectrometry, proving that the isolated Evs. were purified and not contaminated by redundant intracellular components. In concordance with previous reports, we were unable to routinely identify certain tetraspanins (CD63/81) in plasma Evs. [17]. This provides additional evidence that tetraspanins are not universal markers for Evs. isolated from plasma. Taken together, these results demonstrated that Evs. were successfully isolated from the plasma with high purity and well characterized by various methods.

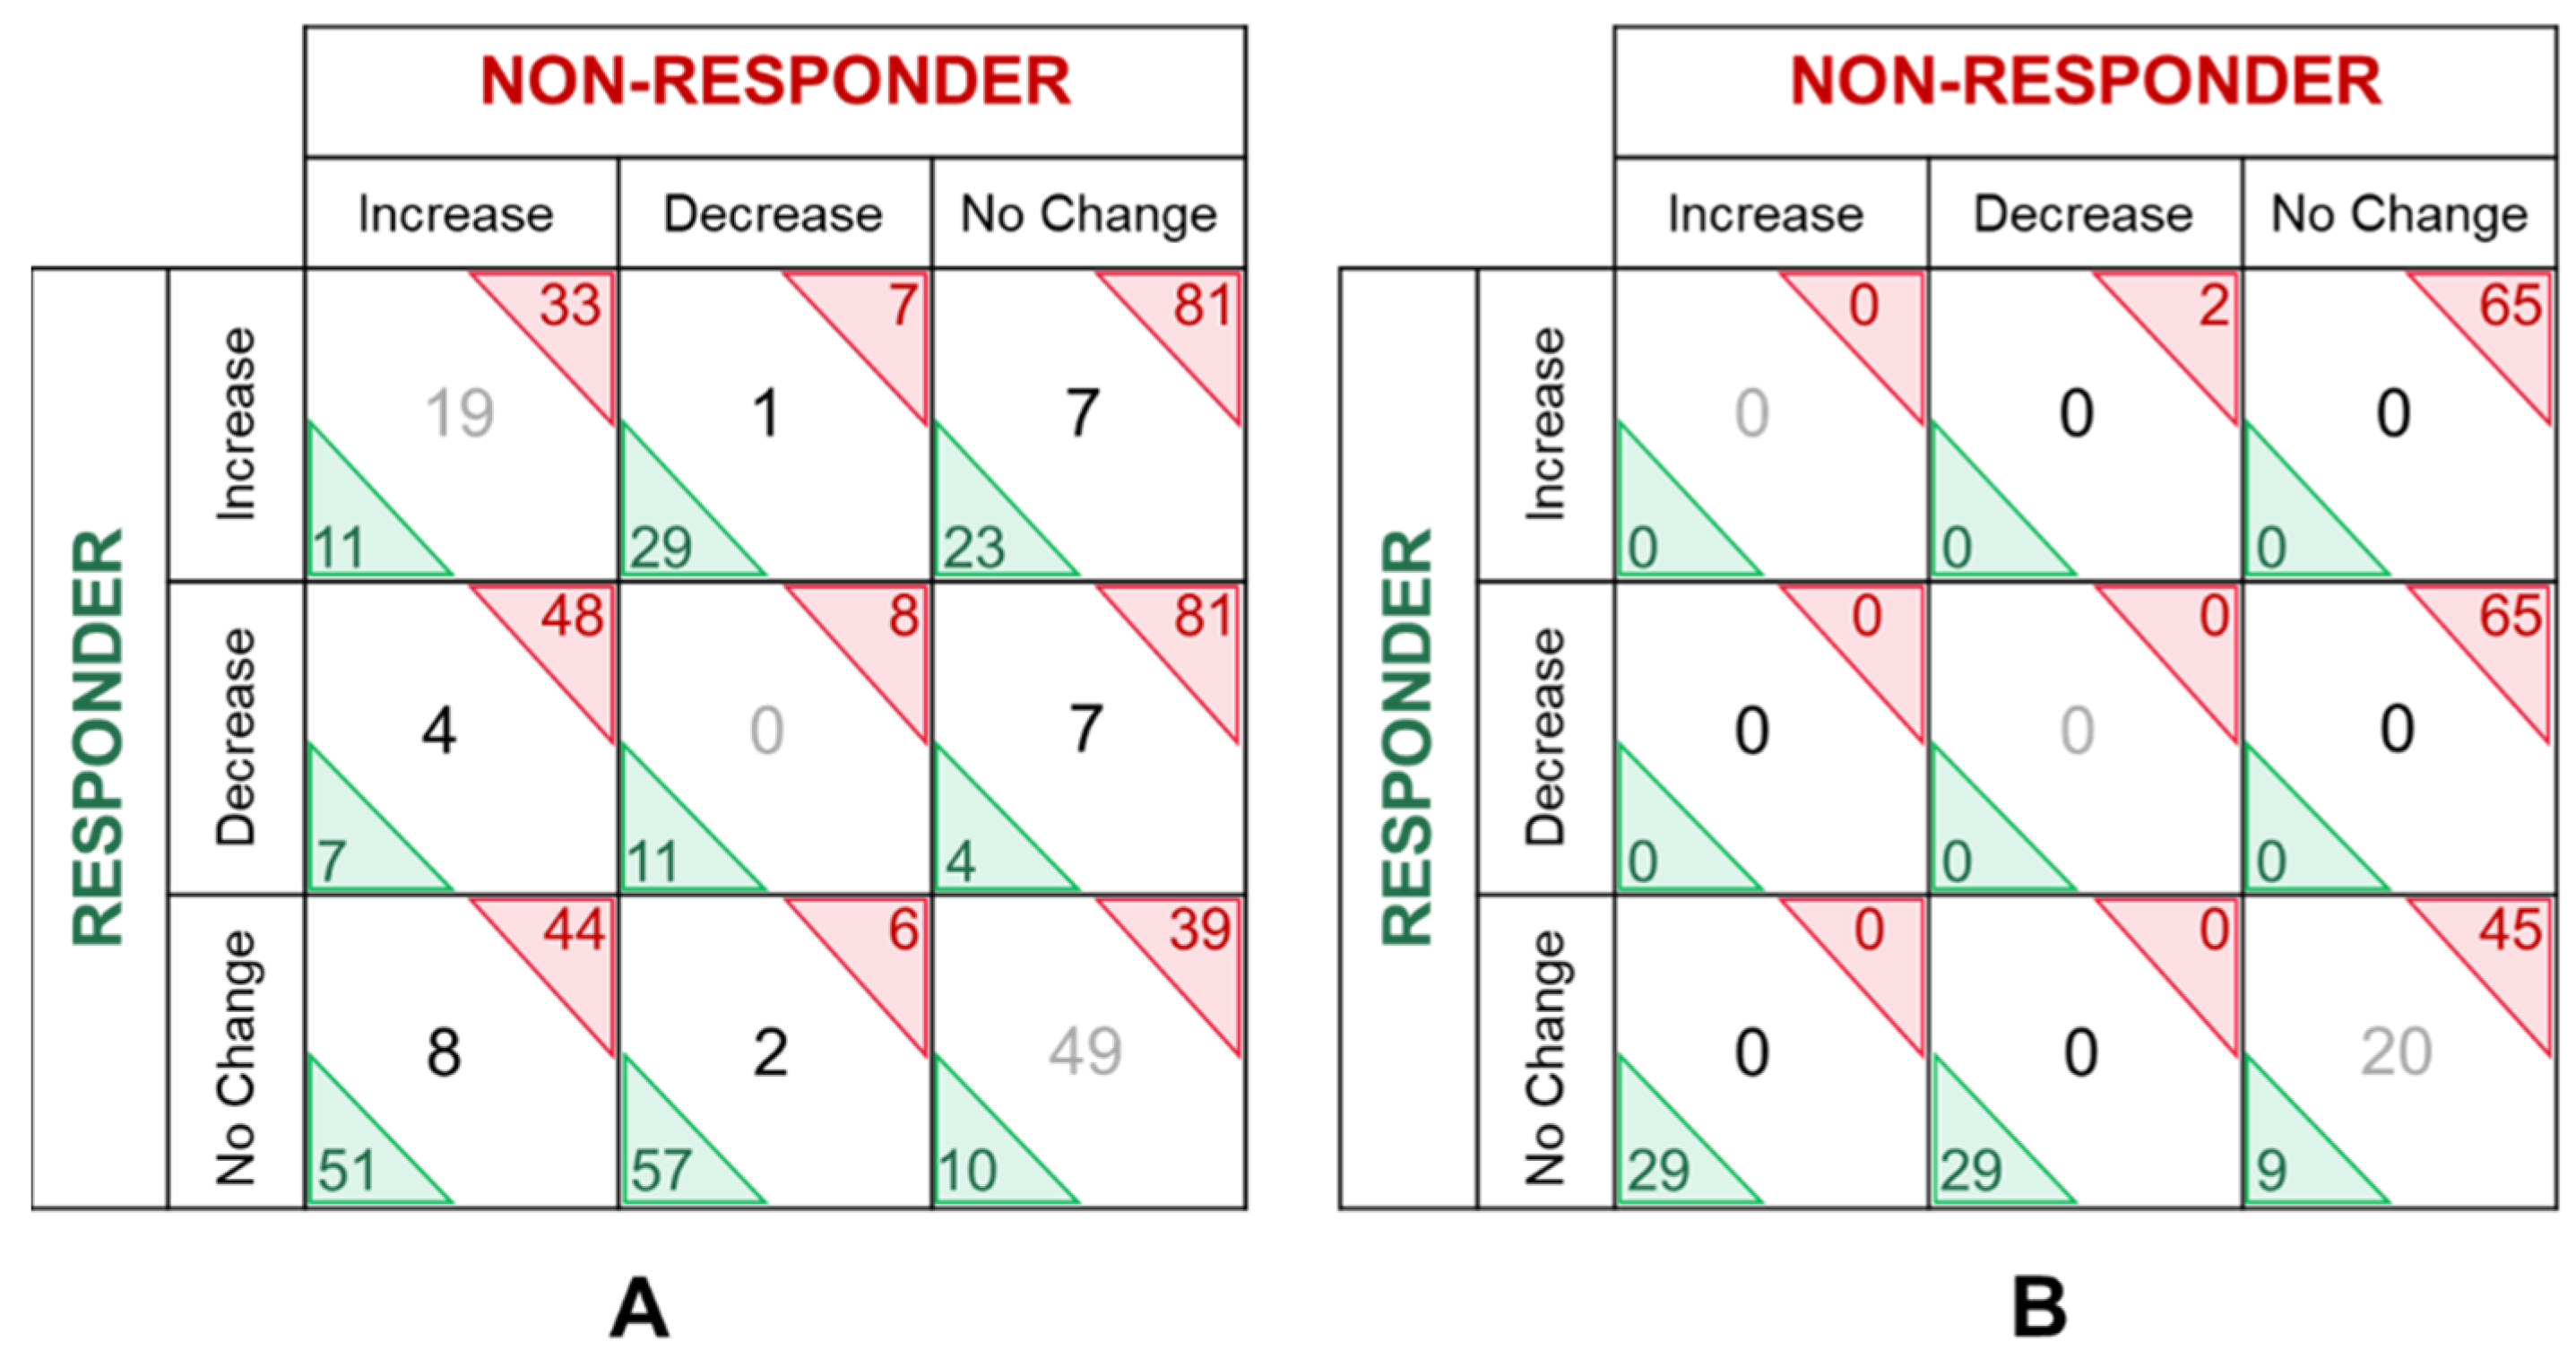
3.3. Quantitative Extracellular Vesical Proteomic Profiling

Isolated Evs. (Figure 2) were subjected to tryptic digestion [5], tandem mass tagging (TMT) [4] and quantitative proteomics [3,18] which identified 470 unique proteins, with 113 excluded based on a q value which is greater than 0.05 and considered to be an insignificant change in expression, 67 excluded due to missing tags and incomplete quantitative data, and 4 excluded due to non-human origin (Supplementary Materials Table S1). For the remaining 286 proteins, raw abundance values of each protein were converted into a ratio by dividing reporter-ion abundance values at various time points (1/2, 1/3, and 2/3). Proteins with an empirical fold change of greater than 1.5 were considered de-regulated. Both high-abundant plasma proteins (such as albumin, fibrinogen, haptoglobin, alpha-2-macroglobulin, and various immunoglobulins) and classical EV proteins (such as heat shock protein HSP 90-beta, tubulin, and von Willebrand factor) were identified. Albumin and immunoglobulins are two of the most abundant plasma proteins, and their detection not only implies plasma protein contamination, but may also have reduced the sensitivity of the mass spectrometry (MS) by narrowing its dynamic range of analysis. On the other hand, heat shock protein HSP 90-beta, tubulin and von Willebrand factor were used as indicators of plasma EV enrichment. tubulin is a cytoskeleton protein while heat shock protein HSP 90-beta is a cytosolic protein and both have been reported to be enriched in Evs. [19,20,21]. von Willebrand factor is one of the most common protein markers found in platelet-derived Evs. [19,20], which accounts for up to 90% of Evs. found in plasma. Due to the classical, high abundant, plasma protein nature of 137 proteins, we have analysed these separately in order to maximise the capacity of the analysis. The remaining 149 EV associated proteins of interest were compared within and between the responder and non-responder (Supplementary Materials Tables S2 and S3) and considered in the mixed-responder (Supplementary Materials Table S4). The MS proteomic data were deposited in the Mass Spectrometry Interactive Virtual Environment (MassIVE) database with the dataset identifier: MSV000087527 and are publicly accessible by the following link: (https://massive.ucsd.edu/ProteoSAFe/dataset.jsp?task=4e6ad1a618d24d79b648d72af5a9e0d3).

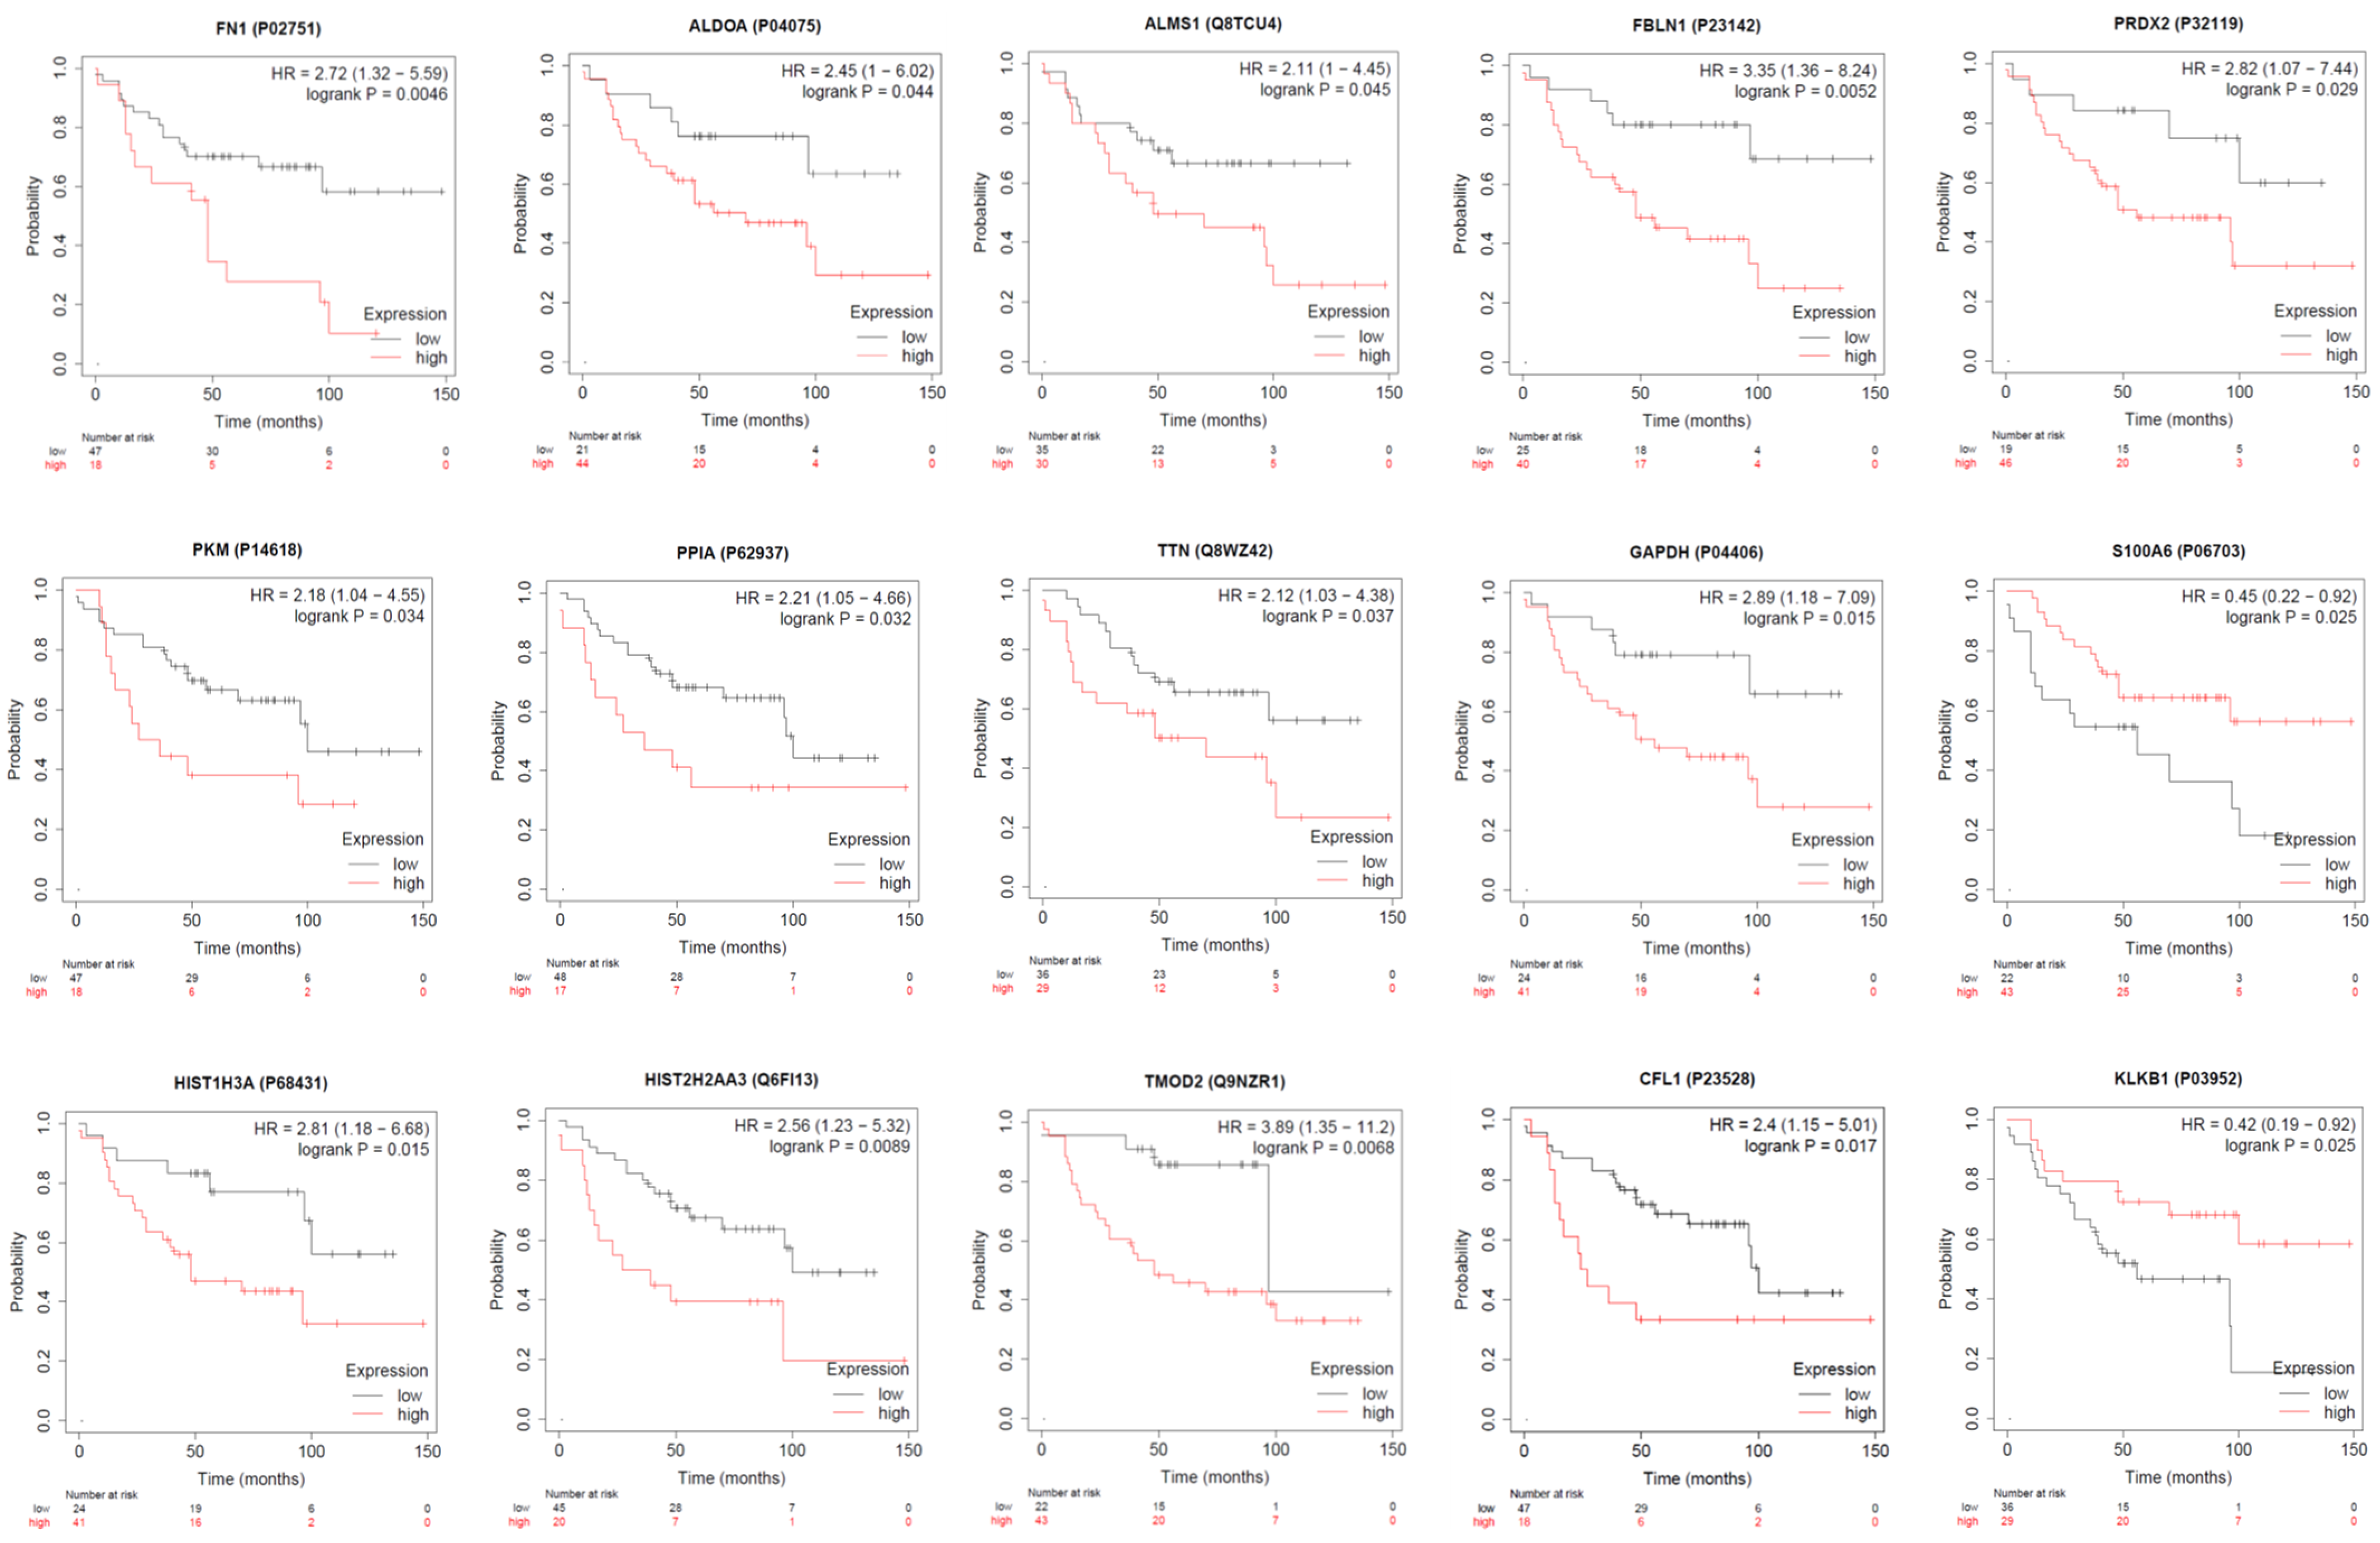
3.4. Analysis of Extracellular Vesical Associated Proteins of Interest

EV proteins (n = 149) were categorized according to their GO terms to explore the enrichment of cellular functions. Initially, proteins were categorized according to the cellular compartment with which they associate (Figure 3A). Most proteins (>65%) were associated with exosomes and the extracellular space but some were also categorized as associated with the nucleosome, centrosome, lysosome or cytoskeleton. As nucleosome, centrosome and lysosome related proteins are unlikely to be present in EVs, it is possible that we have co-isolated extra-vesicular proteins. Nevertheless, the putative EV protein cargo were also categorized according to their role within biological pathways, a strategy that identified the complement cascade, initial triggering of complement, RNA processing, and telomere maintenance as the most overrepresented within these vesicles (Figure 3B).
Analysis of proteins showing altered abundance over time between the responder and non-responder (Table 2) identified 23 proteins that increased abundance in the non-responder; 7 proteins decreased in the non-responder only, and 5 proteins increased in the responder (Figure 4, Table 3, Table 4 and Table 5). Six proteins displayed a greater than five-fold change in abundance between any given time point, including: cofilin-1, tropomodulin-2, peroxiredoxin-2, vimentin, histone H2B type 1-K and multimerin-1. Collectively, these 35 proteins were able to discriminate the responder from the non-responder at any given time point by supervised principal components analyses and hierarchical clustering (Figure 5). The principal components analysis also revealed that the proteomic profile of the mixed responder grouped more closely with that of the non-responder which is consistent with the ultimate lack of response observed in this case. According to the human protein atlas, over 70% of these proteins (25 out of 35) are expressed in breast tumours based on immunohistochemistry. Additional in silico analysis of these de-regulated proteins revealed that high breast tumoral expression of fibronectin, fructose-bisphosphate aldolase A, pyruvate kinase PKM, peptidyl-prolyl cis-trans isomerase A, histone H3.1, histone H2A type 2-A, alstrom syndrome protein 1, fibulin-1, titin, glyceraldehyde-3-phosphate dehydrogenase, tropomodulin-2, cofilin-1, and peroxiredoxin-2 were significantly associated with shorter overall survival (Figure 6) [22]. In contrast, low tumoral expression of Protein S100-A6 and Plasma kallikrein were associated with shorter overall survival.

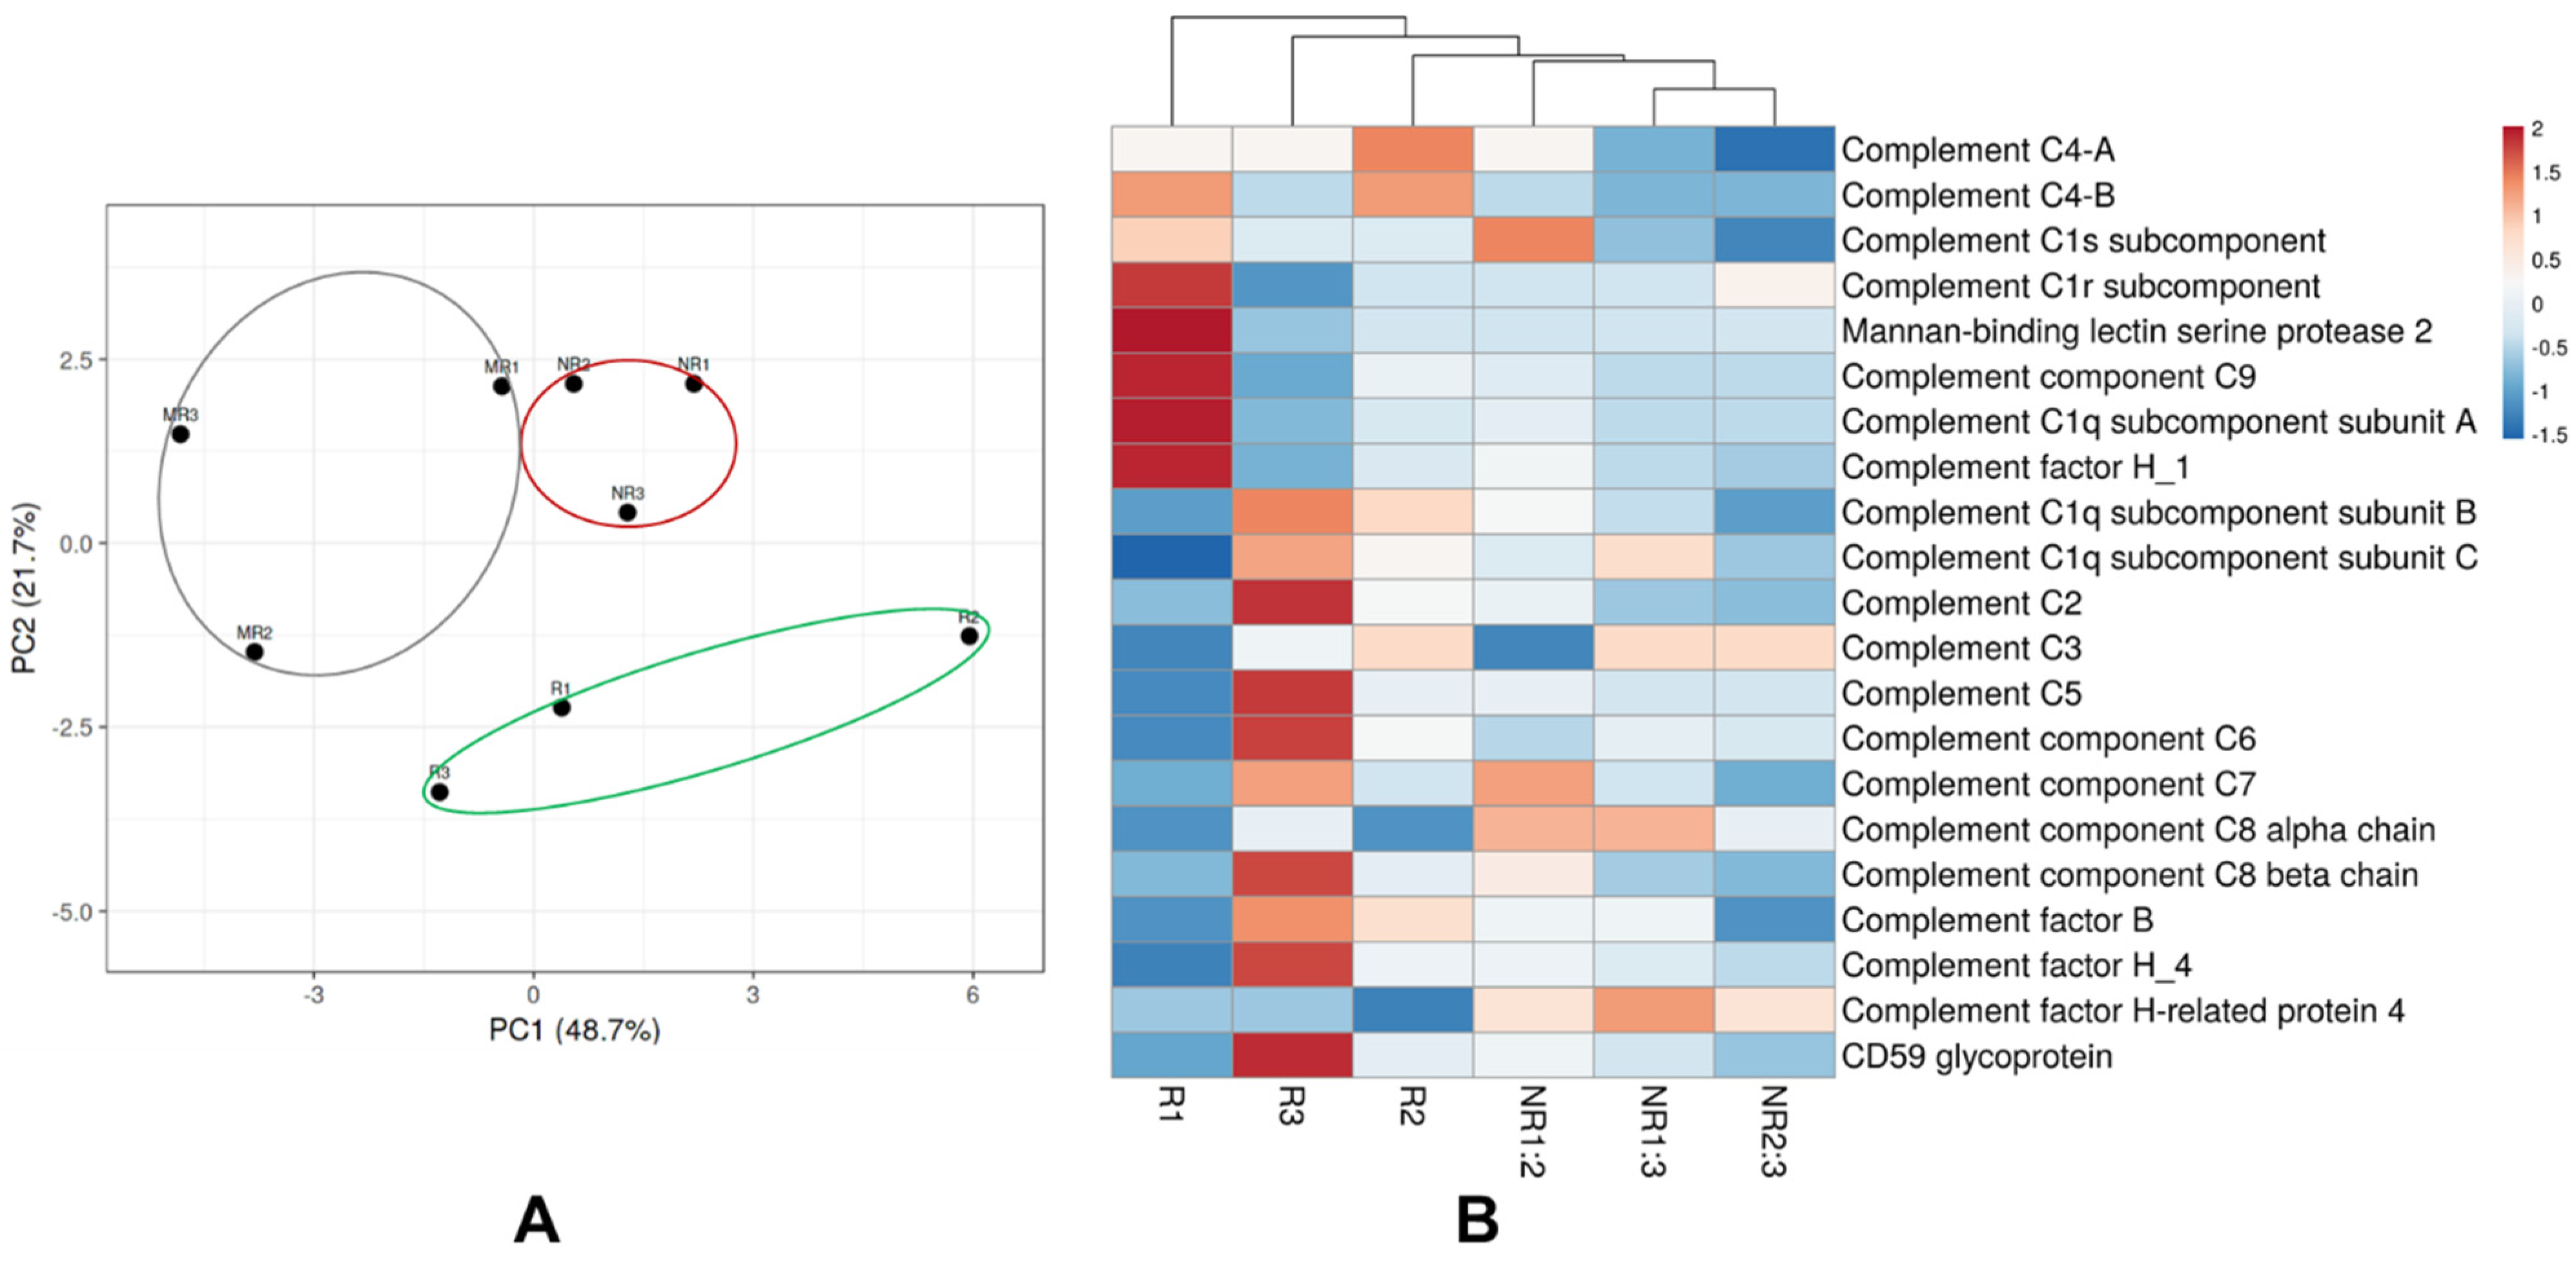
3.5. Extracellular Vesical Associated Proteins Involved in the Complement Cascade

Considering previous evidence that Evs. contain key complement factors and regulators [23], we examined proteins in this cascade as a separate sub-group. We identified numerous proteins involved in both the classical and lectin complement pathways but failed to identify any proteins involved in the alternative pathway. Beyond this, we found that the 21 complement associated proteins were able to separate the responder from the non-responder at any given time point by un-supervised hierarchical clustering and principal components analyses (Figure 7).

3.6. Classical, High Abundant Extracellular Vesical Associated Proteins

Quantitative and temporal analyses of classical, high abundant, plasma EV associated proteins revealed a dramatically less co-ordinated change in abundance (Table 6, Figure 4B). That is, very few proteins increased or decreased in at least two of the three time points analysed regardless of response to treatment. A substantial number of proteins remained generally unchanged in the patient that did not respond to treatment (~47%, 65/137) compared with the patient that did respond to treatment (~21%, 29/137) (Table 6).

4. Discussion

Over the last 20 years, we have made dramatic improvements in our ability to detect breast tumours early using pragmatic screening campaigns and public awareness in developed countries. However, metastatic disease remains a fatal consequence of breast cancer and occurs in approximately 30% of cases [24]. Evs. are enriched with dynamic molecular cargo that act as versatile mediators of intercellular communication. They can serve as a high-quality source of biomarkers in the research and clinical setting, as their contents are selectively packaged by parental cells. Indeed, recent reports have shown that plasma EV proteins have diagnostic utility for early breast cancer detection and prediction of recurrence risk [12]. Here, we adopted a similar study design to previous reports and used a simple protocol to enrich small Evs. < 200 nm in size (Figure 2) from serial plasma samples of three patients with hormone receptor positive, metastatic breast cancer [12,25]. A total of 470 proteins were identified and, of these, 149 were classified as EV associated proteins of interest while a further 137 were deemed representative of classical, high abundant serum EV-associated proteins. Of the 149 EV associated proteins of interest, we created a short list of 35 based on their unique abundance signature relative to response status. A review of previous studies revealed that 80% (28 out of 35) of candidate EV-associated proteins have a potential association with breast cancer aggression/metastasis/invasion and ~40% (15 out of 35) are associated with breast cancer survival (Supplementary Materials Table S5). With the caveat that these data are generated from a small number of representative samples, the identification of such a large number of proteins associated with disease severity, metastasis and invasion supports our hypothesis that host-derived EV cargo is associated with treatment response. While it is noted that the treatment regime for each patient was somewhat different and that this could lead to the differences in the EV protein expression patterns, the intent was to characterize aggressive tumours that had different potentials for responses.
We identified five EV associated proteins that were uniquely overrepresented in all three samples from the patient who responded to therapy relative to the non-responder (Table 3). Of these proteins, previous studies have shown that high expression of glyceraldehyde-3-phosphate dehydrogenase, peroxiredoxin-2 and histone H2A type 2-A in breast cancer tissues are inversely correlated with overall survival and tumour aggressiveness [25,26,27,28]. Our own independent in silico analyses verified this observation (Supplementary Materials Figure S1). However, considering that Evs. are dynamic intercellular communication agents that functionally transfer biological information between cells, correlation between tissue and EV expression is complex in the context of functionality. In support of this, a recent prostate cancer study showed that expression of some but not all proteins was conserved between Evs. and tumour cells and that this relationship was independent of survival [29]. An absence of correlation between tissue and EV expression may indicate that certain EV packaging and processing mechanisms are altered during cancer onset and progression. Here we report high levels of EV packaged peroxiredoxin-2 in the patient with metastatic breast cancer who responded to therapy and suggest that this is uniquely associated with decreased intracellular levels. Peroxiredoxin-2 is an antioxidant enzyme that balances reactive oxygen species and cytokine-induced peroxide levels via electron transfer mediation and is considered essential for tumour cell maintenance and survival [30]. Therefore, specific EV packaging of peroxiredoxin-2 in the scenario (responder) may scavenge tumour supplies and lead to reduced cell survival, a phenomenon that is consistent with response to therapy. In other words, our data hint that EV packaged peroxiredoxin-2 may be a biologically relevant biomarker of treatment response, although further studies in larger cohorts are required to confirm this.
We observed decreased abundance of seven EV associated proteins in the non-responder at all three time points (Table 4). While some of these proteins may have potential as novel biomarkers in other cancer types, their biological relevance is also worthy of consideration. For example, solute carrier family 25 member 44 is a mitochondrial branched-chain amino acid transporter and is part of a signalling network that provides important nutrients for tumour cell proliferation [31]. Thus, reduced EV packaging of this protein is consistent with an increased demand by proliferating tumour cells. Upregulated tissue expression of Kinesin-like protein KIF20B has been reported in some solid tumours including breast, bladder and liver cancers [32] and is consistent with reduced packaging into circulating Evs. as observed in the current study. A more recent report showed that blocking cytokinesis by KIF20B inhibition increased the efficacy of microtubule-associated therapeutic agents in liver cancer [33]. Together with our findings, this suggests that a similar therapeutic advantage may be obtained in breast cancer. Serum paraoxonase/arylesterase 1 are esterase enzymes with lipophilic antioxidant characteristics. A recent report corroborating earlier studies showed that levels of circulating Paraoxonase/arylesterase 1 were lower in patients with breast cancer compared with healthy controls [34,35,36]. Our data provides further support for these findings and warrant additional targeted EV analysis of Paraoxonase/arylesterase 1 expression in larger cohorts.
In contrast, we observed increased abundance of 23 EV associated proteins in the non-responder at all three time points (Table 5). String analysis revealed the presence of two clusters within this group of proteins: (1) tubulin alpha-1B chain, cofilin-1, peptidyl-prolyl cis-trans isomerase A, pyruvate kinase PKM, fructose-bisphosphate aldolase A, fibronectin, endoplasmin, vimentin, tropomodulin-2 and collagen alpha-1(VI) chain; and (2) peregrin, histone cluster 1 H3 family member j, Ubiquitin-40S ribosomal protein S27a and histone H2B type 1-K (Supplemental Data, Figure 2). In silico analysis based on comparison with TCGA data and a published proteotranscriptomics breast cancer study [22] revealed that most of these proteins (~65%, 9 out of 14) are expressed at higher levels in breast cancer tissues compared with non-cancer controls and that 50% of these proteins are associated with shorter overall survival (Supplementary Materials Table S5).
Many of the proteins that showed increased abundance in the non-responder are involved in tumour cell function and survival. For example, in addition to their well characterised roles in actin cytoskeleton dynamics, cofilin-1, fibronectin and fibulin-1 have also been implicated in cellular migration, tumour invasion and mitosis [37]. Consistent with our observation, cofilin showed high abundance and is associated with a lack of response to treatment, and poor outcomes for breast cancer patients [12,25,38]. In a similar context, both pyruvate kinase PKM and Fructose-bisphosphate aldolase A play important roles in glycolysis and are therefore also crucial for tumour cell proliferation. High EV levels of these proteins may reflect an increased tumoral load in patients who are unable to mount a response to treatment and highlight their potential as liquid biomarker candidates.
We were intrigued to detect an enrichment of histone associated proteins in Evs. from plasma of the non-responder. Although controversial, this is not an unusual result. Numerous other EV-proteomic studies have identified histone associated proteins enriched in cancer circulation compared with controls [12,25,39]. Whether this reflects a high histone tumoral load, deliberate shuttling and removal of these proteins or is attributed to technical factors remains unclear. Regardless, these data provide support for the notion that Evs. are implicated in DNA transcription one way or another. Evs. may be packaged with histone associated proteins in order to limit DNA accessibility and regulate transcription. On the other hand, histones may exist on the extra-vesicular periphery and may be co-incidentally detected by current isolation methods. This is a very interesting area of research that is ripe for additional discussion.
It is apparent from our proteomics analyses that plasma Evs. consist not only of tumour derived Evs. but also Evs. from different origins such as platelets, immune cells, or adipose tissues [12]. This was highlighted in our results by detection of proteins that are enriched in two complement pathways. As key mediators of inflammation, Evs. are crucial for the immune response and regulation [40]. Here, the unique deregulation of EV associated complement expression in the context of response to therapy indicates an important link with the immune response. While these data do not definitively show whether the complement proteins are intra- or inter-vesicular cargo, their coordinated deregulation in relation to response to therapy indicates their potential as biomarkers and therapeutic targets.
Beyond deliberate packaging of certain proteins as intra-vesicular cargo, we also postulate that plasma Evs. act as traps and accumulate high abundant proteins on their extra-vesicular surface while in circulation. Therefore, the overall changes in EV cargo reflect the host’s disease state in aggregate which is influenced by not only tumour cells but also the tumour microenvironment, the immune system and other physiological maintenance cascades. This is substantiated by the detection of 137 classical, high abundant serum EV-associated proteins in our analyses. Rather than consider this a limitation, we highlight these findings and show that this collection of proteins remains relatively consistent over time regardless of response to treatment. It is unrealistic to expect that Evs. isolated from plasma will recapitulate or exclusively represent the expression profile of the tumour or even of the Evs. that are released from tumour cells. However, plasma Evs. do provide a wealth of information when considered as a measure of host response.
In summary, our proof-of-concept study shows that EV associated proteins from serial blood samples offer a dynamic and versatile snapshot of the host environment. Our results hint that proteins isolated from Evs. may have roles in breast cancer metastasis and therapeutic evasion but more work is needed to realise their full translational capacity due to the limited sample size investigated here. We also highlight that Evs. offer important insight into global host dynamics beyond the tumour.

Supplementary Materials

The following are available online at https://www.mdpi.com/article/10.3390/membranes11110880/s1. Figure S1: Full and uncropped western blot results; Figure S2: String analysis revealed the presence of two clusters within 23 EV associated proteins that were uniquely up-regulated in the non-responder; Table S1: Full Data; Table S2: Responder data; Table S3: Non-responder data; Table S4: Mixed-Responder data; Table S5: Summary of candidate EV-associated proteins have a potential association with breast cancer aggression/metastasis/invasion and survival.

Author Contributions

Conceptualization, K.M.; data curation, X.Q.; formal analysis, O.R., X.Q., M.F.B.J., A.G., M.M., M.D.D. and C.S.; funding acquisition, K.M.; investigation, O.R.; methodology, O.R., M.F.B.J., B.N. and K.M.; resources, K.M., M.M., C.S., A.G. and M.D.D.; writing—original draft, O.R., X.Q., A.G. and K.M.; writing—review and editing, all authors. All authors have read and agreed to the published version of the manuscript.

Funding

This work was funded by grants awarded to K.M. by the Ada Bartholomew Trust and the Zonta Club of Peel. C.S. is supported by Lions Medical Research Foundation, National Health and Medical Research Council, The Medical Research Future Fund (MRFF), and Fondo Nacional de Desarrollo Científico y Tecnológico (FONDECYT 1170809). O.R. was supported by the Australian Government Research Training Program, the Richard Walter Gibbon Medical Research Fund and the Cancer Council of Western Australia. MDD is supported by a Defeat DIPG ChadTough New Investigator Fellowship and an NHMRC Investigator Grant–GNT1173892. The contents of the published material are solely the responsibility of the research institutions involved or individual authors and do not reflect the views of NHMRC. The Cancer Institute NSW in partnership with the College of Health, Medicine and Wellbeing from the University of Newcastle funded the MS platform.

Institutional Review Board Statement

The study was conducted according to the guidelines of the Declaration of Helsinki, and approved by the Sir Charles Gairdner Hospital Human Research Ethics Committee (reference numbers SCGH HREC 2013-051 and 2013-222).

Informed Consent Statement

Informed consent was obtained from all subjects involved in the study.

Data Availability Statement

The data were deposited in the Mass Spectrometry Interactive Virtual Environment (MassIVE) database with the dataset identifier: MSV000087527 and are publicly accessible by the following link: (https://massive.ucsd.edu/ProteoSAFe/dataset.jsp?task=4e6ad1a618d24d79b648d72af5a9e0d3).

Acknowledgments

The authors acknowledge the outstanding support from the School of Biomedical Sciences at the University of Western Australia and kind support from the Zonta Club of Peel. We thank Annette Lim for her assistance with patient recruitment and also extend our gratitude to all patients and staff at Charles Gairdner Hospital who were involved in this study.

Conflicts of Interest

The authors declare no conflict of interest.

References

  1. Nguyen, B.; Meehan, K.; Pereira, M.R.; Mirzai, B.; Lim, S.H.; Leslie, C.; Clark, M.; Sader, C.; Friedland, P.; Lindsay, A.; et al. A comparative study of extracellular vesicle-associated and cell-free DNA and RNA for HPV detection in oropharyngeal squamous cell carcinoma. Sci. Rep. 2020, 10, 6083. [Google Scholar] [CrossRef] [PubMed] [Green Version]
  2. Ruhen, O.; Mirzai, B.; Clark, M.E.; Nguyen, B.; Salomon, C.; Erber, W.; Meehan, K. Comparison of Circulating Tumour DNA and Extracellular Vesicle DNA by Low-Pass Whole-Genome Sequencing Reveals Molecular Drivers of Disease in a Breast Cancer Patient. Biomedicines 2020, 9, 14. [Google Scholar] [CrossRef]
  3. Nixon, B.; De Iuliis, G.N.; Hart, H.M.; Zhou, W.; Mathe, A.; Bernstein, I.R.; Anderson, A.L.; Stanger, S.J.; Skerrett-Byrne, D.A.; Jamaluddin, M.F.B.; et al. Proteomic Profiling of Mouse Epididymosomes Reveals their Contributions to Post-testicular Sperm Maturation. Mol. Cell. Proteom. 2019, 18, S91–S108. [Google Scholar] [CrossRef] [PubMed] [Green Version]
  4. Almazi, J.G.; Pockney, P.; Gedye, C.; Smith, N.D.; Hondermarck, H.; Verrills, N.M.; Dun, M.D. Cell-Free DNA Blood Collection Tubes Are Appropriate for Clinical Proteomics: A Demonstration in Colorectal Cancer. Proteom. Clin. Appl. 2018, 12, e1700121. [Google Scholar] [CrossRef] [PubMed] [Green Version]
  5. Dun, M.D.; Chalkley, R.J.; Faulkner, S.; Keene, S.; Avery-Kiejda, K.A.; Scott, R.J.; Falkenby, L.G.; Cairns, M.J.; Larsen, M.R.; Bradshaw, R.A.; et al. Proteotranscriptomic Profiling of 231-BR Breast Cancer Cells: Identification of Potential Biomarkers and Therapeutic Targets for Brain Metastasis. Mol. Cell. Proteom. 2015, 14, 2316–2330. [Google Scholar] [CrossRef] [PubMed] [Green Version]
  6. Degryse, S.; de Bock, C.E.; Demeyer, S.; Govaerts, I.; Bornschein, S.; Verbeke, D.; Jacobs, K.; Binos, S.; Skerrett-Byrne, D.A.; Murray, H.C.; et al. Mutant JAK3 phosphoproteomic profiling predicts synergism between JAK3 inhibitors and MEK/BCL2 inhibitors for the treatment of T-cell acute lymphoblastic leukemia. Leukemia 2018, 32, 788–800. [Google Scholar] [CrossRef]
  7. Nixon, B.; Johnston, S.D.; Skerrett-Byrne, D.A.; Anderson, A.L.; Stanger, S.J.; Bromfield, E.G.; Martin, J.H.; Hansbro, P.M.; Dun, M.D. Modification of Crocodile Spermatozoa Refutes the Tenet That Post-testicular Sperm Maturation Is Restricted To Mammals. Mol. Cell. Proteom. 2019, 18, S58–S76. [Google Scholar] [CrossRef] [Green Version]
  8. Fonseka, P.; Pathan, M.; Chitti, S.V.; Kang, T.; Mathivanan, S. FunRich enables enrichment analysis of OMICs datasets. J. Mol. Biol. 2021, 433, 166747. [Google Scholar] [CrossRef] [PubMed]
  9. Snel, B.; Lehmann, G.; Bork, P.; Huynen, M.A. STRING: A web-server to retrieve and display the repeatedly occurring neighbourhood of a gene. Nucleic Acids Res. 2000, 28, 3442–3444. [Google Scholar] [CrossRef] [Green Version]
  10. Metsalu, T.; Vilo, J. ClustVis: A web tool for visualizing clustering of multivariate data using Principal Component Analysis and heatmap. Nucleic Acids Res. 2015, 43, W566–W570. [Google Scholar] [CrossRef] [PubMed]
  11. Wang, X.; Zhong, W.; Bu, J.; Li, Y.; Li, R.; Nie, R.; Xiao, C.; Ma, K.; Huang, X.; Li, Y. Exosomal protein CD82 as a diagnostic biomarker for precision medicine for breast cancer. Mol. Carcinog. 2019, 58, 674–685. [Google Scholar] [CrossRef] [PubMed]
  12. Vinik, Y.; Ortega, F.G.; Mills, G.B.; Lu, Y.; Jurkowicz, M.; Halperin, S.; Aharoni, M.; Gutman, M.; Lev, S. Proteomic analysis of circulating extracellular vesicles identifies potential markers of breast cancer progression, recurrence, and response. Sci. Adv. 2020, 6, eaba5714. [Google Scholar] [CrossRef] [PubMed]
  13. Tutanov, O.; Orlova, E.; Proskura, K.; Grigor’eva, A.; Yunusova, N.; Tsentalovich, Y.; Alexandrova, A.; Tamkovich, S. Proteomic Analysis of Blood Exosomes from Healthy Females and Breast Cancer Patients Reveals an Association between Different Exosomal Bioactivity on Non-tumorigenic Epithelial Cell and Breast Cancer Cell Migration in Vitro. Biomolecules 2020, 10, 495. [Google Scholar] [CrossRef] [Green Version]
  14. Koi, Y.; Tsutani, Y.; Nishiyama, Y.; Ueda, D.; Ibuki, Y.; Sasada, S.; Akita, T.; Masumoto, N.; Kadoya, T.; Yamamoto, Y.; et al. Predicting the presence of breast cancer using circulating small RNAs, including those in the extracellular vesicles. Cancer Sci. 2020, 111, 2104–2115. [Google Scholar] [CrossRef] [PubMed]
  15. Théry, C.; Witwer, K.W.; Aikawa, E.; Alcaraz, M.J.; Anderson, J.D.; Andriantsitohaina, R.; Antoniou, A.; Arab, T.; Archer, F.; Atkin-Smith, G.K.; et al. Minimal information for studies of extracellular vesicles 2018 (MISEV2018): A position statement of the International Society for Extracellular Vesicles and update of the MISEV2014 guidelines. J. Extracell. Vesicles 2018, 7, 1535750. [Google Scholar] [CrossRef] [PubMed] [Green Version]
  16. Carroll, J.; Altman, M.C.; Fearnley, I.M.; Walker, J.E. Identification of membrane proteins by tandem mass spectrometry of protein ions. Proc. Natl. Acad. Sci. USA 2007, 104, 14330–14335. [Google Scholar] [CrossRef] [Green Version]
  17. Zhong, Z.; Rosenow, M.; Xiao, N.; Spetzler, D. Profiling plasma extracellular vesicle by pluronic block-copolymer based enrichment method unveils features associated with breast cancer aggression, metastasis and invasion. J. Extracell. Vesicles 2018, 7, 1458574. [Google Scholar] [CrossRef] [Green Version]
  18. Murray, H.C.; Enjeti, A.K.; Kahl, R.G.S.; Flanagan, H.M.; Sillar, J.; Skerrett-Byrne, D.A.; Al Mazi, J.G.; Au, G.G.; de Bock, C.E.; Evans, K.; et al. Quantitative phosphoproteomics uncovers synergy between DNA-PK and FLT3 inhibitors in acute myeloid leukaemia. Leukemia 2021, 35, 1782–1787. [Google Scholar] [CrossRef] [PubMed]
  19. Badimon, L.; Suades, R.; Fuentes, E.; Palomo, I.; Padro, T. Role of Platelet-Derived Microvesicles As Crosstalk Mediators in Atherothrombosis and Future Pharmacology Targets: A Link between Inflammation, Atherosclerosis, and Thrombosis. Front. Pharmacol. 2016, 7, 293. [Google Scholar] [CrossRef] [PubMed] [Green Version]
  20. Ge, R.; Tan, E.; Sharghi-Namini, S.; Asada, H.H. Exosomes in Cancer Microenvironment and Beyond: Have we Overlooked these Extracellular Messengers? Cancer Microenviron. 2012, 5, 323–332. [Google Scholar] [CrossRef] [PubMed] [Green Version]
  21. Thery, C.; Zitvogel, L.; Amigorena, S. Exosomes: Composition, biogenesis and function. Nat. Rev. Immunol. 2002, 2, 569–579. [Google Scholar] [CrossRef]
  22. Tang, W.; Zhou, M.; Dorsey, T.H.; Prieto, D.A.; Wang, X.W.; Ruppin, E.; Veenstra, T.D.; Ambs, S. Integrated proteotranscriptomics of breast cancer reveals globally increased protein-mRNA concordance associated with subtypes and survival. Genome Med. 2018, 10, 94. [Google Scholar] [CrossRef] [PubMed] [Green Version]
  23. Karasu, E.; Eisenhardt, S.U.; Harant, J.; Huber-Lang, M. Extracellular Vesicles: Packages Sent with Complement. Front. Immunol. 2018, 9, 721. [Google Scholar] [CrossRef]
  24. Redig, A.J.; McAllister, S.S. Breast cancer as a systemic disease: A view of metastasis. J. Intern. Med. 2013, 274, 113–126. [Google Scholar] [CrossRef] [PubMed] [Green Version]
  25. Moon, P.-G.; Lee, J.-E.; Cho, Y.-E.; Lee, S.J.; Jung, J.H.; Chae, Y.S.; Bae, H.-I.; Kim, Y.-B.; Kim, I.-S.; Park, H.Y.; et al. Identification of Developmental Endothelial Locus-1 on Circulating Extracellular Vesicles as a Novel Biomarker for Early Breast Cancer Detection. Clin. Cancer Res. 2016, 22, 1757–1766. [Google Scholar] [CrossRef] [PubMed] [Green Version]
  26. Nandy, D.; Rajam, S.M.; Dutta, D. A three layered histone epigenetics in breast cancer metastasis. Cell Biosci. 2020, 10, 52. [Google Scholar] [CrossRef] [PubMed] [Green Version]
  27. Revillion, F.; Pawlowski, V.; Hornez, L.; Peyrat, J.P. Glyceraldehyde-3-phosphate dehydrogenase gene expression in human breast cancer. Eur. J. Cancer 2000, 36, 1038–1042. [Google Scholar] [CrossRef]
  28. Stresing, V.; Baltziskueta, E.; Rubio, N.; Blanco, J.; Arriba, M.C.; Valls, J.; Janier, M.; Clezardin, P.; Sanz-Pamplona, R.; Nieva, C.; et al. Peroxiredoxin 2 specifically regulates the oxidative and metabolic stress response of human metastatic breast cancer cells in lungs. Oncogene 2013, 32, 724–735. [Google Scholar] [CrossRef]
  29. Duijvesz, D.; Rodriguez-Blanco, G.; Hoogland, A.M.; Verhoef, E.I.; Dekker, L.J.; Roobol, M.J.; van Leenders, G.; Luider, T.M.; Jenster, G. Differential tissue expression of extracellular vesicle-derived proteins in prostate cancer. Prostate 2019, 79, 1032–1042. [Google Scholar] [CrossRef]
  30. Peng, L.; Wang, R.; Shang, J.; Xiong, Y.; Fu, Z. Peroxiredoxin 2 is associated with colorectal cancer progression and poor survival of patients. Oncotarget 2017, 8, 15057–15070. [Google Scholar] [CrossRef] [Green Version]
  31. Sivanand, S.; Vander Heiden, M.G. Emerging roles for branched-chain amino acid metabolism in cancer. Cancer Cell 2020, 37, 147–156. [Google Scholar] [CrossRef] [PubMed]
  32. Kanehira, M.; Katagiri, T.; Shimo, A.; Takata, R.; Shuin, T.; Miki, T.; Fujioka, T.; Nakamura, Y. Oncogenic role of MPHOSPH1, a cancer-testis antigen specific to human bladder cancer. Cancer Res. 2007, 67, 3276–3285. [Google Scholar] [CrossRef] [PubMed] [Green Version]
  33. Liu, X.; Li, Y.; Zhang, X.; Liu, X.-Y.; Peng, A.; Chen, Y.; Meng, L.; Chen, H.; Zhang, Y.; Miao, X.; et al. Inhibition of kinesin family member 20B sensitizes hepatocellular carcinoma cell to microtubule-targeting agents by blocking cytokinesis. Cancer Sci. 2018, 109, 3450–3460. [Google Scholar] [CrossRef] [PubMed]
  34. Balci, H.; Genc, H.; Papila, C.; Can, G.; Papila, B.; Yanardag, H.; Uzun, H. Serum lipid hydroperoxide levels and paraoxonase activity in patients with lung, breast, and colorectal cancer. J Clin. Lab. Anal. 2012, 26, 155–160. [Google Scholar] [CrossRef]
  35. Bobin-Dubigeon, C.; Jaffre, I.; Joalland, M.P.; Classe, J.M.; Campone, M.; Herve, M.; Bard, J.M. Paraoxonase 1 (PON1) as a marker of short term death in breast cancer recurrence. Clin. Biochem. 2012, 45, 1503–1505. [Google Scholar] [CrossRef] [PubMed]
  36. Okuturlar, Y.; Gunaldi, M.; Kocoglu, H.; Hursitoglu, M.; Gedikbasi, A.; Acarer, D.; Harmankaya, O.; Kumbasar, A. Serum paraoxonase and arylesterase can be useful markers to predict neoadjuvant chemotherapy requirement in patients with breast cancer. J. Cancer Res. Ther. 2018, 14, 362–367. [Google Scholar] [CrossRef]
  37. Ghosh, M.; Song, X.; Mouneimne, G.; Sidani, M.; Lawrence, D.S.; Condeelis, J.S. Cofilin promotes actin polymerization and defines the direction of cell motility. Science 2004, 304, 743–746. [Google Scholar] [CrossRef] [PubMed] [Green Version]
  38. Maimaiti, Y.; Tan, J.; Liu, Z.; Guo, Y.; Yan, Y.; Nie, X.; Huang, B.; Zhou, J.; Huang, T. Overexpression of cofilin correlates with poor survival in breast cancer: A tissue microarray analysis. Oncol. Lett. 2017, 14, 2288–2294. [Google Scholar] [CrossRef] [Green Version]
  39. Zhang, H.; Freitas, D.; Kim, H.S.; Fabijanic, K.; Li, Z.; Chen, H.; Mark, M.T.; Molina, H.; Martin, A.B.; Bojmar, L. Identification of distinct nanoparticles and subsets of extracellular vesicles by asymmetric flow field-flow fractionation. Nat. Cell Biol. 2018, 20, 332–343. [Google Scholar] [CrossRef] [PubMed]
  40. Robbins, P.D.; Morelli, A.E. Regulation of immune responses by extracellular vesicles. Nat. Rev. Immunol. 2014, 14, 195–208. [Google Scholar] [CrossRef] [Green Version]
Figure 1. Treatment regimes, time of blood draws and response patterns. Blue and red arrows indicate time of scans and blood collection, respectively. * Computerised tomography (CT), nuclear medicine (NM).
Membranes 11 00880 g001
Figure 2. Validation of extracellular vesical isolation using nanoparticle tracking analysis, transmission electron microscopy and Western blotting. (A) Nanoparticle tracking analysis (NTA) was used to measure the mean size distribution and undiluted particle concentration of Evs. from three patients. (B) Transmission electron microscopy images of EVs. Representative images are shown for the non-responder (NR), responder (R), and mixed-responder (MR). Scale bar, 200 nm. (C) Representative images of Western blotting analysis from plasma Evs. (SEC pooled fractions and ultracentrifugation (UC)) and whole cell lysate of breast cancer cell line MDA-MB-231. (DF) Line graphs were plotted to compare particle concentration and level of cancer biomarker CA 15.3.
Membranes 11 00880 g002
Figure 3. Cellular and biological pathways that are over-represented among extracellular vesicle associated proteins. EVs/exosomes were the most enriched cellular components (A) whereas various forms of RNA processing were the most enriched biological pathways (B). The x axis on the left represents the percentage of proteins (blue bars) identified in our data set that are expressed or involved in each category. The x axis on the right represents the significance of this as log 10 (p-value) (yellow line). The red line represents the significance at p = 0.05 as a reference.
Membranes 11 00880 g003
Figure 4. Numerical comparison of extracellular vesicle associated protein abundance changes. Proteins whose abundance was increased or decreased in at least two of the three plasma samples assayed (Table 2 and Table 6) were compared between the responder and the non-responder. Proteins were considered as candidate EV associated proteins (A) or classical, high abundant plasma EV associated proteins (B).
Membranes 11 00880 g004
Figure 5. Candidate extracellular vesical associated proteins were able to discriminate the responder from the non-responder regardless of time assayed. (A) Unit variance scaling and SVD with imputation was used to calculate principal components. X and Y axis show principal component 1 and principal component 2 that explain 60.6% and 15.9% of the total variance, respectively. (B) Euclidean clustering distance and Ward clustering method were used to generate the heatmap. Temporal samples from the responder (green) or the non-responder (red) grouped closely with each other. NR, non-responder; MR, mixed-responder; R, responder.
Membranes 11 00880 g005
Figure 6. Kaplan Meier analyses showing the relationship between survival and breast tissue tumoral expression of EV associated proteins.
Membranes 11 00880 g006
Figure 7. Complement associated extracellular vesical proteins were able to discriminate the responder from the non-responder regardless of time assayed. (A) Unit variance scaling and SVD with imputation was used to calculate principal components. X and Y axis show principal component 1 and principal component 2 that explain 48.7% and 21.7% of the total variance, respectively. (B) Euclidean clustering distance and Ward clustering method were used to generate the heatmap. Temporal samples from the responder (green) or the non-responder (red) grouped closely with each other.
Membranes 11 00880 g007
Table 1. Clinical information of three breast cancer patients used to identify markers of disease using extracellular vesicles isolated from blood samples.
ResponderNon-ResponderMixed-Responder
Age656869
SexFemaleFemaleFemale
Cancer StagingIVIVIV
HistopathologyIDC, grade 2IDC, grade 3IDC, grade 3
Receptor statusER positive
PR positive
HER2 non-amplified
ER positive
PR positive
HER2 non-amplified
ER 100% positive
PR 10% positive
HER2 non-amplified
TreatmentEndocrine treatment
Chemotherapy
Endocrine treatmentChemotherapy
Radiotherapy
ResponseResponse at all time pointsProgression at all time pointsResponse then progression
Table 2. Patterns of extracellular vesical associated proteins changed in abundance over time.
IncreaseDecreaseNo Change
Clinical Response 1–2 1–3 2–3 Overlap ≥ 2 Time Points 1–2 1–3 2–3 Overlap ≥ 2 Time Points 1–2 1–3 2–3 Overlap ≥ 2 Time Points
Non-Responder2556452121258135828088
Responder6133343024145411641026159
Mixed Responder4538153560533048445810461
Table 3. Extracellular vesical associated proteins that are increased in abundance in the responder.
Non-ResponderResponder
Raw AbundanceFold ChangeRaw AbundanceFold Change
AccessionDescriptionNR1NR2NR3NR1:2NR1:3NR2:3R1R2R3R1:2R1:3R2:3
P04406Glyceraldehyde-3-phosphate dehydrogenase 226.388.3184.80.3900.8172.09331.6147.948.94.6801.5470.331
Q6FI13Histone H2A type 2-A 153.648.91870.3181.2173.82430.2140.483.44.6492.7620.594
Q13201Multimerin-1 13257.195.30.4330.7221.6699238.4215.90.4172.3475.622
P32119Peroxiredoxin-2 122.493.989.90.7670.7340.95710.4150.518.614.4711.7880.124
P11277Spectrin beta chain 198.9108.9142.80.5480.7181.31134.2123.2143.23.6024.1871.162
Table 4. Extracellular vesical associated proteins that are decreased in abundance in the non-responder.
Non-ResponderResponder
Raw AbundanceFold ChangeRaw AbundanceFold Change
AccessionDescriptionNR1NR2NR3NR1:2NR1:3NR2:3R1R2R3R1:2R1:3R2:3
Q96H78Solute carrier family 25 member 44 299.490.81150.3030.3841.26782.744.978.70.5430.9521.753
P27169Paraoxonase/arylesterase 1141.7141.3870.9970.6140.61695.55896.10.6071.0061.657
Q96Q89Kinesin-like protein KIF20B101.523261.52.2860.6060.26520565.8155.20.3210.7572.359
P20851C4b-binding protein beta chain136.3130.554.20.9570.3980.415150.753.4101.50.3540.6741.901
Q8WZ42Titin 151.866.794.10.4390.6201.41154.1113.5141.42.0982.6141.246
P02730Band 3 anion transport protein 175.590.676.30.5160.4350.84259.688.1109.91.4781.8441.247
P08697Alpha-2-antiplasmin 135.4114.571.30.8460.5270.623119.8125.493.51.0470.7800.746
Table 5. Extracellular vesical associated proteins that are increased in abundance in the non-responder.
Non-ResponderResponder
Raw AbundanceFold ChangeRaw AbundanceFold Change
AccessionDescriptionNR1NR2NR3NR1:2NR1:3NR2:3R1R2R3R1:2R1:3R2:3
O43866CD5 antigen-like 69.179.9184.81.1562.6742.31372.5231.294.63.1891.3050.409
O60814Histone H2B type 1-K 125.863323.20.5012.5695.13034.5172.447.74.9971.3830.277
P02751Fibronectin 64.380.5126.21.2521.9631.56860.9139.678.42.2921.2870.562
P04075Fructose-bisphosphate aldolase A 64.681.3266.41.2594.1243.27785.2259.574.53.0460.8740.287
P06681Complement C2 95.878.9189.80.8241.9812.40688.5200.164.62.2610.7300.323
P06703Protein S100-A6 82.8111291.11.3413.5162.62358.3183.363.53.1441.0890.346
P07358Complement component C8 beta chain 58.454.4128.90.9322.2072.369122.9280.1154.82.2791.2600.553
P12109Collagen alpha-1(VI) chain 6461.1104.50.9551.6331.71095.6217.3114.12.2731.1940.525
P14618Pyruvate kinase PKM 60.972.4212.11.1893.4832.93064.5156.1912.4201.4110.583
P14625Endoplasmin 85.889.8223.61.0472.6062.49053.7189.756.13.5331.0450.296
P55201Peregrin 2.52.24.80.8801.9202.1823.56.44.01.8291.1430.625
P62937Peptidyl-prolyl cis-trans isomerase A 8175.5235.30.9322.9053.11760.3156.989.92.6021.4910.573
P62979Ubiquitin-40S ribosomal protein S27a 6866.1124.20.9721.8261.87992.5174.3110.41.8841.1940.633
P68431Histone H3.1 54.260.9263.41.1244.8604.32548.6174.564.33.5911.3230.368
Q13093Platelet-activating factor acetylhydrolase 97.689.6189.40.9181.9412.11489215.293.12.4181.0460.433
Q8TCU4Alstrom syndrome protein 1 72.482.1235.41.1343.2512.86772.2282.685.83.9141.1880.304
Q9NZR1Tropomodulin-2 63.949.3604.30.7729.45712.25827.3175.810.66.4400.3880.060
P08670Vimentin 101.559.9316.70.5903.1205.28731.8184.919.25.8140.6040.104
P23142Fibulin-1 115.9115.9204.11.0001.7611.76152.7127.135.02.4120.6640.275
P23528Cofilin-1 41.854229.91.2925.5004.25771.7101.781.91.4181.1420.805
P68363Tubulin alpha-1B chain 58.172.5252.91.2484.3533.488100.276.5105.40.7631.0521.378
Q9BWP8Collectin-11 85.282.1193.50.9642.2712.35791132.997.91.4601.0760.737
Table 6. Patterns of classical, high abundant extracellular vesical associated proteins that changed in abundance over time.
IncreaseDecreaseNo Change
Clinical Response 1–2 1–3 2–3 Overlap ≥ 2 Time Points 1–2 1–3 2–3 Overlap ≥ 2 Time Points 1–2 1–3 2–3 Overlap ≥ 2 Time Points
Non-Responder1120160637352120808665
Responder4730400321748058904929
Mixed-Responder3350242472975575810611
Publisher’s Note: MDPI stays neutral with regard to jurisdictional claims in published maps and institutional affiliations.

