Structural, Morphological, Electrical and Electrochemical Properties of PVA: CS-Based Proton-Conducting Polymer Blend Electrolytes

Abstract
1. Introduction
2. Experimental Details
2.1. Materials and Sample Preparation
2.2. SEM and XRD Study
2.3. Electrical Impedance Spectroscopy (EIS)
2.4. Transference Number Measurement (TNM)
2.5. Linear Sweep Voltammetry (LSV) Study
3. Results and Discussion
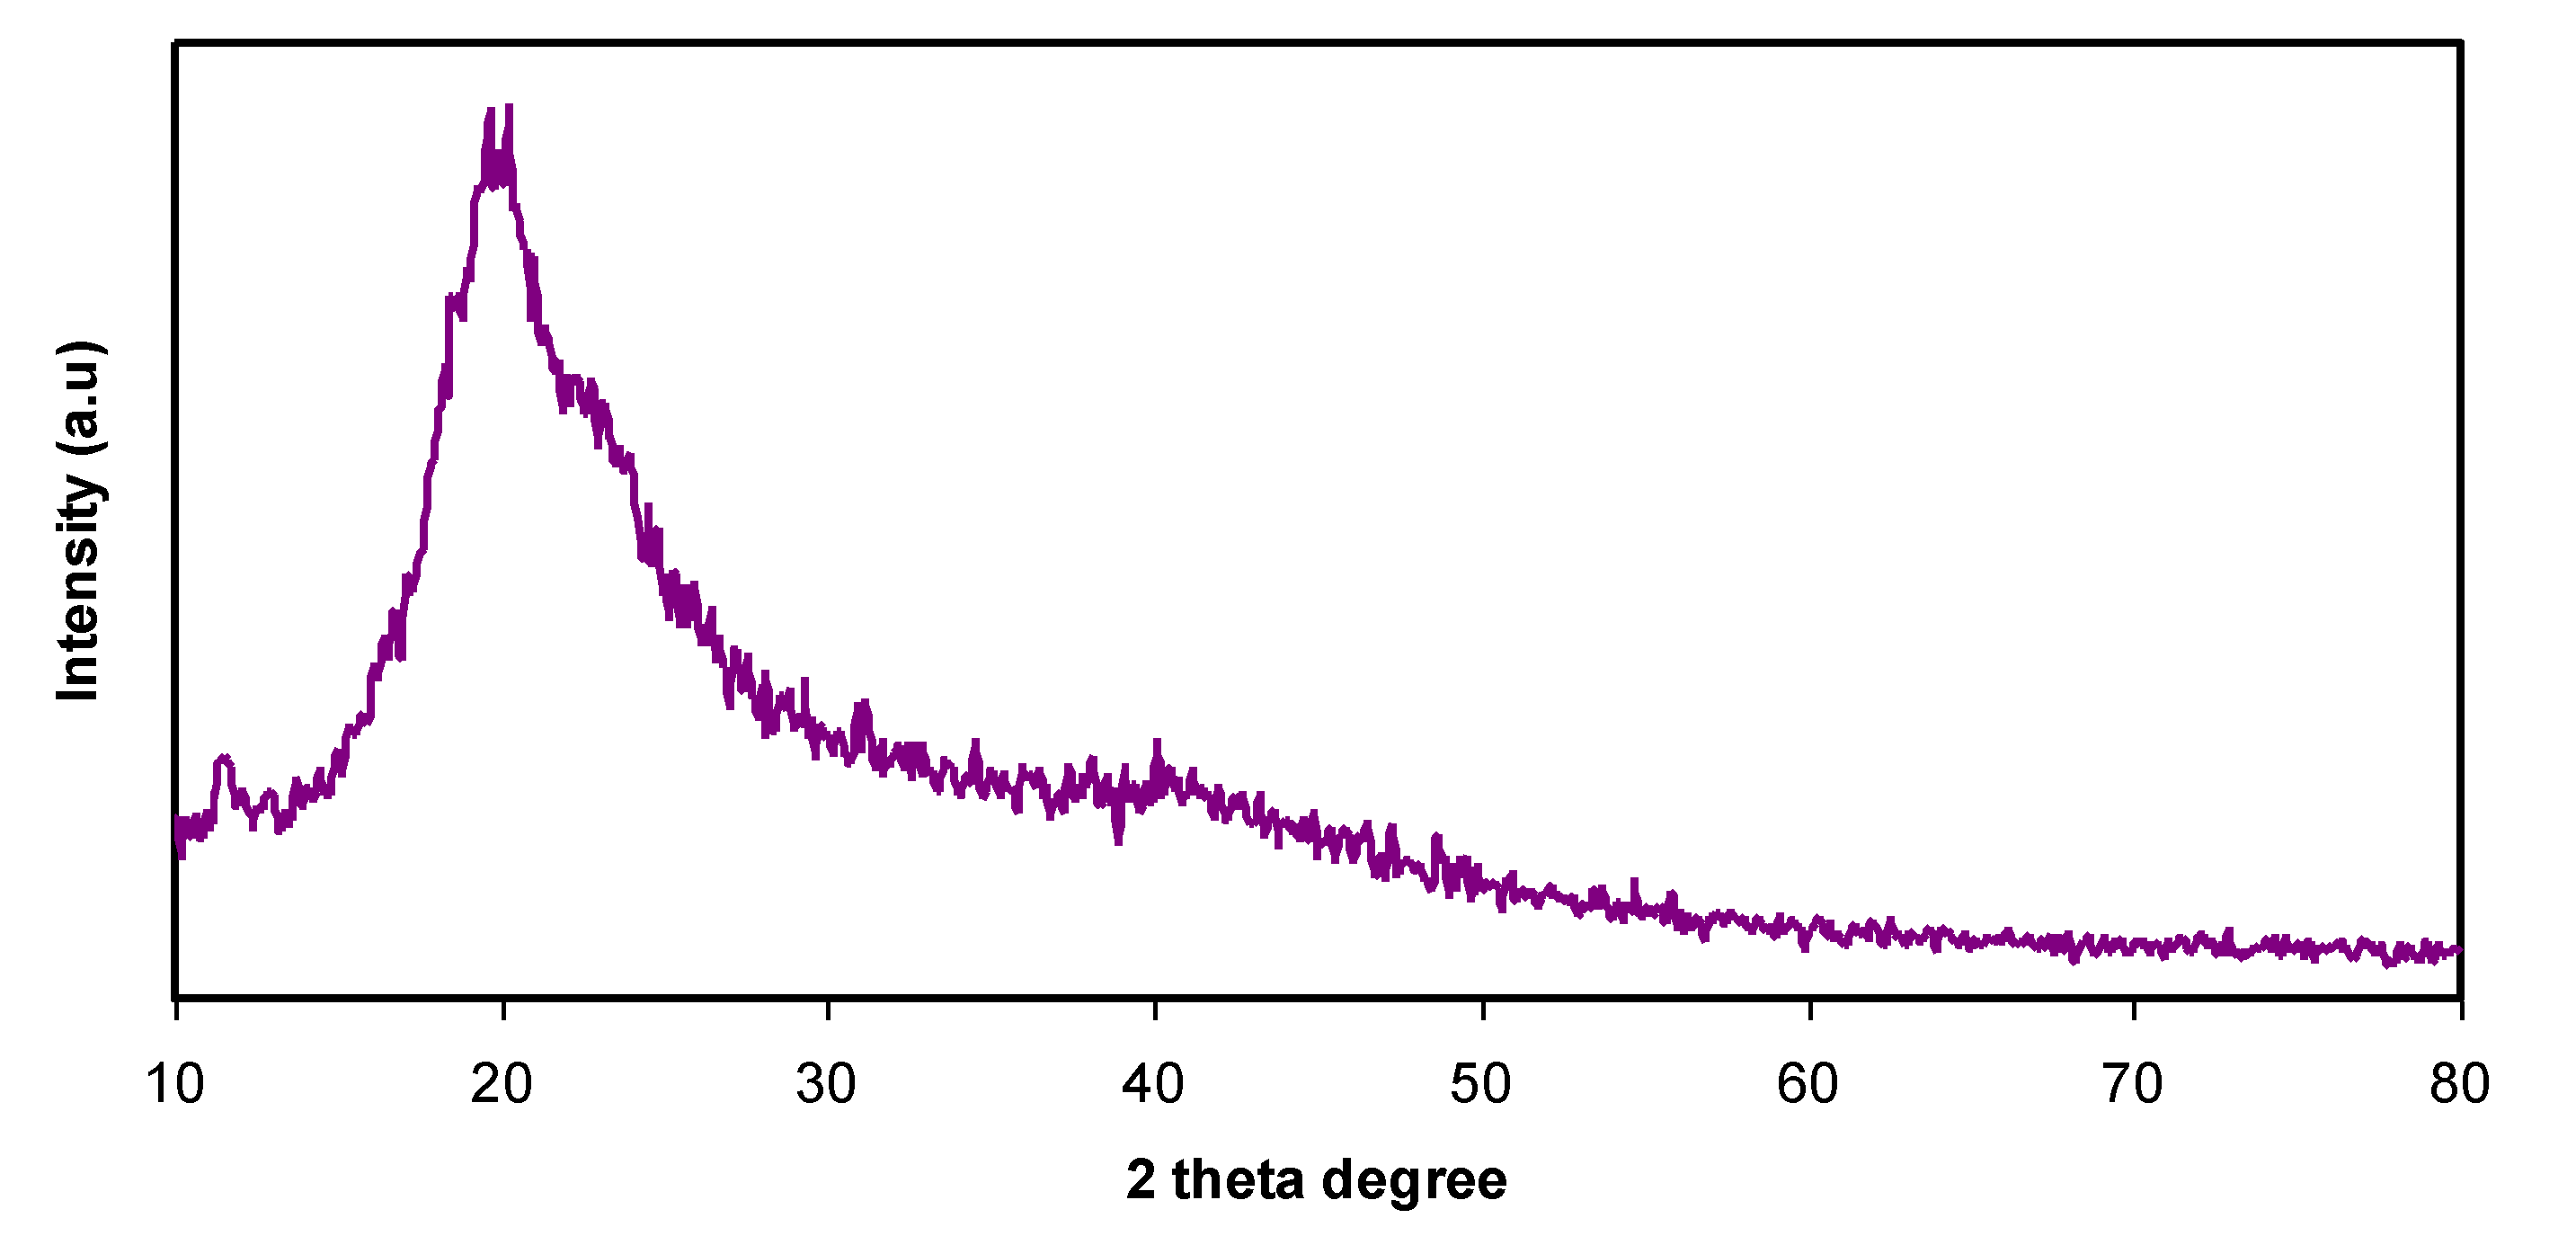
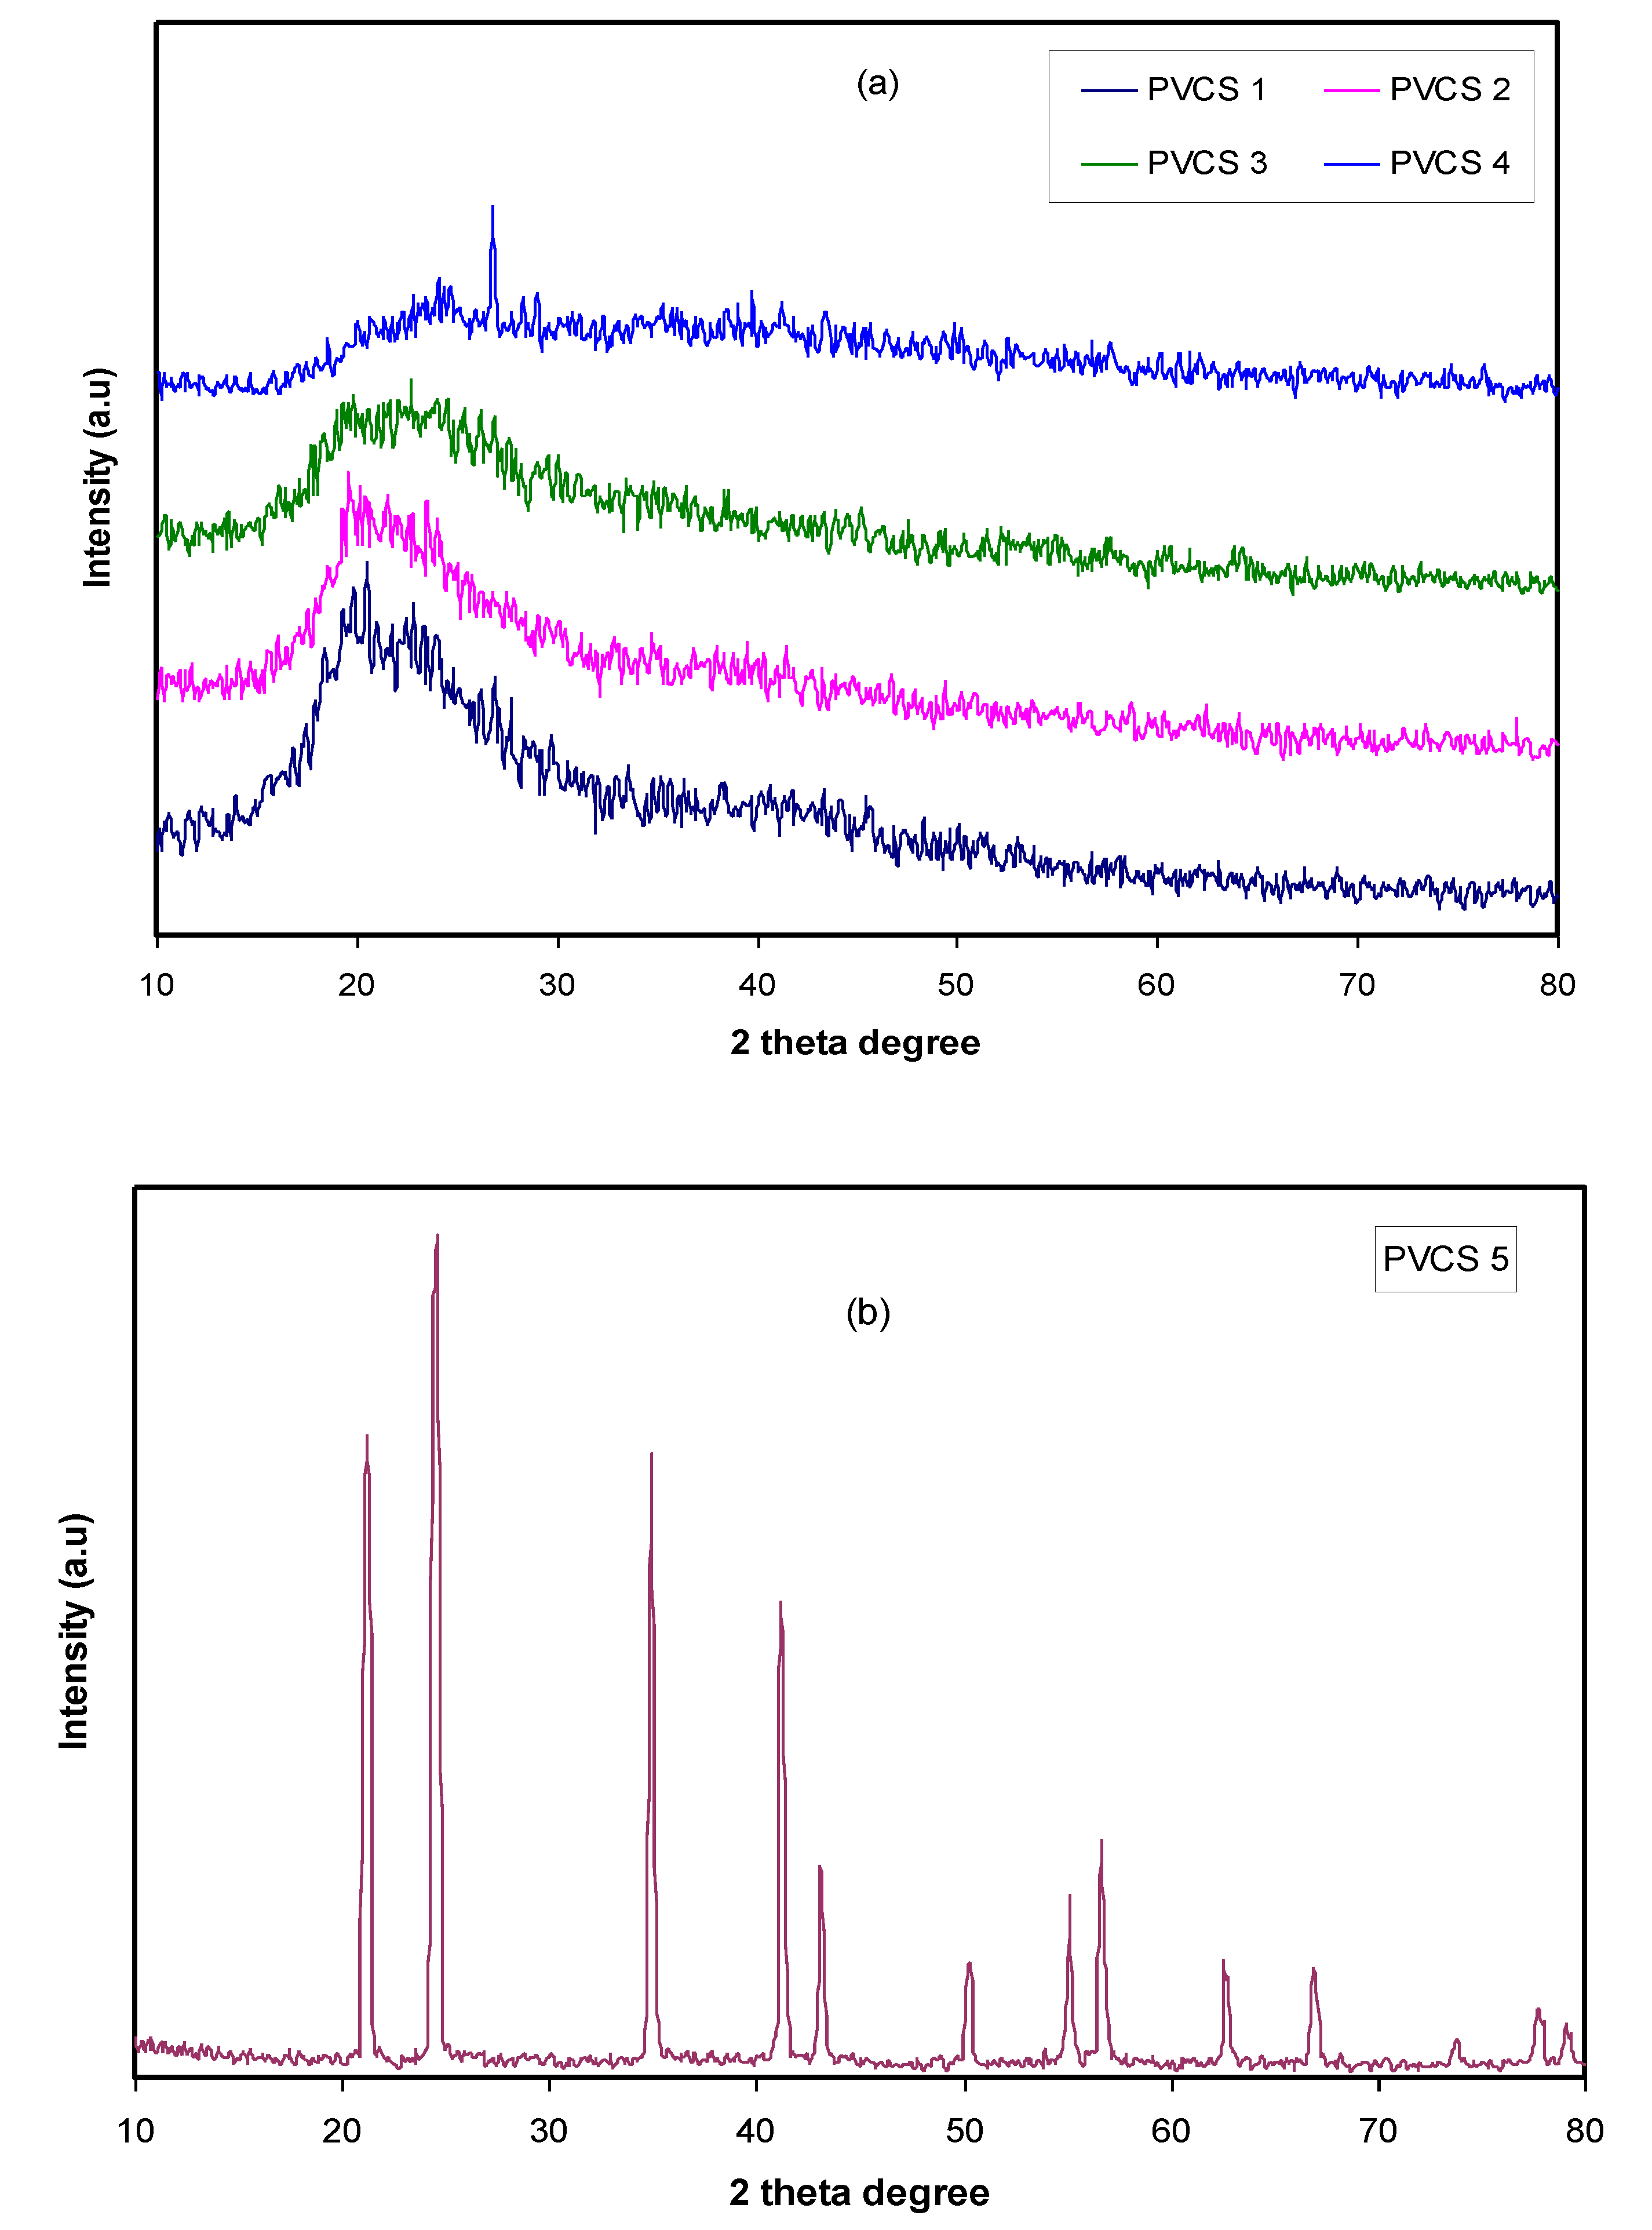
3.1. Structural Study
3.2. Morphological Study
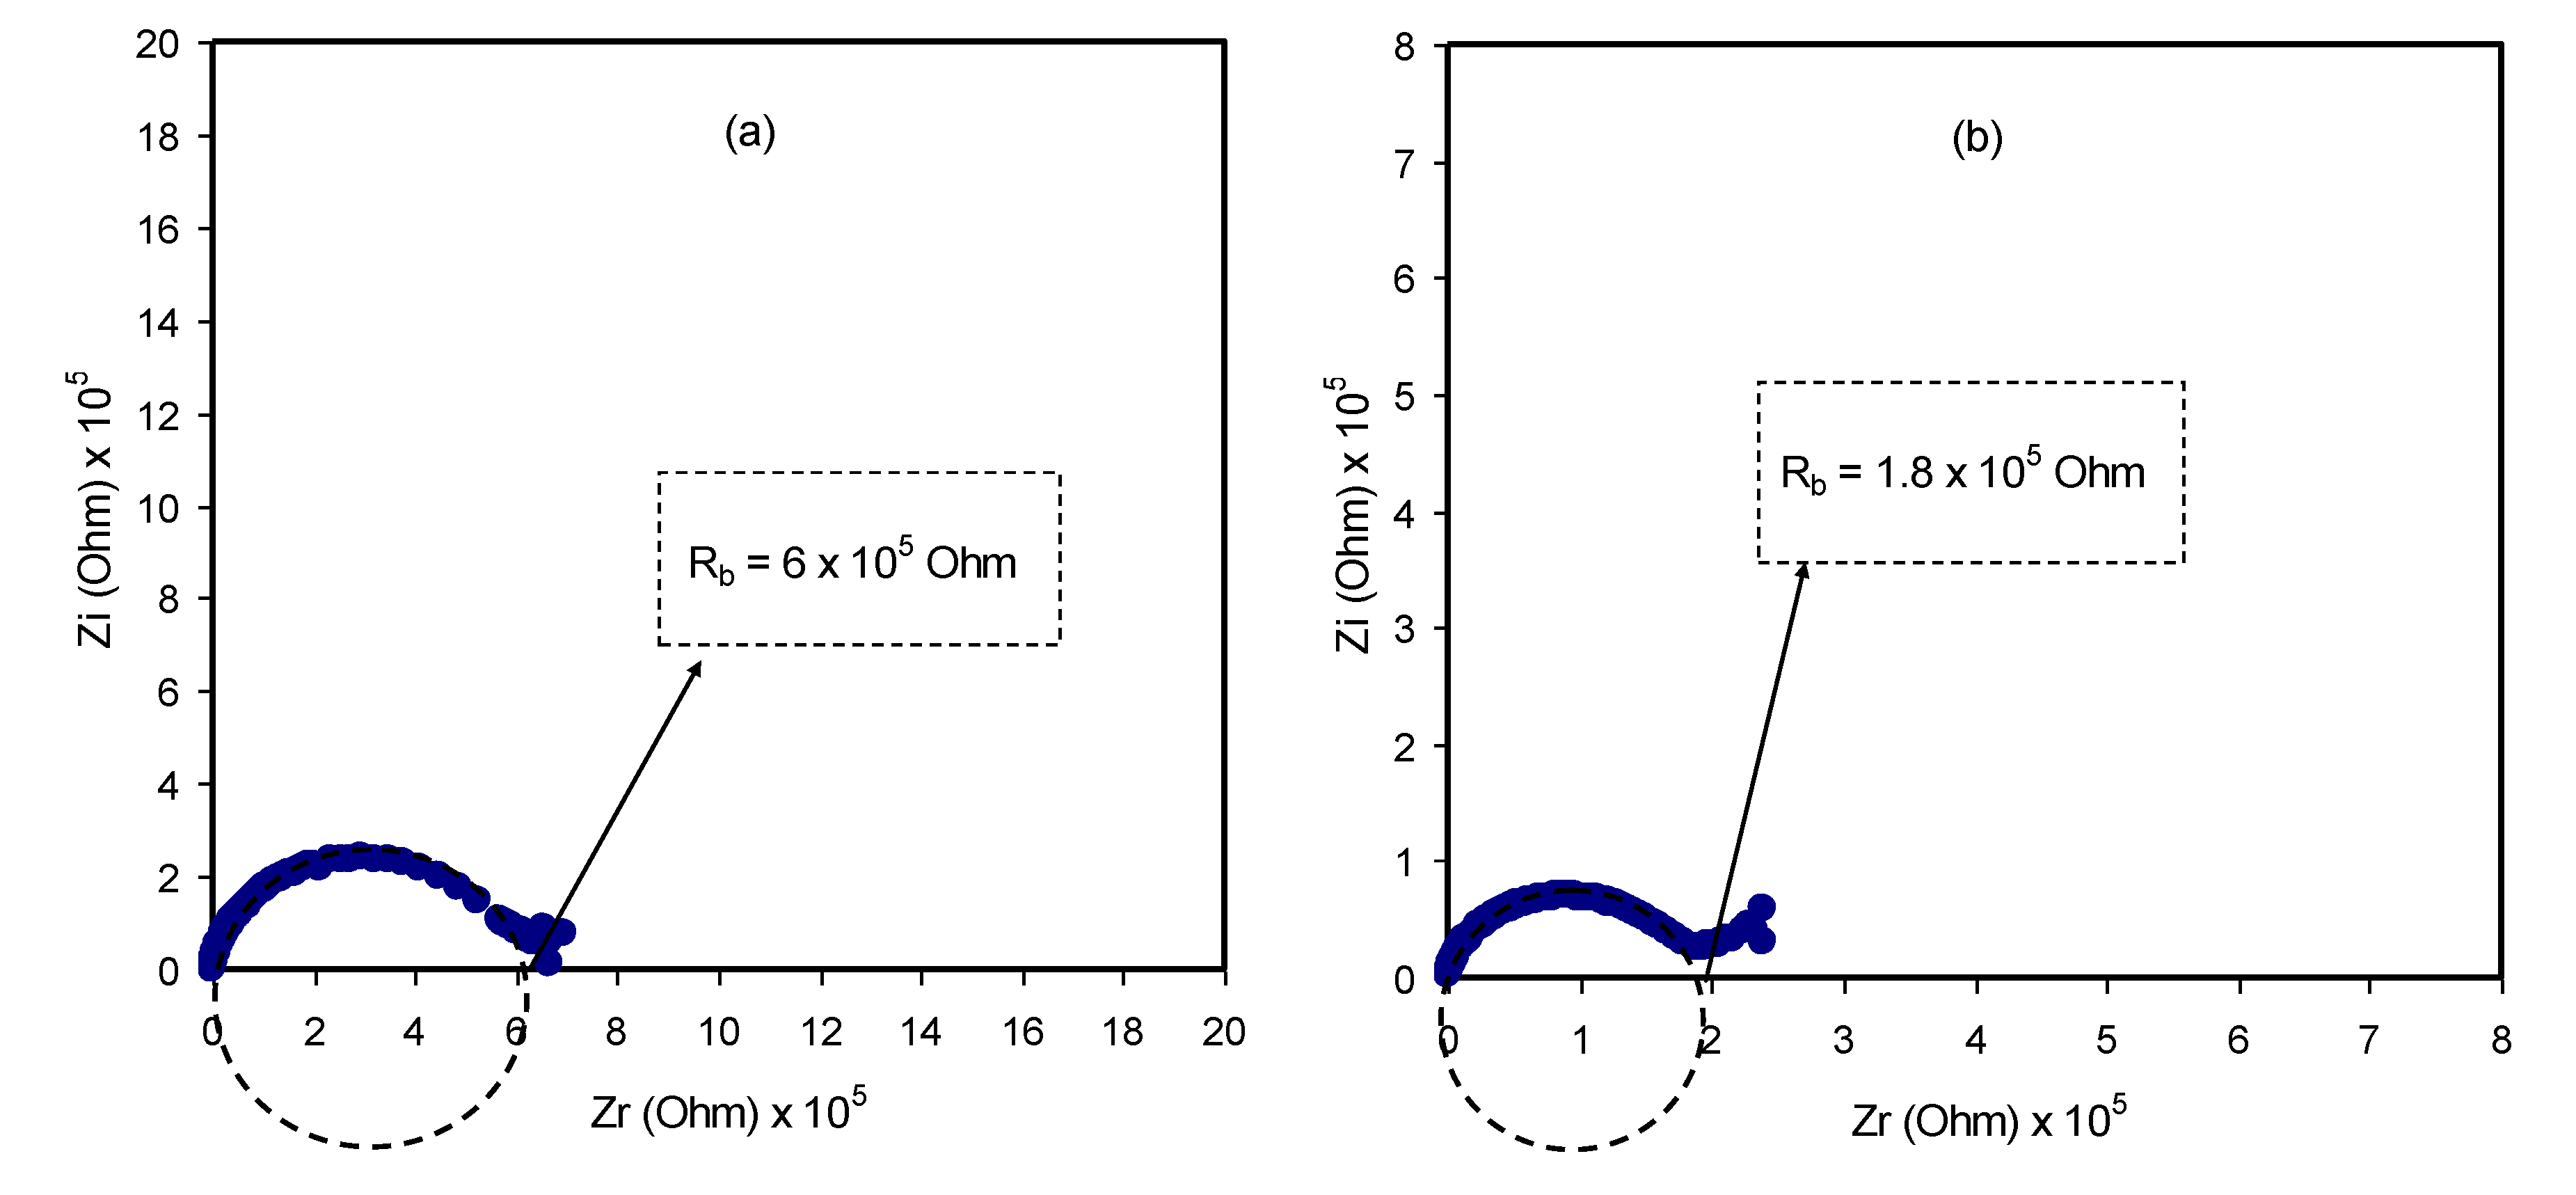
3.3. Impedance and AC Conductivity Study
3.4. Study of Dielectric Properties
3.5. Electrochemical Characteristics
3.5.1. TNM Measurement
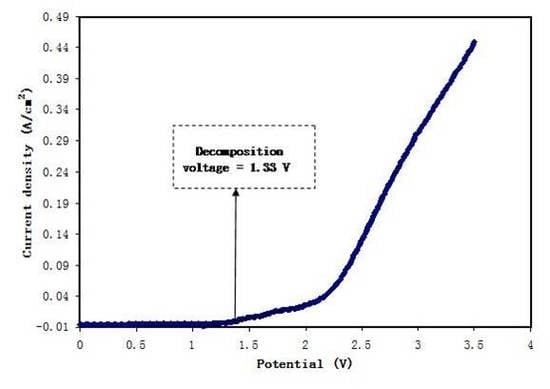
3.5.2. Linear Sweep Voltammetry (LSV) Studies
4. Conclusions
Author Contributions
Funding
Acknowledgments
Conflicts of Interest
References
- Shukur, M.F.; Yusof, Y.M.; Zawawi, S.M.M.; Illias, H.A.; Kadir, M.F.Z. Conductivity and transport studies of plasticized chitosan-based proton conducting biopolymer electrolytes. Phys. Scr. 2013, 157, 014050. [Google Scholar] [CrossRef]
- Aziz, S.B.; Woo, T.J.; Kadir, M.F.Z.; Ahmed, H.M. A conceptual review on polymer electrolytes and ion transport models. J. Sci. Adv. Mater. Devices 2018, 3, 1–17. [Google Scholar] [CrossRef]
- Aziz, S.B.; Hamsan, M.H.; Ranjdar, M.; Abdullah, M.F.Z.; Kadir, A. Promising polymer blend electrolytes based on chitosan: Methyl cellulose for EDLC application with high specific capacitance and energy density. Molecules 2019, 24, 2503. [Google Scholar] [CrossRef]
- Hamsan, M.H.; Aziz, S.B.; Azha, M.A.S.; Azli, A.A.; Shukur, M.F. YusnizaMohdYusof, Saifful Kamaluddin Muzakir, Ninie SA Manan, MohdFakhrulZamaniKadir, Solid-state double layer capacitors and protonic cell fabricated with dextran from Leuconostocmesenteroides based green polymer electrolyte. Mater. Chem. Phys. 2020, 241, 122290. [Google Scholar] [CrossRef]
- Aziz, N.A.; Majid, S.R.; Arof, A.K. Synthesis and characterizations of phthaloyl chitosan-based polymer electrolytes. J. Non Cryst. Solids 2012, 358, 1581–1590. [Google Scholar] [CrossRef]
- Alipoori, S.; Mazinani, S.; Aboutalebi, S.H.; Sharif, F. Review of PVA-based gel polymer electrolytes in flexible solid-statesupercapacitors: Opportunities and challenges. J. Energy Storage 2020, 27, 101072. [Google Scholar] [CrossRef]
- Sunitha, V.R.; Kabbur, S.K.M.; Pavan, G.S.; Sandesh, N.; Suhas, M.R.; Lalithnarayan, C.; Laxman, N.; Radhakrishnan, S. Lithium ion conduction in PVA-based polymer electrolyte system modified with combination of nanofillers. Ionics 2019, 26, 823–829. [Google Scholar] [CrossRef]
- Guo, D.; Xiao, Y.; Li, T.; Zhou, Q.; Shen, L.; Li, R.; Xu, Y.; Lin, H. Fabrication of high-performance composite nanofiltration membranes for dye wastewater treatment: Mussel-inspired layer-by-layer self-assembly. J. Colloid Interface Sci. 2020, 560, 2732–2783. [Google Scholar] [CrossRef]
- Zhang, Y.; Cheng, X.; Jiang, X.; Urban, J.J.; Lau, C.H.; Liu, S.; Shao, L. Robust natural nanocomposites realizing unprecedented ultrafast precise molecular separations. Mater. Today 2020. [Google Scholar] [CrossRef]
- Wang, J.; Zhao, Z.; Song, S.; Ma, Q.; Liu, R. High Performance Poly (vinyl alcohol)-Based Li-IonConducting Gel Polymer Electrolyte Films for Electric Double-Layer Capacitors. Polymers 2018, 10, 1179. [Google Scholar] [CrossRef]
- Aziz, S.B. Modifying poly (vinyl alcohol) (PVA) from insulator to small-bandgap polymer: A novel approach for organic solar cells and optoelectronic devices. J. Electron. Mater. 2016, 45, 736–745. [Google Scholar] [CrossRef]
- Yan, L.; Yang, X.; Long, J.; Cheng, X.; Pan, D.; Huang, Y.; Shao, L. Universal unilateral electro-spinning/spraying strategy to construct water-unidirectional Janus membranes with well-tuned hierarchical micro/nanostructures. Chem. Commun. 2020, 56, 478–481. [Google Scholar] [CrossRef]
- Ramaswamy, M.; Malayandi, T.; Subramanian, S.; Srinivasalu, J.; Rangaswamy, M.; Soundararajan, V. Development and Study of Solid Polymer Electrolyte Based on Polyvinyl Alcohol: Mg(ClO4)2. Polym. Plast. Technol. Eng. 2017, 56, 992–1002. [Google Scholar] [CrossRef]
- Shujahadeen, B.A.; Hamsan, M.H.; Kadir, M.F.Z.; Woo, H.J. Design of polymer blends based on chitosan: POZ with improved dielectric constant for application in polymer electrolytes and flexible electronics. Adv. Polym. Technol. 2020, 2020, 8586136. [Google Scholar] [CrossRef]
- Aziz, S.B. Role of dielectric constant on ion transport: Reformulated Arrhenius equation. Adv. Mater. Sci. Eng. 2016, 2016. [Google Scholar] [CrossRef]
- Aziz, S.B.; Abidin, Z.H.Z. Electrical conduction mechanism in solid polymer electrolytes: New concepts to arrhenius equation. J. Soft Matter 2013, 2013, 8. [Google Scholar] [CrossRef]
- Ikram, S.; Ahmed, S.; Ali, S.W.; Agarwal, H. Chitosan-Based Polymer Electrolyte Membranes for Fuel Cell Applications. In Composite Polymer Electrolyte Membranes Organic-Inorganic; Inamuddin, D., Mohammad, A., Asiri, A., Eds.; Springer: Cham, Switzerland, 2017. [Google Scholar] [CrossRef]
- Gunawan, I.; Sugeng, B. Synthesis and characterization of PVA blended LiClO4 as electrolyte material for battery Li-ion. In Proceedings of the IOP Conference Series: Materials Science and Engineering, Busan, Korea, 25–27 August 2017; Volume 223, p. 012039. [Google Scholar] [CrossRef]
- Aziz, S.B.; Brza, M.A.; Mishra, K.; Hamsan, M.H.; Karim, W.O.; Abdullah, R.M.; Abdulwahid, R.T. Fabrication of high performance energy storage EDLC device from proton conducting methylcellulose: Dextran polymer blend electrolytes. J. Mater. Res. Technol. 2019, 2020, 1137–1150. [Google Scholar] [CrossRef]
- Prajapati, G.K.; Roshan, R.; Gupta, P.N. Effect of plasticizer on ionic transport and dielectric properties of PVA–H3PO4 proton conducting polymeric electrolytes. J. Phys. Chem. Solids 2010, 71, 1717–1723. [Google Scholar] [CrossRef]
- Gao, H.; Lian, K. Proton-conducting polymer electrolytes and their applications in solid supercapacitors: A review. R. Soc. Chem. 2014, 4, 33091–33113. [Google Scholar] [CrossRef]
- Jonson, D.A. Some Thermodynamic Aspects of inorganic Chemistry, 2nd ed.; Cambridge University Press: Cambridge, UK, 1982; ISBN 0521242045. [Google Scholar]
- Aziz, S.B.; Abidin, Z.H.Z.; Arof, A.K. Effect of silver nanoparticles on the DC conductivity in chitosan–silver triflate polymer electrolyte. Phys. B Condens. Matter 2010, 405, 4429–4433. [Google Scholar] [CrossRef]
- Aziz, S.B.; Hamsan, M.H.; Abdullah, R.M.; Abdulwahid, R.T.; Brza, M.A.; Marif, A.S.; Kadir, M.F.Z. Protonic EDLC Cell based on chitosan (CS): Methylcellulose (MC) Solid Polymer Blend Electrolytes. Ionics 2020. [Google Scholar] [CrossRef]
- Aziz, S.B. Li+ ion conduction mechanism in poly (ε-caprolactone)-based polymer electrolyte. Iran. Polym. J. 2013, 22, 877. [Google Scholar] [CrossRef]
- Aziz, S.B.; Abidin, Z.H.Z. Ion-transport study in nanocomposite solid polymer electrolytes based on chitosan: Electrical and dielectric analysis. J. Appl. Polym. Sci. 2015, 132, 41774. [Google Scholar] [CrossRef]
- Aziz, S.B. Occurrence of electrical percolation threshold and observation of phase transition in Chitosan(1-x):AgIx (0.05 ≤ x ≤ 0.2)-based ion-conducting solid polymer composites. Appl. Phys. A 2016, 122, 706. [Google Scholar] [CrossRef]
- Aziz, S.B.; Abidin, Z.H.Z. Electrical and morphological analysis of chitosan: AgTf solid electrolyte. Mater. Chem. Phys. 2014, 144, 2802–2886. [Google Scholar] [CrossRef]
- Abidin, Z.H.Z.; Kadir, M.F.Z. Innovative method to avoid the reduction of silver ions to silver nanoparticles in silver ion conducting based polymer electrolytes. Phys. Scr. 2015, 90, 3. [Google Scholar]
- Hamsan, M.H.; Shukur, M.F.; Aziz, S.B.; Kadir, M.F.Z. Dextran from leuconostocmesenteroides doped ammonium salt based green polymer electrolyte. Bull. Mater. Sci. 2019, 42, 57. [Google Scholar] [CrossRef]
- Aziz, S.B.; Abdullah, O.G.; Hussein, S.A. Role of Silver Salts Lattice Energy on Conductivity Drops in Chitosan Based Solid Electrolyte: Structural, Morphological and Electrical Characteristics. J. Electron. Mater. 2018, 47, 3800–3808. [Google Scholar] [CrossRef]
- Aziz, S.B.; Kadir, M.F.Z.; Abidin, Z.H.Z. Structural, morphological and Electrochemical Impedance Study of CS:LiTf based Solid Polymer Electrolyte:Reformulated Arrhenius Equation for Ion Transport Study. Int. J. Electrochem. Sci. 2016, 11, 9228–9244. [Google Scholar] [CrossRef]
- Yusuf, S.N.F.; Azzahari, A.D.; Yahya, R.; Majid, S.R.; Careem, M.A.; Arof, A.K. From crab shell to solar cell: A gel polymer electrolyte based on N-phthaloylchitosan and its application in dye-sensitized solar cells. RSC Adv. 2016, 6, 27714. [Google Scholar] [CrossRef]
- Shujahadeen, B.A.; Wrya, O.K.; Hewa, O.G. The deficiency of chitosan: AgNO3 polymer electrolyte incorporated with titanium dioxide filler for device fabrication and membrane separation technology. J. Mater. Res. Technol. 2020. [CrossRef]
- Aziz, S.B.; Abdullah, R.M.; Rasheed, M.A.; Ahmed, H.M. Role of ion dissociation on DC conductivity and silver nanoparticle formation in PVA:AgNt based polymer electrolytes: Deep insights to ion transport mechanism. Polymers 2017, 9, 338. [Google Scholar] [CrossRef]
- Aziz, S.B.; Rasheed, M.A.; Abidin, Z.H. Optical and electrical characteristics of silver ion conducting nanocomposite solid polymer electrolytes based on chitosan. J. Electron. Mater. 2017, 46, 6119. [Google Scholar] [CrossRef]
- Aziz, S.B. Morphological and optical characteristics of chitosan (1−x): Cuox (4≤ x≤ 12) based polymer nano-composites: Optical dielectric loss as an alternative method for tauc’s model. Nanomaterials 2017, 7, 444. [Google Scholar] [CrossRef]
- Monisha, S.; Mathavan, T.; Selvasekarapandian, S.; Benial, A.M.F.; Aristatil, G.; Mani, N.; Premalatha, M. Investigation of bio polymer electrolyte based on cellulose acetate-ammonium nitrate for potential use in electrochemical devices. Carbohyd. Polym. 2017, 157, 38–47. [Google Scholar] [CrossRef] [PubMed]
- Mobarak, N.N.; Ahmad, A.; Abdullah, M.P.; Ramli, N.; Rahman, M.Y.A. Conductivity enhancement via chemical modification of chitosan based green polymer electrolyte. Electrochim. Acta 2013, 92, 161–167. [Google Scholar] [CrossRef]
- Kadir, M.F.Z.; Majid, S.R.; Arof, A.K. Plasticized chitosan–PVA blend polymer electrolyte based proton battery. Electrochim. Acta 2010, 55, 1475–1482. [Google Scholar] [CrossRef]
- Aziz, S.B.; Abdullah, O.G.; Rasheed, M.A.; Ahmed, H.M. Effect of high salt concentration (HSC) on structural, morphological, and electrical characteristics of chitosan based solid polymer electrolytes. Polymers 2017, 9, 187. [Google Scholar] [CrossRef]
- Natesan, B.; Karan, N.K.; Katiyar, R.S. Ion relaxation dynamics and nearly constant loss behavior in polymer electrolyte. Phys. Rev. E 2006, 74, 042801. [Google Scholar] [CrossRef]
- Nasef, M.M.; Saidi, H.; Dahlan, K.Z.M. Preparation of composite polymer electrolytes by electron beam-induced grafting: Proton and lithium ion-conducting membranes. Nucl. Instrum. Methods Phys. Res. Sect. B Beam Interact. Mater. Atoms. 2007, 265, 168–172. [Google Scholar] [CrossRef]
- Dillip, K.; Pradhan, R.N.P.; Choudhary, B.K. Samantaray. Studies of structural, thermal and electrical behavior of polymer nanocomposite electrolytes. Express Polym. Lett. 2008, 2, 630–638. [Google Scholar]
- Fonseca, C.P.; Cavalcante, F.C., Jr.; Amaral, F.A.; Souza, C.A.Z.; Neves, S. Thermal and Conduction Properties of a PCL-biodegradable Gel Polymer Electrolyte with LiClO4, LiF3CSO3, and LiBF4 Salts. Int. J. Electrochem. Sci. 2007, 2, 52–63. [Google Scholar]
- Al-Muntaser, A.A.; Abdelghany, A.M.; Abdelrazek, E.M.; Elshahawy, A.G. Elshahawy, Enhancement of optical and electrical properties of PVC/PMMA blend films doped with Li4Ti5O12 nanoparticles. J. Mater. Res. Technol. 2020, 9, 789–797. [Google Scholar] [CrossRef]
- Hassib, H.; Razik, A.A. Dielectric properties and AC conduction mechanism for 5,7-dihydroxy-6-formyl-2-methylbenzo-pyran-4-one bis-schiff base. Solid State Commun. 2008, 147, 345–349. [Google Scholar] [CrossRef]
- Eliasson, H.; Albinsson, I.; Mellander, B.E. Conductivity and dielectric properties of AgCF3SO3-PPG. Mater. Res. Bull. 2000, 35, 1053–1065. [Google Scholar] [CrossRef]
- Salem, S.M. Effect of iron on the electrical properties of lead–bismuth glasses. J. Mater. Sci. 2009, 44, 5760–5767. [Google Scholar] [CrossRef]
- Das-Gupta, D.K. Molecular processes in polymer electrets. J. Electrost. 2001, 515, 159–166. [Google Scholar] [CrossRef]
- Shujahadeen, B.A.; Kadir, M.F.Z.; Hamsan, M.H.; Woo, H.J.; Brza, M.A. Development of Polymer Blends Based on PVA: POZ with Low Dielectric Constant for Microelectronic Applications. Sci. Rep. 2019, 9, 13163. [Google Scholar] [CrossRef]
- Aziz, S.B.; Abdullah, R.M. Crystalline and amorphous phase identification from the tanδ relaxation peaks and impedance plots in polymer blend electrolytes based on [CS: AgNt] x: PEO (x-1)(10≤ x ≤ 50). Electrochim. Acta 2018, 285, 30–46. [Google Scholar] [CrossRef]
- Kunanuruksapong, R.; Sirivat, A. Electrical properties and electrochemical responses of acrylic elastomers and styrene copolymers: Effects of temperature. Appl. Phys. A Mater. Sci. Process. 2008, 92, 313–320. [Google Scholar] [CrossRef]
- Ramya, C.S.; Selvasekarapandian, S.; Hirankumar, G.; Savitha, T.; Angelo, P.C. Investigation on dielectric relaxations of PVP–NH4SCN polymer electrolyte. J. Non-Cryst Solids 2008, 354, 1494–1502. [Google Scholar] [CrossRef]
- Jayathilaka, P.A.R.D.; Dissanayake, M.A.K.L.; Albinsson, I.; Mellander, B.E. Dielectric relaxation, ionic conductivity and thermal studies of the gel polymer electrolyte system PAN/EC/PC/LITFSI. Solid State Ion. 2003, 156, 179–195. [Google Scholar] [CrossRef]
- Khatri, P.; Behera, B.; Srinivas, V.; Choudhary, R.P.N. Structural and dielectric properties of Ba3V2O8 ceramics. Curr. Appl. Phys. 2009, 9, 515–519. [Google Scholar] [CrossRef]
- Aziz, S.B.; Al-Zangana, S.; Brza, M.A.; Saeed, S.R.; Abdulwahid, R.T.; Kadir, M.F.Z. Study of Dielectric Properties and Ion Transport Parameters in Chitosan-Barium Nitrate Based Solid Polymer Electrolytes. Int. J. Electrochem. Sci. 2019, 14, 11580–11595. [Google Scholar] [CrossRef]
- Aziz, S.B.; B Marif, R.; Brza, M.A.; Hamsan, M.H.; Kadir, M.F.Z. Employing of Trukhan Model to Estimate Ion Transport Parameters in PVA Based Solid Polymer Electrolyte. Polymers 2019, 11, 1694. [Google Scholar] [CrossRef]
- Aziz, S.B. The mixed contribution of ionic and electronic carriers to conductivity in chitosan based solid electrolytes mediated by CuNt salt. J. Inorg. Organomet. Polym. 2018, 28, 1942–1952. [Google Scholar] [CrossRef]
- Smaoui, H.; Mir, L.E.; Guermazi, H.; Agnel, S.; Toureille, A. Study of dielectric relaxations in zinc oxide-epoxy resin nanocomposites. J. Alloys Compd. 2009, 477, 316–321. [Google Scholar] [CrossRef]
- Belattar, J.; Graça MP, F.; Costa, L.C.; Achour, M.E.; Brosseau, C. Electric modulus-based analysis of the dielectric relaxation in carbon black loaded polymer composites. J. Appl. Phys. 2010, 107, 124111. [Google Scholar] [CrossRef]
- Pradhan, D.K.; Choudhary, R.N.P.; Samantaray, B.K. Studies of Dielectric Relaxation and AC Conductivity Behavior of Plasticized Polymer Nanocomposite Electrolytes. Int. J. Electrochem. Sci. 2008, 3, 597–608. [Google Scholar]
- Sengwa, R.J.; Choudhary, S.; Sankhla, S. Low frequency dielectric relaxation processes and ionic conductivity of montmorillonite clay nanoparticles colloidal suspension in poly(vinyl pyrrolidone)-ethylene glycol blends. Express Polym. Lett. 2008, 2, 800–809. [Google Scholar] [CrossRef]
- Aziz, S.B.; Karim, W.O.; Brza, M.A.; Abdulwahid, R.T.; Saeed, S.R.; Al-Zangana, S.; Kadir, M.F.Z. Ion Transport Study in CS: POZ Based Polymer Membrane Electrolytes Using Trukhan Model. Int. J. Mol. Sci. 2019, 20, 5265. [Google Scholar] [CrossRef]
- Aziz, S.B.; Abdullah, R.M.; Kadir, M.F.Z.; Ahmed, H.M. Non suitability of silver ion conducting polymer electrolytes based on chitosan mediated by barium titanate (BaTiO3) for electrochemical device applications. Electrochim. Acta 2019, 296, 494–507. [Google Scholar] [CrossRef]
- Aziz, S.B.; Hamsan, M.H.; Brza, M.A.; Kadir, M.F.Z.; Abdulwahid, R.T.; Ghareeb, H.O.; Woo, H.J. Fabrication of energy storage EDLC device based on CS: PEO polymer blend electrolytes with high Li+ ion transference number. Results Phys. 2019, 15, 102584. [Google Scholar] [CrossRef]
- Basha, S.; Rao, M.C. Spectroscopic and Electrochemical Properties of [PVA/PVP] : [MgCl26H2O] Blend Polymer Electrolyte Films. Int. J. Polym. Sci. 2018, 2018. [Google Scholar] [CrossRef]
- Ng, L.S.; Mohamad, A.A. Effect of temperature on the performance of proton batteries based on chitosan–NH4NO3–EC membrane. J. Membr. Sci. 2008, 325, 653–657. [Google Scholar] [CrossRef]
- Kadir, M.F.Z.; Arof, A.K. Application of PVA–chitosan blends polymer electrolyte membrane in electrical double layer capacitor. Mater. Res. Innov. 2013, 15, 217–220. [Google Scholar] [CrossRef]
- Aziz, S.B.; Brza, M.A.; Hamsan, M.H.; Kadir, M.F.Z.; Muzakir, S.K.; Abdulwahid, R.T. Effect of ohmic-drop on electrochemical performance of EDLC fabricated from PVA: Dextran: NH4I based polymer blend electrolytes. J. Mater. Res. Technol. 2020. [Google Scholar] [CrossRef]


| Sample Designation | (PVA:CS)(0.5:0.5) (g) | NH4Iwt.% |
|---|---|---|
| PVCS1 | 1 | 10 |
| PVCS2 | 1 | 20 |
| PVCS3 | 1 | 30 |
| PVCS4 | 1 | 40 |
| PVCS5 | 1 | 50 |
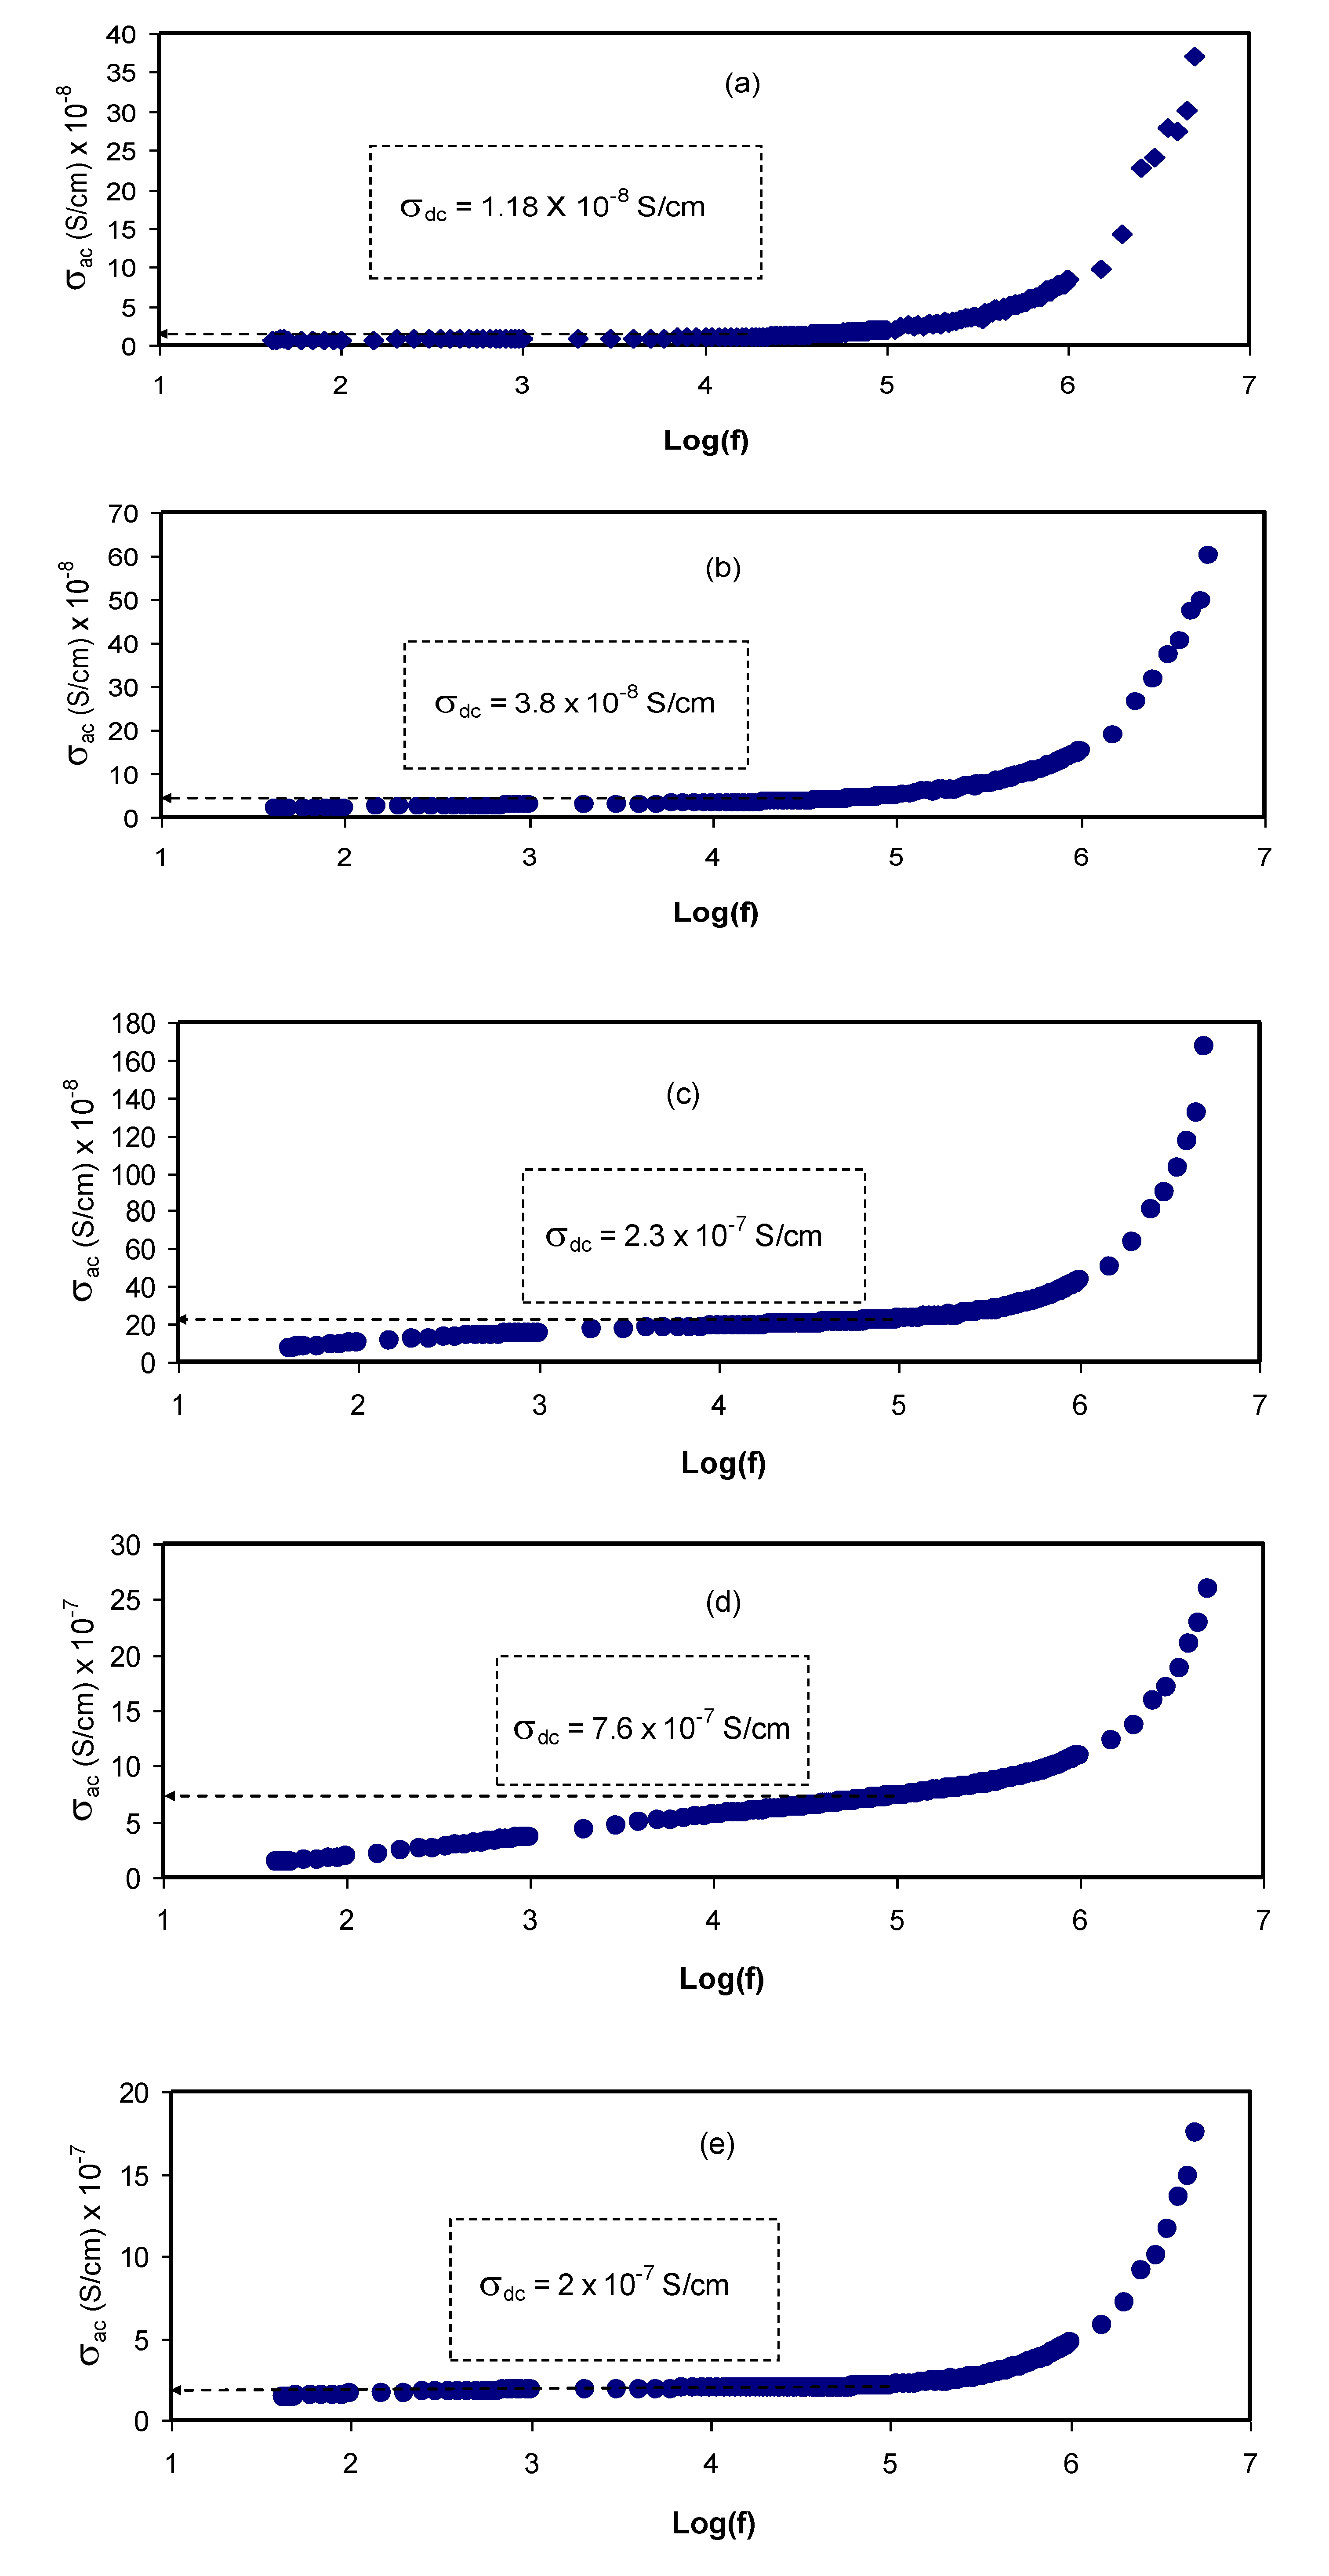
| Sample Designation | DC Conductivity (S/cm) (Using Equation (6)) | DC Conductivity (S/cm) (Using AC Plot) |
|---|---|---|
| PVCS1 | 1.13 × 10⁻⁸ | 1.18 × 10⁻⁸ |
| PVCS2 | 3.77 × 10⁻⁷ | 3.8 × 10⁻⁷ |
| PVCS3 | 2.51 × 10⁻⁷ | 2.3 × 10⁻⁷ |
| PVCS4 | 9.71 × 10⁻⁷ | 7.6 × 10⁻⁷ |
| PVCS5 | 2.72 × 10⁻⁷ | 2.0 × 10⁻⁷ |
| Sample | p1(rad) | p2(rad) | C1(F) | C2(F) |
|---|---|---|---|---|
| PVCS1 | 0.859 | - | 1.43 × 10⁻¹⁰ | - |
| PVCS2 | 0.71 | 0.8 | 3.33 × 10⁻¹⁰ | 1.05 × 10⁻⁶ |
| PVCS3 | 0.8 | 0.5 | 2.00 × 10⁻⁹ | 2.00 × 10⁻⁶ |
| PVCS4 | 0.78 | 0.42 | 5.00 × 10⁻⁹ | 4.35 × 10⁻⁶ |
| PVCS5 | 0.89 | 0.52 | 1.00 × 10⁻⁹ | 4.17 × 10⁻⁶ |
© 2020 by the authors. Licensee MDPI, Basel, Switzerland. This article is an open access article distributed under the terms and conditions of the Creative Commons Attribution (CC BY) license (http://creativecommons.org/licenses/by/4.0/).
Share and Cite
Shahab Marf, A.; M. Abdullah, R.; B. Aziz, S. Structural, Morphological, Electrical and Electrochemical Properties of PVA: CS-Based Proton-Conducting Polymer Blend Electrolytes. Membranes 2020, 10, 71. https://doi.org/10.3390/membranes10040071
Shahab Marf A, M. Abdullah R, B. Aziz S. Structural, Morphological, Electrical and Electrochemical Properties of PVA: CS-Based Proton-Conducting Polymer Blend Electrolytes. Membranes. 2020; 10(4):71. https://doi.org/10.3390/membranes10040071
Chicago/Turabian StyleShahab Marf, Ayub, Ranjdar M. Abdullah, and Shujahadeen B. Aziz. 2020. "Structural, Morphological, Electrical and Electrochemical Properties of PVA: CS-Based Proton-Conducting Polymer Blend Electrolytes" Membranes 10, no. 4: 71. https://doi.org/10.3390/membranes10040071
APA StyleShahab Marf, A., M. Abdullah, R., & B. Aziz, S. (2020). Structural, Morphological, Electrical and Electrochemical Properties of PVA: CS-Based Proton-Conducting Polymer Blend Electrolytes. Membranes, 10(4), 71. https://doi.org/10.3390/membranes10040071