Development of Porous and Flexible PTMC Membranes for In Vitro Organ Models Fabricated by Evaporation-Induced Phase Separation

 , , and
Abstract
1. Introduction
2. Materials and Methods
2.1. Materials
2.2. Poly(Trimethylene Carbonate) (PTMC) Synthesis
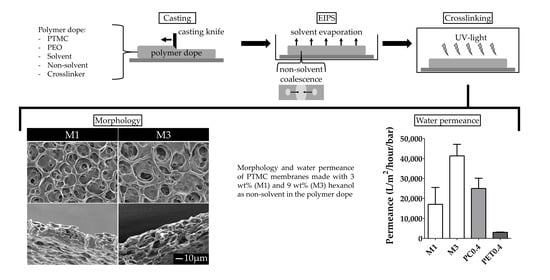
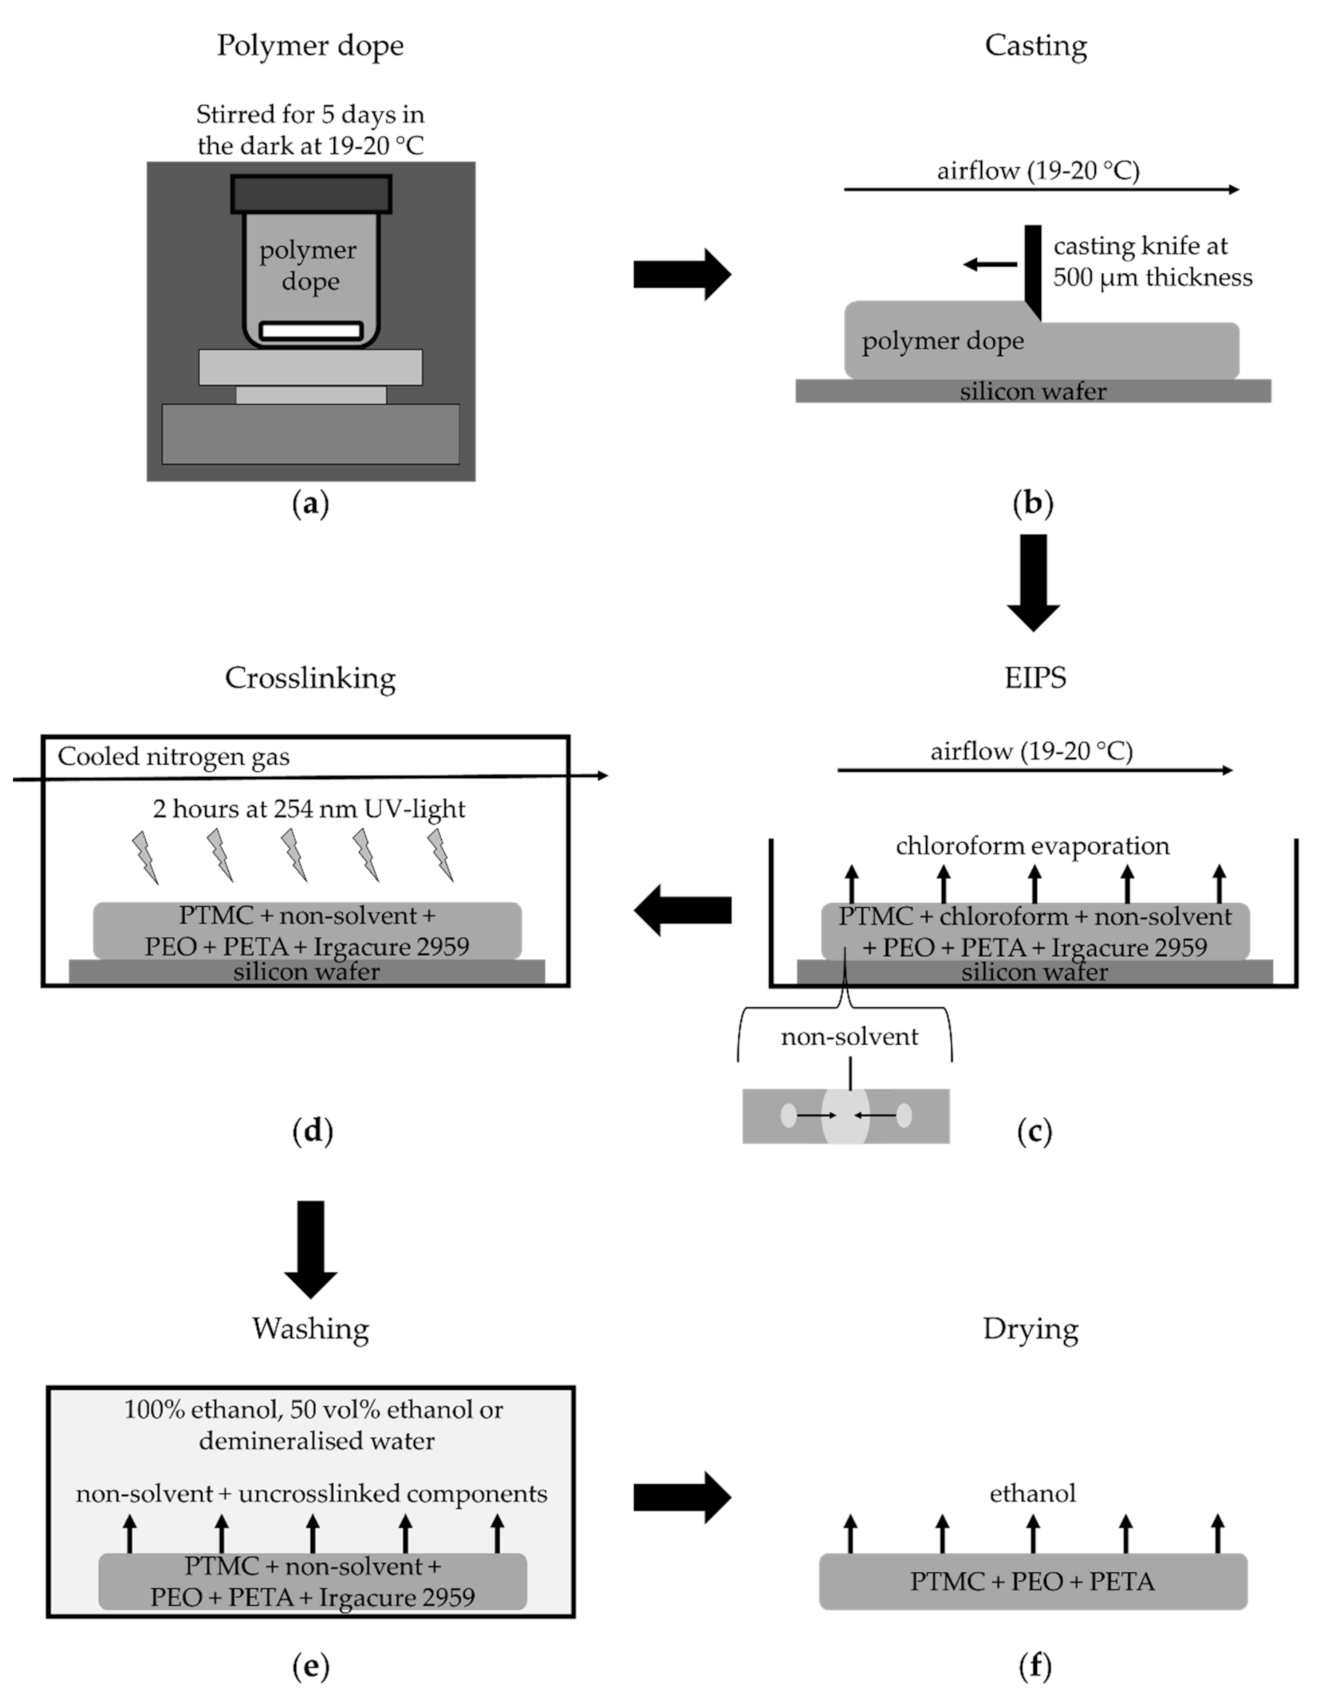
2.3. Membrane Fabrication
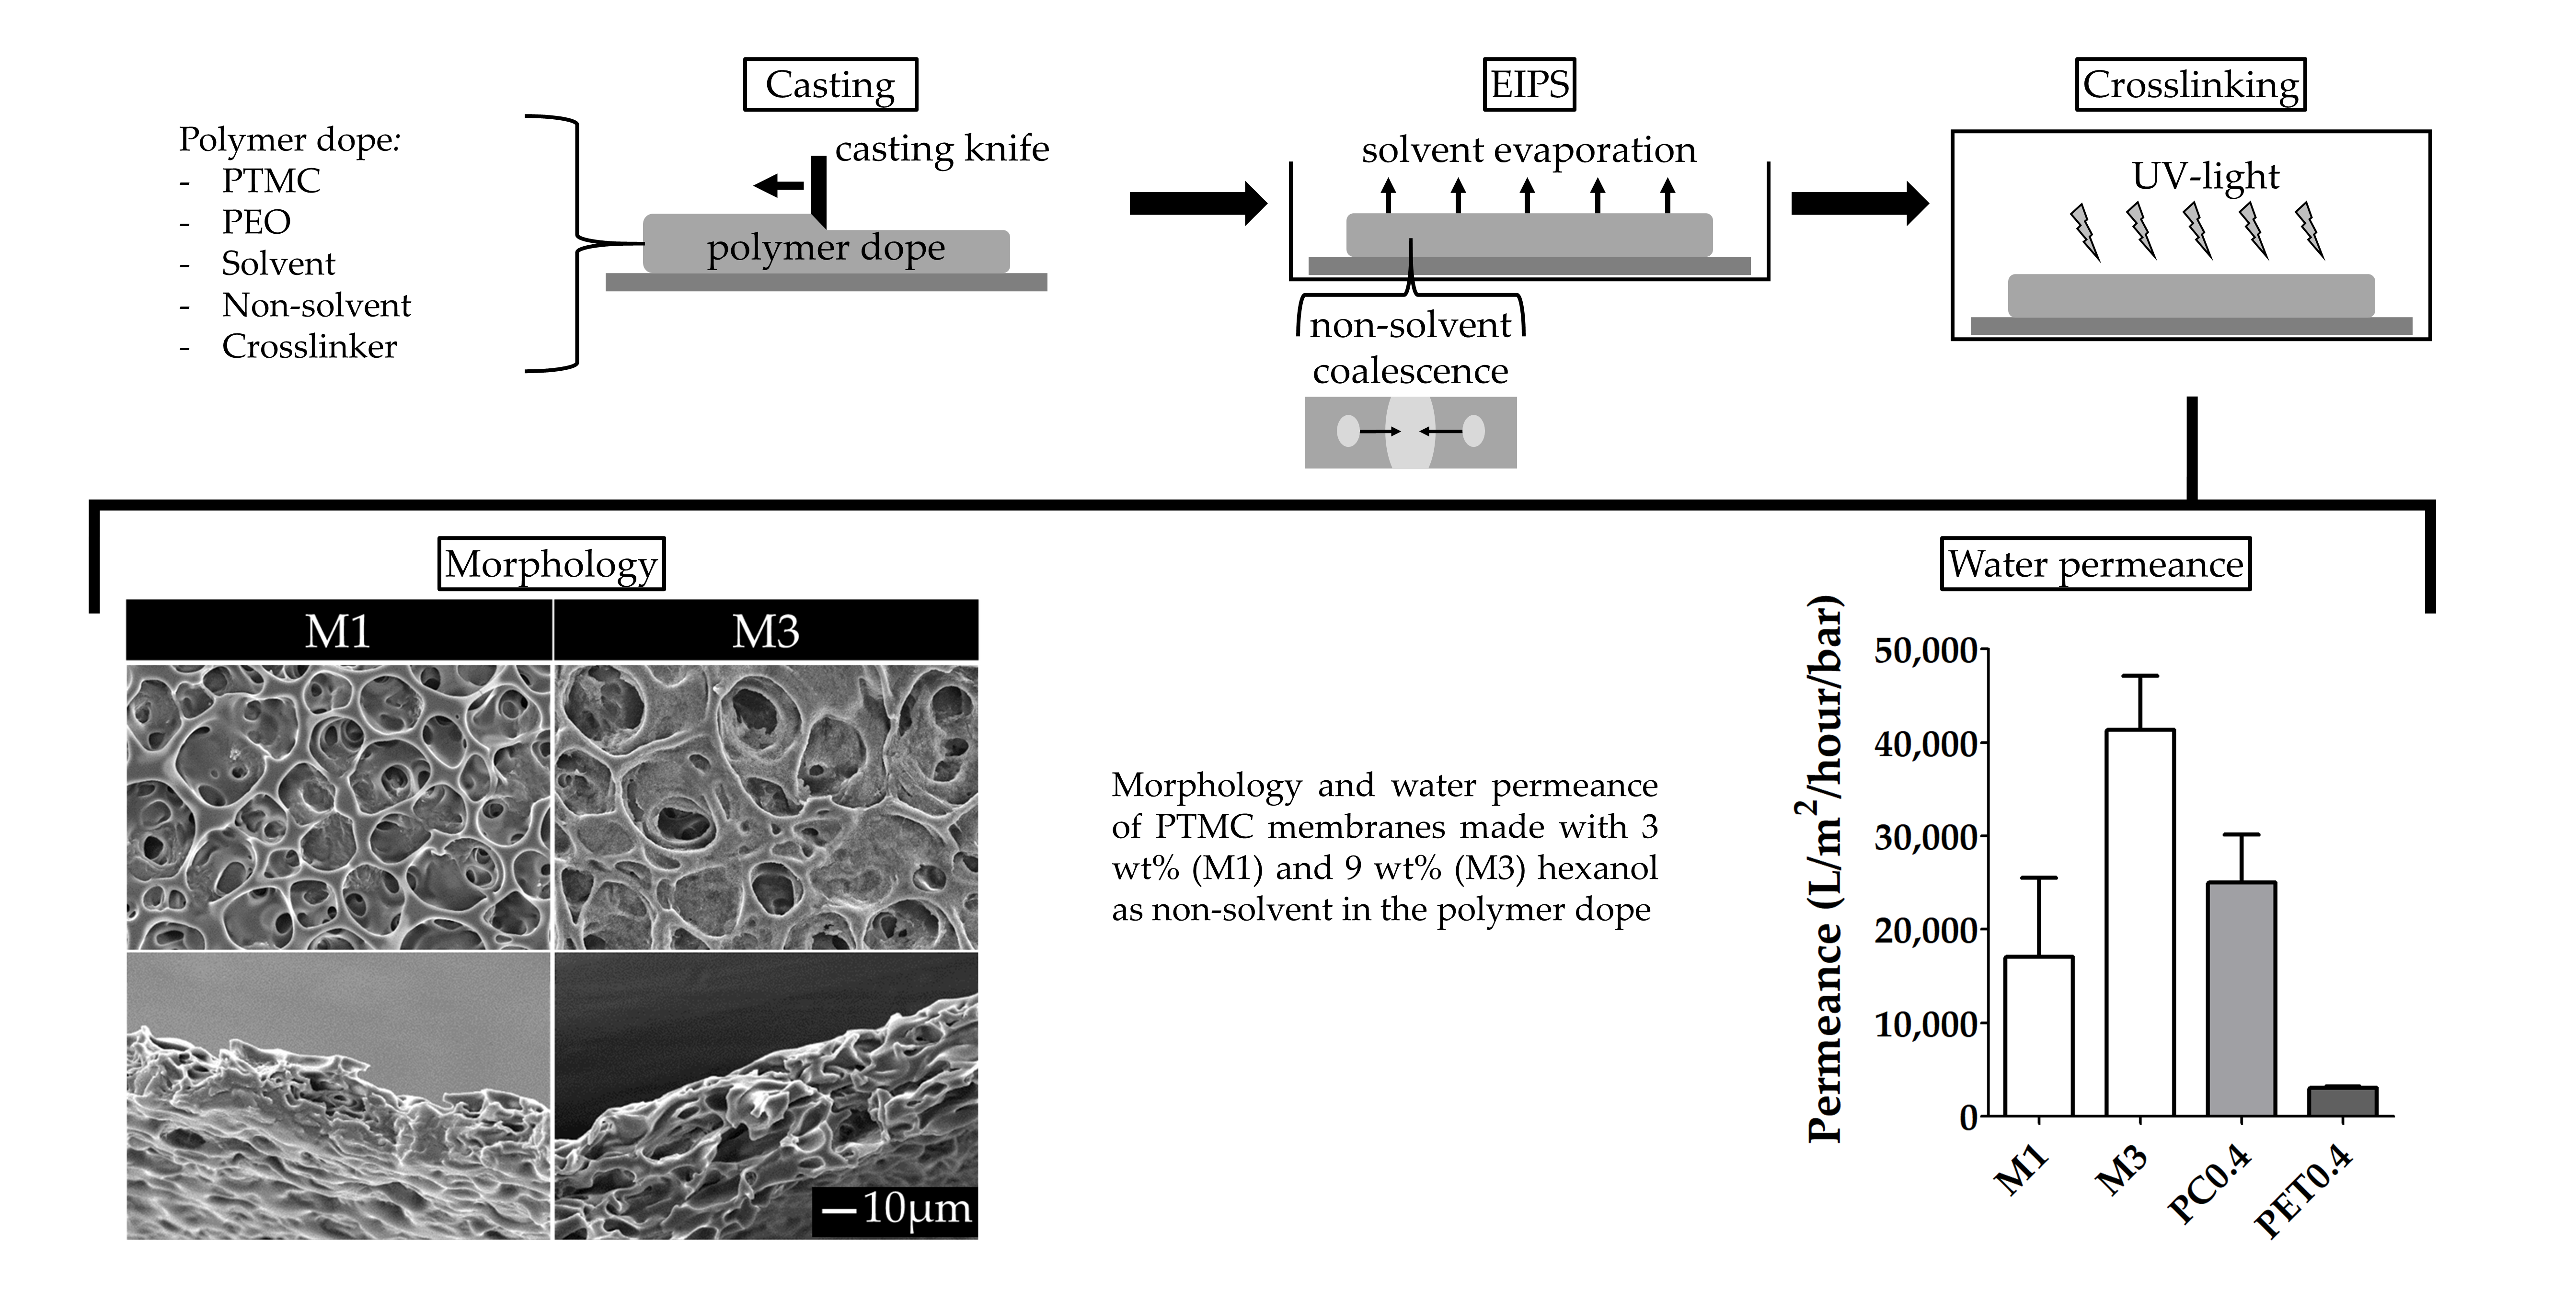
- For the investigation of the effect of non-solvent type on the formation of porous membranes, we used polymer dopes of PTMC of 1300 kg/mol and different alcohols as non-solvents. These dopes always contained 3 wt% non-solvent and 93.5 wt% chloroform.
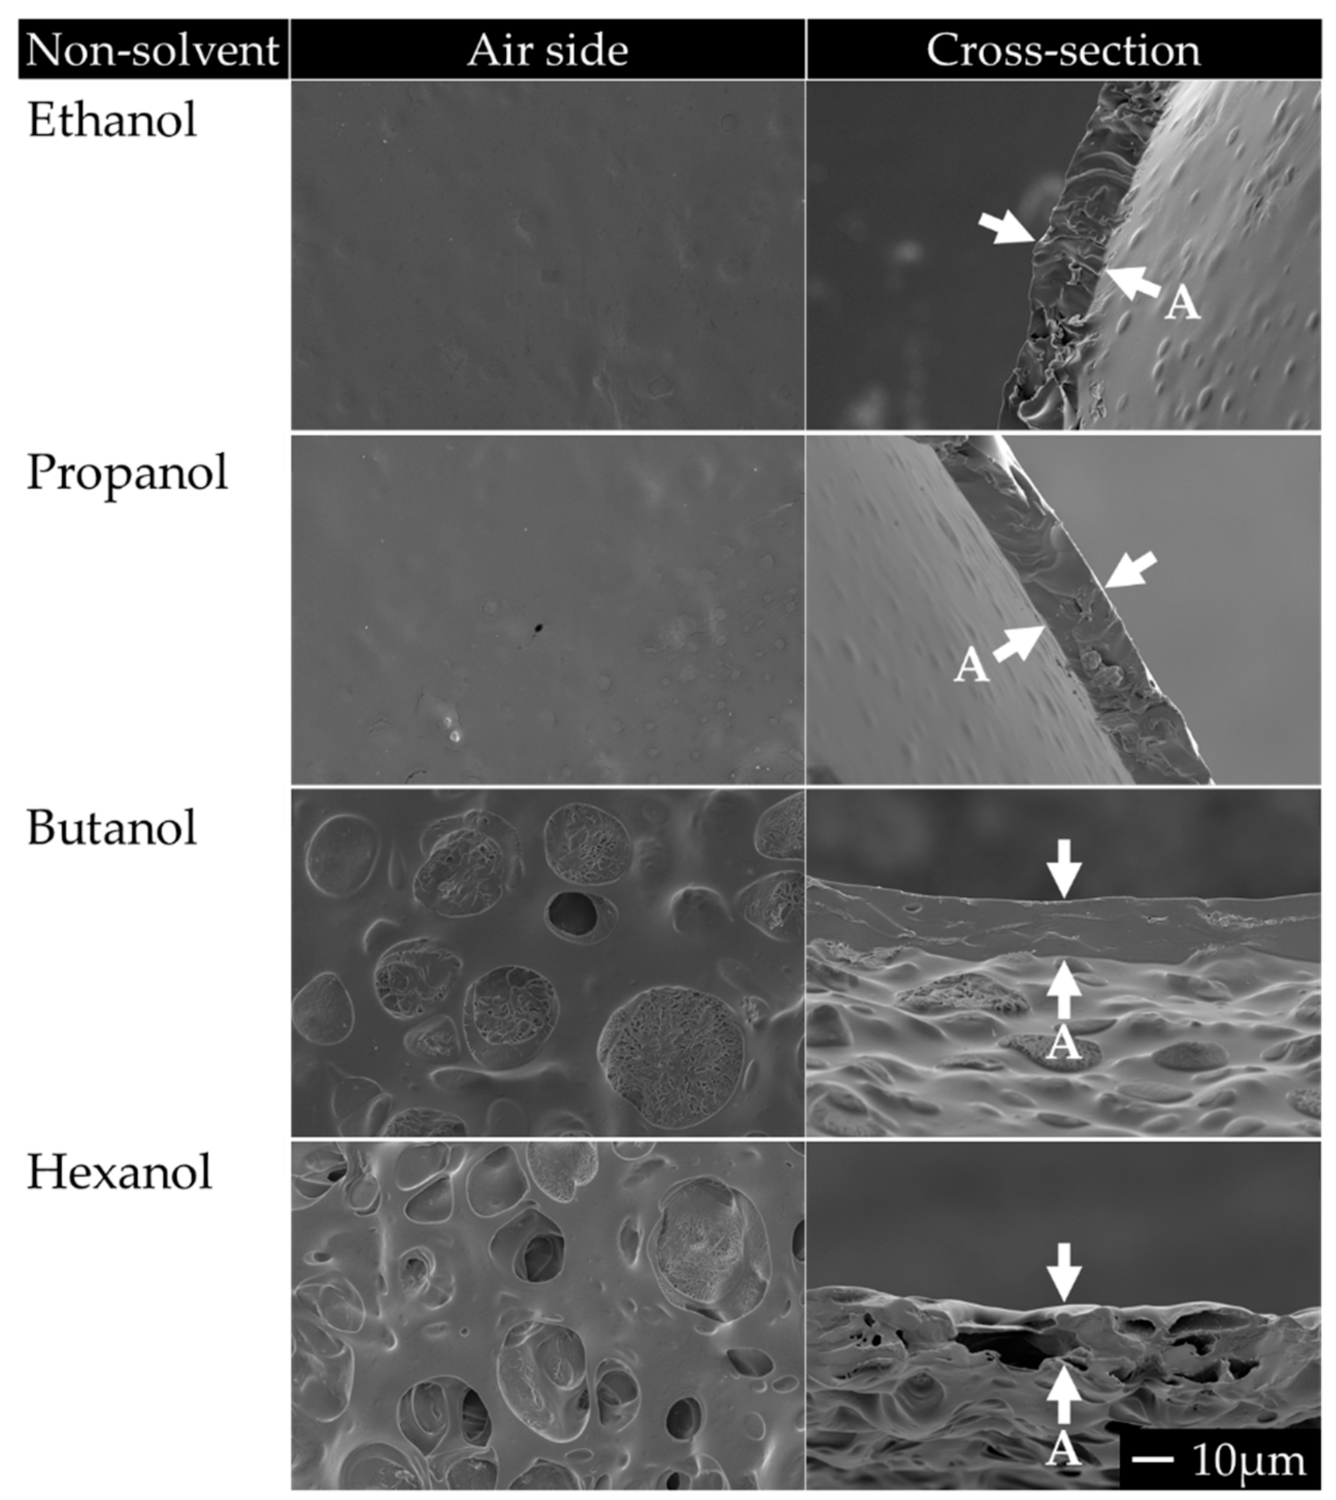
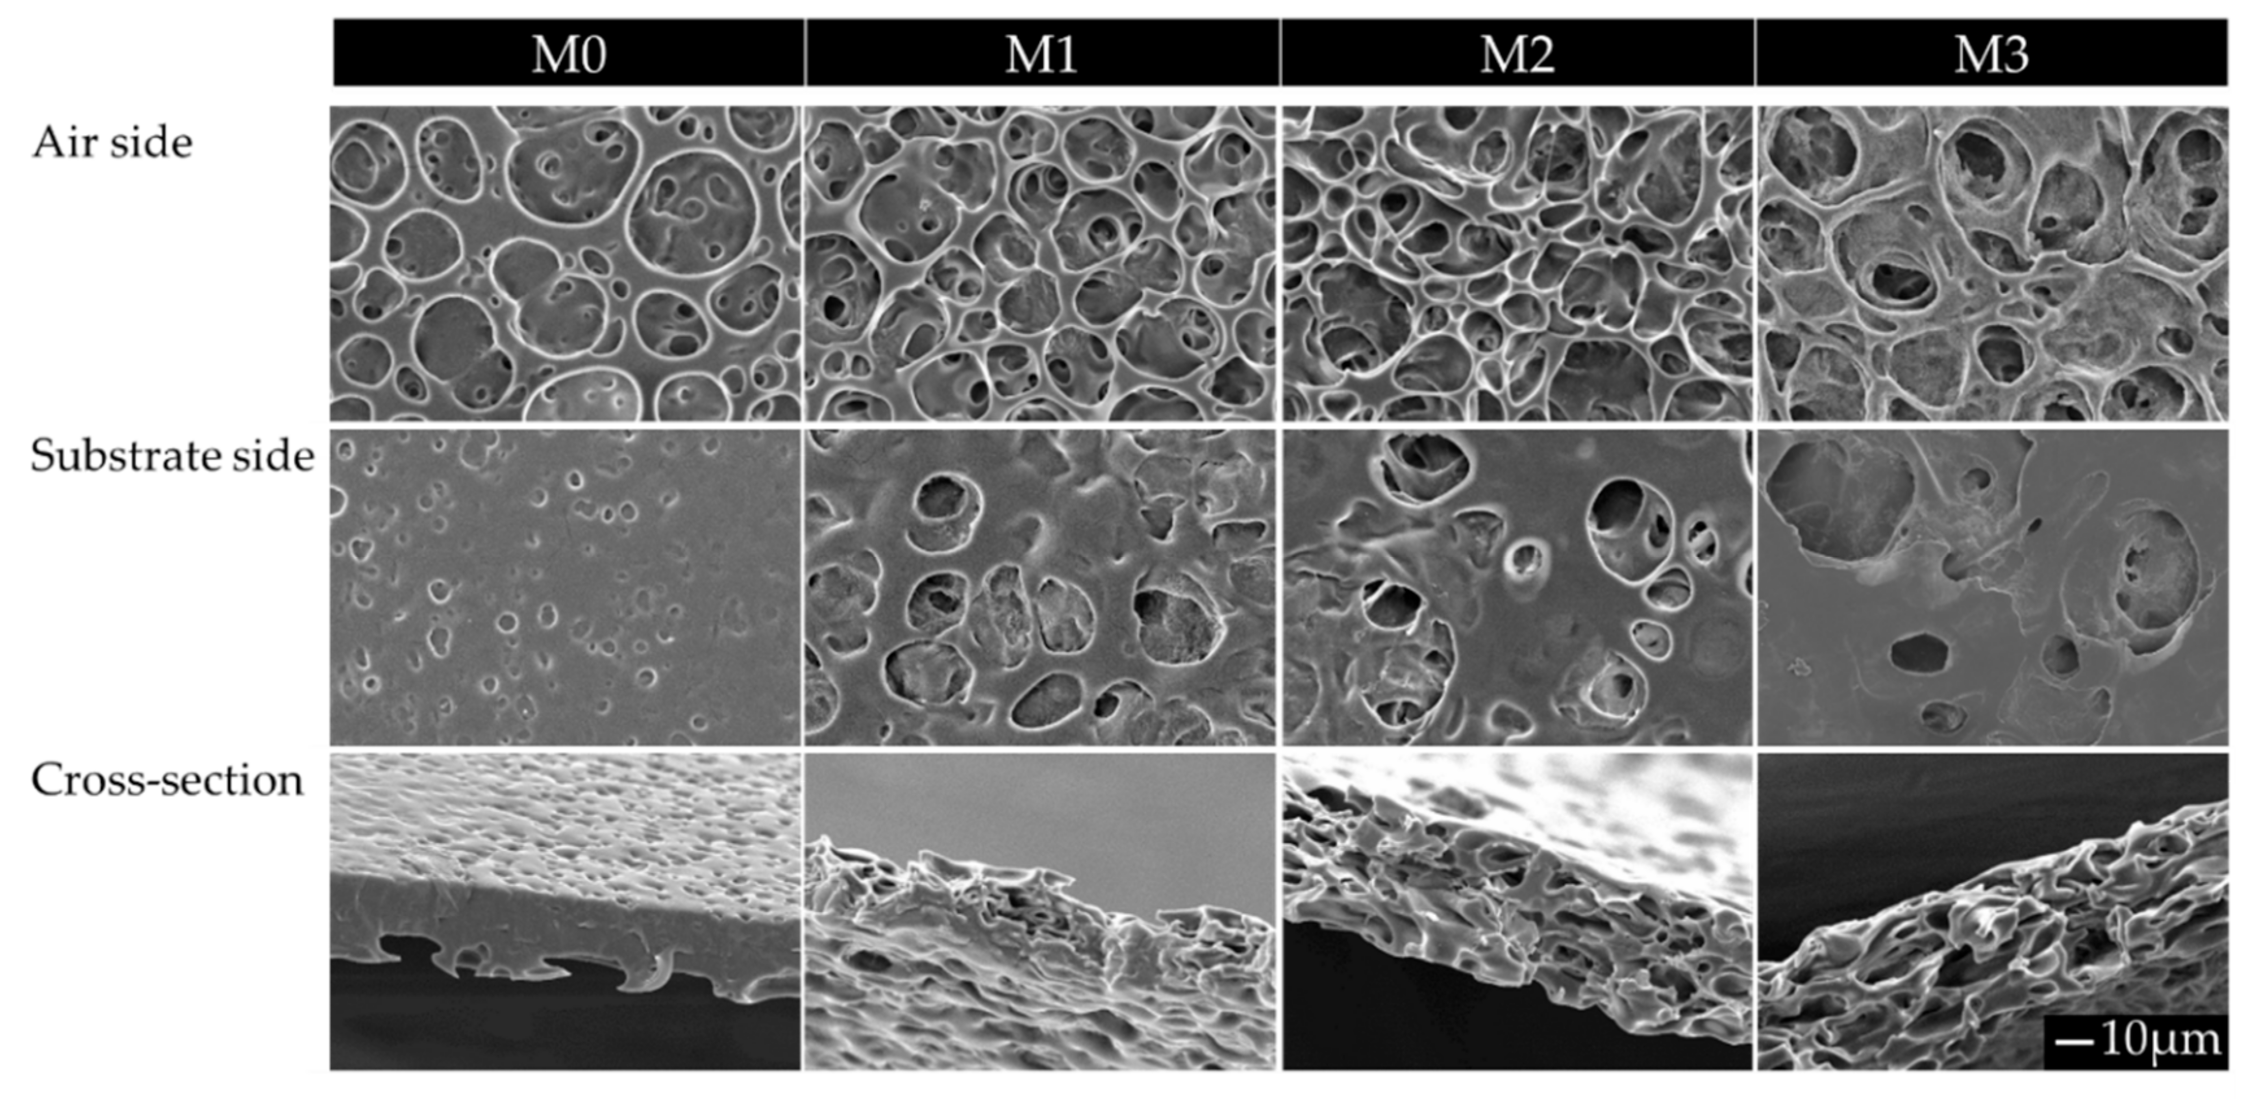
- For the investigation of the effect of the MW of PTMC and the non-solvent amount on the formation of porous membranes, polymer dopes contained PTMC of either 1300 kg/mol or 600 kg/mol. Furthermore, they contained different amounts of hexanol as a non-solvent, i.e., 0, 3, 6 or 9 wt% of the total polymer dope. Membranes fabricated from PTMC with a MW of 600 kg/mol and 0, 3, 6 or 9 wt% hexanol are in the following referred to as M0, M1, M2 and M3, respectively (Table 2).
- Polymer dopes with PTMC of 1300 kg/mol and different alcohols as non-solvents were cast at a humidity of 50%. Multiple membranes were cast (N = 3).
- The dopes with different hexanol amounts, including those for M0–M3, were cast at 60% humidity, created by a humidifier (PureMate® PM 702, PureMate, Birmingham, UK). Moreover, the silicon wafers containing cast polymer layers of those dopes were immediately placed on a cold glass plate of −25 °C and 5 mm thick. The cold glass plate was not kept cool and thus warmed up to ambient temperature over time. Casting was performed at least five times for each condition with multiple membranes cast every time. Samples were taken from different membranes cast on different days.
- The membranes prepared with PTMC of 1300 kg/mol and different alcohols were washed in an excess of demineralised water for five days (water refreshed once every day).
- The membranes prepared with different hexanol amounts, including M0–M3, were first put in an excess of 100% ethanol overnight since hexanol does not mix well with water but is miscible with ethanol. After one day, the ethanol was exchanged for 50 vol% ethanol in demineralised water for one day, followed by four days of demineralised water (water replaced once per day). Then, the membranes were again placed in 100% ethanol overnight to remove any residual hexanol and to exchange the water in the membranes with ethanol for better drying.
2.4. The Polymer Network in the Membranes
2.4.1. Gel Content
2.4.2. Proton Nuclear Magnetic Resonance Spectroscopy (1H-NMR)
2.5. Mechanical Properties of Membranes
2.6. Porosity, Morphology and Water Transport
2.6.1. Overall Porosity and Thickness
2.6.2. Membrane Morphology
2.6.3. Water Transport Across the Membranes
2.7. Statistical Analysis
3. Results and Discussion
3.1. Membrane Fabrication
3.1.1. PEO and Non-Solvent Type
3.1.2. Ambient Humidity and Substrate Temperature
3.1.3. PTMC Molecular Weight
3.2. The Effect of the Non-Solvent Amount
3.2.1. The Polymer Network in the Membranes
3.2.2. Mechanical Properties of Membranes
3.2.3. Porosity, Morphology and Water Transport
Overall Porosity and Thickness
Membrane Morphology
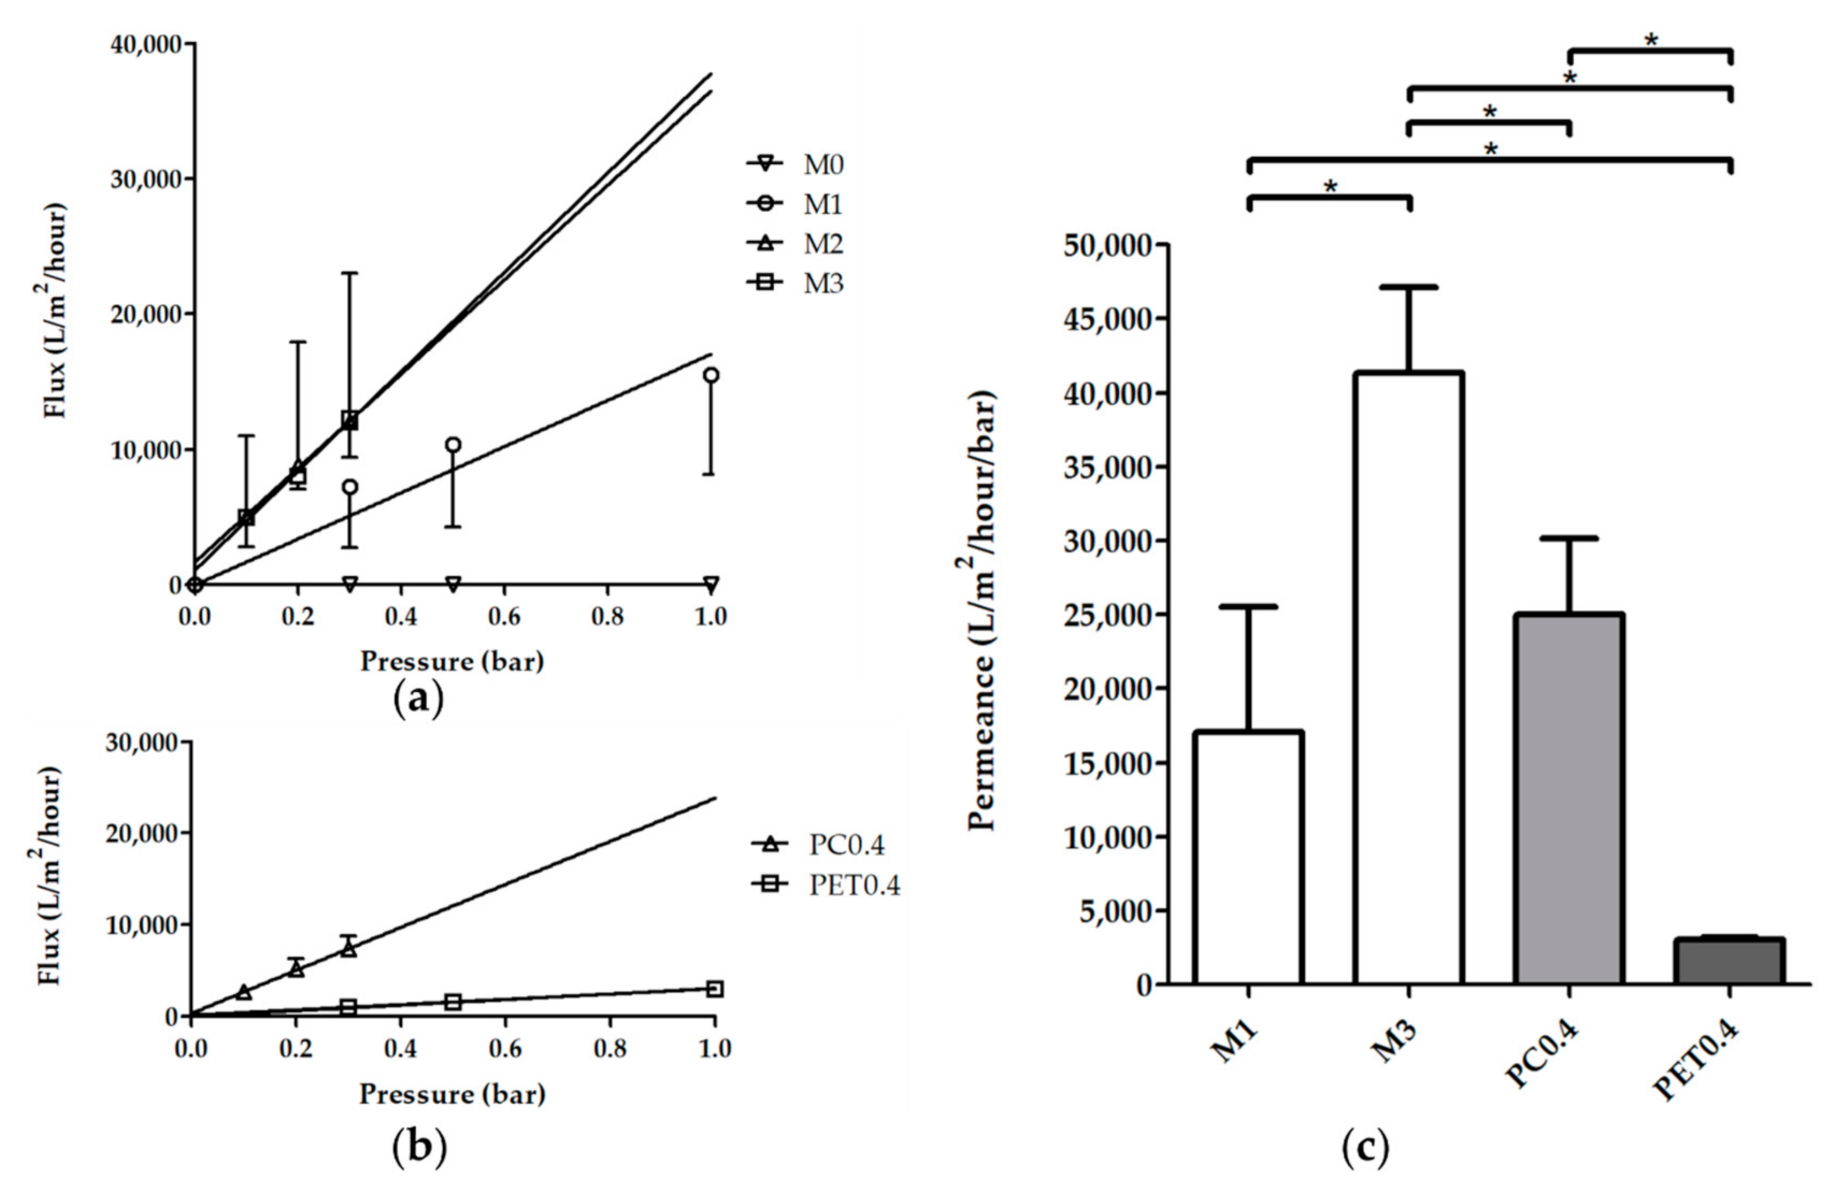
Water Transport Across the Membranes
3.3. EIPS and Photo-Crosslinking for Tailoring of Membrane Properties
4. Conclusions
Supplementary Materials
Author Contributions
Funding
Acknowledgments
Conflicts of Interest
References
- Pasman, T.; Grijpma, D.; Stamatialis, D.; Poot, A. Flat and microstructured polymeric membranes in organs-on-chips. J. R. Soc. Interface 2018, 15. [Google Scholar] [CrossRef]
- Huh, D.; Kim, H.J.; Fraser, J.P.; Shea, D.E.; Khan, M.; Bahinski, A.; Hamilton, G.A.; Ingber, D.E. Microfabrication of human organs-on-chips. Nat. Protoc. 2013, 8, 2135–2157. [Google Scholar] [CrossRef] [PubMed]
- Huh, D.; Hamilton, G.A.; Ingber, D.E. From 3D cell culture to organs-on-chips. Trends Cell Biol. 2011, 21, 745–754. [Google Scholar] [CrossRef] [PubMed]
- Huh, D.; Leslie, D.C.; Matthews, B.D.; Fraser, J.P.; Jurek, S.; Hamilton, G.A.; Thorneloe, K.S.; McAlexander, M.A.; Ingber, D.E. A human disease model of drug toxicity-induced pulmonary edema in a lung-on-a-chip microdevice. Sci. Transl. Med. 2012, 4. [Google Scholar] [CrossRef] [PubMed]
- Huh, D.; Matthews, B.D.; Mammoto, A.; Montoya-Zavala, M.; Hsin, H.Y.; Ingber, D.E. Reconstituting organ-level lung functions on a chip. Science 2010, 328, 1662–1668. [Google Scholar] [CrossRef] [PubMed]
- Huh, D.; Torisawa, Y.S.; Hamilton, G.A.; Kim, H.J.; Ingber, D.E. Microengineered physiological biomimicry: Organs-on-chips. Lab Chip 2012, 12, 2156–2164. [Google Scholar] [CrossRef] [PubMed]
- Kim, H.J.; Huh, D.; Hamilton, G.A.; Ingber, D.E. Human gut-on-a-chip inhabited by microbial flora that experiences intestinal peristalsis-like motions and flow. Lab Chip 2012, 12, 2165–2174. [Google Scholar] [CrossRef] [PubMed]
- Kim, H.J.; Ingber, D.E. Gut-on-a-chip microenvironment induces human intestinal cells to undergo villus differentiation. Integr. Biol. 2013, 5, 1130–1140. [Google Scholar] [CrossRef]
- Punde, T.H.; Wu, W.H.; Lien, P.C.; Chang, Y.L.; Kuo, P.H.; Chang, M.D.T.; Lee, K.Y.; Huang, C.D.; Kuo, H.P.; Chan, Y.F.; et al. A biologically inspired lung-on-a-chip device for the study of protein-induced lung inflammation. Integr. Biol. 2015, 7, 162–169. [Google Scholar] [CrossRef] [PubMed]
- Stucki, A.O.; Stucki, J.D.; Hall, S.R.; Felder, M.; Mermoud, Y.; Schmid, R.A.; Geiser, T.; Guenat, O.T. A lung-on-a-chip array with an integrated bio-inspired respiration mechanism. Lab Chip 2015, 15, 1302–1310. [Google Scholar] [CrossRef] [PubMed]
- Gotoh, K.; Yasukawa, A.; Taniguchi, K. Water contact angles on poly(ethylene terephthalate) film exposed to atmospheric pressure plasma. J. Adhes. Sci. Technol. 2011, 25, 307–322. [Google Scholar] [CrossRef]
- Lee, J.H.; Lee, S.J.; Khang, G.; Lee, H.B. Interaction of fibroblasts on polycarbonate membrane surfaces with different micropore sizes and hydrophilicity. J Biomater. Sci. Polym. Ed. 1999, 10, 283–294. [Google Scholar] [CrossRef] [PubMed]
- Cowin, S.C.; Van Buskirk, W.C.; Ashman, R.B. Properties of Bone. In Handbook of Bioengineering, 1st ed.; Skalak, R., Chien, S., Eds.; McGraw-Hill: New York, NY, USA, 1987; pp. 2.1–2.27. [Google Scholar]
- Hunt, K.D.; O’Loughlin, V.D.; Fitting, D.W.; Adler, L. Ultrasonic determination of the elastic modulus of human cortical bone. Med. Biol. Eng. Comput. 1998, 36, 51–56. [Google Scholar] [CrossRef]
- Bose, S.; Roy, M.; Bandyopadhyay, A. Recent advances in bone tissue engineering scaffolds. Trends Biotechnol. 2012, 30, 546–554. [Google Scholar] [CrossRef] [PubMed]
- Lai, Y.S.; Chen, W.C.; Huang, C.H.; Cheng, C.K.; Chan, K.K.; Chang, T.K. The effect of graft strength on knee laxity and graft in-situ forces after posterior cruciate ligament reconstruction. PLoS ONE 2015, 10. [Google Scholar] [CrossRef]
- Bat, E.; Zhang, Z.; Feijen, J.; Grijpma, D.W.; Poot, A.A. Biodegradable elastomers for biomedical applications and regenerative medicine. Regen. Med. 2014, 9, 385–398. [Google Scholar] [CrossRef]
- Terzini, M.; Bignardi, C.; Castagnoli, C.; Cambieri, I.; Zanetti, E.M.; Audenino, A.L. Ex Vivo Dermis Mechanical Behavior in Relation to Decellularization Treatment Length. Open Biomed. Eng. J. 2016, 10, 34–42. [Google Scholar] [CrossRef]
- Butcher, D.T.; Alliston, T.; Weaver, V.M. A tense situation: Forcing tumour progression. Nat. Rev. Cancer 2009, 9, 108–122. [Google Scholar] [CrossRef]
- Chen, Y.F.; Chan, H.N.; Michael, S.A.; Shen, Y.S.; Chen, Y.; Tian, Q.; Huang, L.; Wu, H. A microfluidic circulatory system integrated with capillary-assisted pressure sensors. Lab Chip 2017, 17, 653–662. [Google Scholar] [CrossRef]
- Di Caprio, G.; Stokes, C.; Higgins, J.M.; Schonbrun, E. Single-cell measurement of red blood cell oxygen affinity. Proc. Natl. Acad. Sci. USA 2015, 112, 9984–9989. [Google Scholar] [CrossRef] [PubMed]
- Ochsner, M.; Dusseiller, M.R.; Grandin, H.M.; Luna-Morris, S.; Textor, M.; Vogel, V.; Smith, M.L. Micro-well arrays for 3D shape control and high resolution analysis of single cells. Lab Chip 2007, 7, 1074–1077. [Google Scholar] [CrossRef]
- Schüller-Ravoo, S.; Papenburg, B.; Stamatialis, D.; Feijen, J.; Grijpma, D. Microstructured Photo-Crosslinked Poly(Trimethylene Carbonate) for Use in Soft Lithography Applications: A Biodegradable Alternative for Poly(Dimethylsiloxane). ChemPhysChem 2018, 19, 2085–2092. [Google Scholar] [CrossRef]
- Moraes, C.; Kagoma, Y.K.; Beca, B.M.; Tonelli-Zasarsky, R.L.; Sun, Y.; Simmons, C.A. Integrating polyurethane culture substrates into poly(dimethylsiloxane) microdevices. Biomaterials 2009, 30, 5241–5250. [Google Scholar] [CrossRef]
- Le-The, H.; Tibbe, M.; Loessberg-Zahl, J.; Palma do Carmo, M.; van der Helm, M.; Bomer, J.; van den Berg, A.; Leferink, A.; Segerink, L.; Eijkel, J. Large-scale fabrication of free-standing and sub-μm PDMS through-hole membranes. Nanoscale 2018, 10, 7711–7718. [Google Scholar] [CrossRef]
- Wala, J.; Maji, D.; Das, S. Influence of physico-mechanical properties of elastomeric material for different cell growth. Biomed. Mater. 2017, 12. [Google Scholar] [CrossRef]
- Toepke, M.W.; Beebe, D.J. PDMS absorption of small molecules and consequences in microfluidic applications. Lab Chip 2006, 6, 1484–1486. [Google Scholar] [CrossRef] [PubMed]
- Van Meer, B.J.; de Vries, H.; Firth, K.; van Weerd, J.; Tertoolen, L.; Karperien, H.; Jonkheijm, P.; Denning, C.; IJzerman, A.P.; Mummery, C.L. Small molecule absorption by PDMS in the context of drug response bioassays. Biochem. Biophys. Res. Commun. 2017, 482, 323–328. [Google Scholar] [CrossRef] [PubMed]
- Bat, E.; Feijen, J.; Grijpma, D.W. Biodegradable elastomeric networks: Highly efficient cross-linking of poly(trimethylene carbonate) by gamma irradiation in the presence of pentaerythritol triacrylate. Biomacromolecules 2010, 11, 2692–2699. [Google Scholar] [CrossRef] [PubMed]
- Pêgo, A.P.; Siebum, B.; Van Luyn, M.J.; Gallego y Van Seijen, X.J.; Poot, A.A.; Grijpma, D.W.; Feijen, J. Preparation of degradable porous structures based on 1,3-trimethylene carbonate and D,L-lactide (co)polymers for heart tissue engineering. Tissue Eng. 2003, 9, 981–994. [Google Scholar] [CrossRef]
- Papenburg, B.J.; Schuller-Ravoo, S.; Bolhuis-Versteeg, L.A.M.; Hartsuiker, L.; Grijpma, D.W.; Feijen, J.; Wessling, M.; Stamatialis, D. Designing porosity and topography of poly(1,3-trimethylene carbonate) scaffolds. Acta Biomater. 2009, 5, 3281–3294. [Google Scholar] [CrossRef]
- Bat, E.; Kothman, B.H.M.; Higuera, G.A.; van Blitterswijk, C.A.; Feijen, J.; Grijpma, D.W. Ultraviolet light crosslinking of poly(trimethylene carbonate) for elastomeric tissue engineering scaffolds. Biomaterials 2010, 31, 8696–8705. [Google Scholar] [CrossRef] [PubMed]
- Allijn, I.; Ribeiro, M.; Poot, A.A.; Passier, R.; Stamatialis, D. Membranes for Modelling Cardiac Tissue Stiffness In Vitro Based on Poly(trimethylene carbonate) and Poly(ethylene glycol) Polymers. Membranes 2020, 10, 274. [Google Scholar] [CrossRef]
- Bat, E. Flexible Scaffolds Based on Poly(Trimethylene Carbonate) Networks for Cardiac Tissue Engineering. Ph.D. Thesis, University of Twente, Enschede, The Netherlands, May 2010. [Google Scholar]
- Pêgo, A.P.; Vleggeert-Lankamp, C.L.; Deenen, M.; Lakke, E.A.; Grijpma, D.W.; Poot, A.A.; Marani, E.; Feijen, J. Adhesion and growth of human Schwann cells on trimethylene carbonate (co)polymers. J. Biomed. Mater. Res. A 2003, 67, 876–885. [Google Scholar] [CrossRef] [PubMed]
- Schüller-Ravoo, S.; Feijen, J.; Grijpma, D.W. Flexible, elastic and tear-resistant networks prepared by photo-crosslinking poly(trimethylene carbonate) macromers. Acta. Biomater. 2012, 8, 3576–3585. [Google Scholar] [CrossRef] [PubMed]
- Pêgo, A.P.; Poot, A.A.; Grijpma, D.W.; Feijen, J. Copolymers of trimethylene carbonate and epsilon-caprolactone for porous nerve guides: Synthesis and properties. Biomater. Sci. Polym. Ed. 2001, 12, 35–53. [Google Scholar] [CrossRef]
- Zant, E.; Bosman, M.J.; Grijpma, D.W. Combinatorial synthesis of photo-crosslinked biodegradable networks. J. Appl. Biomater. Funct. Mater. 2012, 10, 197–202. [Google Scholar] [CrossRef] [PubMed]
- Bat, E.; van Kooten, T.G.; Feijen, J.; Grijpma, D.W. Resorbable elastomeric networks prepared by photocrosslinking of high-molecular-weight poly(trimethylene carbonate) with photoinitiators and poly(trimethylene carbonate) macromers as crosslinking aids. Acta. Biomater. 2011, 7, 1939–1948. [Google Scholar] [CrossRef]
- Pêgo, A.P.; Grijpma, D.W.; Feijen, J. Enhanced mechanical properties of 1,3-trimethylene carbonate polymers and networks. Polymer 2003, 44, 6495–6504. [Google Scholar] [CrossRef]
- Pêgo, A.P.; van Luyn, M.J.A.; Brouwer, L.A.; van Wachem, P.B.; Poot, A.A.; Grijpma, D.W.; Feijen, J. In vivo behavior of poly(1,3-trimethylene carbonate) and copolymers of 1,3-trimethylene carbonate with D,L-lactide or e-caprolactone: Degradation and tissue response. J. Biomed. Mater. Res. A 2003, 67, 1044–1054. [Google Scholar] [CrossRef]
- Pêgo, A.P. Preparation and in vivo Performance of Degradable Two-Ply Nerve Guides Based on (co)Polymers of Trimethylene Carbonate and ε-Caprolactone. Ph.D. Thesis, University of Twente, Enschede, The Netherlands, November 2002. [Google Scholar]
- Pasman, T.; Grijpma, D.W.; Stamatialis, D.; Poot, A.A. Fabricating porous, photo-crosslinked poly(trimethylene carbonate) membranes using temperature-induced phase separation. Polym. Adv. Technol. 2017, 28, 1258–1262. [Google Scholar] [CrossRef]
- Zhao, J.; Luo, G.; Wu, J.; Xia, H. Preparation of microporous silicone rubber membrane with tunable pore size via solvent evaporation-induced phase separation. ACS Appl. Mater. Interfaces 2013, 5, 2040–2046. [Google Scholar] [CrossRef]
- Pervin, R.; Ghosh, P.; Basavaraja, M.G. Tailoring pore distribution in polymer films via evaporation induced phase separation. RSC Adv. 2019, 9, 15593–15605. [Google Scholar] [CrossRef]
- Srinivasarao, M.; Collings, D.; Philips, A.; Patel, S. Three-dimensionally ordered array of air bubbles in a polymer film. Science 2001, 292, 79–83. [Google Scholar] [CrossRef]
- Dou, Y.; Jin, M.; Zhou, G.; Shui, L. Breath Figure Method for Construction of Honeycomb Films. Membranes 2015, 5, 399–424. [Google Scholar] [CrossRef]
- Wan, L.; Ke, B.; Li, X.; Meng, X.; Zhang, L.; Xu, Z. Honeycomb-patterned films of polystyrene/poly(ethylene glycol): Preparation, surface aggregation and protein adsorption. Sci. China B Chem. 2009, 52, 969–974. [Google Scholar] [CrossRef]
- Song, Y.; Wennink, J.W.; Kamphuis, M.M.; Vermes, I.; Poot, A.A.; Feijen, J.; Grijpma, D.W. Effective seeding of smooth muscle cells into tubular poly(trimethylene carbonate) scaffolds for vascular tissue engineering. J. Biomed. Mater. Res. A 2010, 95, 440–446. [Google Scholar] [CrossRef]
- Song, Y.; Wennink, J.W.; Kamphuis, M.M.; Sterk, L.M.; Vermes, I.; Poot, A.A.; Feijen, J.; Grijpma, D.W. Dynamic culturing of smooth muscle cells in tubular poly(trimethylene carbonate) scaffolds for vascular tissue engineering. Tissue Eng. Part A 2011, 17, 381–387. [Google Scholar] [CrossRef] [PubMed]
- Doytcheva, M.; Dotcheva, D.; Stamenova, R.; Orahovats, A.; Tsvetanov, C.; Leder, J. Ultraviolet-induced crosslinking of solid poly(ethylene oxide). J Appl. Polym. Sci. 1997, 64, 2299–2307. [Google Scholar] [CrossRef]
- Bat, E.; Plantinga, J.A.; Harmsen, M.C.; van Luyn, M.J.; Zhang, Z.; Grijpma, D.W.; Feijen, J. Trimethylene carbonate and epsilon-caprolactone based (co)polymer networks: Mechanical properties and enzymatic degradation. Biomacromolecules 2008, 9, 3208–3215. [Google Scholar] [CrossRef]
- Peponi, L.; Marcos-Fernández, A.; Kenny, J.M. Nanostructured morphology of a random P(DLLA-co-CL) copolymer. Nanoscale Res. Lett. 2012, 7, 103. [Google Scholar] [CrossRef]


| Function of Component | Trivial Name/Abbreviation | Component (IUPAC Name) | MW | Wt% of Total Polymer Dope |
|---|---|---|---|---|
| kg/mol | ||||
| Polymer | PTMC | Poly(trimethylene carbonate) | 1300 | 3 |
| 600 | ||||
| Pore stabiliser | PEO | Poly(ethylene oxide) | 5000 | 0.3 |
| Crosslinking agents: | ||||
| Crosslinking aid | Pentaerythritol triacrylate (PETA) | [2-(hydroxymethyl)-3-prop-2-enoyloxy-2-(prop-2-enoyloxymethyl)propyl] prop-2-enoate | 0.298 | 0.2 |
| Photoinitiator | Irgacure 2959 | 2-hydroxy-1-[4-(2-hydroxyethoxy)phenyl]-2-methylpropan-1-one | 0.224 | 0.01 |
| Solvent | Chloroform | Trichloromethane | 0.119 | 96.5–87.5 |
| Non-solvent | Ethanol | Ethanol | 0.046 | 3 |
| Propanol | Propan-1-ol | 0.060 | 3 | |
| Butanol | Butan-1-ol | 0.074 | 3 | |
| Hexanol | Hexan-1-ol | 0.102 | 0–9 |
| Membrane | M0 | M1 | M2 | M3 | |
|---|---|---|---|---|---|
| Hexanol (wt% of polymer dope) | 0 | 3 | 6 | 9 | |
| Chloroform (wt% of polymer dope) | 96.5 | 93.5 | 90.5 | 87.5 | |
| Gel content (%) (N ≥ 3) | 95.9 ± 2.0 (M1,M2,M3) | 79.2 ± 7.3 (M0,M2,M3) | 60.4 ± 4.8 (M0,M1) | 52.9 ± 5.6 (M0,M1) | |
| E-modulus (MPa) (N ≥ 2) | 10.4 ± 1.6 | 14.0 ± 5.3 | 14.3 ± 1.5 | 9.4 ± 2.4 | |
| Overall porosity (%) (N ≥ 4) | - (M1,M2,M3) | 21.1 ± 5.4 (M0,M2,M3) | 33.4 ± 6.8 (M0,M1) | 41.5 ± 8.5 (M0,M1) | |
| Thickness (µm) (N ≥ 6) | 18.2 ± 4.1 (M2,M3) | 20.3 ± 3.4 (M2,M3) | 31.4 ± 4.6 (M0,M1) | 36.6 ± 7.7 (M0,M1) | |
| Average pore size (µm) (N ≥ 7) | Air side | 1.9 ± 0.5 (M1,M2,M3) | 5.2 ± 3.1 (M0,M3) (S,Cr) | 5.3 ± 2.1 (M0,M3) (S,Cr) | 7.9 ± 4.1 (M0,M1,M2) |
| Substrate side | - (M1,M2,M3) | 7.2 ± 4.0 (M0) (A) | 7.8 ± 3.3 (M0) (A) | 6.9 ± 3.2 (M0) | |
| Cross-section | 1.4 ± 1.0 (M1,M2,M3) | 8.0 ± 4.3 (M0) (A) | 7.4 ± 3.4 (M0) (A) | 7.6 ± 4.3 (M0) |
Publisher’s Note: MDPI stays neutral with regard to jurisdictional claims in published maps and institutional affiliations. |
© 2020 by the authors. Licensee MDPI, Basel, Switzerland. This article is an open access article distributed under the terms and conditions of the Creative Commons Attribution (CC BY) license (http://creativecommons.org/licenses/by/4.0/).
Share and Cite
Pasman, T.; Baptista, D.; van Riet, S.; Truckenmüller, R.K.; Hiemstra, P.S.; Rottier, R.J.; Stamatialis, D.; Poot, A.A. Development of Porous and Flexible PTMC Membranes for In Vitro Organ Models Fabricated by Evaporation-Induced Phase Separation. Membranes 2020, 10, 330. https://doi.org/10.3390/membranes10110330
Pasman T, Baptista D, van Riet S, Truckenmüller RK, Hiemstra PS, Rottier RJ, Stamatialis D, Poot AA. Development of Porous and Flexible PTMC Membranes for In Vitro Organ Models Fabricated by Evaporation-Induced Phase Separation. Membranes. 2020; 10(11):330. https://doi.org/10.3390/membranes10110330
Chicago/Turabian StylePasman, Thijs, Danielle Baptista, Sander van Riet, Roman K. Truckenmüller, Pieter S. Hiemstra, Robbert J. Rottier, Dimitrios Stamatialis, and André A. Poot. 2020. "Development of Porous and Flexible PTMC Membranes for In Vitro Organ Models Fabricated by Evaporation-Induced Phase Separation" Membranes 10, no. 11: 330. https://doi.org/10.3390/membranes10110330
APA StylePasman, T., Baptista, D., van Riet, S., Truckenmüller, R. K., Hiemstra, P. S., Rottier, R. J., Stamatialis, D., & Poot, A. A. (2020). Development of Porous and Flexible PTMC Membranes for In Vitro Organ Models Fabricated by Evaporation-Induced Phase Separation. Membranes, 10(11), 330. https://doi.org/10.3390/membranes10110330