Article

Economic Evaluation of Pneumococcal Vaccination in Egypt: Cost-Effectiveness, Budget Impact, and Domestic Manufacturing Potential


by
Chrissy Bishop
1,*,†,
Arnold Hagens
1,2,†,
Federico Rodriguez-Cairoli
1,
Konstantina Politopoulou
1,
Zicheng Wang
1,
Motuma Abeshu
3,
Sowmya Kadandale
3,
Ibironke Oyatoye
4 and
Saadia Farrukh
3
1
Triangulate Health Ltd., Doncaster DN11 9QU, UK
2
Department of Health Sciences, University Medical Center Groningen, University of Groningen (RUG), 9713 AV Groningen, The Netherlands
3
UNICEF MENA Regional Office, Abdulqader Al-Abed Street, Building No. 15 Tla’a Al-Ali, Amman 11821, Jordan
4
UNICEF Headquarters, 3 UN Plaza, Room 816, New York, NY 10017, USA
*
Author to whom correspondence should be addressed.
These authors contributed equally to this work.
Vaccines 2026, 14(4), 318; https://doi.org/10.3390/vaccines14040318
Submission received: 20 January 2026 / Revised: 20 March 2026 / Accepted: 25 March 2026 / Published: 1 April 2026
(This article belongs to the Special Issue Cost-Effectiveness of Vaccines and Public Health)

Abstract

Background/Objectives: Streptococcus pneumoniae remains a major cause of morbidity and mortality in Egypt, yet pneumococcal conjugate vaccines (PCVs) are not included in the national immunization program. Recent commitments to domestic vaccine manufacturing and temporary Gavi support create a timely decision context for policymakers to assess whether PCV introduction is cost-effective, affordable, and sustainable within Egypt’s health financing constraints. This study evaluates the cost-effectiveness, budget impact, and return on investment (ROI) of PCV introduction in Egypt. Methods: A deterministic, age-structured dynamic transmission model was developed to estimate the health and economic outcomes of PCV introduction over a 20-year horizon from a healthcare payer perspective. The analysis was conducted in line with the Consolidated Health Economic Evaluation Reporting Standards 2022 (CHEERS 2022) guidelines. The model captures direct and indirect effects across all age groups and includes pneumonia, meningitis, non-pneumonia non-meningitis invasive disease, and acute otitis media. Scenarios assessed immediate versus delayed introduction, alternative PCV10-to-PCV13 pathways, and domestic manufacturing price assumptions. Outcomes included deaths averted, incremental cost-effectiveness ratios (ICERs) relative to GDP per capita, budget impact, and ROI using the value of statistical life. Results: Immediate PCV13 introduction was projected to avert 139,451 deaths across all age groups over 20 years, with an ICER of 523.31 USD per DALY averted equal to 0.16 × GDP per capita. The total budget impact was USD 124.9 million per year without Gavi support and USD 120.9 million with support, yielding an ROI of 23.1. Delaying the introduction substantially reduced health gains and economic returns. Pathways involving initial PCV10 introduction followed by transition to PCV13 achieved similar health outcomes with a lower budget impact and higher ROI. Conclusions: PCV introduction in Egypt represents a high-value investment. Immediate introduction maximizes health and economic benefits, while delayed introduction entails substantial opportunity costs. Alternative PCV10-to-PCV13 pathways offer a more affordable route with a similar long-term impact.

1. Introduction

Streptococcus pneumoniae (S. Pn) is a Gram-positive, encapsulated bacterium and a major cause of an array of diseases such as pneumonia, acute otitis media, and meningitis. Transmission generally occurs through direct person-to-person contact via respiratory droplets through coughing and sneezing. In addition, people can be carriers without becoming unwell and possibly spread the bacteria to others. It is estimated that worldwide, approximately one million children die every year due to S. Pn. [1]. In Egypt, the Global Burden of Disease (GBD) estimated 6500 deaths from S. Pn in 2021. Many of these deaths can be prevented through vaccination. The 13-valent pneumococcal conjugate vaccine (PCV13) protects against 13 types of S. Pn. bacteria and has an effectiveness of around 45% for all-cause pneumonia [2]. PCV13 therefore can reduce morbidity and mortality, and as a consequence, related economic effects such as healthcare costs.
Vaccinating against S. Pn. leads to a range of positive impacts; however, it also entails costs. These include vaccine procurement, program coordination, and the resources required for vaccine introduction into the routine immunization program. It is therefore essential to understand the expected health and economic effects before introducing the vaccine. Experiences in other countries show that PCV introduction consistently leads to substantial health gains, with evaluations reporting ~860 deaths averted per year in childhood-focused models [3], and ~2490 deaths per year in a 100-year modelling horizon [4]. Global evidence in low- and middle-income countries (LMICs) further suggests 1000–1800 preventable deaths annually for countries of Egypt’s size (116 million in 2024) [5] and demonstrates that PCV programs are highly cost-effective, with ICERs typically 0.2–0.6× GDP per capita [6].
Vaccinations against S. Pn are not currently part of Egypt’s national immunization program. The decision to introduce them was initially encouraged by a national cost-effectiveness analysis conducted by Sibak et al. in 2013 [3], which found PCV13 to be cost-effective (USD 3916 per DALY averted). The 2013 national cost-effectiveness analysis is now outdated, having used earlier disease burden estimates and willingness-to-pay thresholds and omitted indirect (herd immunity) effects. Since then, the decision context has also shifted. In December 2021, the Egyptian President issued a directive to establish the Vaccines and Biotechnology City in Egypt to strengthen domestic vaccine production [7]. PCV13 was identified as one of the priorities for domestic production. In parallel, Egypt can leverage external financing and technical support from the Gavi Alliance middle-income country scheme and UNICEF procurement mechanisms, creating near-term options for vaccine introduction while domestic capacity is developed [8]. Against this backdrop, updated economic evidence is needed to inform a time-sensitive choice among plausible introduction and supply pathways. Decision-makers must weigh (i) introduction via continued procurement through UNICEF (with temporary Gavi support where applicable), (ii) a phased transition from imported to domestically produced PCVs, and (iii) alternative product pathways (PCV10 initially, with a later switch to PCV13), recognizing that establishing local production typically requires 5–10 years [9,10]. This study therefore updates and extends the earlier national analysis to reflect current epidemiology, costs, and Egyptian industrial development priorities. Further, the timing, affordability, and economic value of PCV introduction are compared under these alternative procurement and domestic manufacturing scenarios.
Therefore, the main research question to be answered is as follows: “What is the cost-effectiveness and budget impact of introducing PCV in Egypt compared with no PCV under certain scenarios?” To be able to answer this, the cost-effectiveness, return on investment, and budget impact of introducing PCV for children under five versus no vaccination are assessed using a dynamic transition model. Dynamic transmission models are essential for PCV economic evaluation because they capture herd protection effects and serotype replacement [11], phenomena that static cohort models cannot represent. This ensures that the full epidemiological impact on cases, deaths, DALYs, and costs across all age groups is accurately reflected in cost-effectiveness estimates. Cost-effectiveness results summarize the cost per health gain, while ROI results capture the broader economic returns associated with reduced disease burden. Budget impact results summarize the expected financing implications for government and other payers, informing affordability and sustainability under constrained health budgets.

2. Materials and Methods

2.1. Overview

This analysis was structured and reported in accordance with the CHEERS 2022 guidelines for health economic evaluations [12]. The cost-effectiveness of PCV introduction in Egypt from a health system perspective was studied. A deterministic age-structured, dynamic compartmental model was developed to evaluate the cost-effectiveness of introducing PCV in Egypt over a 20-year time horizon. The model simulates pneumococcal transmission and disease progression across the entire population and was selected to capture both direct effects in children and indirect (herd immunity) effects in individuals aged >5 years, as well as the way these effects evolve following vaccine introduction. The core transmission component follows a standard SIRD framework (Susceptible–Infectious–Recovered–Death) [13], formulated as a system of ordinary differential equations (ODEs) and implemented in continuous time, in which the number of new infections depends on the interaction between susceptible and infectious individuals. The model was adapted to reflect the epidemiology of Streptococcus pneumoniae and the mechanism of vaccine-derived protection. The population is divided into three immunity groups: susceptible unvaccinated, susceptible vaccinated, and recovered-immune. Individuals in each group progress through the same health state: susceptible, infectious, disease, and either recovery or death. Natural immunity following infection provides partial protection, while vaccine-induced immunity confers higher protection [14,15]. Both forms of immunity wane over time, allowing individuals to return to the susceptible pool.
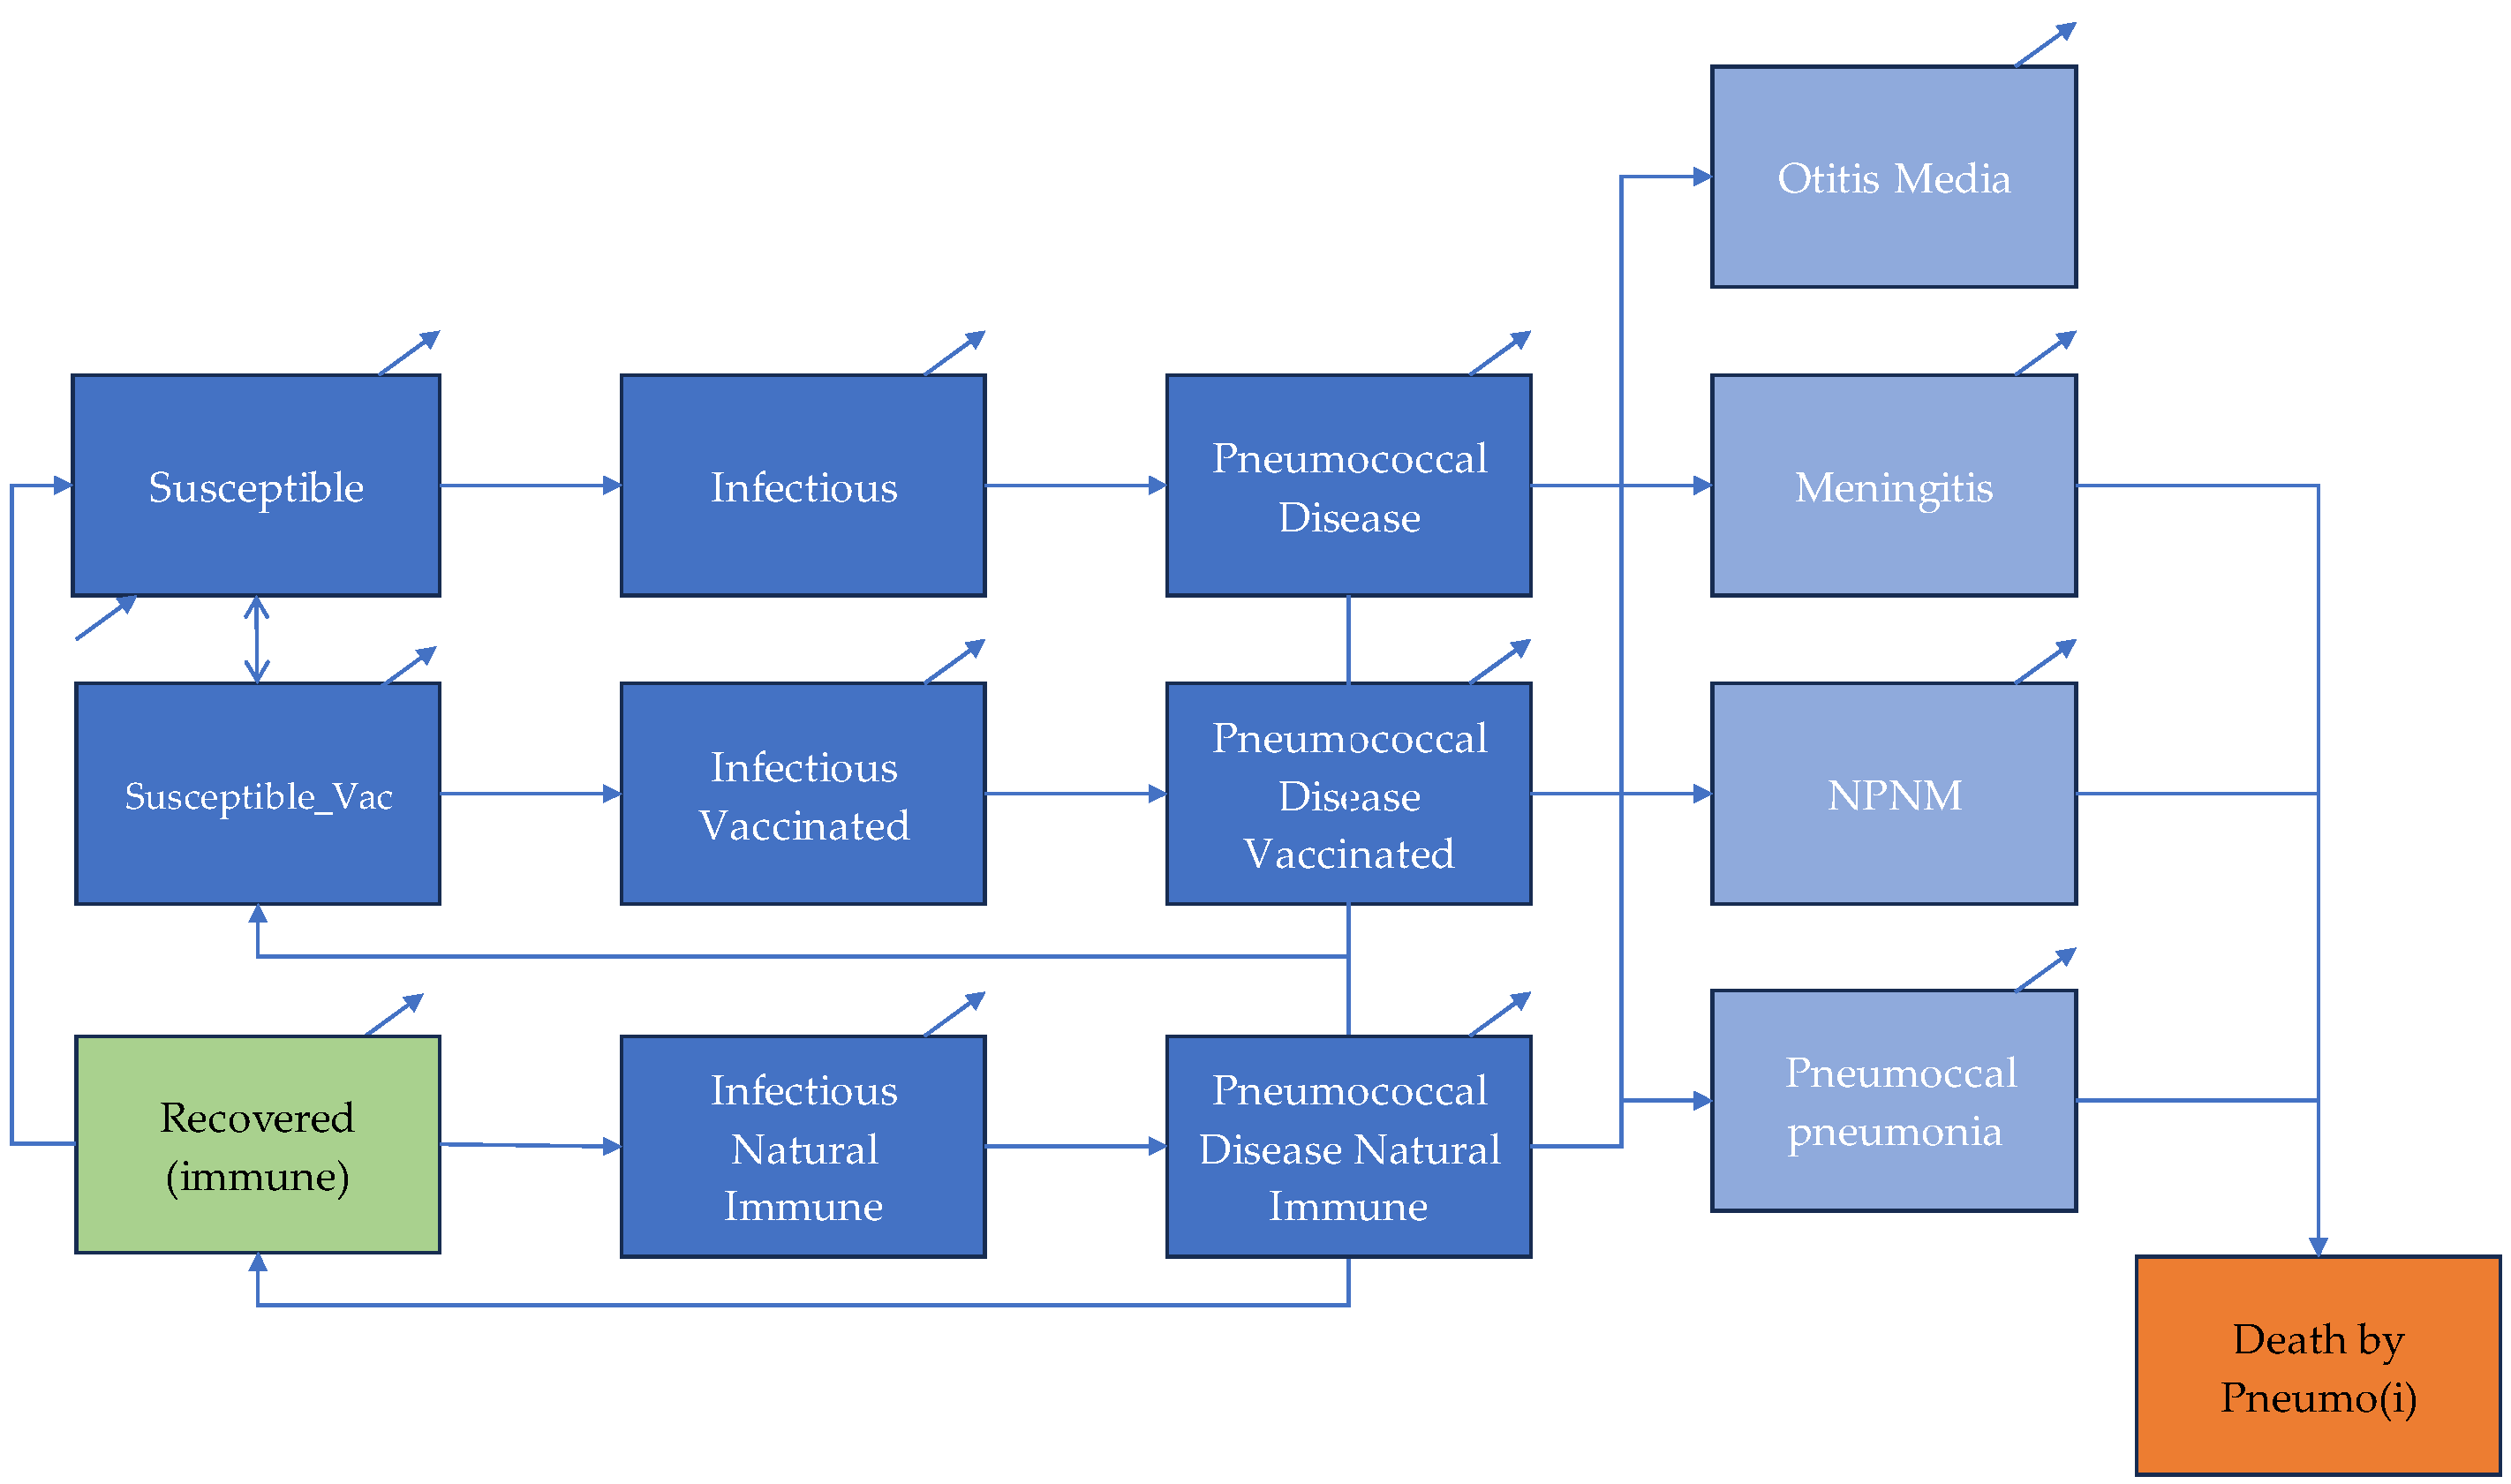
The disease state is disaggregated into four pneumococcal syndromes: acute otitis media (AOM), pneumococcal pneumonia, meningitis, and non-pneumonia non-meningitis (NPNM) invasive disease, including sepsis. Age-specific incidence, case fatality, and severity parameters determine transitions between infectious and disease states. Long-term sequelae were not specifically included to keep model outcomes conservative. Demographic processes, including births and background mortality, are incorporated to reflect population turnover and maintain epidemiological dynamics over the 20-year time frame. A schematic illustration of the transmission pathways, immunity transitions, and disease compartments is presented in Figure 1.

2.2. Dynamic Transmission Model

The dynamic transmission component operates across three age groups (0–4 years, 5–64 years, and ≥65 years). Age-specific transmission patterns were modelled using a contact matrix derived from Prem et al. [16], adjusted to reflect the demographic structure of Egypt. The force of infection in each age group depends on the number of susceptible individuals and the number of infectious carriers (vaccinated, unvaccinated, and recovered-immune), weighted by age-specific contact rates.
The transmission dynamics are governed by a system of differential equations that simulate transitions between susceptibility, infection, and recovery for vaccinated and unvaccinated individuals (Appendix A provides transmission and progression equations).
The disease transmission model was developed and implemented in RStudio (version 2024.4.2.764, Posit PBC).

2.3. Model Assumptions and Analytical Framework

Table 1 summarizes the core modelling assumptions underpinning the economic evaluation, including the model type, analytic perspective, time horizon, discount rate, and comparator. Economic parameters were selected to reflect Egypt’s health financing context and follow international guidance. Both PCV10 and PCV13 were included because they have substantially different price points but broadly similar effectiveness profiles, as noted by WHO SAGE [17]. Evaluating both products enabled assessment of how vaccine pricing influences cost-effectiveness. The eligible population—children from birth to one year—follows WHO-recommended schedules for pneumococcal vaccination [18]. A 3-dose vaccine schedule was analyzed without a booster (3 + 0), reflecting a pragmatic schedule for early implementation and following guidance from UNICEF. Vaccine coverage assumptions were based on historical DTP3 coverage in Egypt and validated with UNICEF Egypt data, ensuring realistic projections of PCV uptake.
A healthcare payer perspective was adopted because pneumococcal vaccine procurement and delivery are financed primarily through government budgets in Egypt, consistent with prior PCV evaluations in LMIC settings [3,4]. Direct medical costs were therefore used to reflect decision-relevant budgetary impacts. A 20-year time horizon was used to capture the long-term health and economic consequences of vaccine introduction, including the gradual accumulation of both direct and indirect effects. Future costs and outcomes were discounted at an annual rate of 3.5%, in line with local economic evaluation guidelines [19]. Egypt-specific willingness-to-pay thresholds were applied to provide contextually appropriate interpretation of cost-effectiveness [20].
Table 2 summarizes the epidemiological, clinical, and vaccine-related parameters incorporated into the dynamic model. Age-specific incidence rates and case-fatality ratios for pneumococcal pneumonia, meningitis, AOM, and NPNM were drawn from Egyptian economic evaluations [3,4] and adjusted to remain consistent with Global Burden of Disease estimates [1], providing locally relevant disease burden inputs.
Vaccine effectiveness estimates were based on Sibak et al. [3] and then refined using PCV13 serotype coverage data from Badawy et al. [21]. To reflect expected post-introduction epidemiology, vaccine effectiveness values for invasive disease were further adjusted for serotype replacement using evidence from Weinberger et al. [22]. The model also applies a 20% reduction in vaccine-targeted serotype coverage for invasive pneumococcal diseases (IPDs) over the analysis period to account for replacement, ensuring realistic long-term impact estimates.
As natural immunity after infection is serotype-specific and short-lived, serotype prevalence ranges widely and multi-serotype carriage is common. Based on these considerations [15,22,23], natural immunity was conservatively set at 33% of vaccine-induced protection, high enough to account for some cross-protection but low enough to avoid underestimating the incremental value of vaccination. An assumed reproduction number (R0) of 1.25 was used to reflect pneumococcal transmission dynamics in high-burden settings. This value is consistent with estimates reported in the literature, where pre-vaccine R0 for Streptococcus pneumoniae typically ranges from 1.2 to 1.4 depending on serotype distribution, population density, and age-mixing patterns [24]. The derived R0 in combination with the contact matrix was calibrated with the real reported incidence rates per included disease. Although we used an average R0, the effects per age group differed through the contact matrix and calibration.
These inputs ensure that transmission dynamics, vaccine effects, and disease outcomes reflect both local epidemiology and established biological mechanisms.
Table 1. Summary of model structure, inputs, and economic evaluation assumptions.
CategoryVariable/
Parameter
Value/DescriptionSource
Model characteristicsModel typeDynamic transmission modelDecision made by the authors
Time horizon20 years
PerspectiveHealthcare payer and societal
Discount rate3.5% per year for costs and health benefits[19]
Diseases in modelPneumococcal syndromesAcute otitis media, meningitis, NPNM disease, and pneumonia[3]
Disutility valuesDisability weight for each conditionAOM: 0.05
Meningitis, NPNM disease, and pneumonia: 0.13
[1]
Healthcare resource useDirect medical costsSee cost table for disease-specific costsDecision made by the authors
Intervention characteristicsTarget populationChildren from birth to 1 year (WHO PCV schedules)[18]
Vaccine products modelledPCV10 and PCV13Decision made by the authors
Vaccine coverageDetermined by scenarios (immediate introduction, 5-year delay, etc.)
Total number of doses3 doses (WHO recommendation)[18]
Program cost per fully vaccinated childVaries by local vs. imported production; see cost table[25,26,27,28]
Main outcomesHealth metricsDeaths and disability-adjusted life years (DALYs) avoidedDecision made by the authors
Economic evaluationMetricsIncremental cost-effectiveness ratio (ICER), budget impact, total vaccination costs, return on investment
Willingness-to-pay thresholdsWTP thresholds0.20, 0.39, 0.49 × GDP per capita [20]
Sensitivity analysesOne-way analysisKey parameters varied by ±20%Decision made by the authors
Scenario analysesVaccine introduction timing and price scenarios
Table 2. Input parameters by age group.
Parameter0–45–6465+Reference
Transmission parameters
Basic reproduction number1.251.251.25[24]
Estimated VE on infection72%72%72%Assumed to be the same as serotype coverage [21]
Disease—Otitis media
CFR000[3]
Average incidence/100,000 persons99708390.00[4]
VE57%Not applyNot apply[29]
Effectiveness natural immunity0.190.190.19[15,22,23] *
Disease—Meningitis
CFR0.080.020.05[3]
Average incidence/100,000 persons4.340.270.05[4]
VE48%Not applyNot apply[3,21,22] **
Effectiveness natural immunity0.160.160.16[15,22,23] *
Disease—NPNM
CFR0.050.050.05[3]
Average incidence/100,000 persons15.662.671.92[4]
VE0.48%Not applyNot apply[3,21,22] **
Effectiveness natural immunity0.160.160.16[15,22,23] *
Disease—Pneumococcal pneumonia
CFR0.030.010.04[4]
Average incidence/100,000 person8572671116[4]
VE0.59%Not applyNot apply[4]
Effectiveness natural immunity0.190.190.19[15,22,23] **
Note: VE: Vaccine effectiveness. CFR: Case-fatality rate. * Assumed 33% of VE. ** Calculated by multiplying PCV13 vaccine effectiveness against pneumococcal pneumonia/meningitis/NPNM from Sibak et al. [3], with PCV13 serotype coverage from Badawy et al. [21], with serotype replacement on IPD for children < 5 from Weinberger et al. [22].

2.4. Cost and Effects

Budget impact and cost-effectiveness were assessed over the 20-year modelling horizon. Only direct healthcare costs were included, defined as the average cost per incident case of each pneumococcal syndrome (Table 3), alongside vaccine procurement and delivery costs modelled under several price scenarios (Appendix B). Procurement and delivery costs incorporated standard components used in global immunization costing, including delivery unit costs, freight and handling fees, injection supplies, surcharge structures, and human resource inputs, drawing on WHO and UNICEF Supply Division methodologies and country-level delivery cost databases [25,26,27,30], with additional verification from UNICEF SD.
I C E R = C o s t s   s c e n a r i o C o s t s   B A U   s c e n a r i o D A L Y s   B A U D A L Y s     s c e n a r i o
Health effects were measured in disability-adjusted life years (DALYs), with each cycle calculated as years of life lost plus years lived with disability. Incremental cost-effectiveness ratios (ICERs) were computed by dividing incremental costs by the DALYs averted relative to the business-as-usual (BAU) scenario (Equation (A1)) To estimate the cost-effectiveness, the ICER/GDP per capita ratio was used. Vaccine procurement costs were set at USD 16.00 per dose for PCV13 and USD 3.45 for PCV10 [31], resulting in total program costs of USD 68.00 and USD 20.57 per fully vaccinated child, respectively.
Adverse events following immunization were not modelled in the analysis. This decision was based on the assumption that severe adverse events associated with both PCV10 and PCV13 vaccination are uncommon, in line with the decision made by existing economic evaluations [32,33].
Table 3. Cost inputs (in 2024 USD).
ParameterAge 0–4Age 5–64Age ≥ 65Reference
Cost per disease case—Otitis media16.7020.0420.04Estimated using PPP-adjusted and inflation-corrected average prices from Tunisia and Algeria [34]
Cost per disease case—Meningitis815.04978.05978.05As above
Cost per disease case—NPNM326.08391.30391.30As above
Cost per disease case—Pneumococcal pneumonia42.6251.2551.25As above

2.5. Calibration

The model was calibrated to reproduce a realistic BAU scenario prior to vaccine introduction. To do this, a 21-year burn-in period was used to stabilize the susceptible, recovered, infectious, and disease levels and align the simulated population with Egypt’s demographic structure in the first analysis year. Calibration targets included reported incidence rates for acute otitis media, meningitis, non-pneumonia/non-meningitis invasive disease, and pneumococcal pneumonia. Model parameters were iteratively adjusted until simulated age-specific incidence patterns matched observed BAU values.
Population dynamics were incorporated through a demographic transition matrix that moves individuals into older age groups or death over time, ensuring that age-specific transmission patterns evolve with the underlying population structure.
The model was implemented in R (version 4.2), with Excel used for supplementary tabulation and diagramming. Numerical integration of the differential equations was performed using the classical fourth-order Runge–Kutta (rk4) method, implemented via the deSolve package in R.

2.6. Scenario Analysis Reflecting Egyptian Context

To address the question of affordability and sustainable financing, reflecting the Egyptian context, the analysis explored various scenarios based on two key variables, the time of introduction (discussed here) and the cost of vaccination (Section 2.4). Firstly, the BAU scenario reflects the current situation in Egypt, where no S. Pn vaccination occurs. The intervention scenarios vary the time of vaccination introduction between immediate, 5-year delay, and 10-year delay. Regarding vaccine products, as PCV13 is the priority vaccine product for Egypt [7], it was included in all modelled scenarios. To assess the price implications of introducing a lower-cost alternative, we also modelled two scenarios where immediate introduction of UNICEF-procured PCV10 was introduced, followed by either a switch or a gradual transition to domestically produced PCV13. For all scenarios that include UNICEF procurement, Gavi MICs support is incorporated.

2.7. Domestic Manufacturing Cost Assumptions

In addition to the 5 scenarios, the analysis considered varied domestic manufacturing cost assumptions. The analysis used the UNICEF long-term arrangement (LTA) price as a benchmark and explored potential deviations due to local manufacturing. The analysis allowed domestic manufacturing prices to be either higher or lower than the UNICEF LTA price, reflecting insights from both experts and the literature. Some evidence suggests local production could raise costs [35], while expert opinion highlights potential cost reductions through economies of scale and lower logistics expenses [36]. The UNICEF LTA price was therefore used as a benchmark, and domestic manufacturing prices were estimated at a −10%, 0%, and +10% change. For the immediate initiation, two additional scenarios were defined. One with the change from PCV10 pricing to PCV13 pricing in year 5, and a second with a gradual change in three years of change from PCV10 to PCV13. Table 4 gives an overview of the scenarios.

2.8. Sensitivity Analysis

To test the robustness of the model and outcomes, a one-way deterministic sensitivity analysis was performed on the cost of vaccination, vaccination uptake, years of life lost at premature death, vaccination effectiveness on transmission, and effectiveness on transmission for natural immunity. In addition, the following parameters were included for every disease, including cost of treatment, disutility, duration, case-fatality rate, vaccine effectiveness, and incidence. The key parameters were varied by ±20% in order to determine the impact. Results are presented for each parameter increased by 20% and decreased by 20%, respectively. For parameters that applied to all three age groups, the values were varied simultaneously, generating a single sensitivity analysis outcome. The sensitivity was performed on the immediate vaccination scenario with 0% change on the vaccination cost.

3. Results

Results are first presented for the base-case analysis of immediate PCV13 introduction, followed by comparative scenario and sensitivity analyses. Outcomes are reported as deaths averted, and ICERs are expressed relative to GDP per capita, annual budget impact, and return on investment over a 20-year time horizon.

3.1. Base-Case Cost-Effectiveness, Budget Impact, and ROI

In the base-case scenario of immediate PCV13 introduction at the UNICEF LTA price, vaccination is projected to avert 38.5 million cases and 139,451 deaths over 20 years compared with business as usual (Table 5). The ICER/GDP ratio of 0.16 indicates that the intervention is highly cost-effective.
The base-case results in a total annual budget impact of USD 124.91 million without Gavi support and USD 120.94 million with Gavi support. The program delivers a return-on-investment of 23.12, reflecting substantial savings from reduced pneumococcal disease burden.
These findings form the benchmark for interpreting all subsequent scenario and sensitivity analyses.
Across all scenarios, earlier introduction of pneumococcal vaccination produced greater health impact than delayed implementation (Table 6). Relative to the base case, a 5-year delay reduces deaths avoided from 139,451 to 97,374 (42,077 fewer deaths; 30.2% reduction). A 10-year delay further reduces deaths avoided to 54,407 (85,044 fewer deaths; 61.0% reduction) over 20 years.
Variation in domestic manufacturing price assumptions leads to modest increases in ICER/GDP ratios; however, all scenarios remain highly cost-effective. Differences are driven primarily by changes in program cost, as health outcomes remain comparable across price levels (Table 6).
Alternative product pathways also perform favourably relative to the base case. Scenarios involving immediate PCV10 introduction followed by PCV13—via a direct switch in year 5 or a gradual transition—result in ICER/GDP ratios of 0.12 and 0.13, respectively, reflecting lower initial vaccination costs while achieving similar long-term health outcomes. Overall, the scenario results indicate that delaying PCV introduction substantially diminishes both health and economic benefits, while immediate introduction whether with PCV13 or a temporary PCV10 pathway provides the highest value.

3.2. Age-Specific Distribution of Healthcare Cost Savings

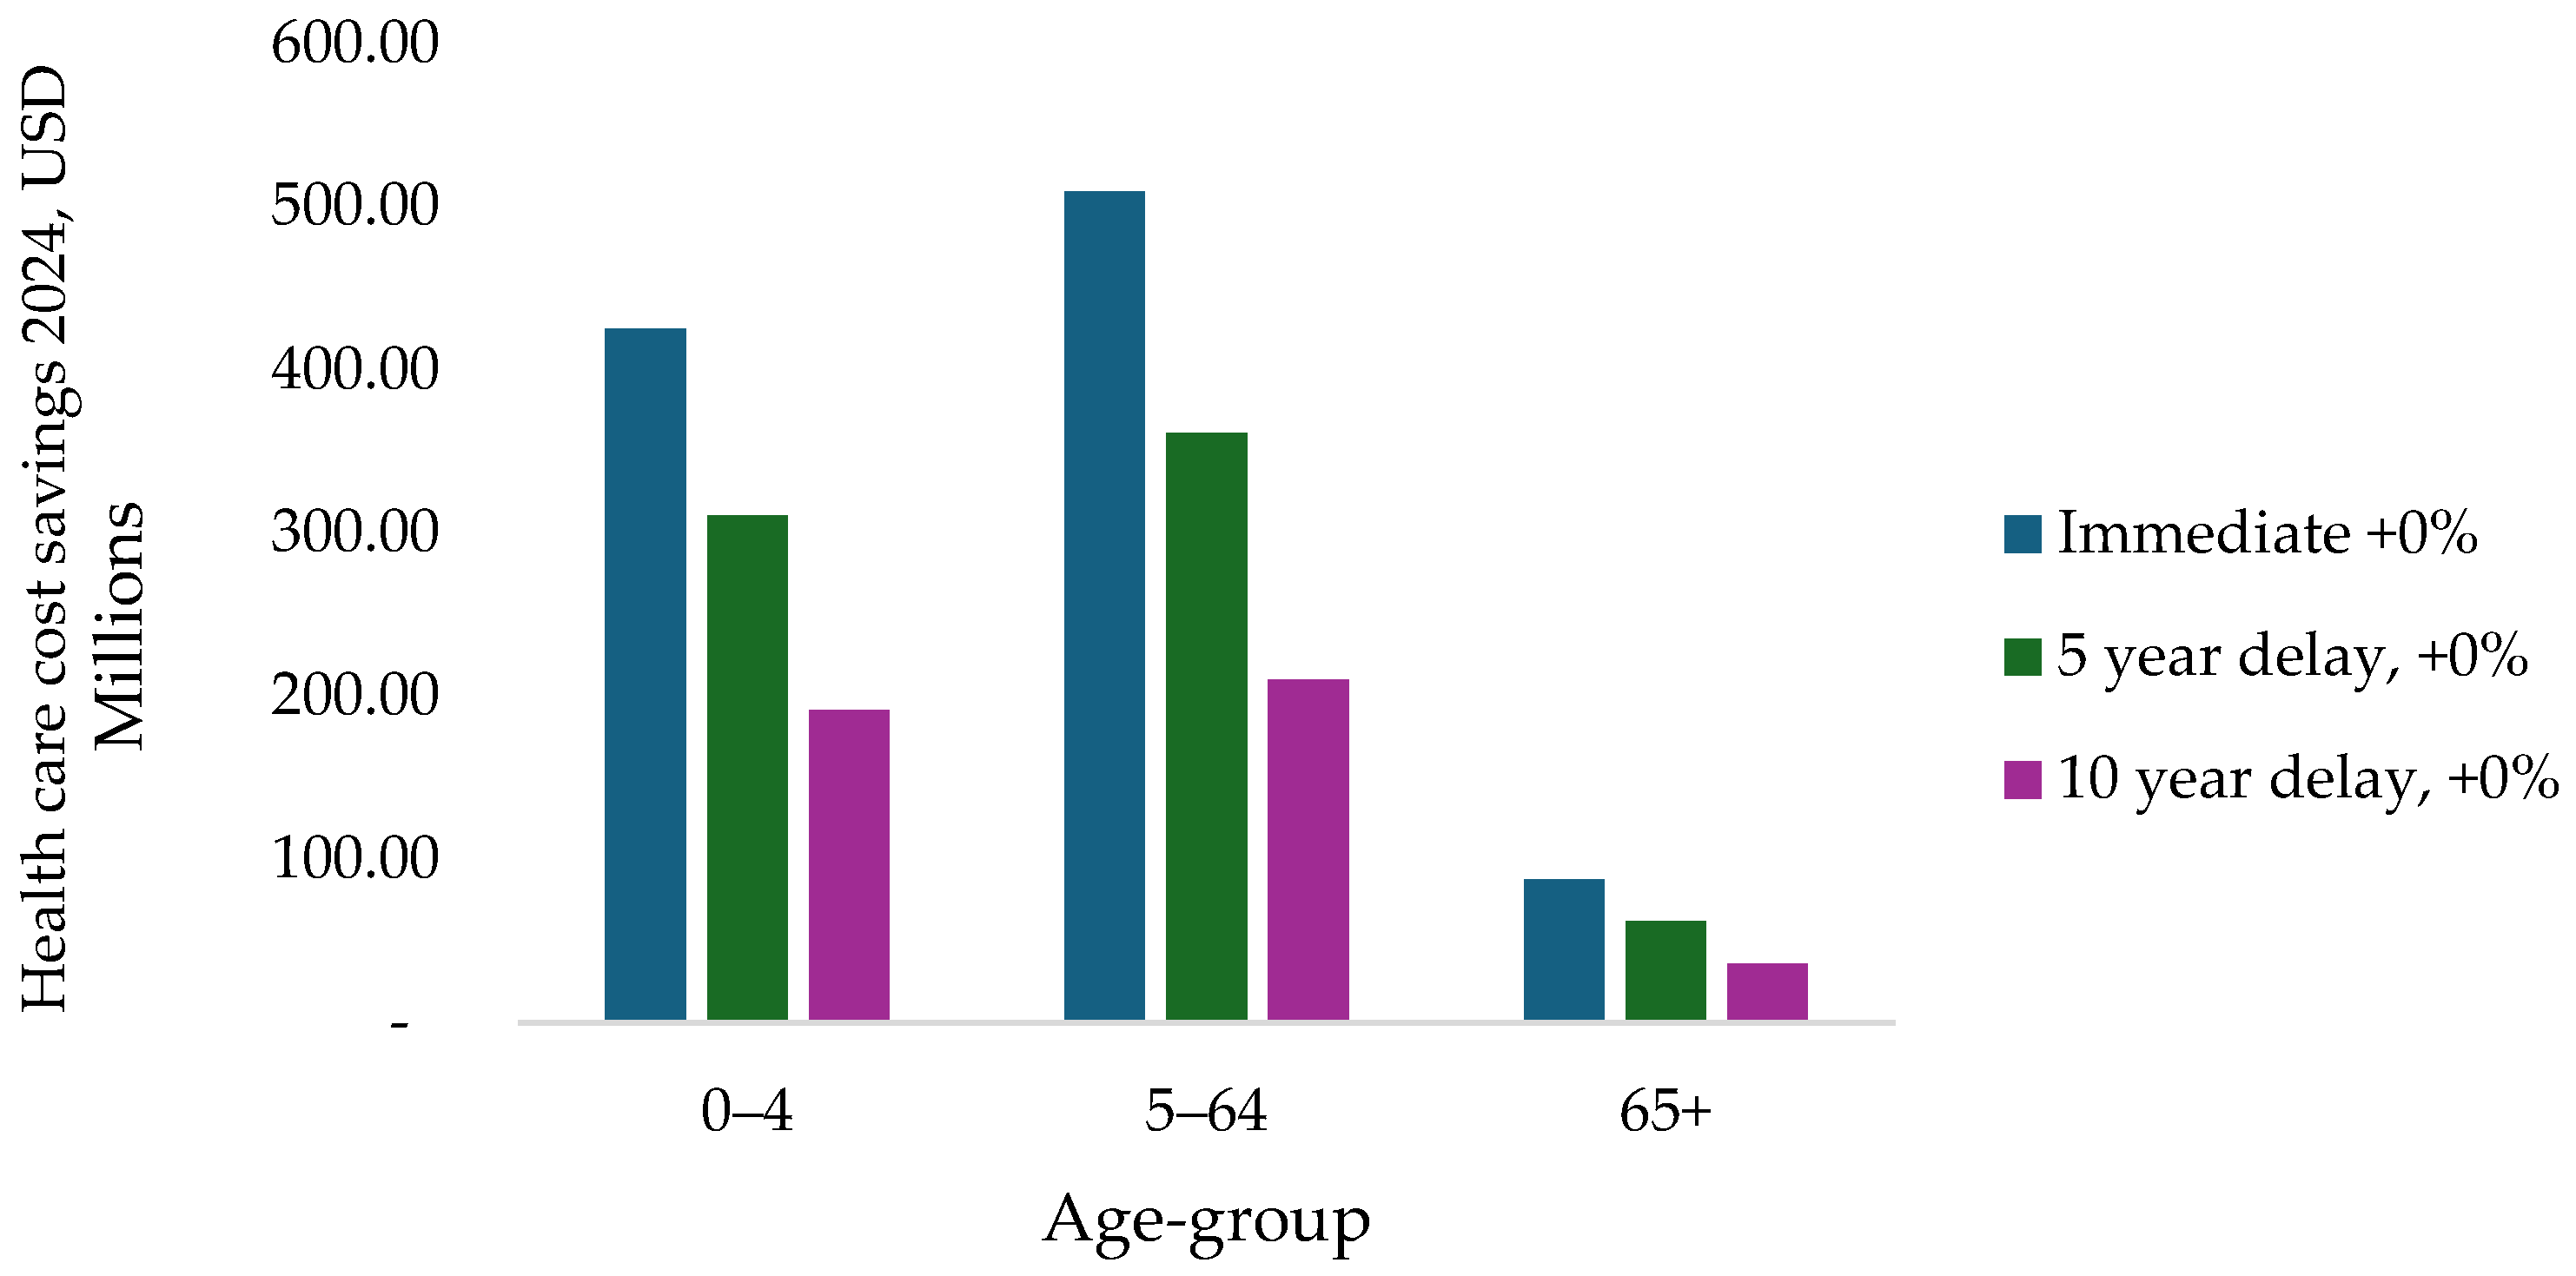
Figure 2 presents the distribution of healthcare cost savings by age group across the immediate introduction, 5-year delay, and 10-year delay scenarios using the base PCV13 price. Immediate introduction produces the largest cost savings in all age groups. The greatest reductions occur in the 0–4 and 5–64 age groups, reflecting their higher burden of pneumococcal disease. Savings in the 65+ age group are smaller in absolute terms but remain positive across all scenarios. Overall, a substantial share of total healthcare cost savings occurs among individuals aged over five years.

3.3. Budget Impact

Table 7 presents the annual average budget impact of pneumococcal vaccination across all scenarios, with and without Gavi support, as well as the corresponding return on investment (ROI) over the 20-year horizon. Immediate introduction of PCV13 results in the highest budget expenditure but also the greatest long-term savings, reflected in the highest ROI among the PCV13 scenarios.
Delaying introduction reduces the overall budget impact; however, these scenarios are associated with lower ROI values compared with the base case. Alternative product pathways show favourable performance, with immediate PCV10 introduction followed by a switch to PCV13 yielding the highest ROI and the lowest budget impact within the immediate-introduction scenarios.

3.4. Sensitivity Analysis Results

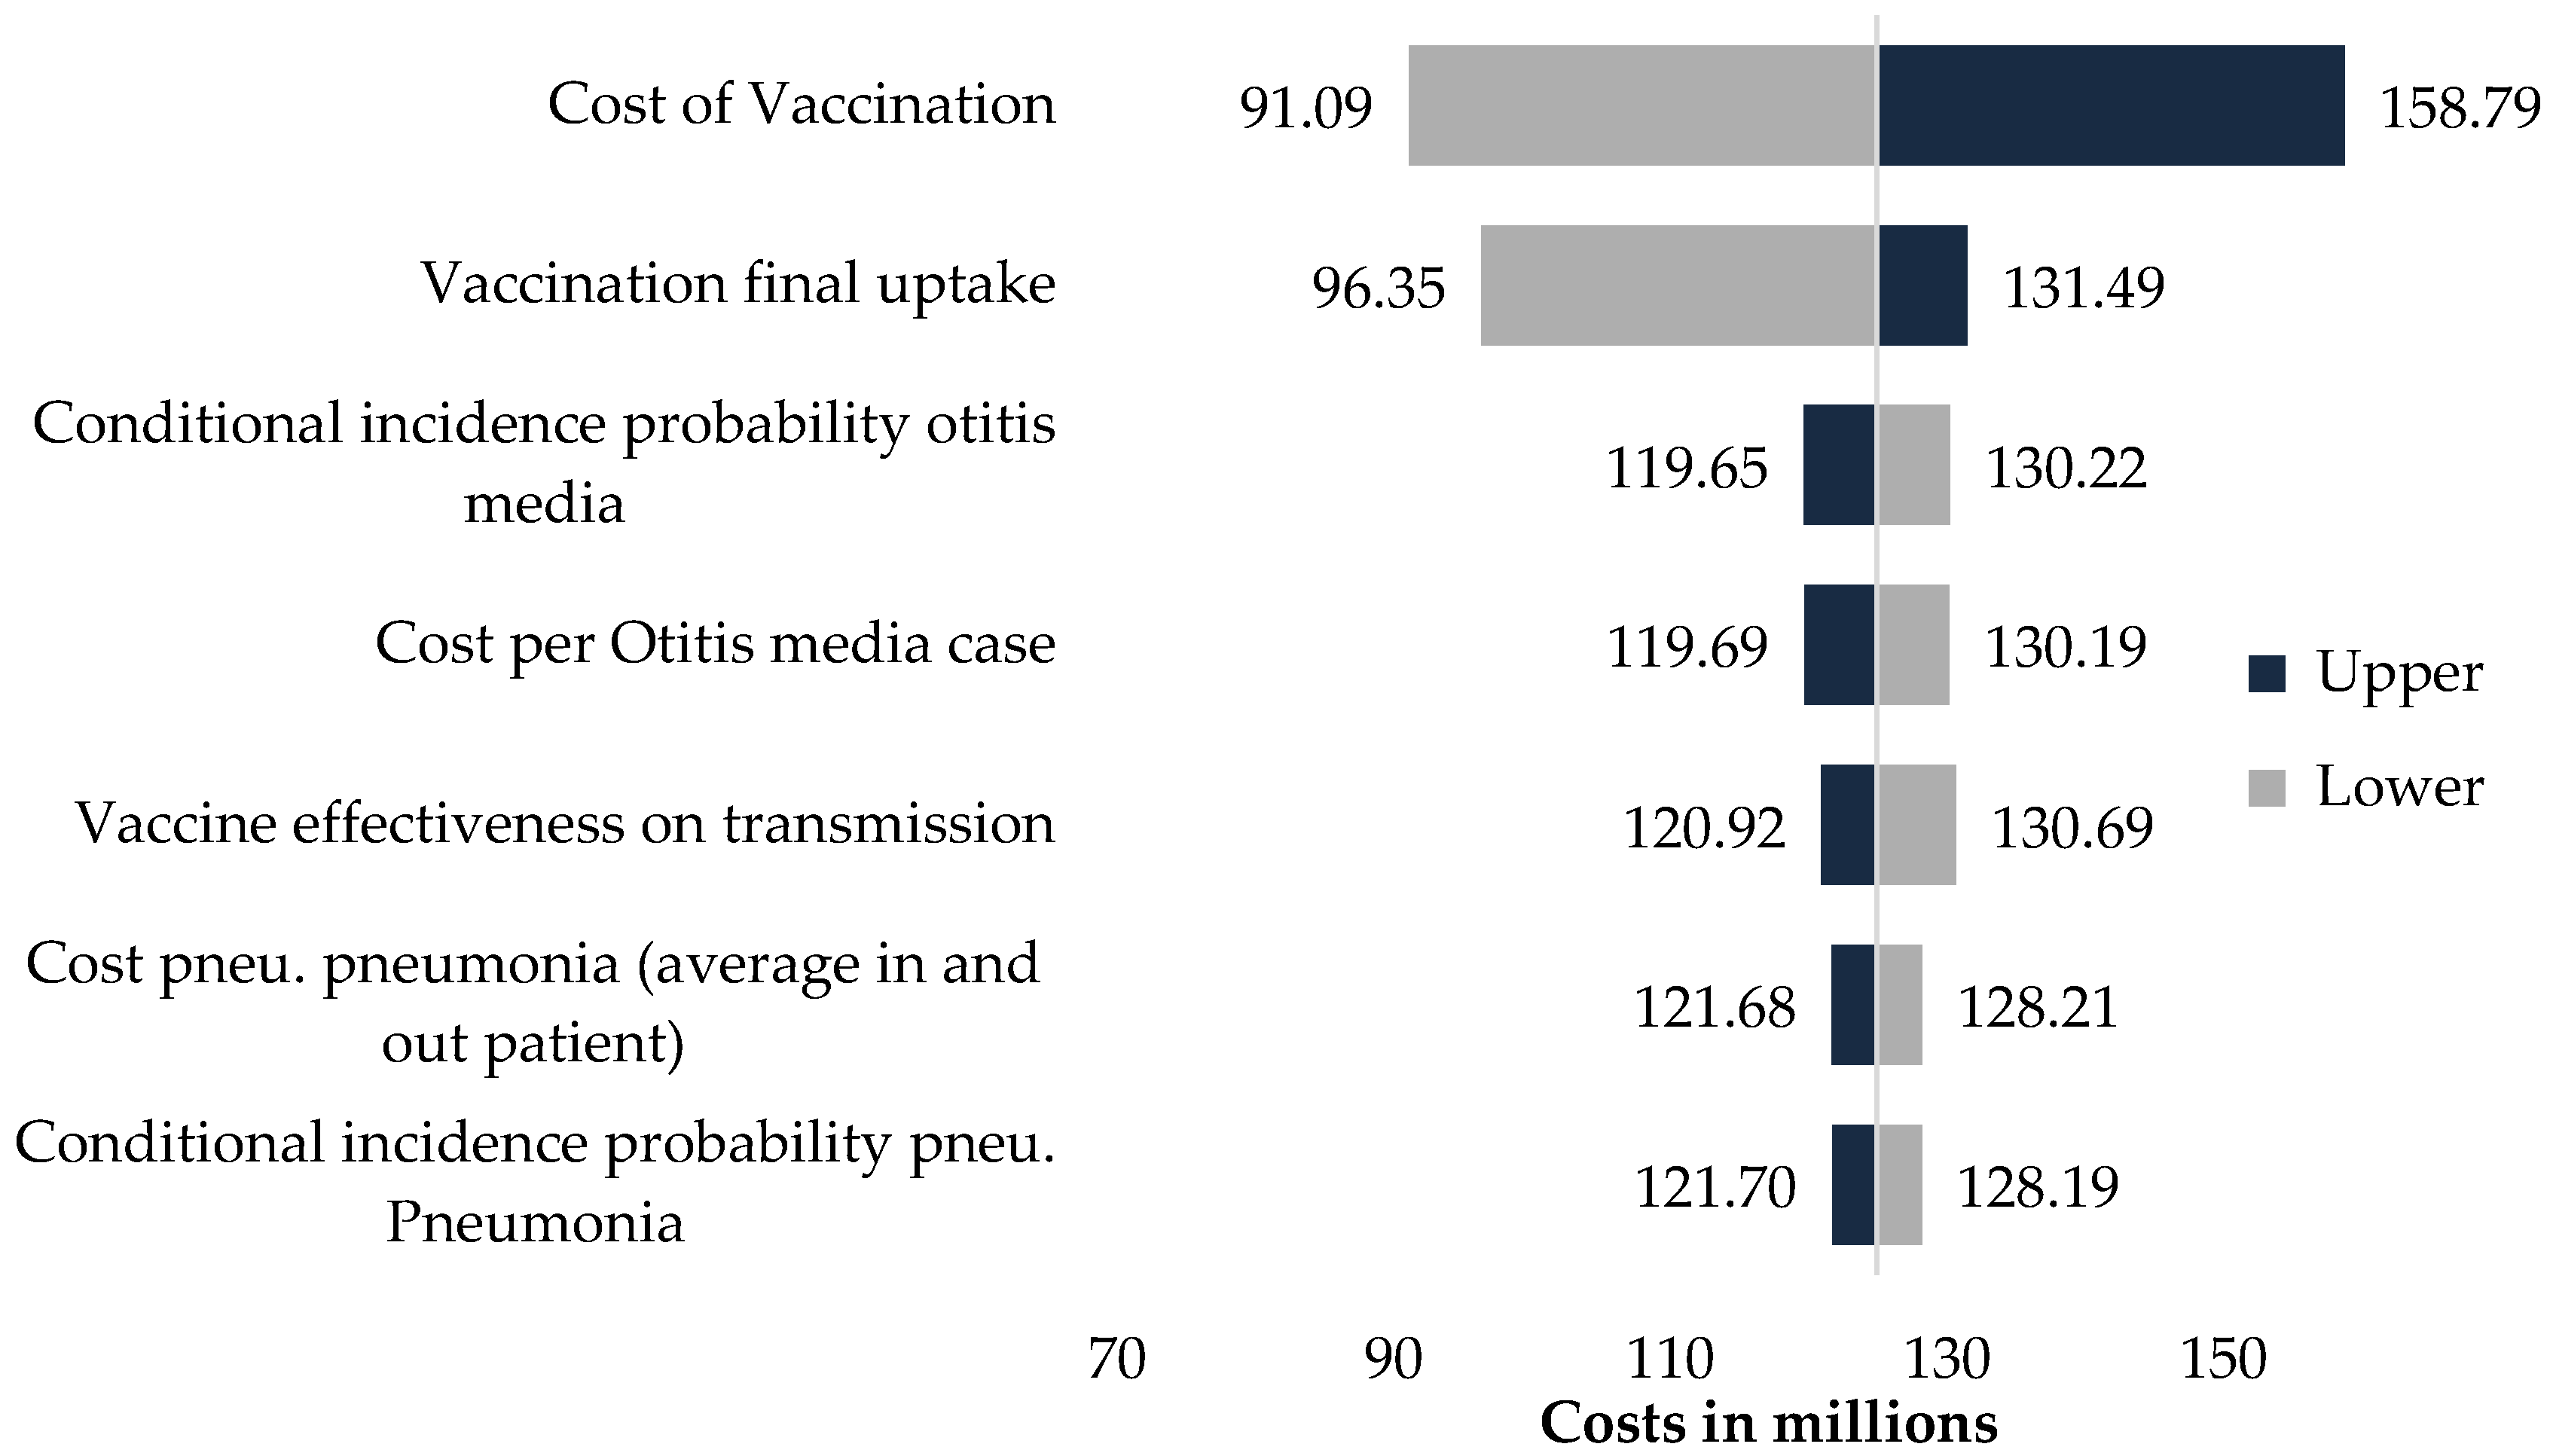
One-way sensitivity analysis (Appendix C) shows that vaccine price and vaccination uptake are the two parameters with the greatest influence on cost-effectiveness and budget impact outcomes. A ±20% change in vaccine price results in annual average costs ranging from approximately USD 91 million to USD 159 million, compared with around USD 125 million in the base case. A ±20% change in vaccination uptake produces annual budget impacts between approximately USD 96 million and USD 131 million.
Other parameters, including disease-specific incidence, case-fatality rates, and disutility values, produced comparatively smaller changes in outcomes. Overall, the sensitivity analysis shows that model results are most responsive to changes in program cost and uptake levels.
As an internal validation step, we modelled a direct-effects-only scenario (excluding herd protection). This reduced total deaths averted to approximately 46,000 over 20 years (≈2300 per year), with corresponding ICERs of 0.27–0.38× GDP per capita and an ROI of USD 6–8 per dollar invested (Appendix C).

4. Discussion

This dynamic, age-structured cost-effectiveness analysis shows that introducing PCVs into Egypt’s routine immunization schedule is highly cost-effective and yields substantial health and economic benefits. Across all implementation scenarios, the incremental cost-effectiveness ratios (ICERs) were well below commonly used willingness-to-pay thresholds, and the ROI ranged from roughly US$16 to US$28 per dollar spent. Immediate introduction of PCV13 was projected to avert about 38.5 million cases and 139,451 deaths over twenty years, or nearly 6972 deaths per year, and to generate significant savings in healthcare expenditure through reductions in pneumonia, meningitis, non-pneumonia non-meningitis invasive disease, and acute otitis media (AOM).
Earlier Egyptian economic evaluations of PCVs have produced more conservative estimates of health gains and higher cost-effectiveness ratios. Sibak et al. [3] evaluated PCV13 using a static model that restricted benefits to children under five years and estimated roughly 800–2500 deaths averted per year, with ICERs between 0.26 and 1.2 times of Egypt’s gross domestic product (GDP) per capita [3]. Sevilla et al. employed a pseudo-dynamic Markov model over a 100-year horizon and reported about 2300 deaths averted per year with ICERs near one times GDP per capita [4]. A global pseudo-dynamic analysis across 112 LMICs by Chen et al. suggested that PCV13 introduction could avert approximately 697,000 deaths and 46 million disability-adjusted life years (DALYs) globally, with an incremental cost of 851 international dollars per DALY averted; scaled to Egypt, this implies 1000–1800 preventable under-five deaths per year [6]. Other LMIC analyses that account for indirect protection report cost-effectiveness ratios of about 0.20 × GDP per capita and above [11,37,38]. The direct-effects-only sensitivity analysis further supports the validity of the model. Under this scenario, the model projects ~46,000 deaths averted over 20 years (≈2300 annually), with ICERs of 0.27–0.38× GDP per capita more closely matching estimates from earlier Egypt-specific evaluations and global LMIC analyses of under-five mortality [3,4,6]. This concordance indicates that the higher mortality reductions observed in the full dynamic model arise from the inclusion of older age groups and indirect protection rather than from overly optimistic assumptions. Compared with these studies, our model predicts substantially greater health gains and more favourable cost-effectiveness.
Several methodological features help explain why this dynamic model produces larger estimated health and economic benefits than earlier Egyptian evaluations [3,4]. Unlike previous studies that focused primarily on children under five or used static herd-immunity-effect assumptions, our model applies the nationally adjusted disease burden across all age groups and explicitly simulates transmission, capturing substantial indirect protection in older children and adults. The 20-year horizon concentrates outcomes within a policy-relevant time frame, whereas longer horizons dilute annualized effects. Inclusion of acute otitis media and outpatient pneumonia, major contributors to morbidity and cost [39], also increases overall gains compared with models limited to invasive disease. We additionally assume more conservative natural immunity (one-third of vaccine-derived protection), which increases the incremental benefit of vaccination [15,22,23]. Finally, updated 2024 cost data and inclusion of the value of prevented premature deaths yield higher return-on-investment estimates than earlier analyses based mainly on direct medical costs.

4.1. Policy Implications and Optimal Introduction Strategy

The base case of immediate PCV13 introduction using UNICEF long-term agreement pricing produces the largest health gains and strongest economic returns. Delaying introduction by five or ten years reduces deaths averted by approximately 30% and 61%, respectively, and lowers ROI, even though delayed scenarios require lower annual budgets in absolute terms. Variation in domestic manufacturing prices only has a modest effect on ICERs; however, lower local prices improve ROI. Scenarios that begin with PCV10 procurement through UNICEF and then transition to locally manufactured PCV13 achieve health benefits comparable to immediate PCV13 introduction and yield the highest ROIs and the lowest annual budget requirements. These findings suggest that a dual-track approach, early adoption through international procurement, followed by a gradual shift to domestic production, can balance immediate health gains with long-term fiscal sustainability and industrial policy objectives.
PCV10 is only slightly less effective against currently prevalent serotypes but may offer lower long-term protection because of serotype replacement [40]. Its price, however, is roughly 80% lower than PCV13 [32], making it an attractive alternative when budget constraints preclude immediate PCV13 adoption. In such circumstances, implementing PCV10 first and transitioning to PCV13 once local manufacturing is established can still deliver strong health benefits and economic value.
Our pricing assumptions were intended to capture higher unit costs during the early phases of domestic production and lower costs once manufacturing reaches scale and enables regional export, operationalized as ±10% relative to the UNICEF long-term agreement price. This approach is supported by evidence showing that domestically manufactured vaccines are often more expensive per dose in their early years than vaccines procured through Gavi or UNICEF pooled mechanisms [41,42]. This pattern has been observed for PCVs and other vaccines, reflecting high upfront R&D and technology-transfer costs, a limited initial production scale, and restricted early market access [41,43]. In South Africa, local fill-and-finish production of PCV13 was reported to be more expensive than an imported alternative, leading to a subsequent switch [43]. While realized prices will depend on country-specific production arrangements and scale, these scenarios reflect a plausible, evidence-informed range rather than precise price forecasts.
The annual average budget impact of PCV as a proportion of the latest available annual healthcare expenditure for Egypt (2022) is 0.46–0.47% [5]. For comparison, the latest vaccine expenditure data (2022) suggests that Morocco and Tunisia spend 0.07% and 0.24% of annual healthcare expenditure, respectively, on all vaccines combined [44]. Compared to international benchmarks, the budget impact for all PCV scenarios in Egypt falls within the spending range for vaccine investments, which typically account for 0.4–1.4% of total health expenditure [45,46,47,48].

4.2. Strengths, Limitations, and Generalizability

Several notable strengths characterize this work. The age-stratified dynamic compartmental model captures heterogeneous mixing patterns and age-specific susceptibility profiles, while simultaneously modelling multiple infectious diseases within a unified framework. The exploration of multiple scenarios allows for a comprehensive assessment of uncertainty and potential future trajectories. Incorporating demographic ageing ensures that the model reflects evolving population structures over time. Calibration against real-world incidence data enhances empirical validity, and the integration of a social contact matrix provides a biologically grounded foundation for estimating age-assortative transmission.
This analysis has some limitations. Estimates of incidence and case fatality were derived from older published Egyptian and regional sources rather than comprehensive up-to-date Egyptian surveillance data and may therefore reflect measurement uncertainty. Assumptions regarding natural immunity, serotype replacement, and the duration of vaccine-derived protection may also differ from real-world dynamics. Indirect societal costs were not included, suggesting that the cost-effectiveness of PCV introduction may be conservative. Although the dynamic model captures herd immunity effects within Egypt, generalizability to other settings will depend on local epidemiology, coverage levels, and cost structures. The model also did not incorporate a one-time catch-up campaign recommended by SAGE [18], though its exclusion is unlikely to materially affect 20-year results. A further limitation is that a probabilistic sensitivity analysis was not performed, owing to the lack of reliable distributional information for several key model parameters. Because many inputs were based on heterogeneous literature sources, calibrated values, or extrapolated estimates, specifying parametric distributions would have required unsupported assumptions and might have produced misleading uncertainty estimates. Uncertainty was therefore explored using deterministic one-way sensitivity analyses. Finally, the use of three age groups and the assumption of comparable effectiveness for PCV10 and PCV13 reflect modelling constraints and introduce additional uncertainty, although the WHO considers both vaccines highly immunogenic.

5. Conclusions

This dynamic evaluation confirms that PCV introduction in Egypt represents a high-value investment. By including all age groups, adopting a decision-relevant time horizon, incorporating outpatient disease, using realistic natural immunity assumptions, modelling herd immunity effects and serotype replacement, and applying updated economic valuation, the model estimates far larger health and economic gains than earlier under-five-only analyses. Immediate introduction maximizes benefits; delays come with substantial opportunity costs in preventable deaths and healthcare savings. Combining early PCV10 adoption with a timely transition to PCV13 can preserve strong health impacts while supporting domestic manufacturing goals and maintaining fiscal sustainability.

Author Contributions

Substantial contributions to the conception or design of the work, acquisition, analysis or interpretation of data for the work—C.B., A.H., F.R.-C., Z.W., K.P., S.F., M.A., S.K. and I.O. Methodology—A.H. and C.B. Validation—F.R.-C., S.F., M.A., S.K. and I.O. Formal analysis—A.H. and C.B. Investigation—A.H., F.R.-C. and C.B. Data curation—A.H., C.B., F.R.-C., Z.W. and K.P.; Writing—original draft preparation—C.B. and A.H. Writing and drafting of the work or revising critically for important intellectual content—C.B., A.H., F.R.-C., S.F., M.A., S.K. and I.O. Visualization—A.H. Final approval of version to be published—C.B., A.H., F.R.-C., Z.W., K.P., S.F., M.A., S.K. and I.O. All authors have read and agreed to the published version of the manuscript.

Funding

UNICEF Regional Office for the Middle East and North Africa undertook this work in collaboration with Triangulate Health Ltd. through the gracious financial support from Gavi, The Vaccine Alliance. Grant number SC220896. The funders had no role in the design of this study; in the collection, analysis, or interpretation of data; in writing the manuscript; or in the decision to submit it for publication. As part of a broader project, Gavi participated in a steering group that provided high-level input on intended project outcomes, including dissemination of results.

Data Availability Statement

Data is available upon reasonable request to the author.

Acknowledgments

We would like to thank Maureen Gallagher, Essam Allam, and Mutribjon Bahruddinov from the UNICEF Egypt Country Office, as well as Caitlin Longden from Gavi, the Vaccine Alliance for their valuable contributions to the situational analysis and for providing general technical support throughout the development of this study. We also thank the Egyptian Ministry of Health for its collaboration and policy-relevant guidance. The authors have reviewed and edited the manuscript and take full responsibility for the content of this publication.

Conflicts of Interest

Authors “Chrissy Bishop, Arnold Hagens, Federico Cairoli, Konstantina Politopoulou, and Zicheng Wang” were employed by the company Triangulate Health Ltd. The remaining authors, Motuma Abeshu, Sowmya Kadandale, Ibironke Oyatoye, and Saadia Farrukh, declare that the research was conducted in the absence of any commercial or financial relationships that could be construed as a potential conflict of interest.

Abbreviations

The following abbreviations are used in this manuscript:
DALYsDisability-adjusted life years
ICERIncremental Cost-Effectiveness Ratio
GDPGross Domestic Product
GaviGavi the Vaccine Alliance
IPDInvasive pneumococcal disease
LMICsLow- and middle-income countries
LTALong-term arrangement
PCV1010-valent pneumococcal conjugate vaccine
PCV1313-valent pneumococcal conjugate vaccine
ROIReturn on Investment
S. PnStreptococcus Pneumoniae
WTPWillingness to pay

Appendix A. Dynamic Transition Model

For each age group i, the rate of change in the number of infectious individuals is defined by Equations (A1)–(A3). These equations allow the model to capture how vaccination alters susceptibility, transmission, and progression across the population and how indirect protection evolves over time.
d I i d t = β · S i j C i j ( 1 V a c _ E f f _ I n f i ) · I v j + ( 1 N a t _ E f f _ I n f i ) · I n j + I j N a l i v e γ I i + j D i j I j
d I v i d t = β · S v i j C i j ( 1 V a c _ E f f _ I n f i ) · I v j + ( 1 N a t _ E f f _ I n f i ) · I n j + I j N a l i v e γ I v i + j D i j I v i
d I n i d t = β · R i m i j C i j ( 1 V a c _ E f f _ I n f i ) · I v j + ( 1 N a t _ E f f _ I n f i ) · I n j + I j N a l i v e γ I n i + j D i j I n i
d P D i d t = P D _ i n c i · I i · γ P D i P D _ d u r + j D i j P D i
d P D v i d t = ( 1 V a c _ E f f _ D i s e a s e i ) · P D _ i n c i · I v i · γ P D v i P D _ d u r + j D i j P D v i
d P D n i d t = ( 1 N a t _ E f f _ D i s e a s e i ) · P D _ i n c i · I n i · γ P D n i P D _ d u r + j D i j P D n i
d [ d i s e a s e ] i d t = f r a c _ [ d i s e a s e ] i · P D i + f r a c _ [ d i s e a s e ] v i · P D v i + f r a c _ [ d i s e a s e ] n i · P D n i
where
  • i and j index age groups.
  • β is the transmission probability.
  • Cij is the contact rate between groups i and j.
  • Si, Svi, and Rimi represent susceptible unvaccinated, susceptible vaccinated, and recovered-immune individuals.
  • Ii, Ivi, Ini represent infectious, infectious vaccinated, and infectious recovered-immune individuals.
  • PDi, PDvi, PDni denote individuals affected with a pneumococcal disease (PD, PDv, PDn) for non-vaccinated, vaccinated, and natural immune individuals, respectively.
  • VacEffInf and NatEffInf denote vaccine and natural immunity effectiveness against infection.
  • Vac_Eff_Diseasei denotes weighted vaccine effectiveness on the included disease.
  • Nat_Eff_Diseasei denotes weighted natural immunity effectiveness on the included disease.
  • PD_inci denotes the fraction of individuals that transitions to one of the included diseases.
  • PD_dur is the average duration an individual stays ill.
  • frac_[disease]i, frac_[disease]vI, frac_[disease]ni denotes the fraction of the respective disease within the individuals affected with a pneumococcal disease (PD, PDv, PDn).
  • γ is the recovery rate (1/duration of infection).
  • D is an ageing and mortality transition matrix.
  • N_alive is the total living population.

Appendix B. Cost per Child Vaccinated

Table A1. Cost per child vaccinated using UNICEF LTA prices, 2024 USD.
Product Cost of Vaccine Handling Injection Supply Buffer Applied to Product Price (6%) Total Vaccination Cost per Child, USD (3 Doses)
PCV Price, USD (3 Doses) Wastage 17% (Cost, USD) Delivery (Cost, USD) Vaccines 3.5% Freight 3.2% Injection Supply, 3 Doses (Cost, USD) Wastage 10% (Cost, USD) Handling AD Syringes, 16% Freight Fees (20%) Surcharge (8%)
PCV1348.008.167.021.680.220.160.0160.030.030.00262.8868.20
PCV1010.351.767.020.360.220.160.0160.030.030.00260.6220.57

Appendix C. Sensitivity Analyses

Figure A1. Tornado diagram.
Vaccines 14 00318 g0a1
Table A2. Key results of budget-impact analysis, cost-effectiveness, and return on investment for each scenario, focusing exclusively on the health benefits for children under 5 years old.
ScenariosTotal Deaths AvoidedTotal Cases AvoidedICER/GDP RatioDisability Adjusted Life Years (DALYs) AvertedTotal Budget Impact Without Gavi (Annual Avg)Total Budget Impact with Gavi (Annual Avg)Return-on Investment
−10% local manufacturing price 46,047 20,970,490 0.27 2,160,398 133.60 130.02 7.8
Immediate +0% local manufacturing price 46,047 20,970,490 0.30 2,160,398 150.52 146.55 6.9
+10% local manufacturing price 46,047 20,970,490 0.33 2,160,398 167.44 163.08 6.2
−10% local manufacturing price 32,847 14,959,141 0.29 1,419,346 99.94 96.58 7.2
5-year delay +0% local manufacturing price 32,847 14,959,141 0.33 1,419,346 113.25 109.49 6.3
+10% local manufacturing price 32,847 14,959,141 0.36 1,419,346 125.87 121.74 5.7
−10% local manufacturing price 19,188 8,738,501 0.34 767,431 66.19 63.06 6.1
10-year delay +0% local manufacturing price 19,188 8,738,501 0.38 767,431 74.84 71.34 5.3
+10% local manufacturing price 19,188 8,738,501 0.38 767,431 75.33 71.80 4.8
Immediate, switching price from PCV10 to PCV13 in year 5, +10% local manufacturing price 46,047 20,970,490 0.25 2,160,398 130.15 129.45
Immediate, gradually switching from PCV10 to PCV13 (years 4–7) +10% local manufacturing price 46,047 20,970,490 0.25 2,160,398 132.12 130.86

References

  1. IHME (Institute for Health Metrics and Evaluation). Global Burden of Disease Study 2019 (GBD 2019) Data Resources|GHDx. 2019. Available online: https://ghdx.healthdata.org/gbd-2019 (accessed on 14 June 2024).
  2. Farrar, J.L.; Childs, L.; Ouattara, M.; Akhter, F.; Britton, A.; Pilishvili, T.; Kobayashi, M. Systematic Review and Meta-Analysis of the Efficacy and Effectiveness of Pneumococcal Vaccines in Adults. Pathogens 2023, 12, 732. [Google Scholar] [CrossRef] [Scilit] [PubMed]
  3. Sibak, M.; Moussa, I.; El-Tantawy, N.; Badr, S.; Chaudhri, I.; Allam, E.; Baxter, L.; Freikha, S.A.; Hoestlandt, C.; Lara, C.; et al. Cost-effectiveness analysis of the introduction of the pneumococcal conjugate vaccine (PCV-13) in the Egyptian national immunization program, 2013. Vaccine 2015, 33, A182–A191. [Google Scholar] [CrossRef] [Scilit] [PubMed]
  4. Sevilla, J.P.; Burnes, D.; El Saie, R.Z.; Haridy, H.; Wasserman, M.; Pugh, S.; Perdrizet, J.; Bloom, D. Cost-utility and cost-benefit analysis of pediatric PCV programs in Egypt. Hum. Vaccines Immunother. 2022, 18, 2114252. [Google Scholar] [CrossRef] [Scilit] [PubMed]
  5. World Bank. World Bank Open Data|Data. Available online: https://data.worldbank.org/ (accessed on 19 September 2024).
  6. Chen, C.; Ang, G.; Akksilp, K.; Koh, J.; Scott, J.A.G.; Clark, A.; Jit, M. Re-evaluating the impact and cost-effectiveness of pneumococcal conjugate vaccine introduction in 112 low-income and middle-income countries in children younger than 5 years: A modelling study. Lancet Glob. Health 2024, 12, e1485–e1497. [Google Scholar] [CrossRef] [Scilit]
  7. Egyptian Vaccine Manufacturers Alliance (EVMA). Egypt National Strategy for Vaccine Manufacturing Localization; Report; EVMA: Cairo, Egypt, 2024; Available online: https://evma-egypt.org/wp-content/uploads/2024/12/Strategy-Combined-.pdf (accessed on 25 November 2025).
  8. Gavi. Gavi’s Approach to Engagement with Middle-Income Countries; Report; Gavi: Geneva, Switzerland, 2022. [Google Scholar]
  9. United Nations Industrial Development Organization (UNIDO). Establishing Manufacturing Capabilities for Human Vaccines Key Cost Drivers and Factors to Consider When Planning the Establishment of a Vaccine Production Facility. 2017. Report. Available online: www.unido.org (accessed on 25 November 2025).
  10. Chadwick, C.; Friede, M.; Moen, A.; Nannei, C.; Sparrow, E. Technology transfer programme for influenza vaccines—Lessons from the past to inform the future. Vaccine 2022, 40, 4673. [Google Scholar] [CrossRef] [Scilit] [PubMed]
  11. Shen, K.; Wasserman, M.; Liu, D.; Yang, Y.H.; Yang, J.; Guzauskas, G.F.; Wang, B.C.M.; Hilton, B.; Farkouh, R. Estimating the cost-effectiveness of an infant 13-valent pneumococcal conjugate vaccine national immunization program in China. PLoS ONE 2018, 13, e0201245. [Google Scholar] [CrossRef] [Scilit] [PubMed]
  12. Husereau, D.; Drummond, M.; Augustovski, F.; de Bekker-Grob, E.; Briggs, A.H.; Carswell, C.; Caulley, L.; Chaiyakunapruk, N.; Greenberg, D.; Loder, E.; et al. Consolidated Health Economic Evaluation Reporting Standards 2022 (CHEERS 2022) statement: Updated reporting guidance for health economic evaluations. BMC Med. 2022, 20, 23. [Google Scholar] [CrossRef] [Scilit] [PubMed]
  13. Vynnycky, E.; White, R. An Introduction to Infectious Disease Modelling; Oxford University Press: Oxford, UK, 2010. [Google Scholar]
  14. Weiser, J.N.; Ferreira, D.M.; Paton, J.C. Streptococcus pneumoniae: Transmission, colonization and invasion. Nat. Rev. Microbiol. 2018, 16, 355–367. [Google Scholar] [CrossRef] [Scilit] [PubMed]
  15. van Zandvoort, K.; Hassan, A.I.; Bobe, M.O.; Pell, C.L.; Ahmed, M.S.; Ortika, B.D.; Ibrahim, S.; Abdi, M.I.; Karim, M.A.; Eggo, R.M.; et al. Pre-vaccination carriage prevalence of Streptococcus pneumoniae serotypes among internally displaced people in Somaliland: A cross-sectional study. Pneumonia 2024, 16, 25. [Google Scholar] [CrossRef] [Scilit] [PubMed]
  16. Prem, K.; Cook, A.R.; Jit, M. Projecting social contact matrices in 152 countries using contact surveys and demographic data. PLoS Comput. Biol. 2017, 13, e1005697. [Google Scholar] [CrossRef] [Scilit] [PubMed]
  17. WHO. Strategic Advisory Group of Experts on Immunization (SAGE); Report; WHO: Geneva, Switzerland, 2019; Available online: https://terrance.who.int/mediacentre/data/sage/SAGE_Docs_Ppt_Oct2019/0_SAGE_Yellow_Book_October_2019.pdf (accessed on 16 December 2025).
  18. WHO. Strategic Advisory Group of Experts on Immunization (SAGE)—SAGE Working Group on Pneumococcal Vaccines. 2025. Available online: https://www.who.int/groups/strategic-advisory-group-of-experts-on-immunization/working-groups/pneumococcal-vaccines (accessed on 16 December 2025).
  19. Elsisi, G.H.; Kaló, Z.; Eldessouki, R.; Elmahdawy, M.D.; Saad, A.; Ragab, S.; Elshalakani, A.M.; Abaza, S. Recommendations for Reporting Pharmacoeconomic Evaluations in Egypt. Value Health Reg. Issues 2013, 2, 319–327. [Google Scholar] [CrossRef] [Scilit] [PubMed]
  20. Pichon-Riviere, A.; Drummond, M.; Palacios, A.; Garcia-Marti, S.; Augustovski, F. Determining the efficiency path to universal health coverage: Cost-effectiveness thresholds for 174 countries based on growth in life expectancy and health expenditures. Lancet Glob. Health 2023, 11, e833–42. [Google Scholar] [CrossRef] [Scilit] [PubMed]
  21. Badawy, M.; El Kholy, A.; Sherif, M.M.; Rahman, E.A.; Ashour, E.; Sherif, H.; Mahmoud, H.E.; Hamdy, M. Serotypes of Streptococcus pneumoniae in Egyptian children: Are they covered by pneumococcal conjugate vaccines? Eur. J. Clin. Microbiol. Infect. Dis. 2017, 36, 2385–2389. [Google Scholar] [CrossRef] [Scilit] [PubMed]
  22. Weinberger, D.M.; Warren, J.L.; Dalby, T.; Shapiro, E.D.; Valentiner-Branth, P.; Slotved, H.C.; Harboe, Z.B. Differences in the Impact of Pneumococcal Serotype Replacement in Individuals with and Without Underlying Medical Conditions. Clin. Infect. Dis. 2019, 69, 100. [Google Scholar] [CrossRef] [Scilit] [PubMed]
  23. El-Nawawy, A.A.; Hafez, S.F.; Meheissen, M.A.; Shahtout, N.M.A.; Mohammed, E.E. Nasopharyngeal Carriage, Capsular and Molecular Serotyping and Antimicrobial Susceptibility of Streptococcus pneumoniae among Asymptomatic Healthy Children in Egypt. J. Trop. Pediatr. 2015, 61, 455–463. [Google Scholar] [CrossRef] [Scilit] [PubMed]
  24. Hoti, F.; Erästö, P.; Leino, T.; Auranen, K. Outbreaks of Streptococcus pneumoniae carriage in day care cohorts in Finland—Implications for elimination of transmission. BMC Infect. Dis. 2009, 9, 102. [Google Scholar] [CrossRef] [Scilit] [PubMed]
  25. Immunization Economics. Standardized Country-Level Immunization Delivery Unit Cost Estimates. 2020. Available online: https://immunizationeconomics.org/ (accessed on 10 November 2025).
  26. UNICEF. Pricing Data. 2023. Available online: https://www.unicef.org/supply/pricing-data (accessed on 14 June 2024).
  27. WHO. Vaccine Wastage Rates Calculator. 2025. Available online: https://www.who.int/publications/m/item/vaccine-wastage-rates-calculator (accessed on 10 November 2025).
  28. UNICEF. Costs of Fully Vaccinating a Child: Countries Eligible for Gavi Vaccine Prices. 2024. Available online: https://www.unicef.org/media/161751/file/Standard%20costs%20of%20fully%20vaccinating%20a%20child_UNICEF_2024.pdf (accessed on 20 January 2026).
  29. Lai, X.; Garcia, C.; Wu, D.; Knoll, M.D.; Zhang, H.; Xu, T.; Jing, R.; Yin, Z.; Wahl, B.; Fang, H. Estimating national, regional and provincial cost-effectiveness of introducing childhood 13-valent pneumococcal conjugate vaccination in China: A modelling analysis. Lancet Reg. Health West. Pac. 2023, 32, 100666. [Google Scholar] [CrossRef] [Scilit]
  30. UNICEF. Vaccine Pricing Data. 2024. Available online: https://www.unicef.org/supply/vaccines-pricing-data (accessed on 17 August 2024).
  31. UNICEF. PCV Vaccine Prices. 2025. Available online: https://www.unicef.org/supply/documents/pneumococcal-conjugate-vaccine-pcv-price-data (accessed on 14 November 2025).
  32. Kim, S.Y.; Lee, G.; Goldie, S.J. Economic evaluation of pneumococcal conjugate vaccination in The Gambia. BMC Infect. Dis. 2010, 10, 260. [Google Scholar] [CrossRef] [Scilit] [PubMed]
  33. Atwood, M.; Beausoleil, L.; Breton, M.C.; Laferriere, C.; Sato, R.; Weycker, D. Cost-effectiveness of alternative strategies for use of 13-valent pneumococcal conjugate vaccine (PCV13) in Canadian adults. Can. J. Public Health 2018, 109, 756–768. [Google Scholar] [CrossRef] [Scilit] [PubMed]
  34. Pugh, S.J.; Fletcher, M.A.; Charos, A.; Imekraz, L.; Wasserman, M.; Farkouh, R. Cost-Effectiveness of the Pneumococcal Conjugate Vaccine (10- or 13-Valent) Versus No Vaccination for a National Immunization Program in Tunisia or Algeria. Infect. Dis. Ther. 2019, 8, 63. [Google Scholar] [CrossRef] [Scilit] [PubMed]
  35. Wellcome. Scaling Up African Vaccine Manufacturing Capacity: Perspectives from the African Vaccine-Manufacturing Industry on the Challenges and the Need for Support; Wellcome: London, UK, 2023; Available online: https://cms.wellcome.org/sites/default/files/2023-01/Wellcome-Biovac-BCG-Scaling-up-African-vaccine-manufacturing-capacity-report-2023_0.pdf (accessed on 13 June 2024).
  36. Triangulate Health Ltd. Interview with Gavi Focal Point; Triangulate Health Ltd.: Doncaster, UK, 2025. [Google Scholar]
  37. Dorji, K.; Phuntsho, S.; Pempa; Kumluang, S.; Khuntha, S.; Kulpeng, W.; Rajbhandari, S.; Teerawattananon, Y. Towards the introduction of pneumococcal conjugate vaccines in Bhutan: A cost-utility analysis to determine the optimal policy option. Vaccine 2018, 36, 1757–1765. [Google Scholar] [CrossRef] [Scilit]
  38. Chen, C.; Cervero Liceras, F.; Flasche, S.; Sidharta, S.; Yoong, J.; Sundaram, N.; Jit, M. Effect and cost-effectiveness of pneumococcal conjugate vaccination: A global modelling analysis. Lancet Glob. Health 2019, 7, e58. [Google Scholar] [CrossRef] [Scilit] [PubMed]
  39. Vo, N.X.; Pham, H.L.; Bui, U.M.; Ho, H.T.; Bui, T.T. Cost-Effectiveness Analysis of Pneumococcal Vaccines in the Pediatric Population: A Systematic Review. Healthcare 2024, 12, 1950. [Google Scholar] [CrossRef] [Scilit]
  40. WHO. Considerations for Pneumococcal Conjugate Vaccine (PCV) Product Choice; Report; WHO: Geneva, Switzerland, 2021; Available online: https://iris.who.int/server/api/core/bitstreams/ee6b3c21-9853-4b51-b81f-d4945e2b2982/content (accessed on 28 November 2025).
  41. UNICEF. Manufacturing Immunisation Supplies Locally—Q&A Series, Discussion with Egypt and South Africa; Report; UNICEF: New York, NY, USA, 2025; Available online: https://www.technet-21.org/media/com_groupresources/uploads/468/10.%20QnA%20Series_Local%20Vaccine%20Manufacturing_13-05-2025.pdf (accessed on 16 December 2025).
  42. AVAC. Local Vaccine Production: Harnessing Its Potential for Equity; Report; AVAC: New York, NY, USA, 2023; Available online: https://avac.org/wp-content/uploads/2023/11/LabToJab-LocalVaxProduction-Nov2023.pdf (accessed on 16 December 2025).
  43. Cullinan, K. Despite Hosting MRNA Hub, South Africa Buys Vaccines from India—Highlighting Tension Between Price Pressures and Local Production; Health Policy Watch: Geneva, Switzerland, 2023; Available online: https://healthpolicy-watch.news/despite-hosting-mrna-hub-south-africa-buys-vaccines-from-india-highlighting-tension-between-price-and-local-production/ (accessed on 16 December 2025).
  44. Immunization Data—UNICEF DATA. Available online: https://data.unicef.org/resources/dataset/immunization/ (accessed on 7 June 2024).
  45. Kaddar, M.; Saxenian, H.; Senouci, K.; Mohsni, E.; Sadr-Azodi, N. Vaccine procurement in the Middle East and North Africa region: Challenges and ways of improving program efficiency and fiscal space. Vaccine 2019, 37, 3520–3528. [Google Scholar] [CrossRef] [Scilit] [PubMed]
  46. WHO. Immunization, Vaccines and Biologicals; Report; WHO: Geneva, Switzerland, 2024; Available online: https://www.who.int/teams/immunization-vaccines-and-biologicals/vaccine-access/planning-and-financing/immunization-financing-indicators (accessed on 28 November 2025).
  47. Tunnicliffe, E.; Hayes, H.; O’Neill, P.; Chin, S.; Brassel, Y.S.; Steuten, L. A COMPARATIVE ANALYSIS: Analysing Global Immunisation Expenditure. Available online: https://www.ohe.org/publications/analysing-global-immunisation-expenditure (accessed on 7 November 2025).
  48. Onishchenko, K.; Hill, S.; Wasserman, M.; Jones, C.; Moffatt, M.; Ruff, L.; Pugh, S.J. Trends in vaccine investment in middle income countries. Hum. Vaccines Immunother. 2019, 15, 2378. [Google Scholar] [CrossRef] [Scilit] [PubMed]
Figure 1. Schematic overview of pneumococcal model (small arrows represent births and background mortality). Dark blue = all transmission/progression compartments across the entire population, light blue = clinical disease outcomes, green = recovered (immune), orange = death.
Vaccines 14 00318 g001
Figure 2. Impact of vaccination on the healthcare costs averted per age group (2024, USD).
Vaccines 14 00318 g002
Table 4. Pneumococcal vaccine introduction scenarios considered in the model.
ScenarioDescription
1. Immediate introduction (base-case scenario)PCV13 introduced without delay using UNICEF procurement and MICs catalytic support, with a transition to locally manufactured PCV13 beginning in year 5.
2. 5-year delayPCV13 introduction postponed by 5 years until domestic production is established; may involve phased production through technology transfer and fill-and-finish manufacturing rather than full drug-substance production.
3. 10-year delayPCV13 introduced after a 10-year delay, when full local production capacity is in place.
4. Immediate introduction + switch at year 5Immediate PCV10 introduction via UNICEF procurement and MICs catalytic support, followed by a switch to locally produced PCV13 at year 5 (assuming equivalent effectiveness).
5. Immediate introduction with gradual transitionImmediate PCV10 introduction via UNICEF procurement and MICs catalytic support, with a gradual transition to local production of PCV13 between years 4 and 7; by years 8–10, all PCV13 is assumed to be procured at the local manufacturing price.
Table 5. Base-case results; annual budget impact in million USD.
Scenarios Total Cases Avoided (20 Years) Total Deaths Avoided (20 Years) ICER/GDP Ratio (ICER) Return on Investment Total Annual Budget Impact Without Gavi Support Total Annual Budget Impact with Gavi Support
Immediate introduction38,511,202139,4510.16 (523.31)23.12124.91120.94
Table 6. Cost-effectiveness outcomes over the 20-year period.
Scenarios Total Cases Avoided Total Deaths Avoided ICER/GDP Ratio ICER (Cost/DALY Averted)
1. Immediate introduction−10% local manufacturing price38,511,202139,4510.14452.42
+0% local manufacturing price38,511,203139,4510.16523.31
+10% local manufacturing price38,511,204139,4510.18594.20
2. 5−year delay−10% local manufacturing price26,891,09397,3740.15508.43
+0% local manufacturing price26,891,09497,3740.18585.41
+10% local manufacturing price26,891,09597,3740.20662.38
3. 10−year delay−10% local manufacturing price15,025,19954,4070.19638.35
+0% local manufacturing price15,025,20054,4070.22729.47
+10% local manufacturing price15,025,20154,4070.22820.59
4. Immediate introduction + switch at year 538,511,202139,4510.12408.30
5. Immediate introduction with gradual transition38,511,203139,4510.13419.69
Table 7. Budget impact and return on investment over a 20-year period (2024 USD).
Scenarios Total Budget Impact Without Gavi Support (Million USD) Total Budget Impact with Gavi Support (Million USD) Return on
Investment
(20-Year
Average)
(Annual average)(Annual average)
1. Immediate introduction−10% local manufacturing price107.99104.4125.80
+0% local manufacturing price124.91120.9423.12
+10% local manufacturing price141.83137.4620.93
2. 5-year delay−10% local manufacturing price110.38105.9123.47
+0% local manufacturing price127.96122.9621.02
+10% local manufacturing price144.79139.2919.02
3. 10-year delay−10% local manufacturing price114.28108.0219.28
+0% local manufacturing price131.45124.4517.25
+10% local manufacturing price132.31125.2615.59
4. Immediate introduction + switch at year 5103.06102.3627.79
5. Immediate introduction with gradual transition105.22103.9627.25
Disclaimer/Publisher’s Note: The statements, opinions and data contained in all publications are solely those of the individual author(s) and contributor(s) and not of MDPI and/or the editor(s). MDPI and/or the editor(s) disclaim responsibility for any injury to people or property resulting from any ideas, methods, instructions or products referred to in the content.