Abstract
Background: Torquetenovirus (TTV) viremia is increasingly recognized as a marker of immune competence. In the context of COVID-19, TTV viral load (VL) has been shown to predict anti-Spike antibody levels in severely immunocompromised patients. This study aimed to evaluate whether pre-vaccine TTV VL could predict humoral and cellular immune responses to SARS-CoV-2 mRNA vaccines in people living with HIV (PLWH) and healthy individuals (HP). Methods: TTV VL was measured via real-time PCR in serum samples collected before the second and third doses of mRNA vaccines in 93 PLWH and 48 HP (second dose) and 255 PLWH and 48 HP (third dose). Immune responses were assessed through anti-SARS-CoV-2 receptor-binding domain (RBD) IgG, neutralizing antibodies, and IFN-γ release. Statistical analyses included correlation studies between TTV VL and vaccine-induced immune responses. Results: TTV VL did not significantly correlate with anti-RBD IgG or neutralizing antibody levels in either cohort; highlighting its limited predictive value for humoral responses in relatively immunocompetent populations. However, a strong inverse correlation was observed between TTV VL and IFN-γ release after the third, but not the second, vaccine dose. These findings suggest that higher TTV VL, indicative of reduced immune competence, may impair T-cell-mediated immunity to vaccines. Conclusions: In virologically suppressed PLWH and HP, TTV VL is not a reliable predictor of humoral immune responses to COVID-19 vaccines. However, its inverse relationship with cellular responses warrants further investigation in more immunosuppressed populations. These results reinforce the continuum model of TTV VL as a biomarker, with predictive utility increasing alongside the degree of immunosuppression
1. Introduction
Torquetenovirus (TTV; from torques and tenuis, Latin for ‘necklace’ and ‘thin’, respectively) is the prototype of a large group of small DNA viruses with a circular, negative-sense, single-stranded genome. The TTV DNA molecule is about 3.8 kilobases in length and includes a coding region that covers more than 70% of its genome. This coding region is divided into at least four major, partially overlapping open reading frames (ORFs), while the remaining portion does not have any known coding functions (untranslated region, UTR) [1,2]. Sequence divergence varies across the genome. The UTR is highly conserved with over 90% sequence identity between isolates, and contains a GC-rich tract. Conversely, the translated region shows significant diversity, with ORF1 containing a hypervariable region. Since its discovery in 1997, numerous closely related TTV sequences have been identified, demonstrating a remarkable level of genetic variability in this virus. TTV is now classified into at least 20 major species, each of which consists of numerous genotypes, grouped into the Alphatorquevirus genus of the Anelloviridae family [3]. Historically, the virus has been classified as an orphan virus. However, recent research employing metagenomic techniques has identified TTV as the most prevalent constituent of the human blood virome [4,5]. Multiple TTV genotypes are sequentially acquired early in life throughout various routes, resulting in an extremely high global prevalence. TTV persists in T lymphocytes [6], with chronic and stable viremia in healthy people at approximately 2.0–3.0 Log copies/mL of blood [7]. Due to its widespread prevalence and close connection with the host’s immune system, TTV is being increasingly studied as a substitute marker for functional immune competence [8,9]. Elevated TTV DNA levels have been documented in cases of sepsis [10], HIV infection [11,12,13], newly diagnosed untreated solid tumors, autologous or allogeneic hematopoietic stem cell transplants [14,15], and solid organ transplants [16,17,18,19,20,21,22]. An important randomized controlled trial is currently evaluating the use of TTV to tailor maintenance immunosuppression in kidney transplant patients [23].
In the context of COVID-19, our research group [24,25] and others [26,27,28,29,30,31] have demonstrated that pre-vaccination TTV viremia can predict anti-Spike antibody levels post-vaccination in severely immunocompromised populations, such as solid organ transplant recipients. That is likely attributable to the fact that higher pre-vaccination viremias are correlated with poor immune competence, resulting in a lower immune response to the vaccine. Conversely, lower viremias are associated with a more active immune system, leading to a higher vaccine response. To date, no studies have investigated the relationship between TTV loads and COVID-19 vaccine responses in fully or relatively immunocompetent patients, with the hypothesis that its predictive value for humoral responses needs to be contextualized to immunosuppression levels.
Here, we further explored whether this predictive capability is applicable to people living with HIV (PLWH) and healthy individuals.
2. Materials and Methods
2.1. Study Design and Population
This study investigated immune responses to COVID-19 vaccination in two groups: people living with HIV (PLWH) as part of the HIV-VAC study and healthy individuals (HP) participating in the HCW-VAC study. The research was conducted at the National Institute for Infectious Diseases (INMI) Lazzaro Spallanzani in Rome. Participants were eligible if they had received either two or three doses of a wild-type SARS-CoV-2 mRNA vaccine (BNT162b2 or mRNA-1273) and had serum samples available from the first (T0) or third (T3) vaccine dose. To avoid confounding factors, participants with a documented history of SARS-CoV-2 infection were excluded from study population.
PLWH consistently attend our hospital’s HIV clinic and are receiving antiretroviral therapy. Antibody responses were assessed in 93 PLWH and 48 HP individuals after the second vaccine dose, and in 255 PLWH and 48 HP individuals after the third dose.
2.2. TTV DNA Detection and Quantification
Viral DNA was extracted from serum using the QIAsymphony platform (Qiagen, Hilden, Germany). TTV viral load (VL) in serum samples collected at T0 and T3 was quantified using the CE-IVD-certified TTV R-GENE® kit (bioMérieux, Marcy-l’Etoile, France). Amplification was carried out on the Rotor-Gene Q2plex (Qiagen, Hilden, Germany) following the manufacturer’s protocol. The TTV R-GENE® kit provides standards to create a quantification curve, with TTV VL expressed in log copies/mL. Each experiment included a negative control. A value of 1.0 log was assigned to undetectable TTV VL. Procedures for quantification, specificity assessment, sensitivity assessment and precision analysis have been described previously [32,33].
2.3. SARS-CoV-2 IgG Antibody Testing
The Abbott Architect® SARS-CoV-2 IgG II Quant Assay (Abbott, North Chicago, IL, USA) was employed to measure anti-SARS-CoV-2 Spike receptor-binding domain (RBD) IgG antibodies in serum samples collected 2–4 weeks following the second or third vaccine dose. Antibody levels were converted to binding antibody units (BAU)/mL using a multiplication factor of 0.142, as per the World Health Organization SARS-CoV-2 immunoglobulin standard. The assay’s quantification range was 1.0 to 11,360 BAU/mL, with a positivity cutoff set at 7.1 BAU/mL. Participants with anti-RBD IgG levels ≥ 7.1 BAU/mL were classified as vaccine responders, while those with levels < 7.1 BAU/mL were considered non-responders.
2.4. SARS-CoV-2 Microneutralization Assay
The microneutralization assay (MNA) was carried out using the live SARS-CoV-2 Wuhan-D614G strain (GISAID accession ID EPI_ISL_568579). This procedure adhered to previously established protocols to assess the neutralizing capacity of the samples against the virus [24]. In summary, heat-inactivated serum samples were diluted and then incubated with 100 TCID50 of SARS-CoV-2 at 37 °C for 30 min. Next, 100 μL/well of the SARS-CoV-2/serum mixtures were added to 96-well tissue culture plates containing sub-confluent Vero E6 cell (ATCC Number CRL-1586) monolayers. After 48 h of incubation, the microplates were examined under a light microscope to detect any cytopathic effect (CPE). The serum dilution that inhibited at least 90% of the CPE was designated as the neutralization titer (MNA90). Values of 1:10 or higher were considered positive.
2.5. Interferon-Gamma ELISA Assay
The level of interferon-gamma (IFN-γ) was assessed using a previously established protocol [34]. Briefly, peripheral blood was collected in heparin tubes and either stimulated with a peptide pool covering the Spike protein (Prot-S code 130126701; Prot-S1 code 130127048; Prot-S+ code 130127312; Miltenyi Biotech, Bergisch Gladbach, Germany) or unstimulated. Stimulation was performed with 5% CO2 at 37 °C. Staphylococcal enterotoxin B (SEB) superantigen was used as a positive control and the spontaneous release of cytokines was measured in the unstimulated culture. Plasma samples were collected after 16−20 h of stimulation and stored at −80 °C. An automated ELISA system (ELLA™, Bio-Techne, Minneapolis, MN, USA) was used to measure IFN-γ levels in plasma samples. The detection limit of the assay was 0.17 pg/mL, and a positive IFN-γ response was defined as ≥12 pg/mL.
2.6. Statistical Analysis
Categorical data were expressed as frequencies and percentages, while continuous variables were summarized using means (standard deviation), medians, and interquartile ranges (25th and 75th percentiles), as appropriate. Fisher’s exact test and the Chi-square test were employed to compare categorical variables, whereas the Mann−Whitney U-test, a non-parametric method, was used for continuous variable comparisons. To assess potential linear relationships between two continuous variables, the Spearman correlation, also non-parametric, was applied. All statistical tests were two-tailed, with a significance threshold of p < 0.05. Analyses were performed using Prism v.8.0.2 software.
3. Results
3.1. Study Population
A total of 444 serum samples were collected: 348 from PLWH and 96 from HP groups. Specifically, 93 samples from PLWH were assessed after the second vaccine dose (recruitment period: 24 March 2021–21 April 2021), and 255 after the third vaccine dose (recruitment period: 20 September 2021–1 February 2022). From the HP group, 48 samples were assessed after the second vaccine dose (recruitment period: 4 January 2021–8 January 2021), and 48 after the third vaccine dose (recruitment period: 25 October 2021–4 December 2021). None of the participants had a prior SARS-CoV-2 infection, as confirmed by serological testing for anti-SARS-CoV-2 Nucleoprotein IgG before T0 and at T3, as well as anti-SARS-CoV-2 Spike-RBD IgG levels before T0. The demographic and laboratory characteristics of the study population are presented in Table 1 and Table 2.

Table 1.
PLWH characteristics, grouped by vaccine dose.
Table 2.
HP characteristics, grouped by vaccine dose.
3.2. TTV VL and Anti-SARS-CoV-2 RBD IgG Response
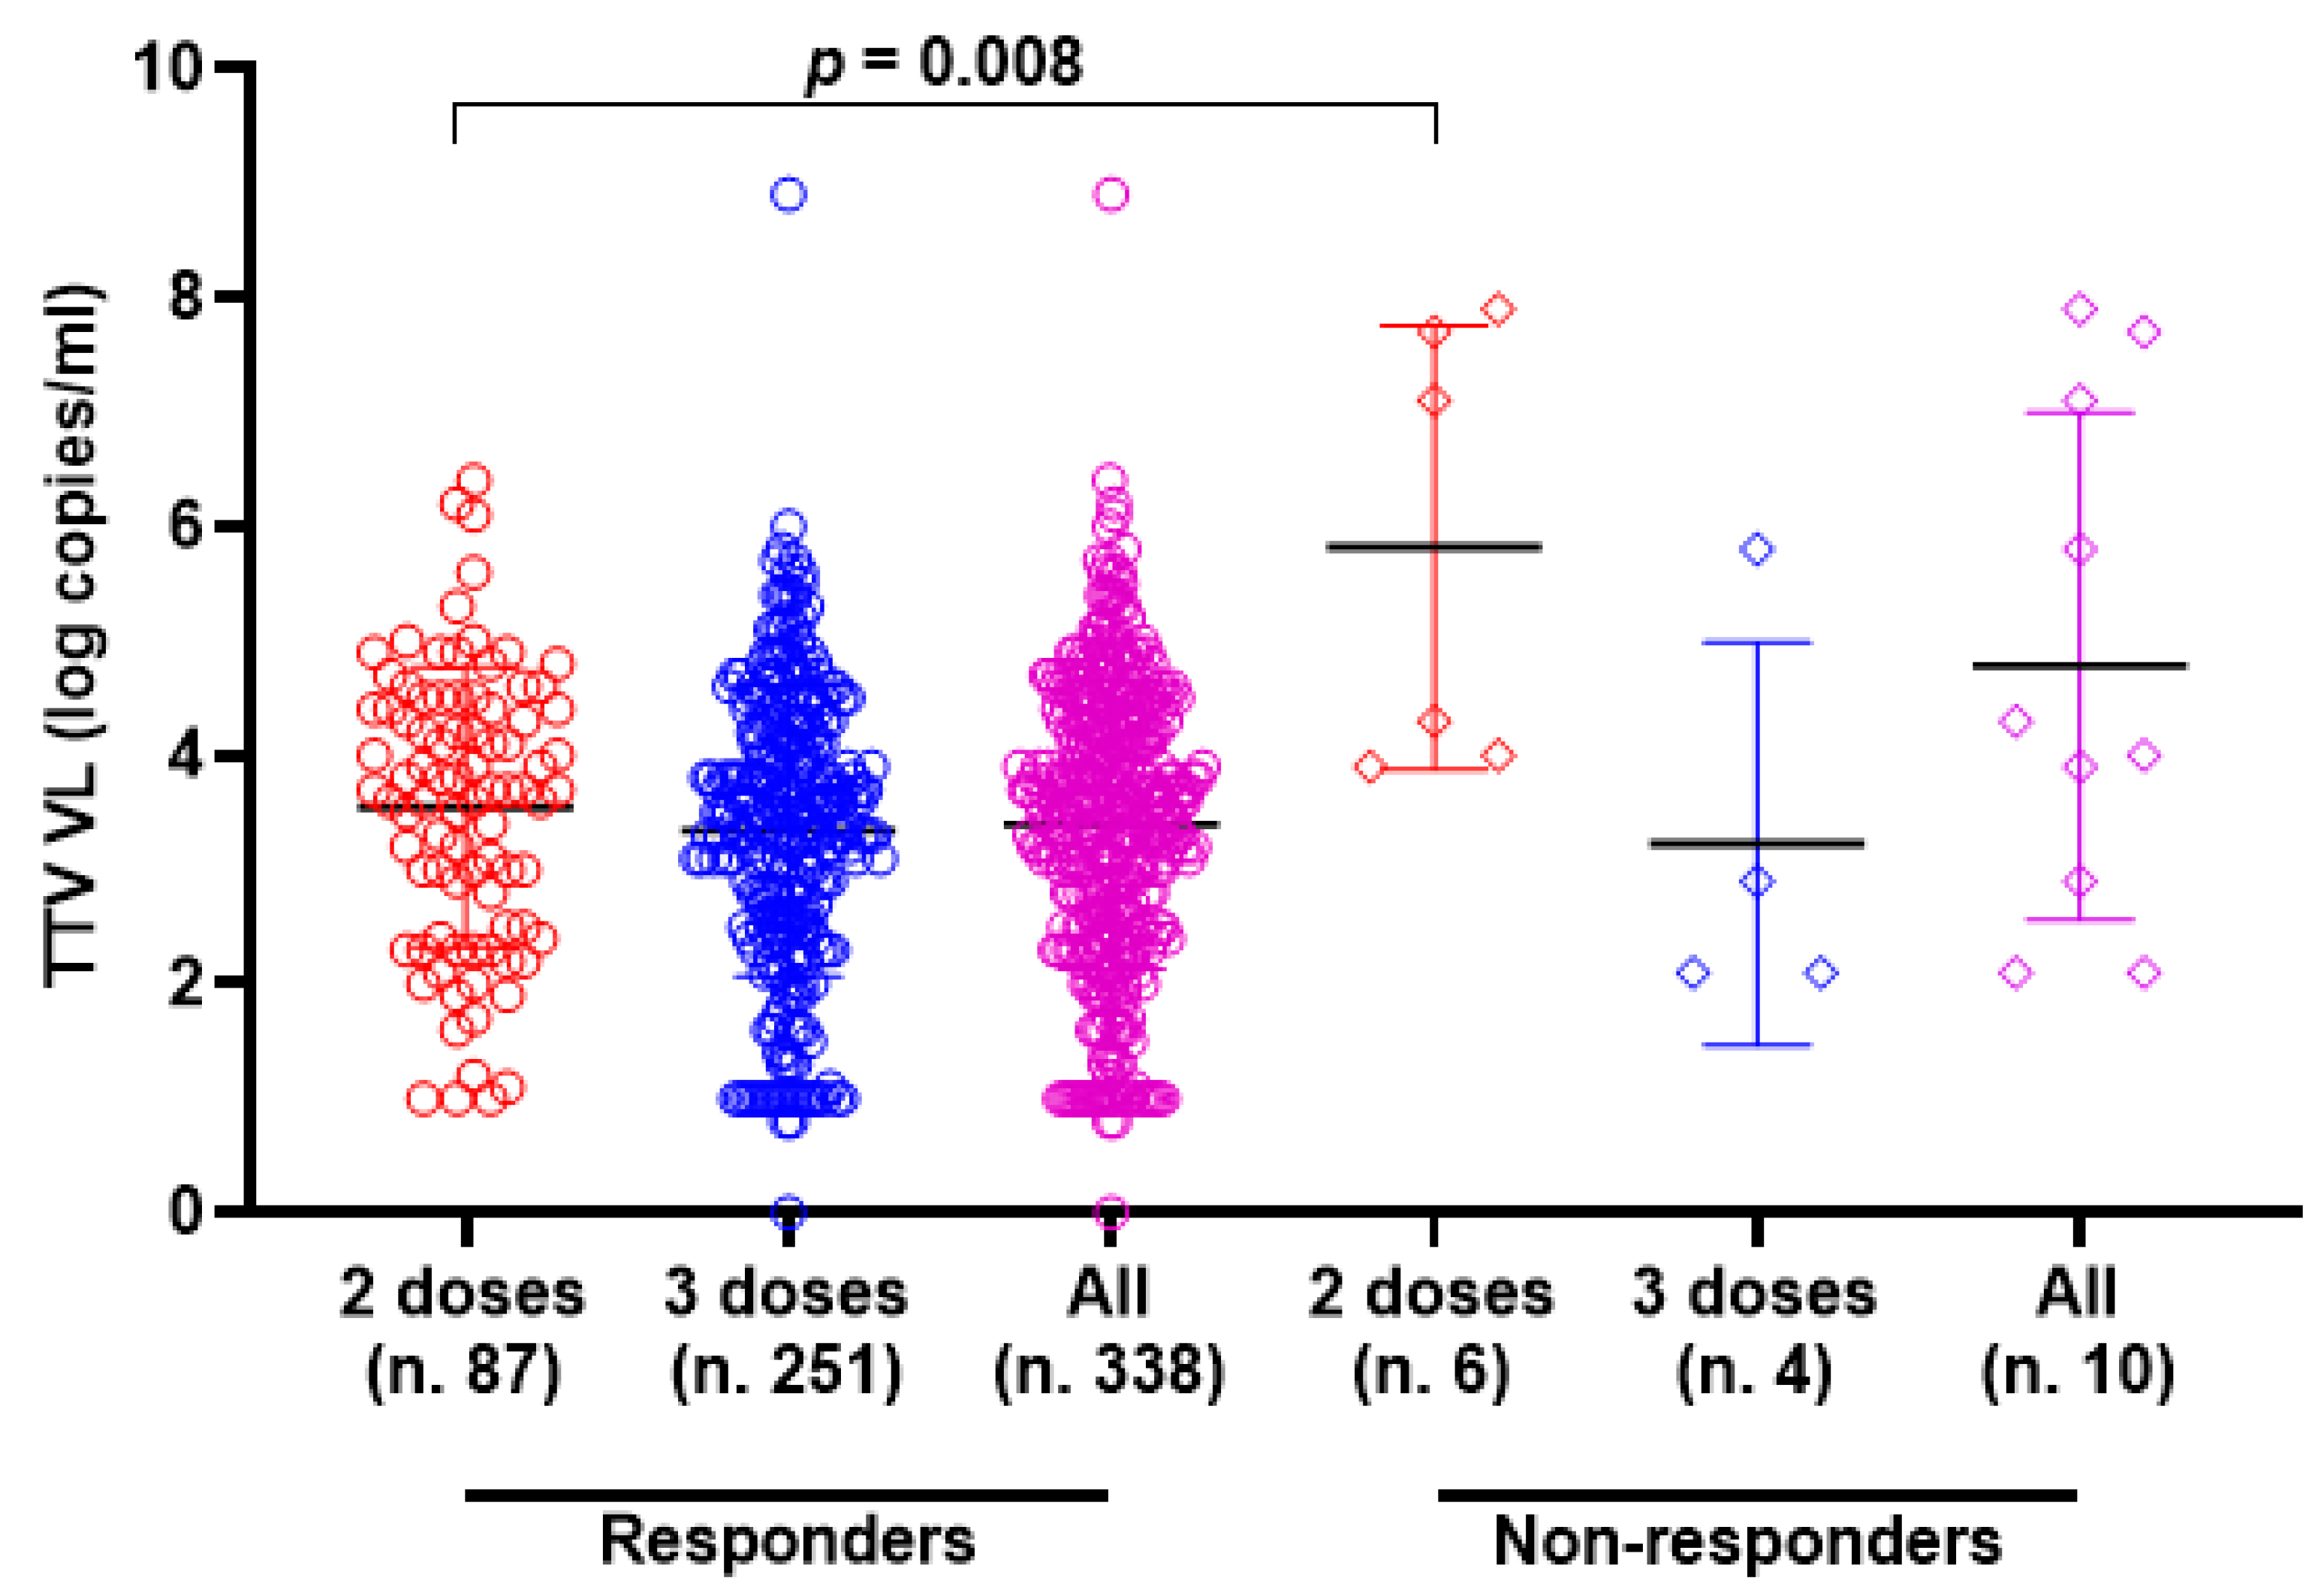
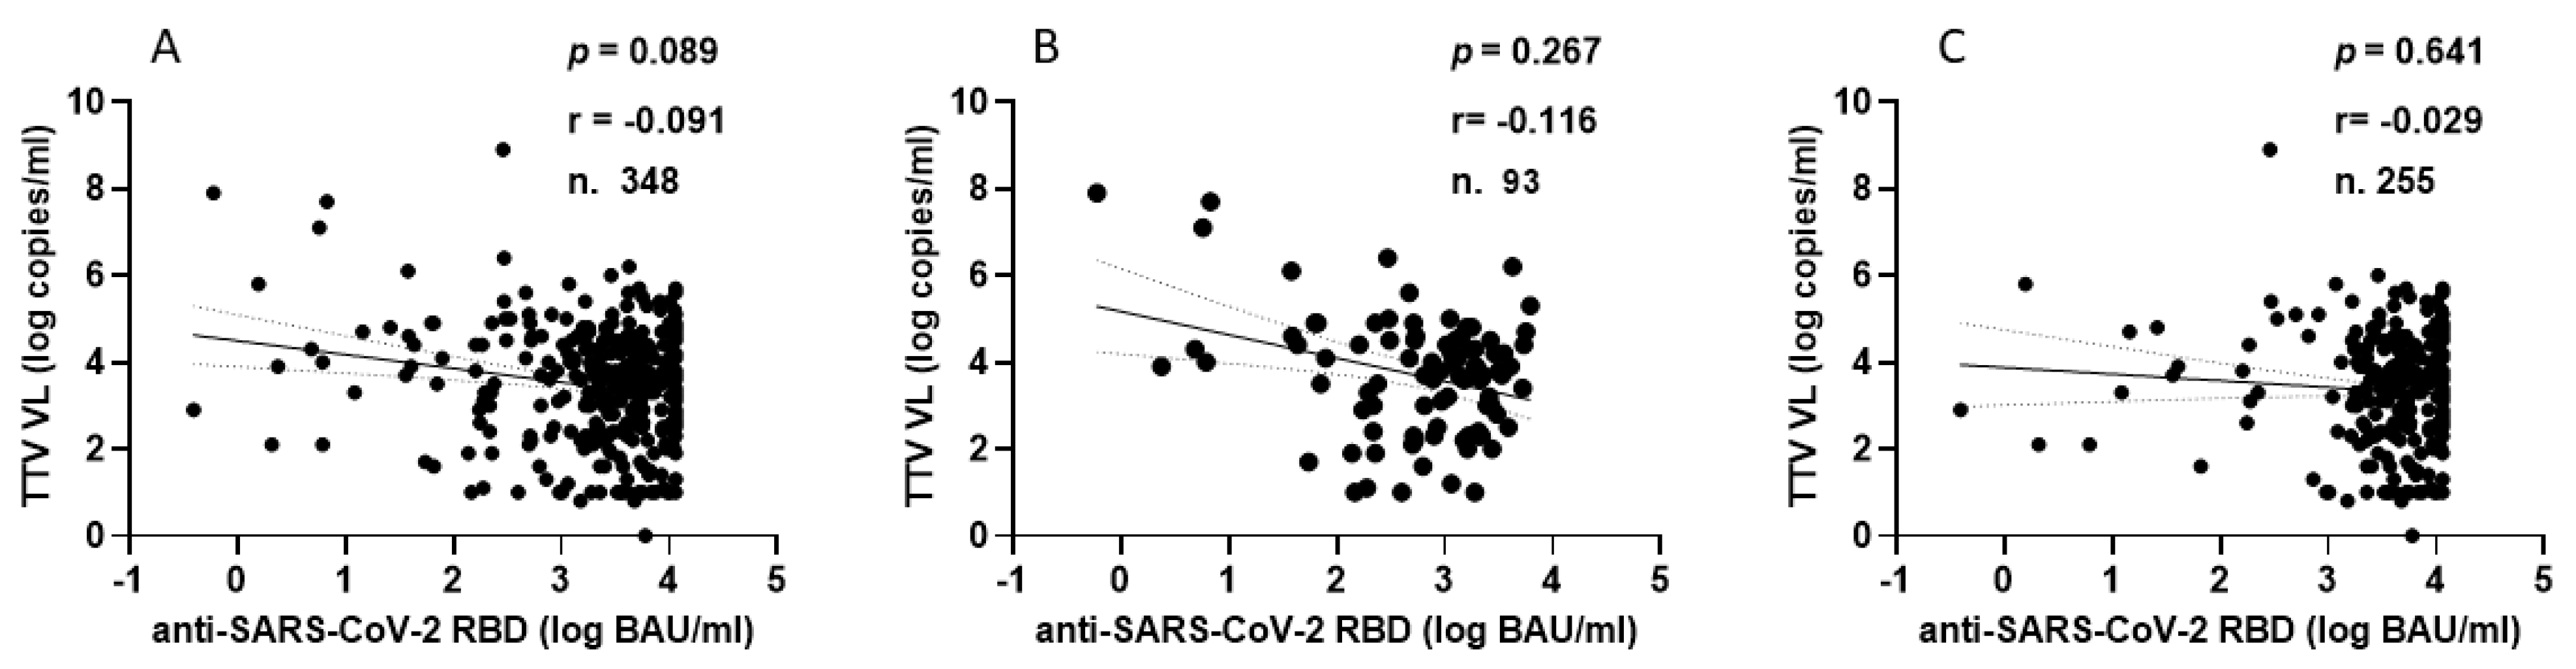
TTV VL was assessed in serum samples collected at T0 and T3 from both PLWH and HP. As detailed in Table 1, 330 of the 348 serum samples (94.8%) from PLWH were positive for TTV DNA, with a median viral load of 3.6 Log copies/mL. There was no significant difference in TTV prevalence between T0 and T3, but a moderately significant difference was observed between the median TTV VL (p = 0.047). In Table 2, 59 out of 96 serum samples (61.5%) tested positive for TTV DNA, with a median VL of 2.5 Log copies/mL. No significant difference was found in the prevalence of TTV between T0 and T3 or between the VL medians. Table 3 presents patient characteristics and clinical parameters in PLWH, categorized by anti-SARS-CoV-2 seroconversion after receiving two or three vaccine doses. Before the initial two-dose vaccination (T0), the TTV VL was observed to be 2.0 Log higher in individuals who did not respond to the vaccine compared to those who did (3.7 vs. 5.7 Log copies/mL, p = 0.008). However, this significant relationship between pre-vaccination TTV VL and the magnitude of the anti-RBD IgG response was not detected after the third vaccine dose was administered. Figure 1 graphically presents the pre-vaccination TTV VL values in relation to the anti-SARS-CoV-2 IgG response grouped by doses of the vaccine. The correlation between TTV VL and serum anti-RBD IgG levels was examined. As shown in Figure 2, no significant inverse correlation was observed between pre-vaccination TTV VL and anti-SARS-CoV-2 RBD IgG levels. The absence of correlation was evident in all samples (r = −0.091; p = 0.089; Figure 2A) and remained consistent within subgroups based on the number of vaccine doses administered: after two doses (r = −0.116; p = 0.267) and after three doses (r = −0.029; p = 0.641), as illustrated in Figure 2B,C.
Table 3.
PLWH characteristics, grouped by response to anti-SARS-CoV-2 doses.

Figure 1.
Pre-vaccine TTV VL and anti-SARS-CoV-2 IgG post-vaccination response in PLWH (circle and square represented the responders and non-responders, respectively) after the second dose (red), third dose (blue) and overall (purple). Median, upper, and lower quartiles are indicated by horizontal lines.

Figure 2.
Correlation between pre-vaccine TTV VL and post-vaccination anti-SARS-CoV-2 antibody levels in PLWH: overall (A), after second dose (B), and after third dose (C).
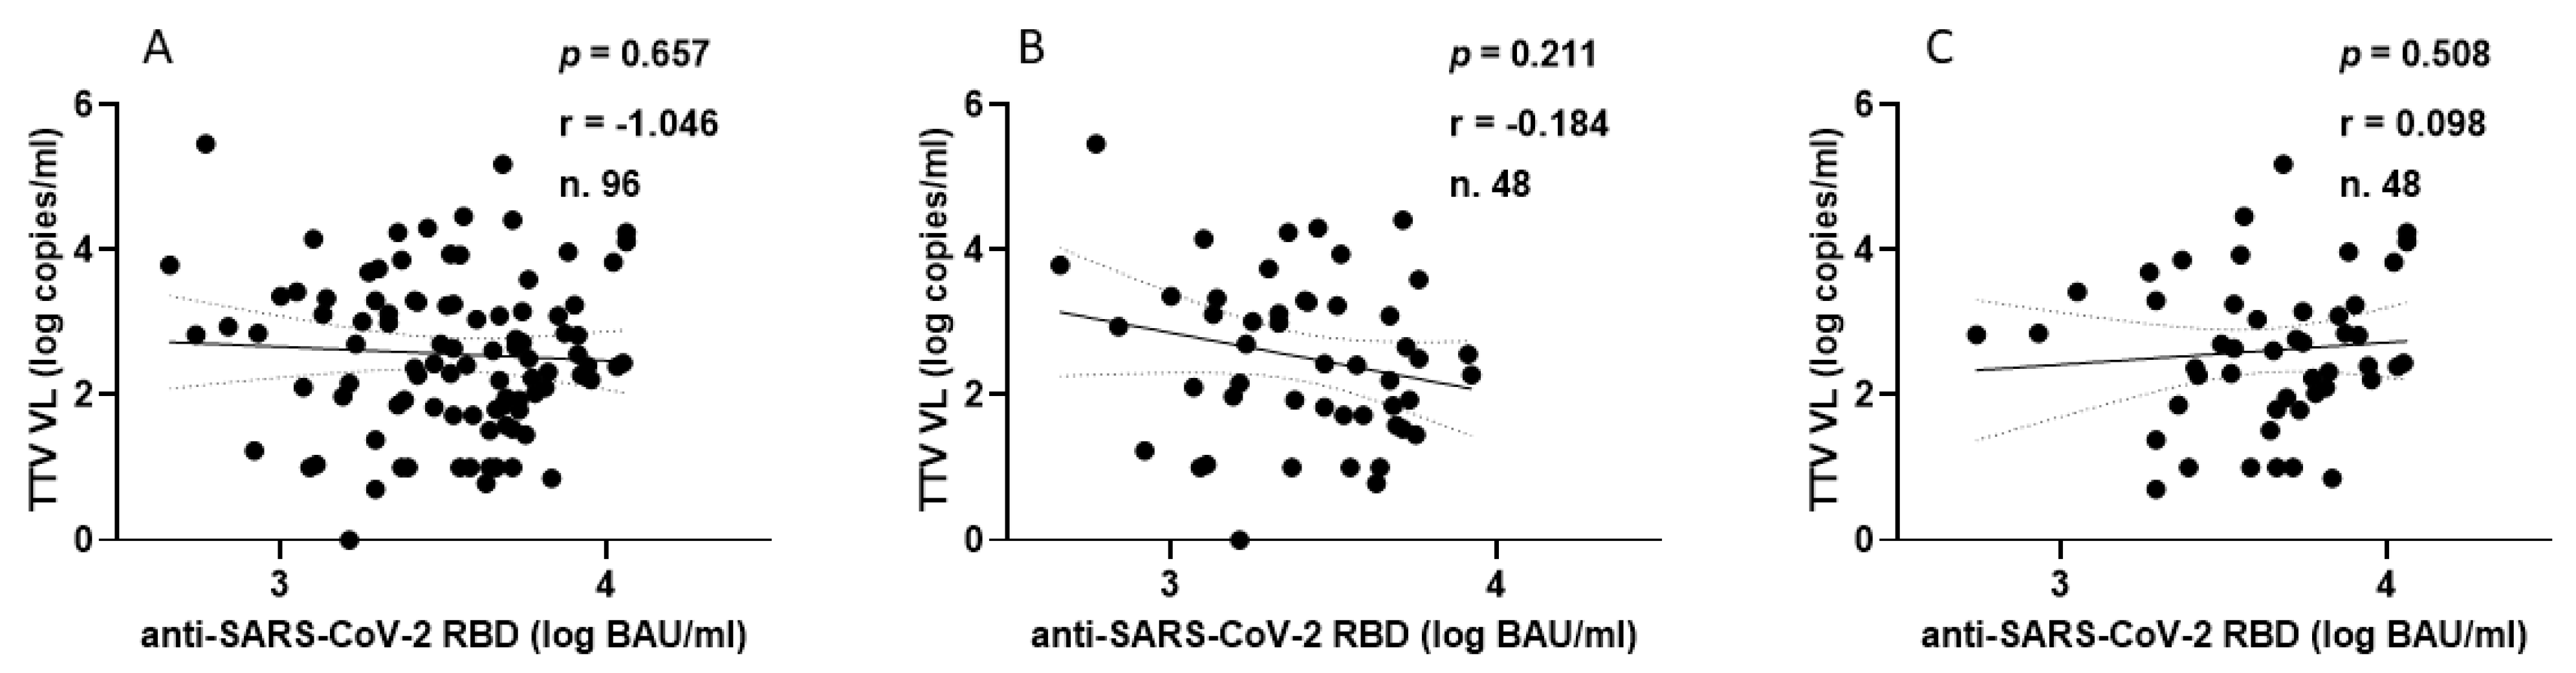
In the HP group, every individual showed anti-SARS-CoV-2 seroconversion after receiving two or three doses of vaccine. Figure 3 shows the correlation between TTV VL and serum levels of anti-RBD IgG. In this population group, no significant correlation was observed between pre-vaccination TTV VL and serum anti-SARS-CoV-2 RBD IgG levels.

Figure 3.
Correlation between pre-vaccine TTV VL and post-vaccination anti-SARS-CoV-2 antibody levels in HP: overall (A), after second dose (B), and after third dose (C).
3.3. TTV VL and Anti-SARS-CoV-2 Neutralizing Antibodies Response
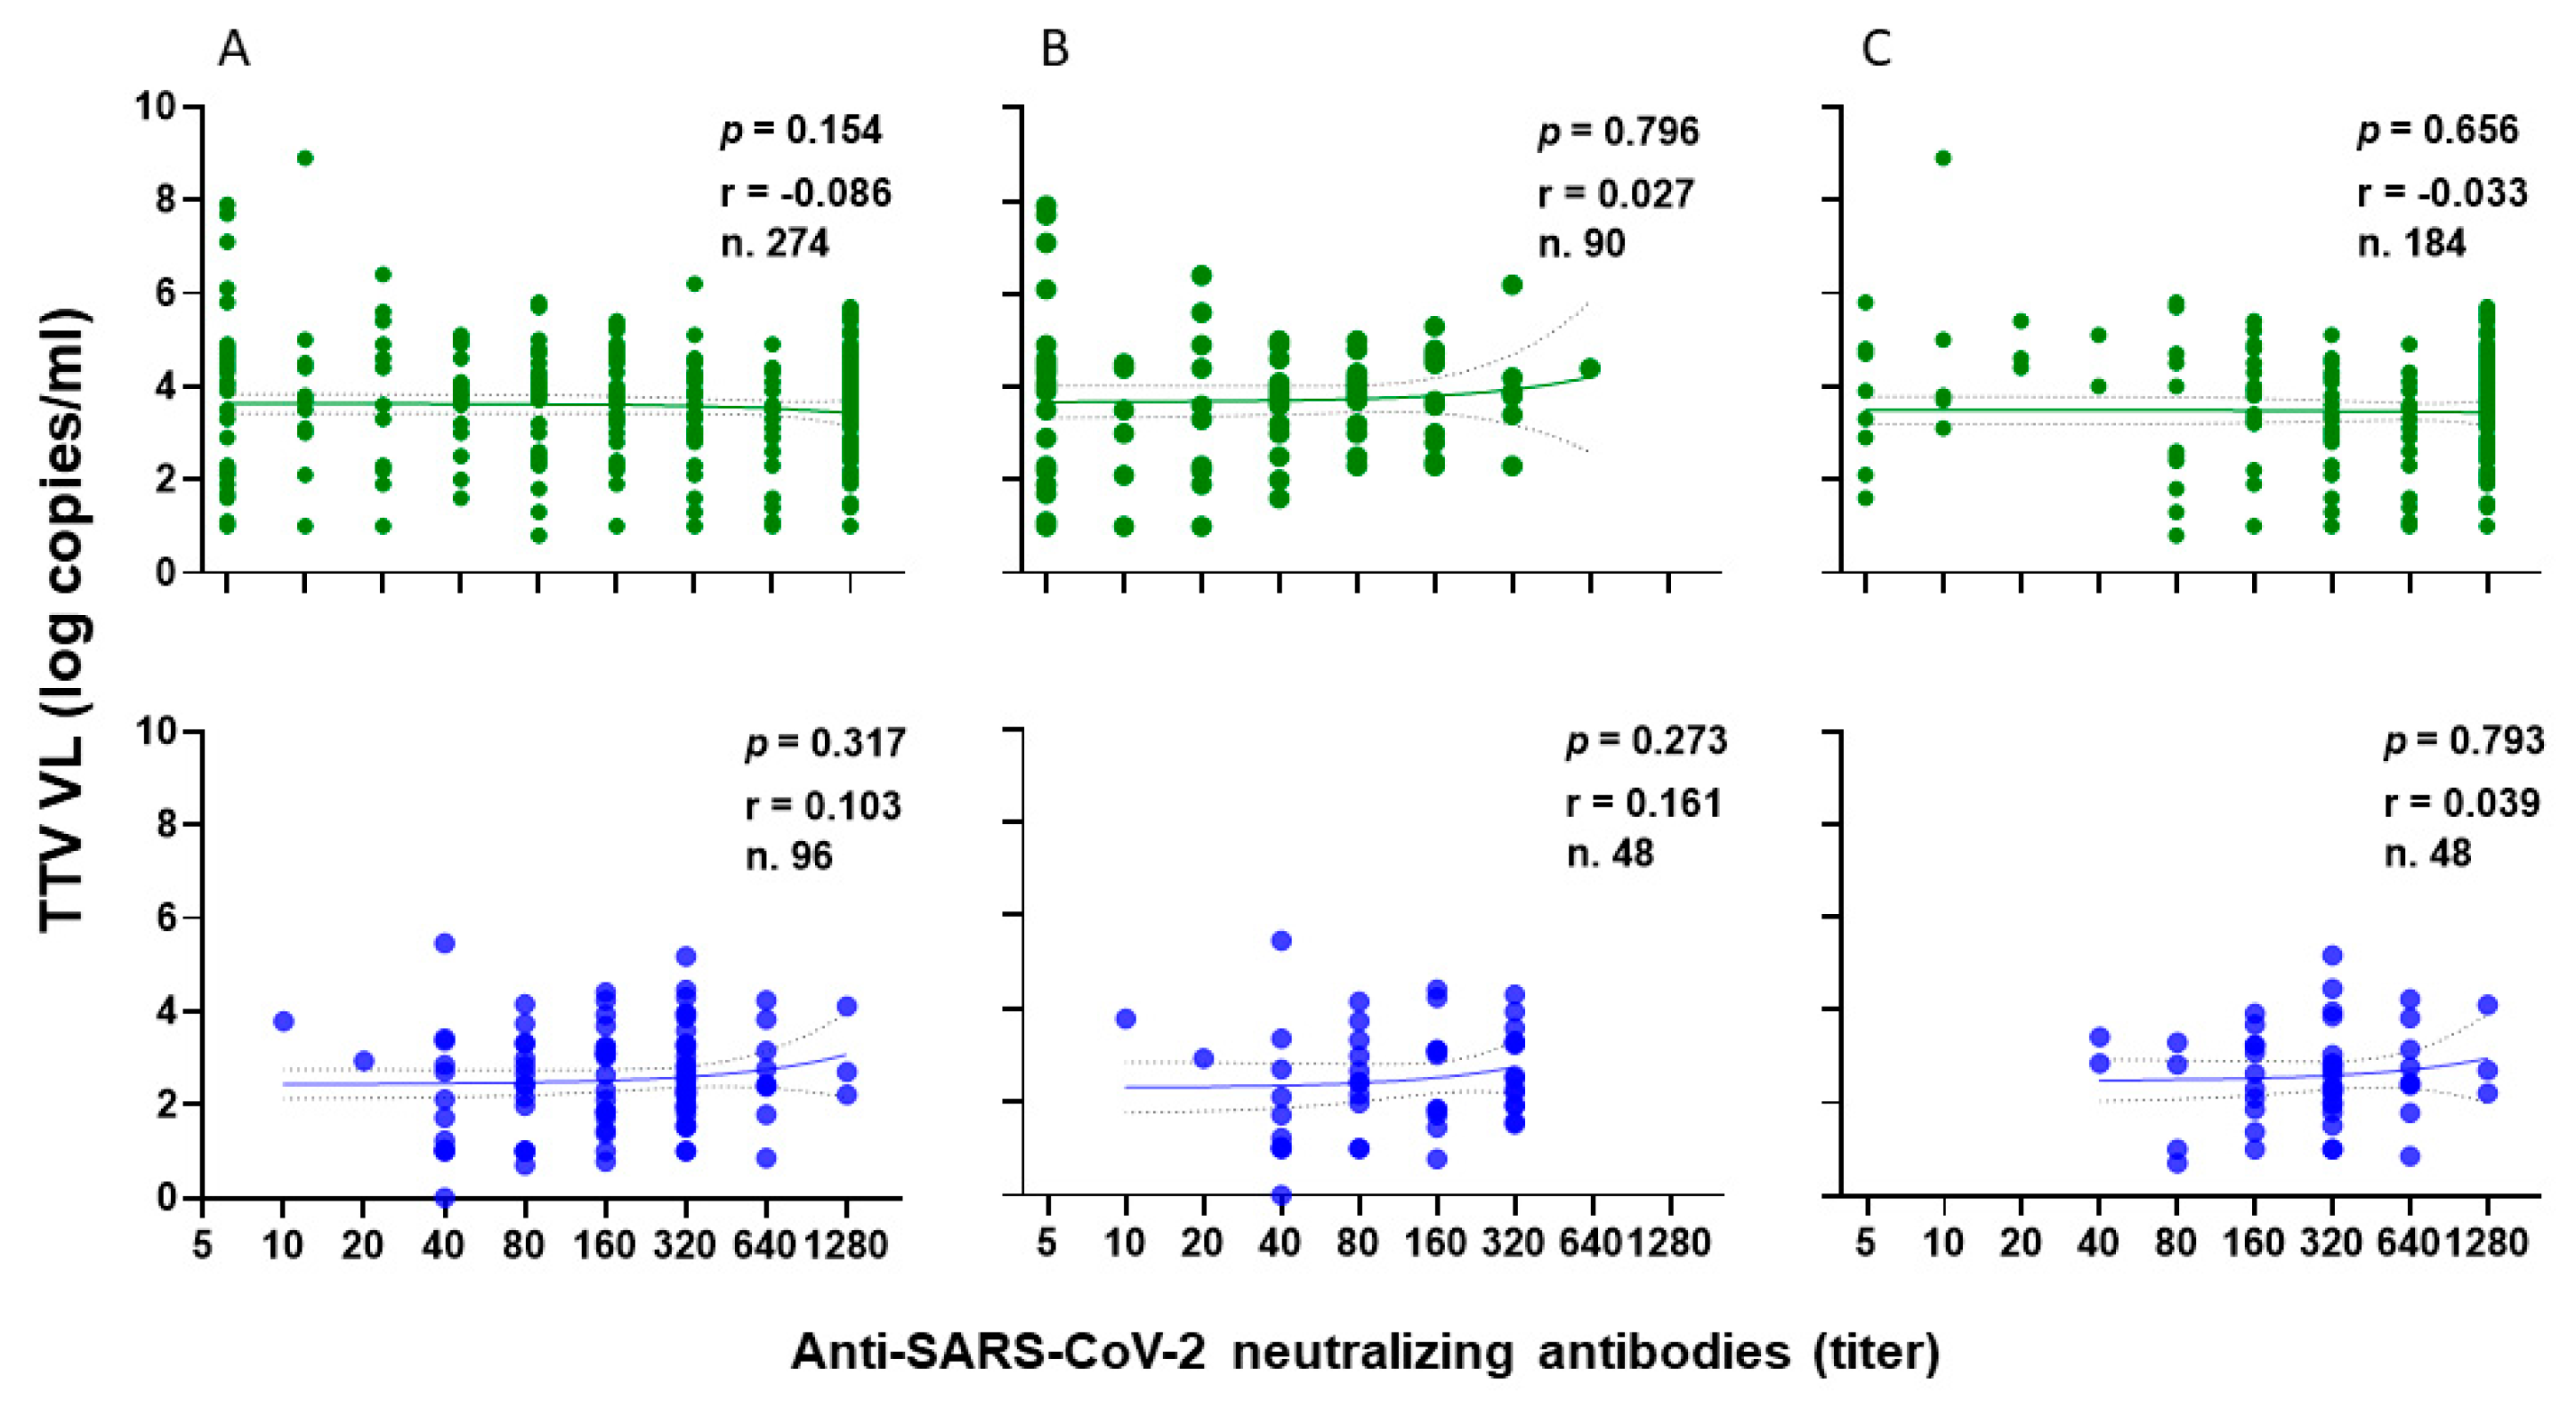
The correlation between TTV VL and levels of anti-SARS-CoV-2 neutralizing antibodies (nAbs) was examined in 274 out of 349 serum samples of PLWH following the administration of the second and third vaccine doses. In total, nAbs were present in 244 out of 274 (89.0%) samples (Figure 4A, green). Specifically, nAbs were detected in 69 out of 90 (76.7%) samples after the second vaccine dose (Figure 4B, green) and in 175 out of 184 (95.1%) samples after the third vaccine dose (Figure 4C, green). Out of 244 samples, 171 (36.2%) revealed nAbs titers ≥ 1:160 (18 and 153 samples after the second and third vaccine doses, respectively). There is no statistical difference between pre-dose TTV VL in PLWHs with nAbs responses and those with no nAbs responses (3.6 versus 3.9 Log copies/mL, respectively). Furthermore, there was no correlation observed between pre-vaccine TTV VL and the levels of nAbs generated following the administration of the second and third vaccine doses, as illustrated in PLWHs (Figure 4, green).

Figure 4.
Correlation between pre-vaccine TTV VL and post-vaccination anti-SARS-CoV-2 neutralizing antibody titers in PLWH (green) and in HP (blue): overall (A), after second dose (B), and after third dose (C).
For the HP group, the correlation between TTV VL and nAbs levels was examined after the second and third vaccine doses in all 96 serum samples. nAbs were present in 100% of samples. Specifically, 67 of 96 samples (69.8%) had nAbs titers ≥ 1:160 (Figure 4A, blue). In particular, 25 and 42 samples had nAbs titers ≥ 1:160 after the second (Figure 4B, blue) and third vaccine doses (Figure 4C, blue), respectively. No correlation was found between TTV VL and nAbs levels after either vaccine dose, as shown in (Figure 4A–C, blue).
3.4. TTV VL and Cell-Mediated Immune Response
In a subset of 90 and 153 PLWH and in 48 and 41 HP after the second or third doses of the SARS-CoV-2 vaccine, specific T-cell responses to S-peptides were evaluated.
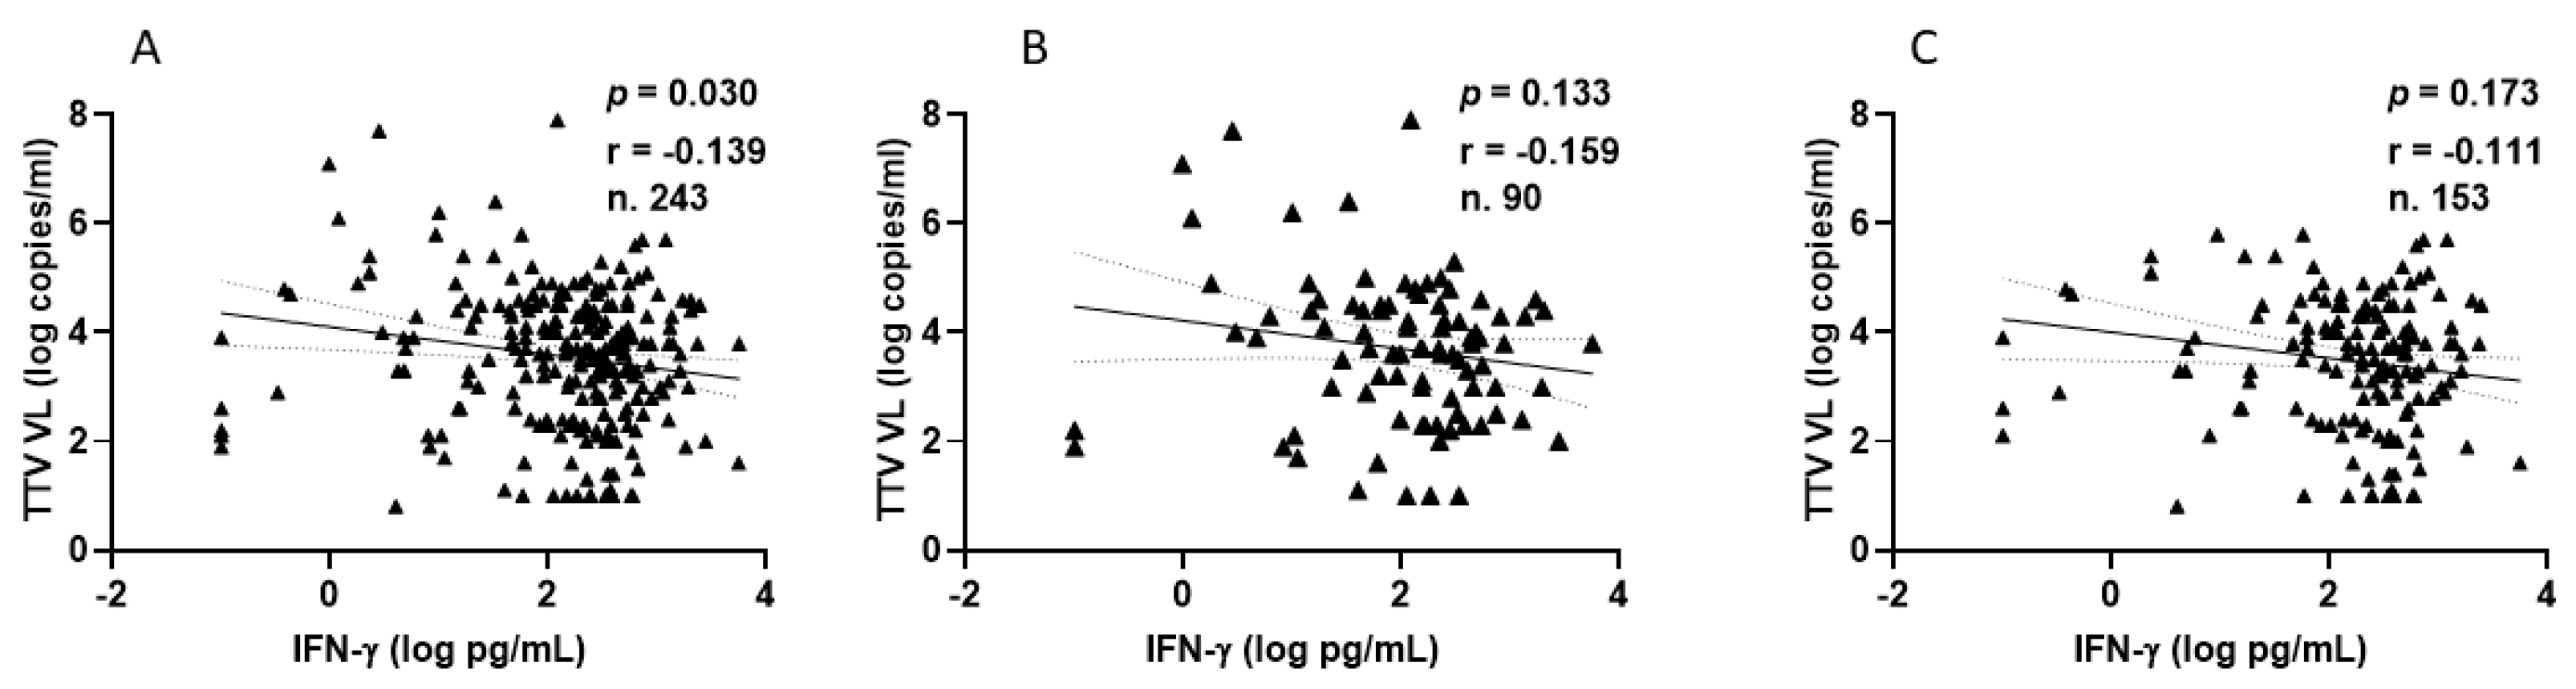
Among PLWHs, 77 out of 90 (85.6%) showed a positive IFN-γ response after the second vaccination, with a median level of 210.9 pg/mL (IQR 80.3–436.9). Similarly, after the third vaccine dose, 137 out of 153 patients (89.5%) showed a positive response, with a median IFN-γ level of 283.8 pg/mL (IQR 124.2–533.1). Figure 5 shows the significant inverse correlations observed between pre-vaccine TTV VL and IFN-γ levels measured overall, after the second and after third doses of vaccine. This significant correlation is not evident when the values are considered separately (Figure 5B,C).

Figure 5.
Correlation between pre-vaccine TTV VL and post-vaccination IFN-γ levels in PLWH: overall (A), after second dose (B), and after third dose (C).
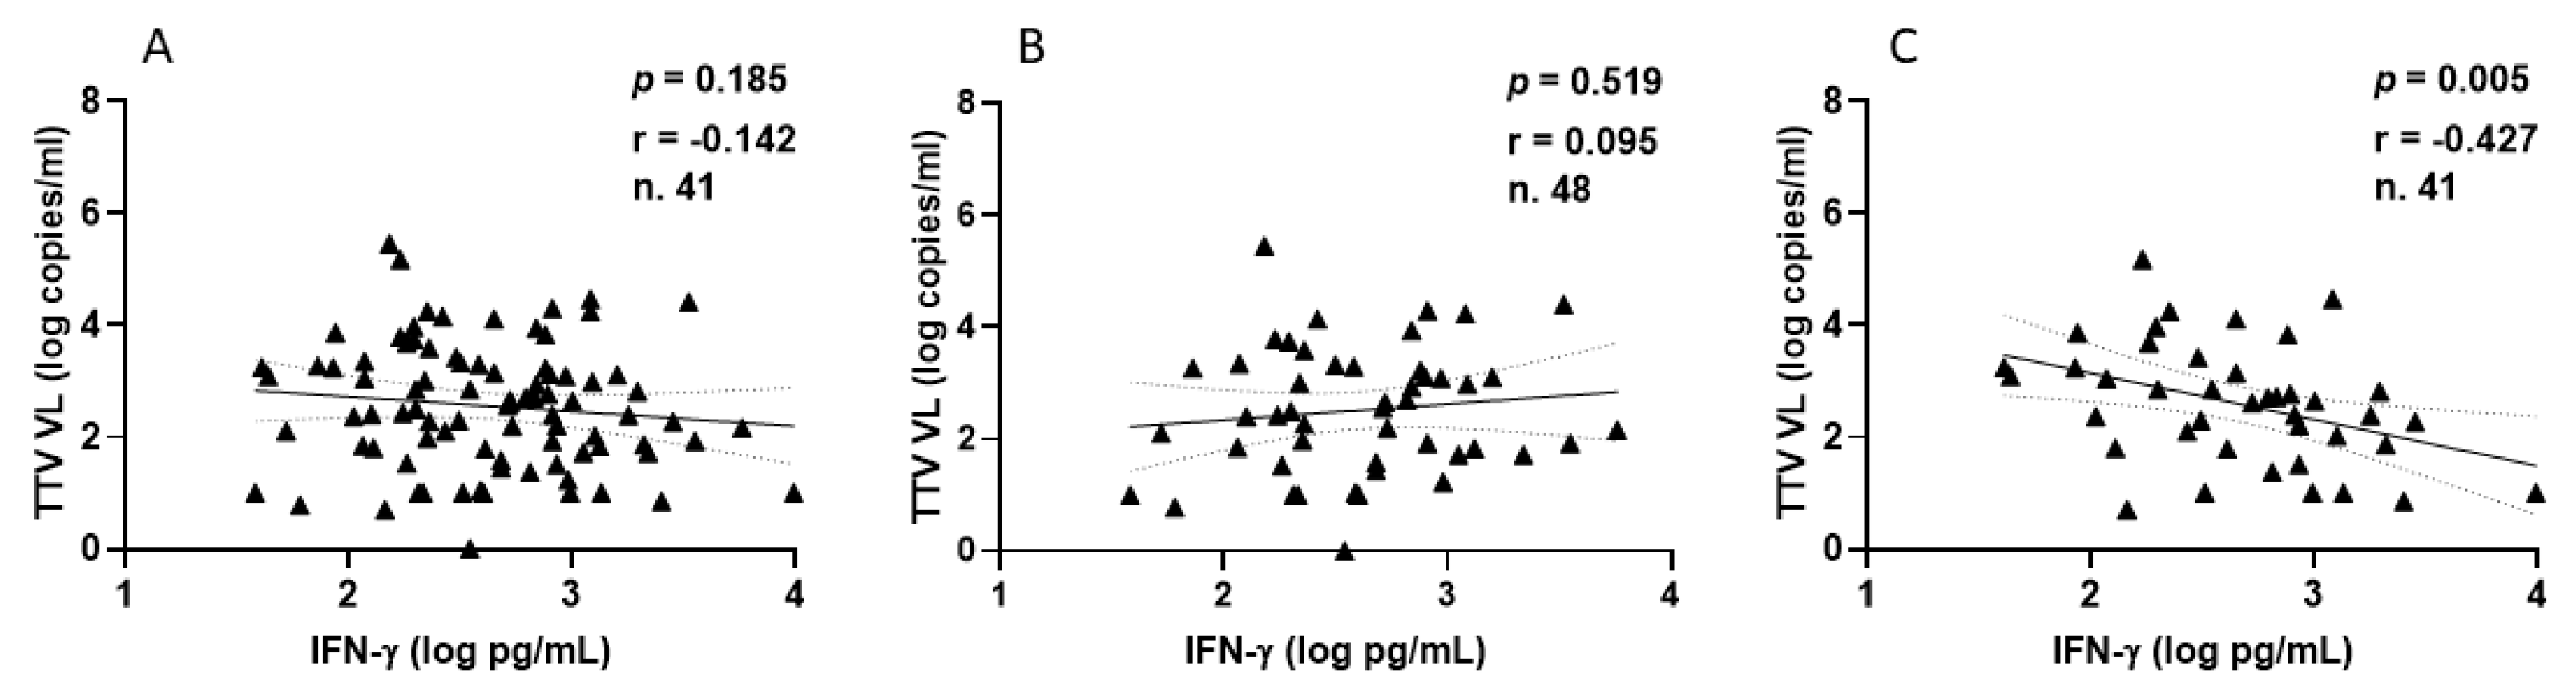
Focusing on HPs, all samples demonstrated a positive IFN-γ response, with a median level of 393.8 pg/mL (IQR 194.5–812.5) following the second vaccination. After the third vaccine dose, 41 out of 48 HPs (85.4%) exhibited a positive IFN-γ response, with a median level of 448.9 pg/mL (IQR 188.6–995.3). The correlations between TTV VL and IFN-γ levels measured overall (Figure 6A), after the second (Figure 6B), and third (Figure 6C) vaccine doses are depicted in Figure 6. A negative correlation was observed between pre-vaccine TTV VL and IFN-γ levels measured post-third dose. This significant correlation was not observed when considering values post-second dose or overall (Figure 6A,B).
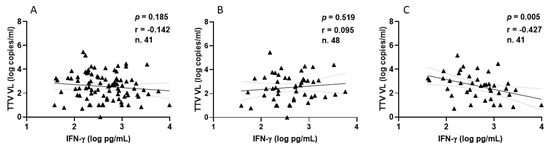
Figure 6.
Correlation between pre-vaccine TTV VL and post-vaccination IFN-γ levels in HP: overall (A), after second dose (B), and after third dose (C).
4. Discussion
While previous studies have demonstrated the utility of TTV VL in predicting immune responses in severely immunocompromised individuals, such as solid organ transplant recipients [26,27,28,29,30,31,35], its applicability in relatively immunocompetent populations remained uncertain.
Our results reveal no significant inverse correlation between pre-vaccination TTV VL and anti-SARS-CoV-2 RBD antibody levels or nAbs titers after the second or third dose in either PLWH or HP. This finding differs from data on severely immunocompromised individuals, where higher TTV VL correlates with weaker vaccine antibody responses. Among PLWH, we observed that non-responders to the second vaccine dose exhibited significantly higher pre-vaccination TTV VL compared to responders. However, this association disappeared after the third dose, suggesting that booster doses may help equalize antibody responses, even among individuals with initially higher TTV VL. These findings suggest that TTV VL is not a reliable biomarker for predicting antibody responses to COVID-19 vaccines in relatively immunocompetent individuals. In contrast, a significant inverse correlation was observed between pre-vaccination TTV VL and IFN-γ levels following T-cell stimulation with the Spike protein, particularly after the third vaccine dose. This trend was evident in both PLWH and HP. These results suggest that higher TTV VL, indicative of greater immune impairment, may limit the ability to mount a robust T-cell-mediated immune response to vaccination. While this highlights a potential role for TTV VL as an indicator of cellular immune competence, its predictive value remains limited in cohorts with relatively intact immune systems. Interestingly, virologically suppressed PLWH displayed immune responses comparable to those of HP, both in terms of antibody production and T-cell-mediated immunity.
The study has several strengths that enhance its significance and reliability. First, by excluding participants with a history of SARS-CoV-2 infection, it minimizes confounding factors related to prior infection-elicited immunity, ensuring a clearer evaluation of vaccine-induced responses. Also, it assesses a wide range of immune responses to mRNA COVID-19 vaccines, including humoral responses and cell-mediated immunity. This multifaceted approach better explains the relationship between TTV VL and vaccine-induced immunity. The research also includes both PLWH and HP, allowing for a comparison of immune responses across populations with varying degrees of immune competence, which strengthens the generalizability of the findings. By studying virologically suppressed PLWH, the study highlights the immune competence of this population, reinforcing their comparability to healthy individuals in terms of vaccine responsiveness. This finding has implications for public health strategies targeting PLWH.
The study also has some limitations. While the overall sample size was substantial, certain subgroup analyses, such as those involving non-responders among PLWH, could benefit from larger numbers to enhance statistical power. Again, the study primarily focused on short-term immune responses to vaccination. Longitudinal studies assessing the role of TTV VL in predicting long-term vaccine efficacy and durability of immune responses would provide a more comprehensive understanding of potential TTV applications.
In conclusion, our research demonstrates that TTV VL is not an effective predictor of antibody responses to COVID-19 vaccines in fully and relatively immunocompetent individuals. However, the correlation with immune responses indicates that TTV VL could be useful as an indicator of immune system health in specific situations, especially when used along with other potential biomarkers, such as CD4 count [36]. The predictive value of TTV VL appears to follow a continuum based on the degree of immunosuppression, with greater utility observed in more severely immunosuppressed populations.
Looking ahead, integrating TTV VL with other biomarkers may improve its predictive accuracy. Establishing standardized clinical definitions of immunosuppression would also facilitate the broader application of markers like TTV VL. While TTV VL offers insights into immune status, its utility as a biomarker should remain focused on populations with significant immunosuppression, where it may provide the most meaningful clinical value.
5. Conclusions
This study highlights the predictive value of TTV VL for immune responses in relatively healthy cohorts, showing its utility in assessing cellular immune competence versus humoral responses. The findings support the hypothesis that contextualizing TTV VL’s applications based on immunosuppression levels is important, demonstrating its relevance in clinical and immunological contexts.
Author Contributions
Conceptualization, E.G., F.M., A.A. and D.F.; Methodology, C.M., P.G.S., S.M., D.M., S.N., F.C., A.A., V.M. and A.V.; Formal analysis, C.M., G.M., P.G.S. and F.M.; Investigation, C.M., G.M., V.M., A.V., S.M., D.M., S.N. and F.C.; Writing–original draft, C.M., P.G.S., D.F. and F.M.; Writing–review & editing, C.M., G.M., P.G.S., D.F., A.A., V.M., A.V., F.M., S.M., D.M., S.N. and F.C.; Supervision, E.G. and F.M.; Funding acquisition, F.M. and E.G. All authors have read and agreed to the published version of the manuscript.
Funding
This study was supported by funds allocated to the National Institute for Infectious Diseases “Lazzaro Spallanzani”, IRCCS, 00149, Rome (Italy), from the Italian Ministry of Health (Programme CCM 2020 Ricerca Corrente—Linea 1 on emerging and re-emerging infections); from the European Union’s Horizon 2020 research and innovation programme under grant agreement number 896932 (TTV guide TX project).
Institutional Review Board Statement
The study was conducted in accordance with the Declaration of Helsinki and the HIV-VAC and HCW-VAC studies were approved by the Comitato Etico Territoriale Area 4 (HIV-VAC: approval number: 423/2021 [date of approval: 30 September 2021]—amendment adopted with no. 24/2023 [date of approval: 18 May 2023]; HCW-VAC: approval number: 297/2021 [date of approval: 1 January 2021]—amendment adopted with no. 90/2022 [date of approval: 1 April 2022]).
Informed Consent Statement
Informed consent was obtained from all subjects involved in the study.
Data Availability Statement
The data that support the findings of this study are available from the corresponding author upon reasonable request.
Conflicts of Interest
The authors declare no conflicts of interest.
References
- Webb, B.; Rakibuzzaman, A.; Ramamoorthy, S. Torque teno viruses in health and disease. Virus Res. 2020, 285, 198013. [Google Scholar] [CrossRef] [PubMed]
- Taylor, L.J.; Keeler, E.L.; Bushman, F.D.; Collman, R.G. The enigmatic roles of Anelloviridae and Redondoviridae in humans. Curr. Opin. Virol. 2022, 55, 101248. [Google Scholar] [CrossRef]
- Varsani, A.; Kraberger, S.; Opriessnig, T.; Maggi, F.; Celer, V.; Okamoto, H.; Biagini, P. Anelloviridae taxonomy update 2023. Arch. Virol. 2023, 168, 277. [Google Scholar] [CrossRef] [PubMed]
- Kaczorowska, J.; Van Der Hoek, L. Human anelloviruses: Diverse, omnipresent and commensal members of the virome. FEMS Microbiol. Rev. 2020, 44, 305–313. [Google Scholar] [CrossRef] [PubMed]
- Mao, Q.; Liu, Y.; Zhang, J.; Li, W.; Zhang, W.; Zhou, C. Blood virome of patients with traumatic sepsis. Virol. J. 2023, 20, 198. [Google Scholar] [CrossRef] [PubMed]
- Focosi, D.; Macera, L.; Boggi, U.; Nelli, L.C.; Maggi, F. Short-term kinetics of torque teno virus viraemia after induction immunosuppression confirm T lymphocytes as the main replication-competent cells. J. Gen. Virol. 2015, 96, 115–117. [Google Scholar] [CrossRef]
- Focosi, D.; Spezia, P.; Macera, L.; Salvadori, S.; Navarro, D.; Lanza, M.; Antonelli, G.; Pistello, M.; Maggi, F. Assessment of prevalence and load of torquetenovirus viraemia in a large cohort of healthy blood donors. Clin. Microbiol. Infect. 2020, 26, 1406–1410. [Google Scholar] [CrossRef] [PubMed]
- Gore, E.J.; Gard, L.; Niesters, H.G.M.; Buter, C.C.V.L. Understanding torquetenovirus (TTV) as an immune marker. Front. Med. 2023, 10, 1168400. [Google Scholar] [CrossRef]
- Kuczaj, A.; Przybyłowski, P.; Hrapkowicz, T. Torque Teno Virus (TTV)—A Potential Marker of Immunocompetence in Solid Organ Recipients. Viruses 2023, 16, 17. [Google Scholar] [CrossRef] [PubMed]
- Walton, A.H.; Muenzer, J.T.; Rasche, D.; Boomer, J.S.; Sato, B.; Brownstein, B.H.; Pachot, A.; Brooks, T.L.; Deych, E.; Shannon, W.D.; et al. Reactivation of multiple viruses in patients with sepsis. PLoS ONE 2014, 9, e98819. [Google Scholar] [CrossRef] [PubMed]
- Tarancon-Diez, L.; Carrasco, I.; Montes, L.; Falces-Romero, I.; Vazquez-Alejo, E.; de Ory, S.J.; Dapena, M.; Iribarren, J.A.; Díez, C.; Ramos-Ruperto, L.; et al. Torque teno virus: A potential marker of immune reconstitution in youths with vertically acquired HIV. Sci. Rep. 2024, 14, 24691. [Google Scholar] [CrossRef] [PubMed]
- Li, L.; Deng, X.; Da Costa, A.C.; Bruhn, R.; Deeks, S.G.; Delwart, E. Virome analysis of antiretroviral-treated HIV patients shows no correlation between T-cell activation and anelloviruses levels. J. Clin. Virol. 2015, 72, 106–113. [Google Scholar] [CrossRef] [PubMed]
- Esser, P.L.; Quintanares, G.H.R.; Langhans, B.; Heger, E.; Böhm, M.; Jensen, B.-E.O.L.E.; Esser, S.; Lübke, N.; Fätkenheuer, G.; Lengauer, T.; et al. Torque Teno Virus Load Is Associated With Centers for Disease Control and Prevention Stage and CD4+ Cell Count in People Living With Human Immunodeficiency Virus but Seems Unrelated to AIDS-Defining Events and Human Pegivirus Load. J. Infect. Dis. 2024, 230, e437–e446. [Google Scholar] [CrossRef] [PubMed]
- Fabrizio, M.; Valentina, R.; Mauro, B.; Luca, C.N.; Daniele, F.; Federico, P.; Massimo, G. Changes in CD8+57+ T lymphocyte expansions after autologous hematopoietic stem cell transplantation correlate with changes in torquetenovirus viremia. Transplantation 2008, 85, 1867–1868. [Google Scholar] [CrossRef] [PubMed]
- Masouridi-Levrat, S.; Pradier, A.; Simonetta, F.; Kaiser, L.; Chalandon, Y.; Roosnek, E. Torque teno virus in patients undergoing allogeneic hematopoietic stem cell transplantation for hematological malignancies. Bone Marrow Transplant. 2015, 51, 440–442. [Google Scholar] [CrossRef]
- Béland, K.; Dore-Nguyen, M.; Gagné, M.-J.; Patey, N.; Brassard, J.; Alvarez, F.; Halac, U. Torque Teno Virus in Children Who Underwent Orthotopic Liver Transplantation: New Insights About a Common Pathogen. J. Infect. Dis. 2013, 209, 247–254. [Google Scholar] [CrossRef] [PubMed]
- De Vlaminck, I.; Khush, K.K.; Strehl, C.; Kohli, B.; Luikart, H.; Neff, N.F.; Okamoto, J.; Snyder, T.M.; Cornfield, D.N.; Nicolls, M.R.; et al. Temporal response of the human virome to immunosuppression and antiviral therapy. Cell 2013, 155, 1178–1187. [Google Scholar] [CrossRef] [PubMed]
- Focosi, D.; Macera, L.; Pistello, M.; Maggi, F. Torque teno virus viremia correlates with intensity of maintenance immunosuppression in adult orthotopic liver transplant. J. Infect. Dis. 2014, 210, 667–668. [Google Scholar] [CrossRef] [PubMed]
- Görzer, I.; Haloschan, M.; Jaksch, P.; Klepetko, W.; Puchhammer-Stöckl, E. Plasma DNA levels of Torque teno virus and immunosuppression after lung transplantation. J. Heart Lung Transplant. Off. Publ. Int. Soc. Heart Transplant. 2014, 33, 320–323. [Google Scholar] [CrossRef] [PubMed]
- Görzer, I.; Jaksch, P.; Kundi, M.; Seitz, T.; Klepetko, W.; Puchhammer-Stöckl, E. Pre-transplant plasma Torque Teno virus load and increase dynamics after lung transplantation. PloS ONE 2015, 10, e0122975. [Google Scholar] [CrossRef]
- Kelly, E.; Awan, A.; Sweeney, C.; Wildes, D.; De Gascun, C.; Hassan, J.; Riordan, M. Torque Teno Virus Loads as a Marker of Immunosuppression in Pediatric Kidney Transplant Recipients. Pediatr. Transplant. 2024, 28, e14857. [Google Scholar] [CrossRef] [PubMed]
- Chauvelot, L.; Barba, T.; Saison, C.; Siska, E.; Kulifaj, D.; Bakker, S.J.L.; Koenig, A.; Rabeyrin, M.; Buron, F.; Picard, C.; et al. Longitudinal monitoring of Torque Teno virus DNAemia in kidney transplant recipients correlates with long-term complications of inadequate immunosuppression. J. Med. Virol. 2024, 96, e29806. [Google Scholar] [CrossRef] [PubMed]
- Haupenthal, F.; Rahn, J.; Maggi, F.; Gelas, F.; Bourgeois, P.; Hugo, C.; Jilma, B.; Böhmig, G.A.; Herkner, H.; Wolzt, M.; et al. A multicentre, patient- and assessor-blinded, non-inferiority, randomised and controlled phase II trial to compare standard and torque teno virus-guided immunosuppression in kidney transplant recipients in the first year after transplantation: TTVguideIT. Trials 2023, 24, 213. [Google Scholar] [CrossRef] [PubMed]
- Minosse, C.; Matusali, G.; Meschi, S.; Grassi, G.; Francalancia, M.; D’Offizi, G.; Maggi, F. Torquetenovirus Loads in Peripheral Blood Predict Both the Humoral and Cell-Mediated Responses to SARS-CoV-2 Elicited by the mRNA Vaccine in Liver Transplant Recipients. Vaccines 2023, 11, 1656. [Google Scholar] [CrossRef] [PubMed]
- Roberto, P.; Cinti, L.; Napoli, A.; Paesani, D.; Cabral, R.J.R.; Maggi, F.; Garofalo, M.; Pretagostini, R.; Centofanti, A.; Carillo, C.; et al. Torque teno virus (TTV): A gentle spy virus of immune status, predictive marker of seroconversion to COVID-19 vaccine in kidney and lung transplant recipients. J. Med. Virol. 2023, 95, e28512. [Google Scholar] [CrossRef] [PubMed]
- Imhof, C.; Messchendorp, L.; van Baarle, D.; Gansevoort, R.T.; Van Leer-Buter, C.; Sanders, J.-S.F. The Time-Dependent Association of Torque Teno Virus Load with the Level of SARS-CoV-2 S1 IgG Antibodies Following COVID-19 Vaccination in Kidney Transplant Recipients. Viruses 2023, 15, 2189. [Google Scholar] [CrossRef]
- Solis, M.; Benotmane, I.; Gallais, F.; Caillard, S.; Fafi-Kremer, S. Torque teno virus viral load predicts SARS-CoV-2 vaccine response in kidney transplant recipients. J. Med. Virol. 2023, 95, e28936. [Google Scholar] [CrossRef]
- Graninger, M.; Stumpf, J.; Bond, G.; Görzer, I.; Springer, D.N.; Kessel, F.; Kröger, H.; Frank, K.; Tonn, T.; Hugo, C. Prediction of humoral and cellular immune response to COVID-19 mRNA vaccination by TTV load in kidney transplant recipients and hemodialysis patients. J. Clin. Virol. 2023, 162, 105428. [Google Scholar] [CrossRef]
- Querido, S.; Adragão, T.; Pinto, I.; Ormonde, C.; Papoila, A.L.; Pessanha, M.A.; Gomes, P.; Ferreira, S.; Figueira, J.M.; Cardoso, C.; et al. Torquetenovirus viral load is associated with anti-spike antibody response in SARS-CoV-2 mRNA BNT162b2 vaccinated kidney transplant Patientsclinical Transplant. Clin. Transpl. 2022, 36, e14825. [Google Scholar] [CrossRef]
- Gallais, F.; Renaud-Picard, B.; Solis, M.; Laugel, E.; Soulier, E.; Caillard, S.; Kessler, R.; Fafi-Kremer, S. Torque teno virus DNA load as a predictive marker of antibody response to a three-dose regimen of COVID-19 mRNA-based vaccine in lung transplant recip-ients. J. Heart Lung Transplant. 2022, 41, 1429–1439. [Google Scholar] [CrossRef] [PubMed]
- Hoek, R.A.; Verschuuren, E.A.; de Vries, R.D.; Vonk, J.M.; van Baarle, D.; van der Heiden, M.; van Gemert, J.P.; Gore, E.J.; Niesters, H.G.; Erasmus, M.; et al. High torque tenovirus (TTV) load before first vaccine dose is associated with poor serological response to COVID-19 vaccination in lung transplant recipients. J. Heart Lung Transplant. 2022, 41, 765–772. [Google Scholar] [CrossRef] [PubMed]
- Macera, L.; Spezia, P.G.; Medici, C.; Rofi, E.; Del Re, M.; Focosi, D.; Mazzetti, P.; Navarro, D.; Antonelli, G.; Danesi, R.; et al. Comparative evaluation of molecular methods for the quantitative measure of torquetenovirus viremia, the new surrogate marker of immune competence. J. Med. Virol. 2022, 94, 491–498. [Google Scholar] [CrossRef] [PubMed]
- Görzer, I.; Haupenthal, F.; Maggi, F.; Gelas, F.; Kulifaj, D.; Brossault, L.; Puchhammer-Stöckl, E.; Bond, G. Validation of plasma Torque Teno viral load applying a CE-certified PCR for risk stratification of rejection and infection post kidney transplantation. J. Clin. Virol. 2023, 158, 105348. [Google Scholar] [CrossRef] [PubMed]
- Agrati, C.; Castilletti, C.; Goletti, D.; Sacchi, A.; Bordoni, V.; Mariotti, D. Persistent Spike-specific T cell immunity despite antibody reduction after 3 months from SARS-CoV-2 BNT162b2-mRNA vaccine. Sci. Rep. 2022, 12, 6687. [Google Scholar] [CrossRef] [PubMed]
- Focosi, D.; Baj, A.; Azzi, L.; Novazzi, F.; Maggi, F. TTV viral load as a predictor of antibody response to SARS COV-2 vaccination. J. Heart Lung Transplant. 2023, 42, 143–144. [Google Scholar] [CrossRef] [PubMed]
- Antinori, A.; Cicalini, S.; Meschi, S.; Bordoni, V.; Lorenzini, P.; Vergori, A.; Vaia, F. Humoral and cellular immune response elicited by mRNA vaccination against severe acute respiratory syndrome coronavirus 2 (SARS-CoV-2) in people living with human immunodeficiency virus receiving antiretroviral therapy based on current CD4 T-lymphocyte count. Clin. Infect. Dis. 2002, 75, e552–e563. [Google Scholar]
Disclaimer/Publisher’s Note: The statements, opinions and data contained in all publications are solely those of the individual author(s) and contributor(s) and not of MDPI and/or the editor(s). MDPI and/or the editor(s) disclaim responsibility for any injury to people or property resulting from any ideas, methods, instructions or products referred to in the content. |
© 2025 by the authors. Licensee MDPI, Basel, Switzerland. This article is an open access article distributed under the terms and conditions of the Creative Commons Attribution (CC BY) license (https://creativecommons.org/licenses/by/4.0/).