Abstract
Background/Objectives: Understanding the psychological determinants of vaccine uptake is critical for effective public health strategies, particularly during prolonged pandemics. The Health Belief Model is widely used to examine vaccine behavior, yet its applicability in longitudinal and policy-intensive contexts remains underexplored. This study assessed how two core Health Belief Model constructs—perceived severity of and susceptibility to COVID-19—related to vaccine intentions and uptake over time, and how these perceptions varied by demographic characteristics. Methods: Data came from Optimise, a longitudinal cohort study of adults in Victoria, Australia, conducted between September 2020 and August 2022. Perceived severity of and susceptibility to COVID-19 were measured monthly, alongside COVID-19 vaccine intentions and uptake. Generalized Estimating Equations evaluated associations between these two Health Belief Model constructs and vaccine outcomes over time. Separate models identified demographic predictors of perceived severity and susceptibility. Results: Perceived severity of COVID-19 was positively associated with intention to receive further COVID-19 vaccine doses (OR = 2.53, 95% CI: 1.26–5.07) and the total vaccine doses received (OR = 2.74, 95% CI: 1.58–4.76), with these associations changing over time as vaccine mandates were lifted and the pandemic context evolved. Perceived susceptibility to COVID-19 showed no significant associations with vaccine outcomes. Older age, presence of a chronic health condition, and lower employment status was associated with higher perceived severity. In contrast, perceived susceptibility was higher among high-income earners but lower among older adults and the unemployed. Conclusions: The predictive value of two Health Belief Model constructs was context- and time-dependent. Perceived severity consistently predicted vaccine uptake once mandates were lifted, while susceptibility did not. Our findings highlight the importance of context-sensitive behavioral frameworks when designing vaccine promotion strategies during extended public health crises.
1. Introduction
The COVID-19 pandemic presented a major public health challenge, with vaccination as a key strategy for preventing severe disease and mitigating transmission. To maximize vaccine uptake, public-health programs must be informed by robust behavioral theory that explains why people decide to vaccinate, and how those motives change as a pandemic unfolds.
The Health Belief Model is a longstanding framework to understand the cognitive drivers of an individual’s intention to uptake particular health-centric behaviors [1]. It proposes six determinants: perceived severity, perceived susceptibility, perceived benefits, perceived barriers, self-efficacy, and cues to action (Figure 1). The model has been widely applied across a range of public health contexts, including smoking cessation, breast cancer screening and, more recently, COVID-19 vaccination. Although the model is well accepted in contemporary literature, it has been criticized for its variable explanatory power and its limited attention to social and environmental influences [2]. Nonetheless, it remains valued for its simplicity and cross-context relevance [3].
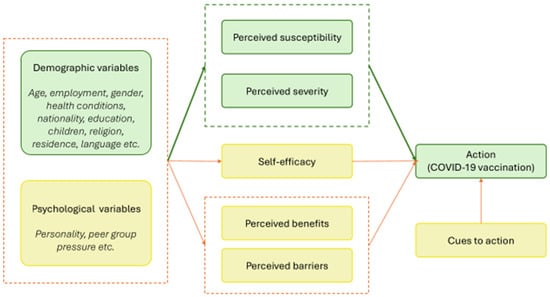
Figure 1.
The Health Belief Model, illustrating how perceptions of susceptibility, severity, benefits, barriers as well as self-efficacy and cues to action influence COVID-19 vaccination. Components analyzed as part of this research are highlighted in green. Dashed lines group related constructs. Arrows represent the direction of influence between constructs or groups of constructs.
The application of the Health Belief Model framework to prospectively understand vaccine uptake has been undertaken across a range of global settings, including Asia, North America and Europe. A systematic review has indicated that perceived susceptibility and severity were negatively associated with COVID-19 vaccine hesitancy across a range of global settings [4]. In other words, people who perceived themselves as more susceptible to COVID-19, or who viewed the disease as more severe, were less hesitant to vaccinate. In addition, perceptions can be influenced by trusted information sources, including media, government communications, and social networks [5,6]. Despite its widespread geographical application in understanding COVID-19 vaccine hesitancy, most evidence comes from cross-sectional studies, and no research has examined the Health Belief Model longitudinally in Australia.
Victoria, Australia’s second-most populous state, offers a compelling opportunity to explore the drivers of vaccine uptake. After initially maintaining low case numbers through stringent border controls and the world’s longest cumulative lockdowns, Victoria shifted in early- to mid-2021 to a rapid vaccination strategy, as shown in Figure 2 [7,8,9,10,11,12,13,14]. One-dose coverage surpassed 95% within 12 months, propelled by intensive public messaging and mandates, including vaccination thresholds requiring 70% full vaccination to end lockdown [13,15,16]. At the height of the pandemic, vaccine requirements in Victoria were among the strictest in Australia, covering healthcare, education, construction, aged care and hospitality. From late October 2021, entry into hospitality venues was restricted to those with proof of full vaccination. In this context, uptake of initial, second and third doses occurred under restricted autonomy, limiting the applicability of Health Belief Model assumptions about free choice. For this reason, vaccine behavior may be most meaningfully assessed for doses beyond the third, when mandates no longer applied.
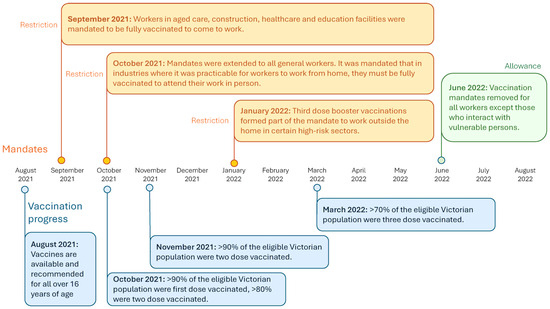
Figure 2.
Timeline of COVID-19 mandates and restrictions in Victoria, Australia August 2021–August 2022.
In mandate-intensive contexts such as Victoria, interpreting vaccine behavior through the Health Belief Model is challenging, since the model assumes individual choice based on perceived risk and benefit. Mandates may override these mechanisms, meaning that Health Belief Model constructs should be interpreted with care and may be most meaningful for uptake beyond the third dose, when mandates were lifted.
Following the removal of mandates for COVID-19 vaccination June 2022, uptake of booster doses (three or more doses) has waned, highlighting the need to examine how individual risk perceptions evolve in the absence of external requirements, particularly as the pandemic response shifts from acute crisis to endemic management [17]. Declining vaccination rates remain a policy concern, reflected in the Australian Government’s COVID-19 Response Inquiry (September 2023) which called for research into the “broad decline in COVID-19 vaccination, especially among priority populations” [18].
Data collected as part of the Optimise study, a longitudinal cohort in Victoria between September 2020 and August 2022, provides a unique opportunity to examine vaccine intention and uptake in Victoria over time. Leveraging monthly data from Optimise, this study applies the Health Belief Model to pandemic vaccine behavior longitudinally. By repeatedly measuring perceptions of severity and susceptibility alongside vaccination outcomes, we test whether the association of these constructs with vaccine intention and behaviour shifted across the pandemic.
This study had two aims: (1) to assess how Health Belief Model constructs, specifically perceived severity and susceptibility, are associated with COVID-19 vaccination intentions and uptake over time, and whether these associations evolved across different phases of the pandemic; and (2) to investigate the demographic factors associated with perceived severity and susceptibility.
By focusing on two key Health Belief Model constructs longitudinally, the study provides timely evidence to inform future vaccination programs and to clarify the conditions under which the Health Belief Model has explanatory value.
2. Materials and Methods
2.1. Study Design and Participants
The Optimise study was a longitudinal cohort study held in Victoria, Australia that surveyed participants on their attitudes and behaviors during the COVID-19 pandemic. Data were collected between September 2020 and August 2022, with continuous recruitment from September 2020 to December 2021. Participants were eligible if they were over 18, lived in Victoria, were able to provide informed consent, had a valid and accessible email or phone number. Participants were ineligible if they were in hospital or too unwell to participate at the time of recruitment [19]. People who were at an elevated risk of COVID-19 or were to be disproportionately impacted by public health orders were targeted for recruitment [19].
The survey could be self-completed online or administered over the phone by research staff in English, Dinka, Arabic and/or Mandarin. There were four components to the data collection: (1) a baseline survey completed once at the beginning of data collection, (2) a daily diary for 14 days once at the beginning of data collection, (3) monthly follow up surveys, and (4) follow-up diaries that were completed four times a month. Each participant was remunerated with online gift vouchers for their time ($35 for the baseline survey, $15 for at least 10 baseline daily diary entries, $2.50 per follow-up daily diary entry and $25 for each monthly follow up survey) [19].
The study was approved by Alfred Health Ethics (approval number 333/20), and the protocol has been published [19].
2.2. Outcomes
The primary outcomes for the analyses in this study were: perceived severity of COVID-19, perceived susceptibility to COVID-19, intention to have a first COVID-19 vaccine dose, intention to have further COVID-19 vaccine doses and, self-reported number of COVID-19 vaccines doses received. To address aim one, intention to have a first COVID-19 vaccine, intention to have further COVID-19 vaccines and COVID-19 vaccine doses were dependent variables in three separate models. Perceived severity and susceptibility to COVID-19 were explanatory variables alongside time. For aim two, perceived severity and susceptibility to COVID-19 were dependent variables, and demographic factors were explanatory variables.
From May 2022, the survey was amended to capture evolving vaccine attitudes and behaviors; thus, while intention to have a first dose of COVID-19 vaccine was captured for the entire study period (September to August 2022), data on intention to have further doses and number of doses received were only collected after May 2022.
We limited the scope of our analysis to two drivers of COVID-19 vaccination in the Health Belief Model, perceptions of severity and susceptibility, because we had the most robust longitudinal data for these constructs. The other constructs driving vaccine uptake, as described by the Health Belief Model (Figure 1) were outside the scope of this analysis.
All primary outcomes were recoded as binary variables (see Table 1) to improve interpretability and ensure model stability, and categories for both primary outcomes and demographics were aligned to other published work from the Optimise study [19,20].

Table 1.
Survey questions included in analysis and the processing that was completed prior to their inclusion.
The number of COVID-19 vaccine doses received was collapsed into two categories: ≤3 doses and >3 doses. Although sector-specific mandates applied to healthcare, aged care, and other occupations, there were no mandates for a fourth or subsequent dose for the general population. Therefore, uptake beyond three doses is considered to primarily reflect voluntary, intrinsic decision-making
Participant responses “Prefer to not to say” and “Other” were considered missing data and excluded from analysis. For perceived susceptibility, participants could select “not applicable—already been infected with COVID-19” (see Table 1). Although, COVID-19 transmission increased over time, this response did not result in declining data availability as only 181 participant responses out of 11,115 surveys administered had missing data or were not applicable.
2.3. Data Analysis
To address Aim 1, we examined how perceived COVID-19 severity and susceptibility influenced vaccine intentions and self-reported uptake over time. Guided by the Health Belief Model, we hypothesized that higher perceived severity of COVID-19 illness and perceived susceptibility to infection would be positively associated with increased vaccine intentions and uptake, but that the strength of these associations would vary over time, reflecting changes in the broader social, epidemiological and policy context of the pandemic.
To test this hypothesis, generalized linear models with Generalised Estimating Equations (GEEs) to account for repeated measures were used. We fit three separate models for the following outcome variables: (i) intention to receive a first COVID-19 vaccine dose (October 2020–September 2021), (ii) intention to receive further doses (May–August 2022) and, (iii) cumulative number of vaccine doses received (May–August 2022). As covariates, each model included time, perceived severity, perceived susceptibility, and their interactions with time. Time was modeled as a categorical variable with interactions, as both outcomes and predictors varied across periods. This allowed us to analyze period-specific associations between perceived susceptibility or severity and the outcomes, capturing contextual, policy-driven, and non-linear dynamics over time.
For outcome (i), first dose intention, time points after intention reached ≥ 95% were excluded due to data sparsity limiting a meaningful analysis. Application of this criterion excluded data after 9 September 2021. In both outcomes (ii), further dose intention, and (iii), doses received, data were considered from May 2022, when questions on these variables were first introduced in the survey.
To specifically explore vaccination decisions made under conditions of choice rather than mandate, we focused our analyses on doses beyond the third vaccine, which in Victoria were no longer mandated and therefore more likely to reflect intrinsic motivation. To account for repeated samples, an autoregressive (AR (1)) correlation structure was used, with decreasing correlation between farther time periods.
The models described above focus on temporal associations between perceived severity and susceptibility with vaccine intention and uptake. Demographic covariates were examined separately as predictors of Health Belief Model constructs, consistent with the study’s aim to assess temporal dynamics rather that to build a fully explanatory model.
To address Aim 2, to examine demographic predictors of (a) perceived COVID-19 severity and (b) perceived susceptibility, we fitted two separate binomial GEE models (logit link). For each model, all combinations of demographic covariates were tested using an AR (1) structure (age, region of residence at baseline, gender identity, existence of a chronic health condition, country of birth, language spoken at home, whether employed as a healthcare worker at baseline, religion, level of education, employment status, and whether children lived in the household). Time was included as a continuous variable because the predictors (demographics) were time invariant, and only the outcomes varied over time. A continuous specification suffices to capture overall associations between outcome variables and demographics, accounts for repeated measures, and reduces model complexity by avoiding separate estimates for each time period.
Models were ranked using the Quasilikelihood under the Independence Model Criterion (QIC), and the model with the fewest covariates within the lowest 10% of QIC values was selected. Time-by-demographic interactions were then added and retained only if they improved model fit. The geepack package was used to conduct the analysis on R v3.6.3. Data analysis was conducted in R version 4.1.1 [21].
3. Results
3.1. Demographics
The Optimise study included 779 participants across the entire study period of one year and 11 months, the demographics of which are described in Table 2. Across the study period, the number of individuals completing each survey and answering each specific question for analysis fluctuated. These difference in respondents between time periods were due to (a) rolling recruitment and (b) the fact that completing the surveys was voluntary. Additional demographics are included in Appendix A, Table A1.
Table 2.
Basic demographic data of Optimise participants. Bold subheadings within the table indicate different demographic categories.
3.2. Perceptions of COVID-19 Severity and Susceptibility over Time
Perceptions of COVID-19 severity and susceptibility fluctuated over time as shown in Figure 3. Throughout the study, most participants expected COVID-19 to be mild, moderate, or asymptomatic, with a smaller proportion perceiving the disease as life-threatening or very severe. The proportion expecting severe disease fluctuated at the onset of the pandemic until early 2021 before it gradually declined over the remainder of the study until September 2022. In contrast, expectations of susceptibility to infection remained relatively stable through 2020 and early 2021, with most respondents reporting that they were somewhat unlikely or unlikely to contract COVID-19. From mid-2021 onwards, however, the proportion of participants who believed they were very likely to contract the virus increased substantially—peaking in late 2021 and early 2022—before declining marginally in subsequent months.
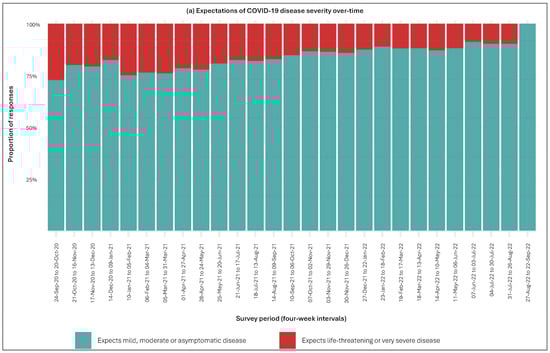
Figure 3.
Expectations of COVID-19 disease severity and susceptibility over time. Subfigure (a) displays perceived severity of COVID-19 over time. Subfigure (b) displays perceived susceptibility to COVID-19 infection over time.
3.3. Aim 1: Perceived Severity, Susceptibility and Vaccine Outcomes over Time
For intention to have a first dose of COVID-19 vaccine, time was a significant predictor, with odds of intending to vaccinate increasing notably at later time points (p < 0.01). However, neither perceived severity nor susceptibility showed consistent independent effects or significant interactions with time, as shown in Table 3.
Table 3.
GEE results for associations between intention to receive a first COVID-19 vaccine, perceived severity and perceived susceptibility over time. The reference time (intercept), T1, is 21-Oct-20 to 16-Nov-20.
In contrast, perceived severity was significantly associated with intention to receive further vaccine doses (OR = 2.53, 95% CI: 1.26–5.07, p = 0.01) (Table 4) and having received more than 3 doses (OR = 2.74, 95% CI: 1.58–4.76, p < 0.01) (Table 5). The association of perceived severity and the number of doses received was weaker at time T24 (4 July 2022 to 30 July 2022) compared to T22 (11 May 2022 to 6 June 2022), as indicated by a significant interaction term reflecting effect modification by time. The overall associations of perceived susceptibility with further vaccine intention or dose count were not statistically significant (Table 4 and Table 5). Interaction terms with time indicate that the effect may vary at specific time points, although none of these time-specific effects reached statistical significance. A graphical representation of the relationships between perceived severity and susceptibility with vaccine outcomes is given in Appendix B.
Table 4.
GEE results for associations between intention to receive further COVID-19 vaccine doses, perceived severity and perceived susceptibility over time. The reference time (intercept), T22, is 11 May 2022 to 6 June 2022. Numbering of time periods was set at 22 for this sample to indicate the number of time periods elapsed between data in this analysis and those in Table 3.
Table 5.
GEE results for associations between vaccine self-reported uptake (having received > 3 doses), perceived severity and perceived susceptibility over time. The reference time (intercept), T22, is 11 May 2022 to 6 June 2022. Numbering of time periods was set at 22 for this sample to indicate the number of time periods elapsed between data in this analysis and those in Table 3.
3.4. Aim 2: Demographic Predictors of Health Belief Model Beliefs
GEE model selection for perceived severity of COVID-19 included age, chronic health condition, employment status, and time (28-day blocks) as covariates. Participants aged 55–64 and 65+ were more than four times more likely to perceive COVID-19 as severe than those aged 18–24. Those with a chronic condition and those not in full-time employment were both over twice as likely to perceive COVID-19 as severe compared to those without a chronic health condition and those in full time employment. Model results are shown in Table 6.
Table 6.
Coefficients and corresponding p-values for GEE analysis of perceived severity of COVID-19. The reference category (intercept) is aged 18–24; does not have a chronic health condition and employed full-time. Time is treated a continuous variable with four-week increments, with 21 October 2020 to 16 November 2020 = 1.
3.5. The Demographics of Perceived Elevated Susceptibility to COVID-19
GEE model selection for perceived susceptibility to COVID-19 included age, chronic health condition, employment status, enrolment as a healthcare worker, household income, membership of a religious group, region of residence and time (28-day blocks) as covariates. Participants aged 55–64 and 65+ were more than four times more likely to perceive COVID-19 as severe than those aged 18–24. Despite perceiving COVID-19 as more severe, individuals aged 65+ and individuals not employed perceived themselves as less susceptible to COVID-19 than those aged 18–25 and those in full time employment. Notably, individuals with a household income over AUD$150 k perceived themselves as more than twice as susceptible than those earning under AUD50 k. Model results are shown in Table 7.
Table 7.
Coefficients and corresponding p-values for GEE analysis of perceived susceptibility of COVID-19. The reference categories (intercept) are aged 18–24; does not have a chronic health condition; employed full-time, is not a healthcare worker, has an income under 50 k and lives in metro Victoria. Time is treated a continuous variable with four-week increments, with 21 October 2020 to 16 November 2020 = 1.
4. Discussion
This study builds on previous work examining the drivers of Victorians’ vaccine behavior, and adds to a growing body of evidence suggesting that vaccine decision-making is influenced by a complex combination of factors [17,20,22,23]. We examined two constructs of the Health Belief Model (Figure 1)—perceived severity of and susceptibility to COVID-19—to assess their relevance for longitudinal vaccine uptake. Our study had two main findings. First, the explanatory value of widely accepted frameworks, like the Health Belief Model, is dynamic and time-dependent, likely influenced by the policy and environmental context in which individuals are operating. Second, perceived severity of COVID-19 was a more consistent predictor of vaccine intention than perceived susceptibility to the disease.
We did not observe any association between perceptions of COVID-19 severity or susceptibility and intention for the first COVID-19 vaccine dose, which was measured early in the pandemic when vaccines were not yet available and mandates shaped decision-making. However, perceptions of severity were associated with intention for subsequent doses, measured after mandates were lifted and vaccination decisions were more likely to reflect genuine choice rather than compliance. This shift highlights that the predictive value of Health Belief Model constructs can be shaped by time and policy context.
Several factors may explain this finding. One is the time sensitive nature of the survey questions. ‘Intention to have the first dose of the vaccine’ was asked early in the pandemic when vaccines were unavailable and stringent restrictions were in place, meaning the responses given were somewhat hypothetical. ‘Intention to have subsequent doses’ was measured later (from May 2022) after it was clear that multiple regular vaccinations would be required and after restrictions had recently eased. These two time periods had distinctly different policy and epidemiological contexts, with the later decisions arguably more likely to reflect personal perceptions of severity, rather than compliance. This hypothesis is supported by our data and by literature reporting that the Health Belief Model’s predictive value is heavily influenced by the conditions in which it is being applied, and that policy, media and social norms might be key mediating factors on its applicability [24].
Another explanation is that decision-making may differ between initial and subsequent doses. A systematic review found that the perceived severity declined in predictive value for COVID-19 booster dose intention [25]. Although this contrasts with our finding that perceived severity was more associated with subsequent doses, both studies suggest that the influence of Health Belief Model constructs may change depending on prior vaccination history. Given that time, context and vaccination history may all be mediating the applicability of the Health Belief Model to vaccine intention, further investigation is needed to understand under which conditions it is most relevant.
Perceived severity was also significantly associated with the number of vaccine doses received. One explanation is the Health Belief Model may better predict actual behavior than hypothetical intention. Another possible explanation is the characteristics of our study sample, which oversampled those at elevated risk of COVID-19 and its health effects. Participants with pre-existing chronic health conditions reported higher perceived severity of COVID-19, aligning with existing literature suggesting that this group engages in distinct health decision-making processes due to their different risk profile [26]. Similarly, older adults reported higher perceived severity but lower perceived susceptibility, suggesting that those at greater clinical risk may perceive a lower likelihood of infection due to protective behaviors or reduced exposure [27]. Consequently, the observed associations may partly reflect an over-representation of individuals who both perceived COVID-19 as severe and had greater vaccination opportunities due to policy measures, rather than a direct causal link between severity perception and uptake. Further research is needed to examine these relationships across populations and policy contexts, underscoring the challenge of disentangling intrinsic motivation from structural influences.
Perceptions of severity and susceptibility also varied across socioeconomic and demographic groups and were influenced by broader mediators such as vaccine confidence and health literacy. Higher perceived severity among older adults and individuals with chronic conditions likely reflects both clinical risk and greater engagement with health information, whereas perceived susceptibility was higher among high-income earners but lower among older adults and the unemployed, potentially reflecting differences in exposure, protective behaviors, and access to information. Individuals with higher confidence in vaccines and greater understanding of health information may interpret infection risks differently, influencing both perceived severity and subsequent vaccination behavior [28,29]. These patterns illustrate how social determinants and mediating factors shape how individuals interpret and respond to disease risk, highlighting the importance of considering these influences when applying behavioral models such as the Health Belief Model.
The variability of the Health Belief Model’s predictive value across time and demographic subgroups suggests it is best applied to specific contexts rather than entire populations. Prior research similarly shows that health beliefs and vaccine uptake are shaped by structural and temporal factors [30,31,32]. In the case of COVID-19, influencers such as trust in institutions, social norms, and perceived benefits—constructs outside the Health Belief Model—have also been shown to influence vaccine uptake [33,34]. Therefore, while the Health Belief Model remains a valuable framework, our findings suggest it may be best applied contextually and in conjunction with broader behavioral and structural considerations, including whether decisions reflect choice or mandate-driven compliance.
Limitations
Our cohort intentionally oversampled healthcare workers and priority groups, increasing statistical power for these populations but limiting generalizability. Attrition across survey waves may also introduce bias toward more engaged participants, although high retention rates across the study imply that this effect may be minimal. Participants who responded “prefer not to say” or “don’t know” to survey questions were excluded from some analyses, which may introduce selection bias and limit the generalizability of our findings. However, the proportion of participants responding with these options was small. Not all participants responded at every survey wave; for some months, only a subset of the cohort completed the survey. This variation in response may introduce some selection bias, as findings could disproportionately reflect individuals who remained engaged across multiple waves. However, GEE models allow inclusion of all available responses, focusing on temporal trends rather than individual-level predictions.
5. Conclusions
The Health Belief Model is widely used to explain health behavior, but its utility during the COVID-19 pandemic in Victoria proved context-dependent. Our findings show that once mandates were lifted, perceptions of disease severity—but not susceptibility—were consistently associated with vaccine intention and uptake. Our findings highlight the challenges of applying generalized behavioral models in highly dynamic policy environments and the importance of situating them within demographic and structural contexts. Future research should clarify when and for whom the Health Belief Model most accurately predicts vaccine intention and behavior.
Author Contributions
Conceptualization, A.V., A.P., M.E.H. and K.H.; methodology, A.V. and K.H.; software, A.V. and K.H.; validation, A.V., A.A., A.W., M.E.H., A.P. and K.H.; formal analysis, A.V. and K.H.; investigation, A.V. and K.H.; resources, A.V., A.A., A.P. and K.H.; data curation, A.V., A.A., A.W. and K.H.; writing—original draft preparation, A.V. and K.H.; writing—review and editing, A.A., K.H., A.A., A.W., K.B.G., S.H., J.K., R.E.R., M.D., A.P. and M.E.H.; visualization, A.V. and K.H.; supervision, K.H.; project administration, K.H., A.P. and M.E.H.; funding acquisition, K.B.G., A.P. and M.E.H. All authors have read and agreed to the published version of the manuscript.
Funding
The study is funded by the Victorian Government Department of Jobs, Precincts and Regions, the Macquarie Group Foundation, and Burnet Institute donors.
Institutional Review Board Statement
The study was conducted according to the guidelines of the Declaration of Helsinki, and approved by the Alfred Ethics Committee (approval number: 333/20).
Informed Consent Statement
Informed consent was obtained from all subjects involved in the study.
Data Availability Statement
The data presented in this study may be requested from the corresponding author. The data are not publicly available due to ethical considerations and data privacy restrictions.
Acknowledgments
Optimise is a partnership between the Burnet Institute and Peter Doherty Institute. The authors gratefully acknowledge the generosity of the community members who participated in the study. The authors acknowledge the contributions of Nick Scott and Mark Stoové for their contributions to the establishment of the Optimise study, alongside all Optimise study project staff.
Conflicts of Interest
The authors declare no conflicts of interest. The funders had no role in the design of the study; in the collection, analyses, or interpretation of data; in the writing of the manuscript; or in the decision to publish the results.
Abbreviations
The following abbreviations are used in this manuscript:
| GEE | Generalized Estimating Equations |
| AR | Autoregressive |
| QIC | Quasilikelihood Independence Model Criterion |
Appendix A
Demographics
Table A1 presents additional demographic characteristics of the Optimise sample to complement data provided in Table 1 in the main text. Variables include participants’ highest level of education, presence of children living at home, primary language spoken at home, employment status, gender identity, whether they identify as an active member of a religious institution and place of residence (metropolitan or regional).
Table A1.
Additional demographics of Optimise participants. Bold subheadings within the table indicate different demographic factors.
Table A1.
Additional demographics of Optimise participants. Bold subheadings within the table indicate different demographic factors.
| Demographic | Number | % Total (/779) |
|---|---|---|
| Highest level of education obtained | ||
| Primary school | 39 | 5% |
| High school | 104 | 13% |
| Tertiary education—postgraduate | 213 | 27% |
| Tertiary education—TAFE/trade certificate | 126 | 16% |
| Tertiary—undergraduate | 290 | 37% |
| No data | 7 | 1% |
| Participant has children living in their household | ||
| Yes | 217 | 28% |
| No | 562 | 72% |
| Language spoken at home | ||
| English | 638 | 82% |
| Other | 141 | 18% |
| Employment status pre-COVID-19 (March 2020) | ||
| Full-time or self-employed | 281 | 36% |
| Part-time or casual | 271 | 35% |
| Not employed or other | 227 | 29% |
| Gender identity | ||
| Female | 559 | 72% |
| Male | 219 | 28% |
| No data | 1 | 0% |
| Active member of a religious group/church | ||
| Yes | 92 | 12% |
| No | 675 | 87% |
| No data | 12 | 2% |
| Area of residence in Victoria | ||
| Metropolitan Melbourne | 628 | 81% |
| Regional Victoria | 144 | 18% |
| No data | 7 | 1% |
Appendix B
COVID-19 Vaccine Uptake and Intention by Perceived Severity of Infection and Susceptibility of Contracting the Virus
Figure A1 presents trends in (a) intention to have a first COVID-19 vaccine dose, (b) COVID-19 vaccine uptake, and (c) intention to receive further doses, stratified by participants’ perceptions of the severity of COVID-19. Those who perceived the virus as severe (red line) were consistently more likely to have received more than three doses of the vaccine (Figure A1b) and to express an intention to receive further doses (Figure A1c), compared to those who did not perceive COVID-19 as severe (green line). This pattern was less evident for people’s intention to receive a first dose of the vaccine (Figure A1a).

Figure A1.
COVID-19 vaccine uptake and intention by perceptions of COVID-19 severity. Red lines represents the proportion of those that perceived COVID-19 as severe that (a) intended to receive a first dose of COVID_19 vaccine, (b) received more than three doses of the COVID-19 vaccine, and (c) intended to have further doses of the COVID-19 vaccine. Green lines represent those that did not perceive COVID-19 as severe that (a) intended to receive a first dose of COVID-19 vaccine (b) received more than three doses of the COVID-19 vaccine, and (c) intended to have further doses of the COVID-19 vaccine.
In Figure A2 individuals who felt they were at risk of contracting COVID-19 (orange line) showed marginally lower rates of having received more than three vaccine doses (Figure A2b) and were marginally more likely to intend to receive further doses (Figure A2c), compared to those who did not consider themselves susceptible (purple line). As in the case of perceived severity, this was no visually distinguishable difference in intention to have a first dose the vaccine between those that perceived themselves susceptible to COVID-19 infection and those that did not (Figure A2a). As shown in Table 3, Table 4 and Table 5 in the main text, perceived susceptibility was not significantly associated with any of the three outcomes.

Figure A2.
COVID-19 vaccine uptake and intention by perceptions of COVID-19 susceptibility. Orange lines represent those that perceived themselves as susceptible to COVID-19 that (a) intended to receive a first dose of COVID-19 vaccine, (b) received more than three doses of the COVID-19 vaccine, and (c) intended to have further doses of the COVID-19 vaccine. Purple lines represent those that did not perceive themselves as susceptible to COVID-19 that (a) intended to receive a first dose of COVID-19 vaccine, (b) received more than three doses of the COVID-19 vaccine, and (c) intended to have further doses of the COVID-19 vaccine.
References
- Becker, M.H. The Health Belief Model and Sick Role Behavior. Health Educ. Monogr. 1974, 2, 409–419. [Google Scholar] [CrossRef]
- Alyafei, A.; Easton-Carr, R. The Health Belief Model of Behavior Change; StatPearls Publishing: Treasure Island, FL, USA, 2025. [Google Scholar]
- Haller, D.M.; Sanci, L.A.; Sawyer, S.M.; Patton, G. Do Young People’s Illness Beliefs Affect Healthcare? A Systematic Review. J. Adolesc. Health 2008, 42, 436–449. [Google Scholar] [CrossRef] [PubMed]
- Limbu, Y.B.; Gautam, R.K.; Pham, L. The Health Belief Model Applied to COVID-19 Vaccine Hesitancy: A Systematic Review. Vaccines 2022, 10, 973. [Google Scholar] [CrossRef] [PubMed]
- White, T.M.; Lazarus, J.V.; Rabin, K.H.; Ratzan, S.C.; El-Mohandes, A. Emerging Global Patterns of COVID-19 Vaccine Information Fatigue in 23 Countries in 2023. Vaccine 2024, 42, 126475. [Google Scholar] [CrossRef]
- Del Riccio, M.; Bechini, A.; Buscemi, P.; Bonanni, P.; Boccalini, S. Reasons for the Intention to Refuse COVID-19 Vaccination and Their Association with Preferred Sources of Information in a Nationwide, Population-Based Sample in Italy, before COVID-19 Vaccines Roll Out. Vaccines 2022, 10, 913. [Google Scholar] [CrossRef]
- Australian Broadcasting Corporation. Coronavirus Cases Aren’t Coming down despite Victoria’s Lockdowns. Experts Seek to Explain Why. Available online: https://www.abc.net.au/news/health/2020-07-28/coronavirus-vic-lockdowns-why-arent-cases-coming-down-experts/12495100 (accessed on 22 September 2025).
- Australian Broadcasting Corporation. Victoria Records 950 COVID-19 Cases and Seven Deaths as Some Restrictions Ease Slightly. Available online: https://www.abc.net.au/news/2021-09-29/victoria-records-new-covid-cases-and-vaccine-progress/100499188 (accessed on 22 September 2025).
- Trauer, J.M.; Lydeamore, M.J.; Dalton, G.W.; Pilcher, D.; Meehan, M.T.; McBryde, E.S.; Cheng, A.C.; Sutton, B.; Ragonnet, R. Understanding How Victoria, Australia Gained Control of Its Second COVID-19 Wave. Nat. Commun. 2021, 12, 6266. [Google Scholar] [CrossRef]
- University of Oxford. COVID-19 Government Response Tracker. Available online: https://www.bsg.ox.ac.uk/research/covid-19-government-response-tracker (accessed on 22 September 2025).
- McCosker, L.K. Reflections on One of the World’s Harshest COVID-19 Lockdowns, and on the Possibility of Eliminating COVID-19 in Australia. HPHR J. 2021, 29, 1–7. Available online: https://bcphr.org/29-article-mccosker/ (accessed on 10 September 2025). [CrossRef]
- Australian Government; Victorian Government. Victoria COVID-19 Vaccination Program Implementation Plan; Federal Financial Relations: Victorian, Australia, 2021.
- Premier of Victoria. Victoria’s Roadmap: Delivering the National Plan. Available online: https://www.premier.vic.gov.au/victorias-roadmap-delivering-national-plan (accessed on 24 April 2024).
- Taylor, J. Victoria Is Removing Most Covid Restrictions for Fully Vaccinated People. What Are the New Freedoms for Melbourne and Regional Vic? The Guardian, 18 November 2021. [Google Scholar]
- Australian Government Department of Health, Disability and Ageing. COVID-19 Vaccine Rollout Update. 30 April 2022. Available online: https://www.health.gov.au/resources/publications/covid-19-vaccine-rollout-update-30-april-2022?language=en (accessed on 22 September 2025).
- Victorian Government. Victorians’ Hard Work Means Hitting Target Ahead of Time. Available online: https://www.premier.vic.gov.au/victorians-hard-work-means-hitting-target-ahead-time (accessed on 22 September 2025).
- Byrne, P.; Harding-Edgar, L.; Pollock, A.M. SARS-CoV-2: Public Health Measures for Managing the Transition to Endemicity. J. R. Soc. Med. 2022, 115, 165–168. [Google Scholar] [CrossRef]
- Australian Government. COVID-19 Response Inquiry Report; Commonwealth Government: Canberra, Australia, 2024.
- Pedrana, A.; Bowring, A.; Heath, K.; Thomas, A.J.; Wilkinson, A.; Fletcher-Lartey, S.; Saich, F.; Munari, S.; Oliver, J.; Merner, B.; et al. Priority Populations’ Experiences of Isolation, Quarantine and Distancing for COVID-19: Protocol for a Longitudinal Cohort Study (Optimise Study). BMJ Open 2024, 14, e076907. [Google Scholar] [CrossRef]
- Heath, K.; Altermatt, A.; Saich, F.; Pedrana, A.; Fletcher-Lartey, S.; Bowring, A.L.; Stoové, M.; Danchin, M.; Kaufman, J.; Gibney, K.B.; et al. Intent to Be Vaccinated against COVID-19 in Victoria, Australia. Vaccines 2022, 10, 209. [Google Scholar] [CrossRef]
- R Core Team. R: A Language and Environment for Statistical Computing; R Core Team: Vienna, Austria, 2018. [Google Scholar]
- Pourrazavi, S.; Fathifar, Z.; Sharma, M.; Allahverdipour, H. COVID-19 Vaccine Hesitancy: A Systematic Review of Cognitive Determinants. Health Promot. Perspect. 2023, 13, 21–35. [Google Scholar] [CrossRef] [PubMed]
- Lewandowsky, S.; Schmid, P.; Habersaat, K.B.; Nielsen, S.M.; Seale, H.; Betsch, C.; Böhm, R.; Geiger, M.; Craig, B.; Sunstein, C.; et al. Lessons from COVID-19 for Behavioural and Communication Interventions to Enhance Vaccine Uptake. Commun. Psychol. 2023, 1, 35. [Google Scholar] [CrossRef] [PubMed]
- Taflinger, S.; Sattler, S. A Situational Test of the Health Belief Model: How Perceived Susceptibility Mediates the Effects of the Environment on Behavioral Intentions. Soc. Sci. Med. 2024, 346, 116715. [Google Scholar] [CrossRef] [PubMed]
- Limbu, Y.B.; Gautam, R.K. How Well the Constructs of Health Belief Model Predict Vaccination Intention: A Systematic Review on COVID-19 Primary Series and Booster Vaccines. Vaccines 2023, 11, 816. [Google Scholar] [CrossRef]
- Rosa, R.J.; de Paula Andrade, R.L.; Perticarrara Ferezin, L.; de Campos, M.C.T.; Moura, H.S.D.; Berra, T.Z.; Ribeiro, N.M.; Teibo, T.K.A.; Vinci, A.L.T.; Mendes Delpino, F.; et al. Risk Perception of Severity or Death from COVID-19: A Systematic Review of the Factors Associated. Front. Public. Health 2025, 13, 1543629. [Google Scholar] [CrossRef]
- Lebrasseur, A.; Fortin-Bédard, N.; Lettre, J.; Raymond, E.; Bussières, E.-L.; Lapierre, N.; Faieta, J.; Vincent, C.; Duchesne, L.; Ouellet, M.-C.; et al. Impact of the COVID-19 Pandemic on Older Adults: Rapid Review. JMIR Aging 2021, 4, e26474. [Google Scholar] [CrossRef]
- Hurstak, E.E.; Paasche-Orlow, M.K.; Hahn, E.A.; Henault, L.E.; Taddeo, M.A.; Moreno, P.I.; Weaver, C.; Marquez, M.; Serrano, E.; Thomas, J.; et al. The Mediating Effect of Health Literacy on COVID-19 Vaccine Confidence among a Diverse Sample of Urban Adults in Boston and Chicago. Vaccine 2023, 41, 2562–2571. [Google Scholar] [CrossRef]
- Collini, F.; Bonaccorsi, G.; Del Riccio, M.; Bruschi, M.; Forni, S.; Galletti, G.; Gemmi, F.; Ierardi, F.; Lorini, C. Does Vaccine Confidence Mediate the Relationship Between Vaccine Literacy and Influenza Vaccination? Exploring Determinants of Vaccination among Staff Members of Nursing Homes in Tuscany, Italy, during the COVID-19 Pandemic. Vaccines 2023, 11, 1375. [Google Scholar] [CrossRef]
- Deal, A.; Crawshaw, A.F.; Carter, J.; Knights, F.; Iwami, M.; Darwish, M.; Hossain, R.; Immordino, P.; Kaojaroen, K.; Severoni, S.; et al. Defining Drivers of Under-Immunization and Vaccine Hesitancy in Refugee and Migrant Populations. J. Travel. Med. 2023, 30, taad084. [Google Scholar] [CrossRef]
- de Figueiredo, A.; Simas, C.; Karafillakis, E.; Paterson, P.; Larson, H.J. Mapping Global Trends in Vaccine Confidence and Investigating Barriers to Vaccine Uptake: A Large-Scale Retrospective Temporal Modelling Study. Lancet 2020, 396, 898–908. [Google Scholar] [CrossRef]
- Anderson, K.-A.; Creanza, N. The Cultural Evolution of Vaccine Hesitancy: Modeling the Interaction Between Beliefs and Behaviors. medRxiv 2022. [Google Scholar] [CrossRef]
- Jennings, W.; Valgarðsson, V.; McKay, L.; Stoker, G.; Mello, E.; Baniamin, H.M. Trust and Vaccine Hesitancy during the COVID-19 Pandemic: A Cross-National Analysis. Vaccine X 2023, 14, 100299. [Google Scholar] [CrossRef]
- Agranov, M.; Elliott, M.; Ortoleva, P. The Importance of Social Norms against Strategic Effects: The Case of Covid-19 Vaccine Uptake. Econ. Lett. 2021, 206, 109979. [Google Scholar] [CrossRef]
Disclaimer/Publisher’s Note: The statements, opinions and data contained in all publications are solely those of the individual author(s) and contributor(s) and not of MDPI and/or the editor(s). MDPI and/or the editor(s) disclaim responsibility for any injury to people or property resulting from any ideas, methods, instructions or products referred to in the content. |
© 2025 by the authors. Licensee MDPI, Basel, Switzerland. This article is an open access article distributed under the terms and conditions of the Creative Commons Attribution (CC BY) license (https://creativecommons.org/licenses/by/4.0/).