
Has COVID-19 Affected DTP3 Vaccination in the Americas?
_MD__MPH_PhD.png)
 ,
,  , , , , and
Abstract
1. Introduction
2. Materials and Methods
2.1. Regional Analysis
2.2. Statistical Analysis
2.3. Software
3. Results
4. Discussion
4.1. Overview of the Study and Its Context
4.1.1. Methodological Considerations and Data Limitations
4.1.2. Discrepancies in Vaccine-Coverage Data and Trend Analysis
4.2. Analysis of DTP3-Vaccination Trends
4.3. Comparative Global and Regional Perspectives
4.4. Influential Factors and Challenges
4.5. Strategies and Interventions for Enhancing Vaccine Coverage
4.6. The Role of Healthcare Systems and Planning
4.7. Looking to the Future
5. Conclusions
Supplementary Materials
Author Contributions
Funding
Institutional Review Board Statement
Informed Consent Statement
Data Availability Statement
Conflicts of Interest
References
- Ota, M.O.C.; de Moraes, J.C.; Vojtek, I.; Constenla, D.; Doherty, T.M.; Cintra, O.; Kirigia, J.M. Unveiling the Contributions of Immunization for Progressing towards Universal Health Coverage. Hum. Vaccines Immunother. 2022, 18, 2036048. [Google Scholar] [CrossRef]
- Suffel, A.M.; Ojo-Aromokudu, O.; Carreira, H.; Mounier-Jack, S.; Osborn, D.; Warren-Gash, C.; McDonald, H.I. Exploring the Impact of Mental Health Conditions on Vaccine Uptake in High-Income Countries: A Systematic Review. BMC Psychiatry 2023, 23, 15. [Google Scholar] [CrossRef] [PubMed]
- Hassan, M.N. A Survey on Hygienic Practices and Immunization Coverage among 12-59 Months Old Children in Urban Slum, Barishal, Bangladesh. Asian J. Med. Biol. Res. 2022, 8, 277–285. [Google Scholar] [CrossRef]
- Evans, A.; Mahar, A.L.; Deb, B.; Boblitz, A.; Brownell, M.; Guttmann, A.; Stukel, T.A.; Cohen, E.; Sarkar, J.; Eze, N.; et al. Gaps in Childhood Immunizations and Preventive Care Visits during the COVID-19 Pandemic: A Population-Based Cohort Study of Children in Ontario and Manitoba, Canada, 2016–2021. Can. J. Public Health 2023, 114, 774–786. [Google Scholar] [CrossRef] [PubMed]
- Stein, R.A. Vaccination: A Public Health Intervention That Changed History & Is Changing with History. Am. Biol. Teach. 2011, 73, 513–519. [Google Scholar] [CrossRef]
- Pan, J.; Wang, Y.; Cao, L.; Wang, Y.; Zhao, Q.; Tang, S.; Gong, W.; Guo, L.; Liu, Z.; Wen, Z.; et al. Impact of Immunization Programs on 11 Childhood Vaccine-Preventable Diseases in China: 1950–2018. Innovation 2021, 2, 100113. [Google Scholar] [CrossRef] [PubMed]
- Espinal, M.A. The Pan American Health Organization: 120 Years in the Americas Hemisphere. Lancet Reg. Health Am. 2023, 21, 100488. [Google Scholar] [CrossRef]
- Zulfan, G.P.; Sihombing, J.A.; Amin, D.M.; Widiantari, A.D.; Berti, M.P.E.; Murtiani, F. Clinical Manifestation of Childhood Diphtheria. J. Ilm. Kedokt. Wijaya Kusuma 2023, 12, 1. [Google Scholar] [CrossRef]
- WHO. Global Vaccine Action Plan 2011–2020; WHO Press: Geneva, Switzerland, 2013. [Google Scholar]
- Shahid, A.S.M.S.B.; Rahman, A.E.; Shahunja, K.M.; Afroze, F.; Sarmin, M.; Nuzhat, S.; Alam, T.; Chowdhury, F.; Sultana, M.S.; Ackhter, M.M.; et al. Vaccination Following the Expanded Programme on Immunization Schedule Could Help to Reduce Deaths in Children under Five Hospitalized for Pneumonia and Severe Pneumonia in a Developing Country. Front. Pediatr. 2023, 11, 1054335. [Google Scholar] [CrossRef]
- Atteraya, M.S.; Song, I.H.; Ebrahim, N.B.; Gnawali, S.; Kim, E.; Dhakal, T. Inequalities in Childhood Immunisation in South Asia. Int. J. Environ. Res. Public Health 2023, 20, 1755. [Google Scholar] [CrossRef]
- Basu, S.; Ashok, G.; Debroy, R.; Ramaiah, S.; Livingstone, P.; Anbarasu, A. Impact of the COVID-19 Pandemic on Routine Vaccine Landscape: A Global Perspective. Hum. Vaccines Immunother. 2023, 19, 2199656. [Google Scholar] [CrossRef]
- Budu, E.; Ahinkorah, B.O.; Guets, W.; Ameyaw, E.K.; Essuman, M.A.; Yaya, S. Socioeconomic and Residence-based Related Inequality in Childhood Vaccination in Sub-Saharan Africa: Evidence from Benin. Health Sci. Rep. 2023, 6, e1198. [Google Scholar] [CrossRef]
- Albers, A.N.; Wright, E.; Thaker, J.; Conway, K.; Daley, M.F.; Newcomer, S.R. Childhood Vaccination Practices and Parental Hesitancy Barriers in Rural and Urban Primary Care Settings. J. Community Health 2023, 48, 798–809. [Google Scholar] [CrossRef]
- Santoli, J.M.; Lindley, M.C.; DeSilva, M.B.; Kharbanda, E.O.; Daley, M.F.; Galloway, L.; Gee, J.; Glover, M.; Herring, B.; Kang, Y.; et al. Effects of the COVID-19 Pandemic on Routine Pediatric Vaccine Ordering and Administration—United States, 2020. MMWR Morb. Mortal. Wkly. Rep. 2020, 69, 591–593. [Google Scholar] [CrossRef]
- Zhong, Y.; Clapham, H.E.; Aishworiya, R.; Chua, Y.X.; Mathews, J.; Ong, M.; Wang, J.; Murugasu, B.; Chiang, W.C.; Lee, B.W.; et al. Childhood Vaccinations: Hidden Impact of COVID-19 on Children in Singapore. Vaccine 2021, 39, 780–785. [Google Scholar] [CrossRef]
- Tolera, S.T.; Kaweti, G.; Aboma, L.M. Article Review on Potential Impact of COVID-19 Pandemic on Socioeconomic of Ethiopia, Africa. Health Sci. 2022, 11, 19–30. [Google Scholar]
- Yang, J.; Vaghela, S.; Yarnoff, B.; De Boisvilliers, S.; Di Fusco, M.; Wiemken, T.L.; Kyaw, M.H.; McLaughlin, J.M.; Nguyen, J.L. Estimated Global Public Health and Economic Impact of COVID-19 Vaccines in the Pre-Omicron Era Using Real-World Empirical Data. Expert. Rev. Vaccines 2023, 22, 54–65. [Google Scholar] [CrossRef]
- Chen, X.; Huang, H.; Ju, J.; Sun, R.; Zhang, J. Impact of Vaccination on the COVID-19 Pandemic in US States. Sci. Rep. 2022, 12, 1554. [Google Scholar] [CrossRef] [PubMed]
- Heffernan, C. The ‘New Normal’: Delivering Childhood Immunisations during the COVID-19 Pandemic. Pract. Nurs. 2020. Available online: https://www.practicenursing.com/content/comment/the-new-normal-delivering-childhood-immunisations-during-the-covid-19-pandemic/ (accessed on 9 December 2023). [CrossRef]
- Athiyaman, A.; Ajayi, T.; Mutuku, F.; Luwaga, F.; Bryer, S.; Giwa, O.; Mngemane, S.; Edwige, N.N.; Berman, L. Recovering from the Unprecedented Backsliding in Immunization Coverage: Learnings from Country Programming in Five Countries through the Past Two Years of COVID-19 Pandemic Disruptions. Vaccines 2023, 11, 375. [Google Scholar] [CrossRef] [PubMed]
- Naor, M.; Pinto, G.D.; Davidov, P.; Abdrbo, L. Rapidly Establishing an Ultra-Cold Supply Chain of Vaccines in Israel: Evidence for the Efficacy of Inoculation to Mitigate the COVID-19 Pandemic. Vaccines 2023, 11, 349. [Google Scholar] [CrossRef]
- He, K.; Mack, W.J.; Neely, M.; Lewis, L.; Anand, V. Parental Perspectives on Immunizations: Impact of the COVID-19 Pandemic on Childhood Vaccine Hesitancy. J. Community Health 2022, 47, 39–52. [Google Scholar] [CrossRef]
- McDonald, H.I.; Tessier, E.; White, J.M.; Woodruff, M.; Knowles, C.; Bates, C.; Parry, J.; Walker, J.L.; Scott, J.A.; Smeeth, L.; et al. Early Impact of the Coronavirus Disease (COVID-19) Pandemic and Physical Distancing Measures on Routine Childhood Vaccinations in England, January to April 2020. Euro Surveill. 2020, 25, 2000848. [Google Scholar] [CrossRef] [PubMed]
- Lassi, Z.S.; Naseem, R.; Salam, R.A.; Siddiqui, F.; Das, J.K. The Impact of the COVID-19 Pandemic on Immunization Campaigns and Programs: A Systematic Review. Int. J. Environ. Res. Public Health 2021, 18, 988. [Google Scholar] [CrossRef] [PubMed]
- Alsuhaibani, M.; Alaqeel, A. Impact of the COVID-19 Pandemic on Routine Childhood Immunization in Saudi Arabia. Vaccines 2020, 8, 581. [Google Scholar] [CrossRef] [PubMed]
- Palo, S.K.; Dubey, S.; Negi, S.; Sahay, M.R.; Patel, K.; Swain, S.; Mishra, B.K.; Bhuyan, D.; Kanungo, S.; Som, M.; et al. Effective Interventions to Ensure MCH (Maternal and Child Health) Services during Pandemic Related Health Emergencies (Zika, Ebola, and COVID-19): A Systematic Review. PLoS ONE 2022, 17, e0268106. [Google Scholar] [CrossRef] [PubMed]
- Kiely, M.; Mansour, T.; Brousseau, N.; Rafferty, E.; Paudel, Y.R.; Sadarangani, M.; Svenson, L.W.; Robinson, J.L.; Gagneur, A.; Driedger, S.M.; et al. COVID-19 Pandemic Impact on Childhood Vaccination Coverage in Quebec, Canada. Hum. Vaccines Immunother. 2021, 18, 2007707. [Google Scholar] [CrossRef] [PubMed]
- Verrier, F.; de Lauzanne, A.; Diouf, J.-B.N.; Zo, A.Z.; Ramblière, L.; Herindrainy, P.; Sarr, F.D.; Sok, T.; Vray, M.; Collard, J.-M.; et al. Vaccination Coverage and Risk Factors Associated with Incomplete Vaccination Among Children in Cambodia, Madagascar, and Senegal. Open Forum Infect. Dis. 2023, 10, ofad136. [Google Scholar] [CrossRef] [PubMed]
- Hogan, D.; Gupta, A. Why Reaching Zero-Dose Children Holds the Key to Achieving the Sustainable Development Goals. Vaccines 2023, 11, 781. [Google Scholar] [CrossRef] [PubMed]
- Alexander, C.; Cabrera, M.; Moore, M.; Lomazzi, M. Driving Paediatric Vaccine Recovery in Europe. Vaccines 2023, 11, 184. [Google Scholar] [CrossRef]
- Causey, K.; Fullman, N.; Sorensen, R.J.D.; Galles, N.C.; Zheng, P.; Aravkin, A.; Danovaro-Holliday, M.C.; Martinez-Piedra, R.; Sodha, S.V.; Velandia-González, M.P.; et al. Estimating Global and Regional Disruptions to Routine Childhood Vaccine Coverage during the COVID-19 Pandemic in 2020: A Modelling Study. Lancet 2021, 398, 522–534. [Google Scholar] [CrossRef]
- Wiysonge, C.S.; Uthman, O.A.; Ndumbe, P.M.; Hussey, G.D. Individual and Contextual Factors Associated with Low Childhood Immunisation Coverage in Sub-Saharan Africa: A Multilevel Analysis. PLoS ONE 2012, 7, e37905. [Google Scholar] [CrossRef]
- WHO. Global Routine Immunization Strategies and Practices (Grisp)—A Companion Document to the Global Vaccine Action Plan (GVAP); WHO: Geneva, Switzerland, 2016. [Google Scholar]
- WHO. Immunization and Vaccine-Preventable Communicable Diseases. Available online: https://www.who.int/data/gho/data/themes/immunization (accessed on 12 November 2023).
- Immunization Coverage—Are We Losing Ground? Available online: https://data.unicef.org/resources/immunization-coverage-are-we-losing-ground/ (accessed on 29 April 2023).
- Cutts, F.T.; Izurieta, H.S.; Rhoda, D.A. Measuring Coverage in MNCH: Design, Implementation, and Interpretation Challenges Associated with Tracking Vaccination Coverage Using Household Surveys. PLoS Med. 2013, 10, e1001404. [Google Scholar] [CrossRef] [PubMed]
- Barbosa, J. Vaccination Week in the Americas Press Conference—Dr. Jarbas Barbosa, PAHO’s Director Remarks—20 April 2023—PAHO/WHO|Pan American Health Organization. Available online: https://www.paho.org/en/documents/vaccination-week-americas-press-conference-dr-jarbas-barbosa-pahos-director-remarks-20 (accessed on 15 December 2023).
- PAHO. Fact Sheet—Vaccination Week in the Americas 2023—PAHO/WHO|Pan American Health Organization. Available online: https://www.paho.org/en/documents/fact-sheet-vaccination-week-americas-2023 (accessed on 15 December 2023).
- PAHO. Risk of Vaccine-Preventable Disease Outbreaks at 30-Year High, PAHO Director Says. Available online: https://www.paho.org/en/news/20-4-2023-risk-vaccine-preventable-disease-outbreaks-30-year-high-paho-director-says (accessed on 15 December 2023).
- WHO/UNICEF. Progress and Challenges with Achieving Universal Immunization Coverage. 2022 WHO/UNICEF Estimates of National Immunization Coverage (WUENIC); WHO/UNICEF: Geneva, Switzerland, 2023. [Google Scholar]
- Brown, C.L.; Montez, K.; Amati, J.B.; Simeonsson, K.; Townsend, J.D.; Orr, C.J.; Palakshappa, D. Impact of COVID-19 on Pediatric Primary Care Visits at Four Academic Institutions in the Carolinas. Int. J. Environ. Res. Public Health 2021, 18, 5734. [Google Scholar] [CrossRef] [PubMed]
- Shet, A.; Carr, K.; Danovaro-Holliday, M.C.; Sodha, S.V.; Prosperi, C.; Wunderlich, J.; Wonodi, C.; Reynolds, H.W.; Mirza, I.; Gacic-Dobo, M.; et al. Impact of the SARS-CoV-2 Pandemic on Routine Immunisation Services: Evidence of Disruption and Recovery from 170 Countries and Territories. Lancet Glob. Health 2022, 10, e186–e194. [Google Scholar] [CrossRef]
- Aguinaga-Ontoso, I.; Guillen-Aguinaga, S.; Guillen-Aguinaga, L.; Alas-Brun, R.; Onambele, L.; Aguina-ga-Ontoso, E.; Guillen-Grima, F. COVID-19 Impact on DTP Vaccination Trends in Africa: A Joinpoint Regression Analysis. Vaccines 2023, 11, 1103. [Google Scholar] [CrossRef] [PubMed]
- Castrejon, M.M.; Leal, I.; de Jesus Pereira Pinto, T.; Guzmán-Holst, A. The Impact of COVID-19 and Catch-up Strategies on Routine Childhood Vaccine Coverage Trends in Latin America: A Systematic Literature Review and Database Analysis. Hum. Vaccines Immunother. 2022, 18, 2102353. [Google Scholar] [CrossRef]
- Munyangaju, I.; López-Varela, E.; Bassat, Q. Closing the Gap in Childhood Immunisation after the Pandemic. BMJ 2023, 380, 627. [Google Scholar] [CrossRef] [PubMed]
- The Global Health Observatory. Vaccine-Preventable Diseases. Available online: https://www.who.int/data/gho/data/themes/topics/indicator-groups/indicator-group-details/GHO/gho-immunization-vaccine-preventable-communicable-diseases (accessed on 29 November 2023).
- Kaur, G.; Danovaro-Holliday, M.C.; Mwinnyaa, G.; Gacic-Dobo, M.; Francis, L.; Grevendonk, J.; Sodha, S.V.; Sugerman, C.; Wallace, A. Routine Vaccination Coverage—Worldwide, 2022. MMWR Morb. Mortal. Wkly. Rep. 2023, 72, 1155–1161. [Google Scholar] [CrossRef]
- World Health Assembly. Immunization Agenda 2030: A Global Strategy to Leave No One Behind; WHO: Geneva, Switzerland, 2020. [Google Scholar]
- UNICEF. COVID-19 Pandemic Fuels Largest Continued Backslide in Vaccinations in Three Decades. Available online: https://www.unicef.org/press-releases/WUENIC2022release (accessed on 16 May 2023).
- Data Warehouse—Unicef Data. Available online: https://data.unicef.org/resources/data_explorer/unicef_f/?ag=UNICEF&df=IMMUNISATION&ver=1.0&dq=.IM_DTP3..&startPeriod=2000&endPeriod=2022 (accessed on 18 April 2023).
- UNICEF. Number of Births. Data Warehouse—UNICEF DATA. Available online: https://data.unicef.org/resources/data_explorer/unicef_f/?ag=UNICEF&df=GLOBAL_DATAFLOW&ver=1.0&dq=.DM_BRTS..&startPeriod=2019&endPeriod=2021 (accessed on 21 May 2023).
- World Bank. Population, Total|Data. Available online: https://data.worldbank.org/indicator/SP.POP.TOTL (accessed on 21 May 2023).
- White, K.J. The Durbin-Watson Test for Autocorrelation in Nonlinear Models. Rev. Econ. Stat. 1992, 74, 370. [Google Scholar] [CrossRef]
- Wagner, A.K.; Soumerai, S.B.; Zhang, F.; Ross-Degnan, D. Segmented Regression Analysis of Interrupted Time Series Studies in Medication Use Research. J. Clin. Pharm. Ther. 2002, 27, 299–309. [Google Scholar] [CrossRef]
- Lopez Bernal, J.; Cummins, S.; Gasparrini, A. Interrupted Time Series Regression for the Evaluation of Public Health Interventions: A Tutorial. Int. J. Epidemiol. 2017, 46, 348–355. [Google Scholar] [CrossRef]
- Slavova, S.; Rock, P.; Bush, H.M.; Quesinberry, D.; Walsh, S.L. Signal of Increased Opioid Overdose during COVID-19 from Emergency Medical Services Data. Drug Alcohol. Depend. 2020, 214, 108176. [Google Scholar] [CrossRef] [PubMed]
- Rockville, M. Joinpoint Regression Program, version 4.3.1.0; Statistical Methodology and Applications Branch, Surveillance Research Program, National Cancer Institute: Rockville, MA, USA, 2016.
- Kim, H.J.; Fay, M.P.; Feuer, E.J.; Midthune, D.N. Permutation Tests for Joinpoint Regression with Applications to Cancer Rates. Stat. Med. 2000, 19, 335–351. [Google Scholar] [CrossRef]
- Muggeo, V.M.; Atkins, D.C.; Gallop, R.J.; Dimidjian, S. Segmented Mixed Models with Random Change-points: A Maximum Likelihood Approach with Application to Treatment for Depression Study. Stat. Model-Ling. 2014, 14, 293–313. [Google Scholar] [CrossRef]
- Muggeo, V.M.R. Interval Estimation for the Breakpoint in Segmented Regression: A Smoothed Score-based Approach. Aust. N. Z. J. Stat. 2017, 59, 311–322. [Google Scholar] [CrossRef]
- Muggeo, V.M.R. Testing with a Nuisance Parameter Present Only under the Alternative: A Score-Based Approach with Application to Segmented Modelling. J. Stat. Comput. Simul. 2016, 86, 3059–3067. [Google Scholar] [CrossRef]
- Fasola, S.; Muggeo, V.M.R.; Küchenhoff, H. A Heuristic, Iterative Algorithm for Change-Point Detection in Abrupt Change Models. Comput. Stat. 2018, 33, 997–1015. [Google Scholar] [CrossRef]
- R Core Team. R: A Language and Environment for Statistical Computing; R Foundation for Statistical Computing: Vienna, Austria, 2023. [Google Scholar]
- RStudio Team. RStudio: Integrated Development for R; RStudio, PBC: Boston, MA, USA, 2023. [Google Scholar]
- Wickham, H. Ggplot2: Elegant Graphics for Data Analysis; Springer: New York, NY, USA, 2016. [Google Scholar]
- Wickham, H.; Bryan, J. Readxl: Read Excel Files_. R Package Version 1.4.3. 2023. Available online: https://cran.r-project.org/package=readxl (accessed on 17 December 2023).
- Mapchart Version 4.3.2. Mapchart. 30 November 2023. Available online: https://www.mapchart.net/ (accessed on 17 December 2023).
- Brewer, C.A.; Hatchard, G.W.; Harrower, M.A. ColorBrewer in Print: A Catalog of Color Schemes for Maps. Cart. Geogr. Inf. Sci. 2003, 30, 5–32. [Google Scholar] [CrossRef]
- Brewer, C.A.; Hatchard, G.W.; Harrower, M.A. COLORBREWER 2.0 Color Advice for Cartograph. 2013. Available online: https://colorbrewer2.org (accessed on 17 December 2023).
- Rau, C.; Lüdecke, D.; Dumolard, L.B.; Grevendonk, J.; Wiernik, B.M.; Kobbe, R.; Gacic-Dobo, M.; Danovaro-Holliday, M.C. Data Quality of Reported Child Immunization Coverage in 194 Countries between 2000 and 2019. PLoS Glob. Public Health 2022, 2, e0000140. [Google Scholar] [CrossRef]
- Maciak, M.; Mizera, I. Regularization Techniques in Joinpoint Regression. Stat. Pap. 2016, 57, 939–955. [Google Scholar] [CrossRef]
- Kontopantelis, E.; Doran, T.; Springate, D.A.; Buchan, I.; Reeves, D. Regression Based Quasi-Experimental Approach When Randomisation Is Not an Option: Interrupted Time Series Analysis. BMJ 2015, 350, h2750. [Google Scholar] [CrossRef]
- Taljaard, M.; McKenzie, J.E.; Ramsay, C.R.; Grimshaw, J.M. The Use of Segmented Regression in Analysing Interrupted Time Series Studies: An Example in Pre-Hospital Ambulance Care. Implement. Sci. 2014, 9, 77. [Google Scholar] [CrossRef]
- Bower, M.; Kothari, U.; Akerman, M.; Krilov, L.R.; Fiorito, T.M. Impact of COVID-19 on HPV Vaccination Rates in New York City and Long Island. Pediatr. Infect. Dis. J. 2023, 43, 84–87. [Google Scholar] [CrossRef]
- Urueña, A.; Machado, R.; Cunha, J.; López Colmano, C.; Rancaño, C.; Kfouri, R.; Pírez, C.; Bonvehí, P.; Calvo, M.; Cuadros, R.; et al. Opinions, Attitudes and Factors Related to SARS-CoV-2 Vaccine Uptake in Eight South American Countries. Vaccines 2023, 11, 1660. [Google Scholar] [CrossRef] [PubMed]
- Mwinnyaa, G.; Peters, M.A.; Shapira, G.; Neill, R.; Sadat, H.; Yuma, S.; Akilimali, P.; Hossain, S.; Wendrad, N.; Atiwoto, W.K.; et al. Vaccination Utilization and Subnational Inequities during the COVID-19 Pandemic: An Interrupted Time-Series Analysis of Administrative Data across 12 Low- and Middle-Income Countries. Vaccines 2023, 11, 1415. [Google Scholar] [CrossRef] [PubMed]
- United Nations. Global Disparity in Access to Essential Vaccines, Says WHO Report|UN News. Available online: https://news.un.org/en/story/2022/11/1130402 (accessed on 17 December 2023).
- WHO. Vaccine Inequity Undermining Global Economic Recovery. Available online: https://www.who.int/news/item/22-07-2021-vaccine-inequity-undermining-global-economic-recovery (accessed on 17 December 2023).
- WHO. Global Vaccine Market Report 2022. Available online: https://www.who.int/publications/m/item/global-vaccine-market-report-2022 (accessed on 17 December 2023).
- Guglielmi, G. Pandemic Drives Largest Drop in Childhood Vaccinations in 30 Years. Nature 2022, 608, 253. [Google Scholar] [CrossRef] [PubMed]
- OECD. Access to COVID-19 Vaccines: Global Approaches in a Global Crisis—OECD. Available online: https://read.oecd-ilibrary.org/view/?ref=1069_1069384-ewmqrw9sx2&title=Access-to-COVID-19-vaccines-Global-approaches-in-a-global-crisis (accessed on 17 December 2023).
- Handfield, R. Challenges and Opportunities to Expand the COVID-19 Vaccine Supply Chain: A Global Summit|Supply Chain Resource Cooperative. Available online: https://scm.ncsu.edu/scm-articles/article/challenges-and-opportunities-to-expand-the-covid19-vaccine-supply-chain-a-global-summit (accessed on 17 December 2023).
- Muhoza, P.; Danovaro-Holliday, M.C.; Diallo, M.S.; Murphy, P.; Sodha, S.V.; Requejo, J.H.; Wallace, A.S. Routine Vaccination Coverage—Worldwide, 2020. MMWR Morb. Mortal. Wkly. Rep. 2021, 70, 1495–1500. [Google Scholar] [CrossRef] [PubMed]
- Evans, B.; Keiser, O.; Kaiser, L.; Jombart, T. Analysis of Global Routine Immunisation Coverage Shows Disruption and Stagnation during the First Two-Years of the COVID-19 Pandemic with Tentative Recovery in 2022. Vaccine 2023, 15, 100383. [Google Scholar] [CrossRef] [PubMed]
- Rachlin, A.; Carolina Danovaro-Holliday, M.; Murphy, P.; Sodha, S.V.; Wallace, A.S. Report Routine Vaccination Coverage-Worldwide, 2021. Morb. Mortal. Wkly. 2021, 71, 1396–1400. [Google Scholar] [CrossRef] [PubMed]
- LaMori, J.; Feng, X.; Pericone, C.D.; Mesa-Frias, M.; Sogbetun, O.; Kulczycki, A. Hepatitis Vaccination Adherence and Completion Rates and Factors Associated with Low Compliance: A Claims-Based Analysis of US Adults. PLoS ONE 2022, 17, e0264062. [Google Scholar] [CrossRef] [PubMed]
- Périères, L.; Séror, V.; Boyer, S.; Sokhna, C.; Peretti-Watel, P. Reasons given for Non-Vaccination and under-Vaccination of Children and Adolescents in Sub-Saharan Africa: A Systematic Review. Hum. Vaccines Immunother. 2022, 18, 2076524. [Google Scholar] [CrossRef] [PubMed]
- Atnafu Gebeyehu, N.; Abebe Gelaw, K.; Asmare Adella, G.; Dagnaw Tegegne, K.; Adie Admass, B.; Mesele Gesese, M. Incomplete Immunization and Its Determinants among Children in Africa: Systematic Review and Meta-Analysis. Hum. Vaccines Immunother. 2023, 19, 2202125. [Google Scholar] [CrossRef] [PubMed]
- CDC CDC Strategy for Global Response to COVID-19 (2020–2023). 2022. Available online: https://archive.cdc.gov/www_cdc_gov/coronavirus/2019-ncov/global-covid-19/global-response-strategy.html (accessed on 29 November 2023).
- Dayaratna, K.; Tyrrell, P.; Vanderplas, A. A Comparative Analysis of Policy Approaches to COVID-19 around the World, with Recommendations for US Lawmakers|The Heritage Foundation. Available online: https://www.heritage.org/public-health/report/comparative-analysis-policy-approaches-covid-19-around-the-world (accessed on 17 December 2023).
- Bliss, K.E. Strengthening Routine Immunizations and Responding to COVID-19; Center at the Center for Strategic and International Studies: Washington, DC, USA, 2020. [Google Scholar]
- de Albuquerque Veloso Machado, M.; Roberts, B.; Wong, B.L.H.; van Kessel, R.; Mossialos, E. The Relationship Between the COVID-19 Pandemic and Vaccine Hesitancy: A Scoping Review of Literature Until August 2021. Front Public Health 2021, 9, 747787. [Google Scholar] [CrossRef] [PubMed]
- Tan, L.; Safadi, M.A.P.; Horn, M.; Regojo Balboa, C.; Moya, E.; Schanbaum, J.; Pimenta, P.; Lambert, E.; Soumahoro, L.; Sohn, W.-Y.; et al. Pandemic’s Influence on Parents’ Attitudes and Behaviors toward Meningococcal Vaccination. Hum. Vaccines Immunother. 2023, 19, 2179840. [Google Scholar] [CrossRef] [PubMed]
- Bonanni, P.; Steffen, R.; Schelling, J.; Balaisyte-Jazone, L.; Posiuniene, I.; Zatoński, M.; Van Damme, P. Vaccine Co-Administration in Adults: An Effective Way to Improve Vaccination Coverage. Hum. Vaccines Immunother. 2023, 19, 2195786. [Google Scholar] [CrossRef]
- Spencer, N.; Markham, W.; Johnson, S.; Arpin, E.; Nathawad, R.; Gunnlaugsson, G.; Homaira, N.; Rubio, M.L.M.; Trujillo, C.J. The Impact of COVID-19 Pandemic on Inequity in Routine Childhood Vaccination Coverage: A Systematic Review. Vaccines 2022, 10, 1013. [Google Scholar] [CrossRef]
- Ning, C.; Wang, H.; Wu, J.; Chen, Q.; Pei, H.; Gao, H. The COVID-19 Vaccination and Vaccine Inequity Worldwide: An Empirical Study Based on Global Data. Int. J. Environ. Res. Public Health 2022, 19, 5267. [Google Scholar] [CrossRef]
- Sabbatucci, M.; Odone, A.; Signorelli, C.; Siddu, A.; Silenzi, A.; Maraglino, F.P.; Rezza, G. Childhood Immunisation Coverage during the COVID-19 Epidemic in Italy. Vaccines 2022, 10, 120. [Google Scholar] [CrossRef]
- Olusanya, O.A.; Bednarczyk, R.A.; Davis, R.L.; Shaban-Nejad, A. Addressing Parental Vaccine Hesitancy and Other Barriers to Childhood/Adolescent Vaccination Uptake During the Coronavirus (COVID-19) Pandemic. Front. Immunol. 2021, 12, 663074. [Google Scholar] [CrossRef]
- Sallam, M. COVID-19 Vaccine Hesitancy Worldwide: A Concise Systematic Review of Vaccine Acceptance Rates. Vaccines 2021, 9, 160. [Google Scholar] [CrossRef] [PubMed]
- Evans, W.D.; Bingenheimer, J.B.; Long, M.; Ndiaye, K.; Donati, D.; Rao, N.M.; Akaba, S.; Nsofor, I.; Agha, S. Outcomes of a Social Media Campaign to Promote COVID-19 Vaccination in Nigeria. PLoS ONE 2023, 18, e0290757. [Google Scholar] [CrossRef] [PubMed]
- Diedrich, D.; Northcote, N.; Röder, T.; Sauer-Sidor, K. Strategic Resilience during the COVID-19 Crisis|McKinsey. Available online: https://www.mckinsey.com/capabilities/strategy-and-corporate-finance/our-insights/strategic-resilience-during-the-covid-19-crisis (accessed on 29 April 2023).
- Soorapanth, S.; Cheung, R.; Zhang, X.; Mokdad, A.H.; Mensah, G.A. Rural–Urban Differences in Vaccination and Hesitancy Rates and Trust: US COVID-19 Trends and Impact Survey on a Social Media Platform, May 2021–April 2022. Am. J. Public Health 2023, 113, 680–688. [Google Scholar] [CrossRef] [PubMed]
- Olstad, D.L.; McIntyre, L. Reconceptualising Precision Public Health. BMJ Open 2019, 9, e030279. [Google Scholar] [CrossRef]
- WHO; UNICEF. Warn of a Decline in Vaccinations during COVID-19. Available online: https://www.who.int/news/item/15-07-2020-who-and-unicef-warn-of-a-decline-in-vaccinations-during-covid-19 (accessed on 29 April 2023).
- Watts, E.; Mak, J.; Patenaude, B. Benefit-Cost Ratios of Continuing Routine Immunization During the COVID-19 Pandemic in Africa. J. Benefit Cost. Anal. 2022, 13, 91–106. [Google Scholar] [CrossRef]
- de Oliveira Roque e Lima, J.; Pagotto, V.; Rocha, B.S.; Scalize, P.S.; Guimarães, R.A.; de Lima, M.D.; da Silva, L.N.; da Silva Oliveira, M.D.; Moura, W.É.A.; Teles, S.A.; et al. Low Vaccine Coverage and Factors Associated with Incomplete Childhood Immunization in Racial/Ethnic Minorities and Rural Groups, Central Brazil. Vaccines 2023, 11, 838. [Google Scholar] [CrossRef]
- Tan, N.C.; Pang, J.; Koh, E. The Impact of a Revised National Childhood Immunization Schedule on Vaccination Defaulters. Vaccines 2023, 11, 859. [Google Scholar] [CrossRef]
- Saxena, K.; Marden, J.R.; Carias, C.; Bhatti, A.; Patterson-Lomba, O.; Gomez-Lievano, A.; Yao, L.; Chen, Y.-T. Impact of the COVID-19 Pandemic on Adolescent Vaccinations: Projected Time to Reverse Deficits in Rou-tine Adolescent Vaccination in the United States. Curr. Med. Res. Opin. 2021, 37, 2077–2087. [Google Scholar] [CrossRef]
- Patel Murthy, B.; Zell, E.; Kirtland, K.; Jones-Jack, N.; Harris, L.; Sprague, C.; Schultz, J.; Le, Q.; Bramer, C.A.; Kuramoto, S.; et al. Impact of the COVID-19 Pandemic on Administration of Selected Routine Childhood and Adolescent Vaccinations—10 US Jurisdictions, March–September 2020. MMWR Morb. Mortal. Wkly. Rep. 2021, 70, 840–845. [Google Scholar] [CrossRef]
- Moraga-Llop, F.A.; Fernández-Prada, M.; Grande-Tejada, A.M.; Martínez-Alcorta, L.I.; Moreno-Pérez, D.; Pérez-Martín, J.J. Recovering Vaccine Coverage Lost Due to the COVID-19 Pandemic. Vacunas 2020, 21, 129–135. [Google Scholar] [CrossRef] [PubMed]
- WHO. Scale-Up Routine Immunization along with COVID-19 Vaccination: WHO. Available online: https://www.who.int/southeastasia/news/detail/08-09-2021-scale-up-routine-immunization-along-with-covid-19-vaccination-who (accessed on 29 April 2023).
- Berhane, H.Y.; Worku, A.; Fawzi, W. Effect of COVID-19 on Routine Childhood Vaccination in Bahir Dar City, Northwestern, Ethiopia. Vaccines 2023, 11, 1569. [Google Scholar] [CrossRef] [PubMed]
- Ali, A.; Nadol, A. Get Childhood Immunizations Back on Track. Nature 2022, 608, 7–8. [Google Scholar]
- Oyo-Ita, A.; Oduwole, O.; Arikpo, D.; Effa, E.E.; Esu, E.B.; Balakrishna, Y.; Chibuzor, M.T.; Oringanje, C.M.; Nwachukwu, C.E.; Wiysonge, C.S.; et al. Interventions for Improving Coverage of Childhood Immunisation in Low-and Middle-Income Countries. Cochrane Database Syst. Rev. 2023. [Google Scholar] [CrossRef] [PubMed]
- Ghaznavi, C.; Eguchi, A.; Lwin, K.S.; Yoneoka, D.; Tanoue, Y.; Rauniyar, S.K.; Horiuchi, S.; Hashizume, M.; Nomura, S. Estimating Global Changes in Routine Childhood Vaccination Coverage During the COVID-19 Pandemic, 2020–2021. Vaccine 2023, 41, 4151–4157. [Google Scholar] [CrossRef]
- Zhu, P.; Zhang, V.; Wagner, A.L. Demographic Differences in Compliance with COVID-19 Vaccination Timing and Completion Guidelines in the United States. Vaccines 2023, 11, 369. [Google Scholar] [CrossRef]


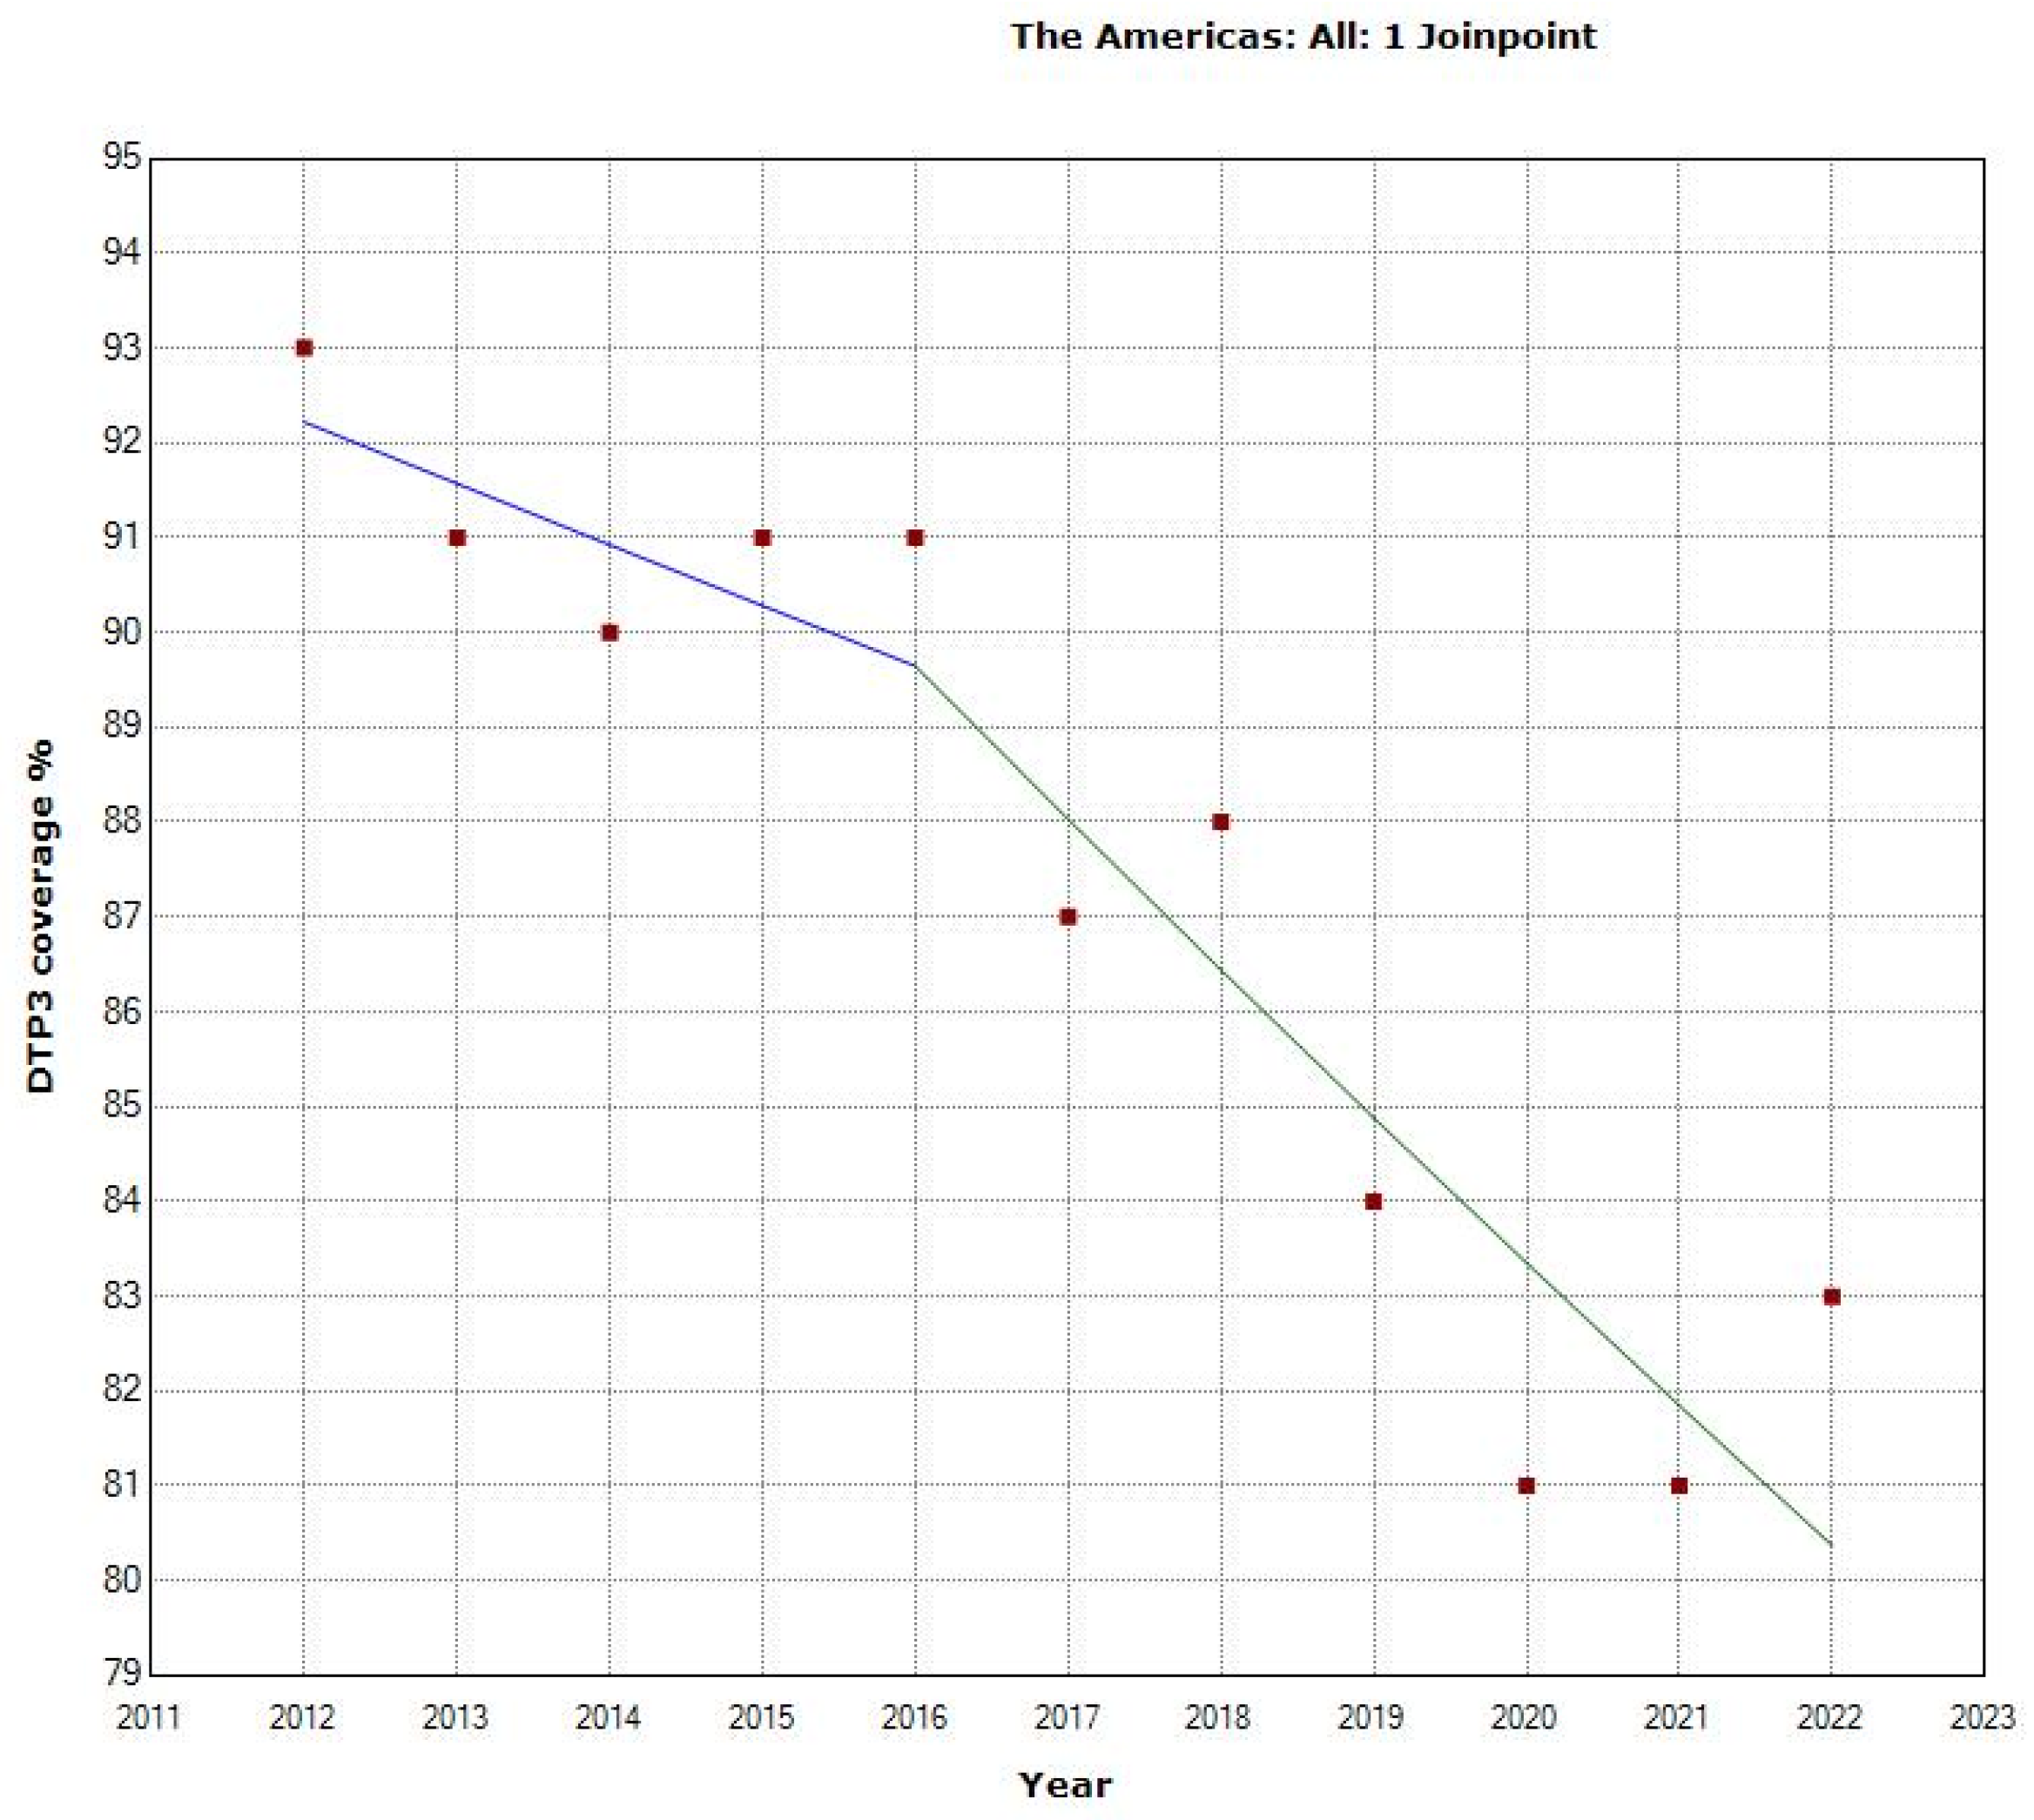
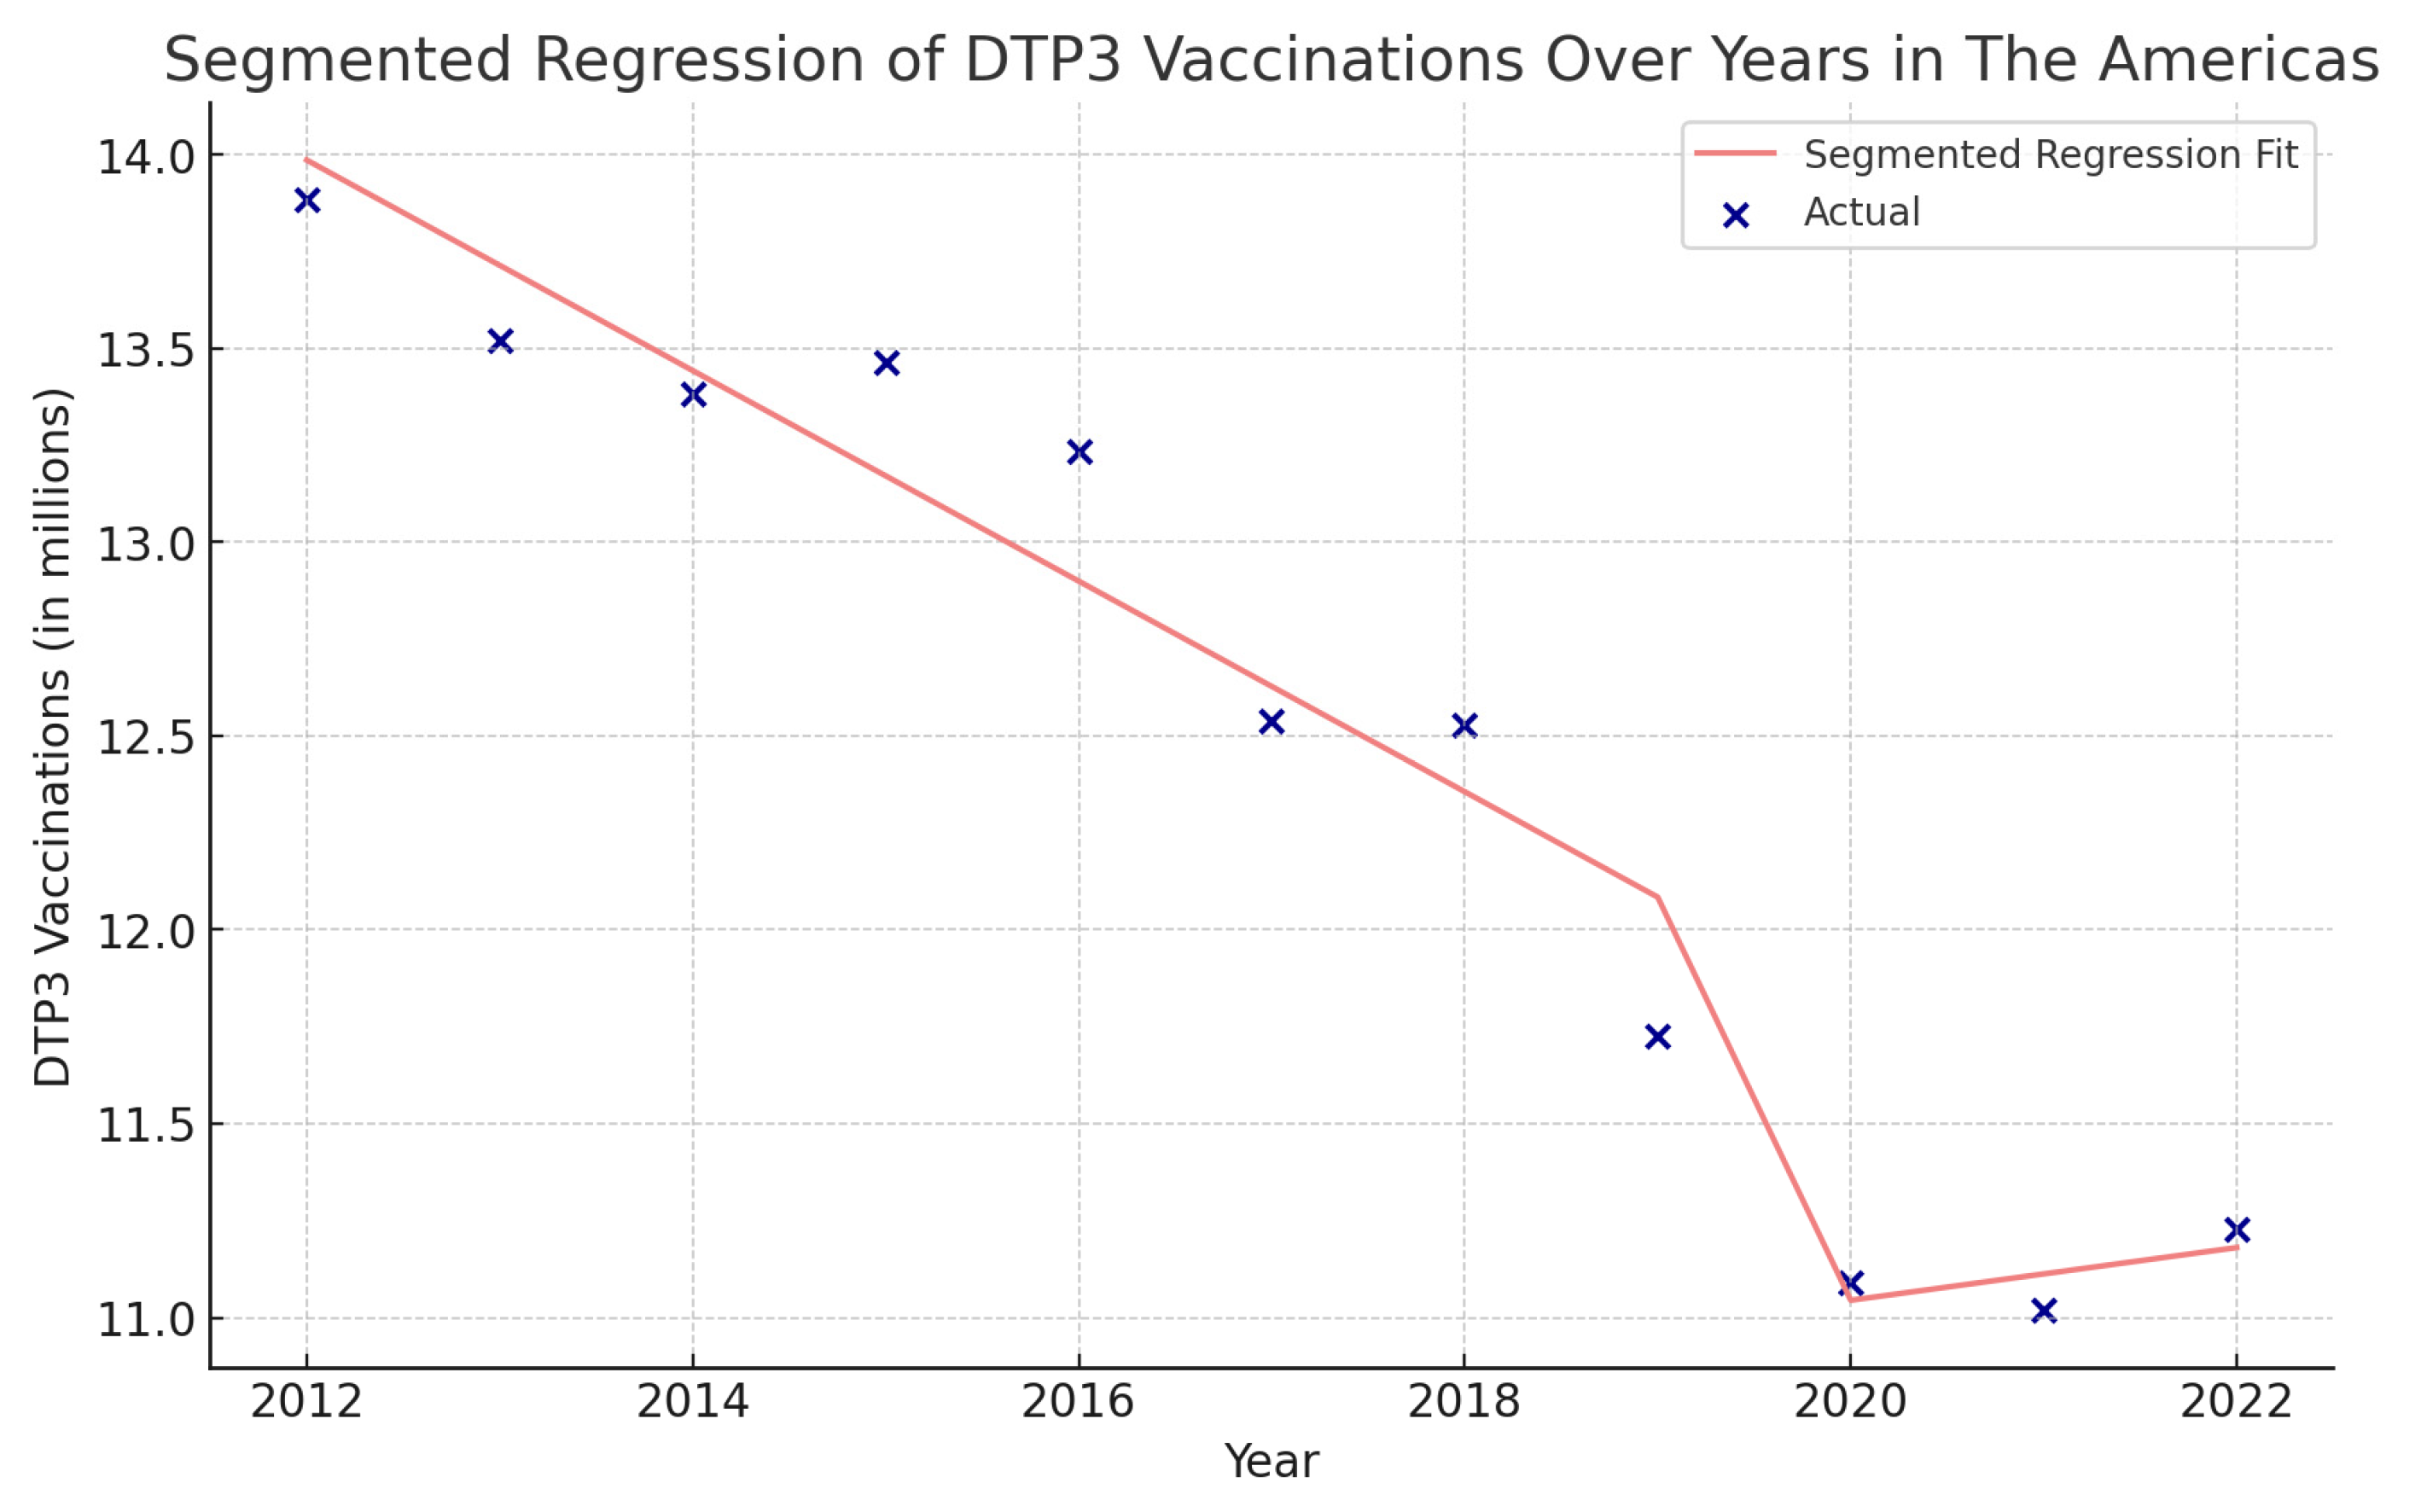
| Periods | Years | APC (95% CI) | p |
|---|---|---|---|
| Total Period | 2012–2021 | −1.4 (−1.8; −1.0) | <0.001 |
| Period 1 | 2012–2016 | −0.7 (−2.9; 1.5) | 0.464 |
| Period 2 | 2016–2022 | −1.8 (−2.9; −0.7) | 0.008 |
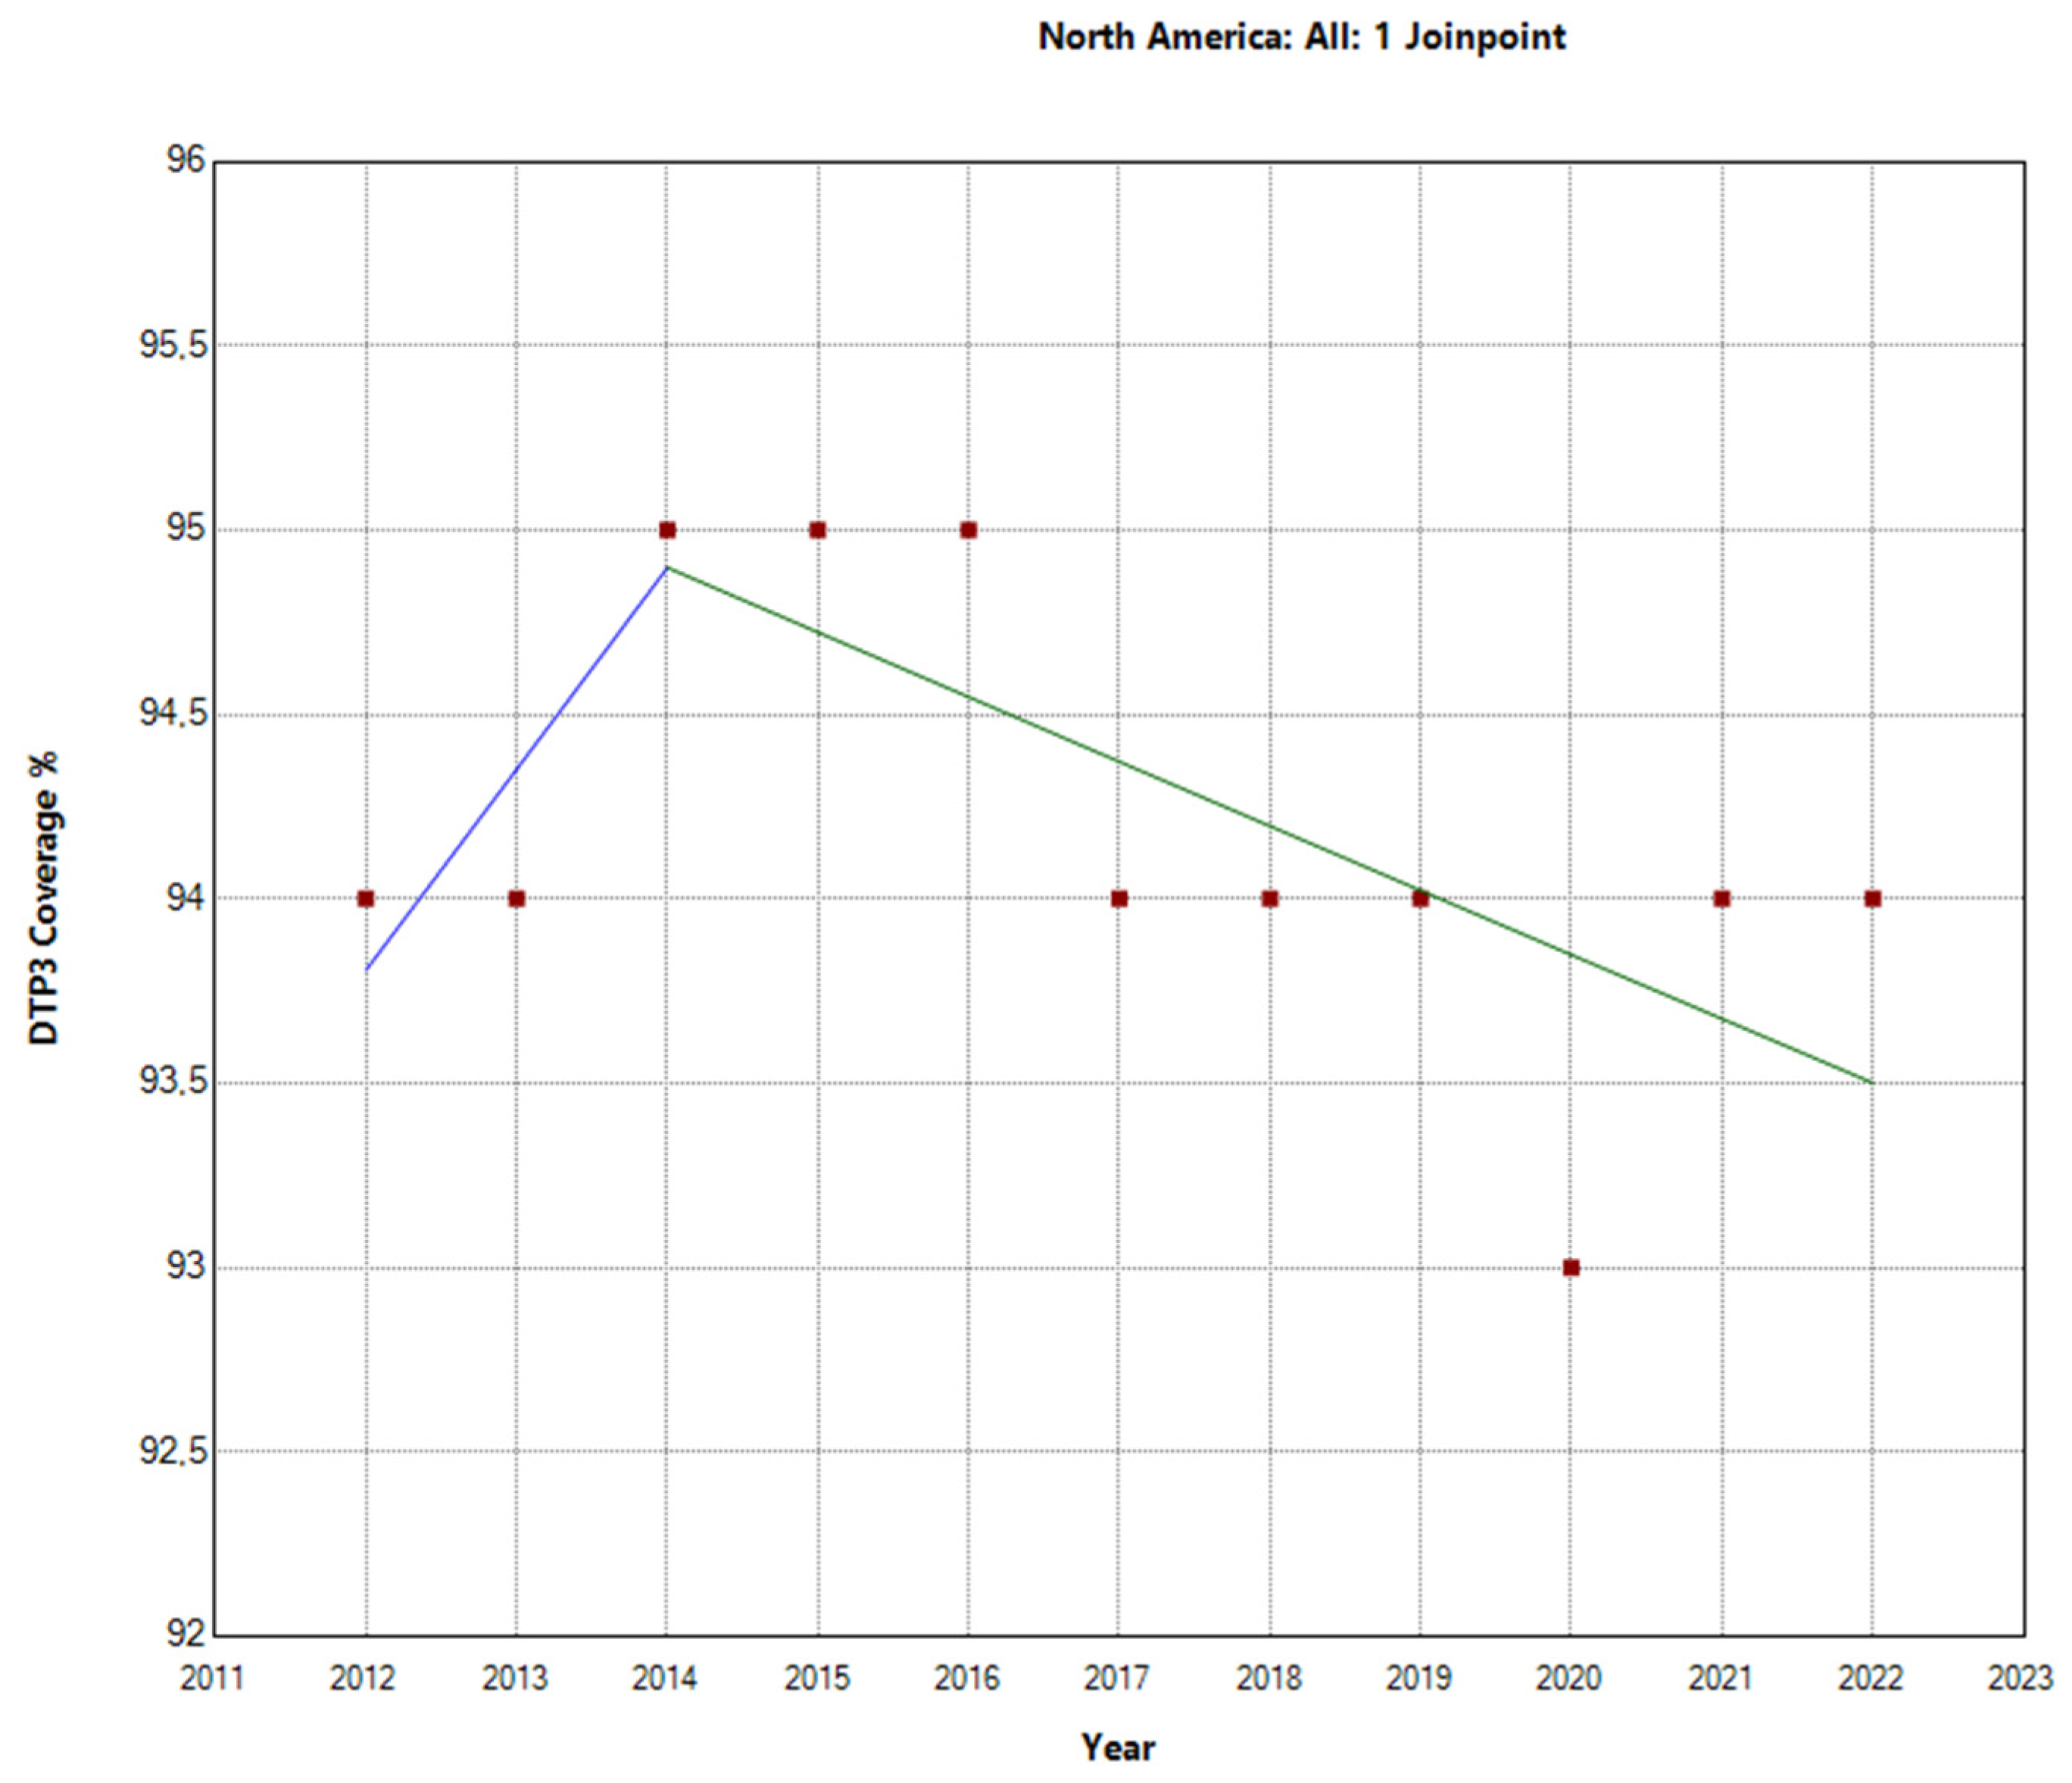
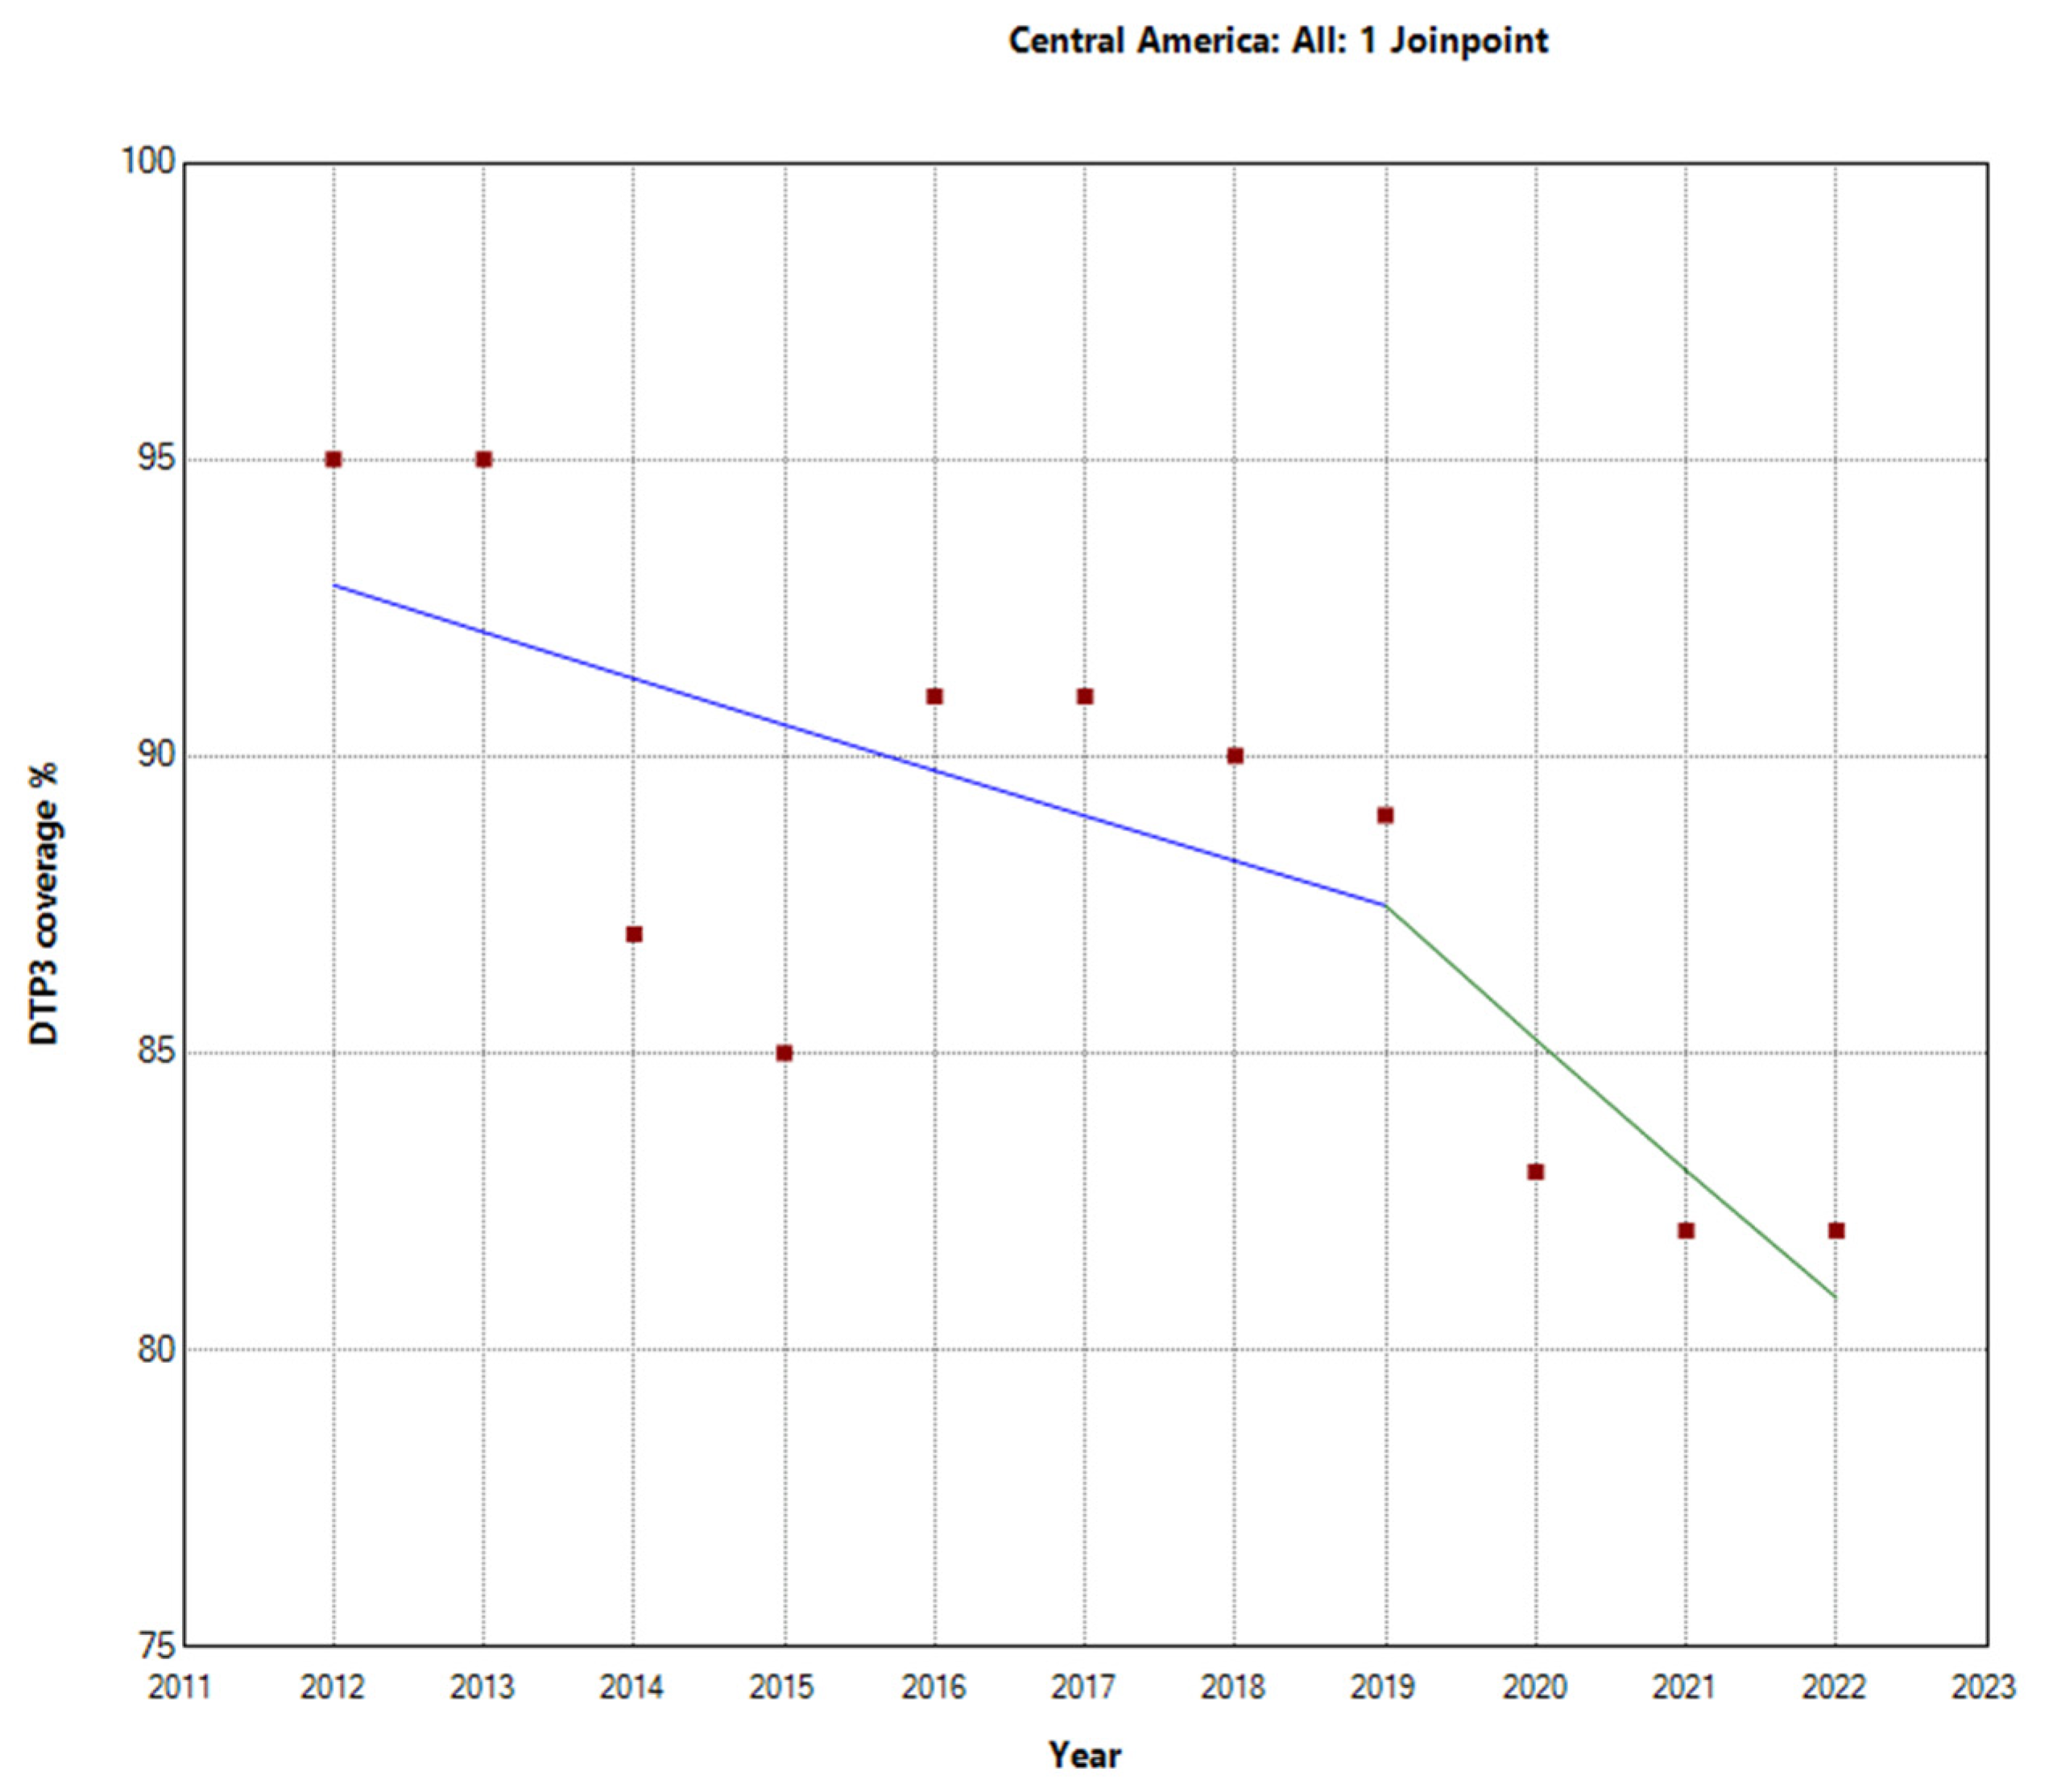
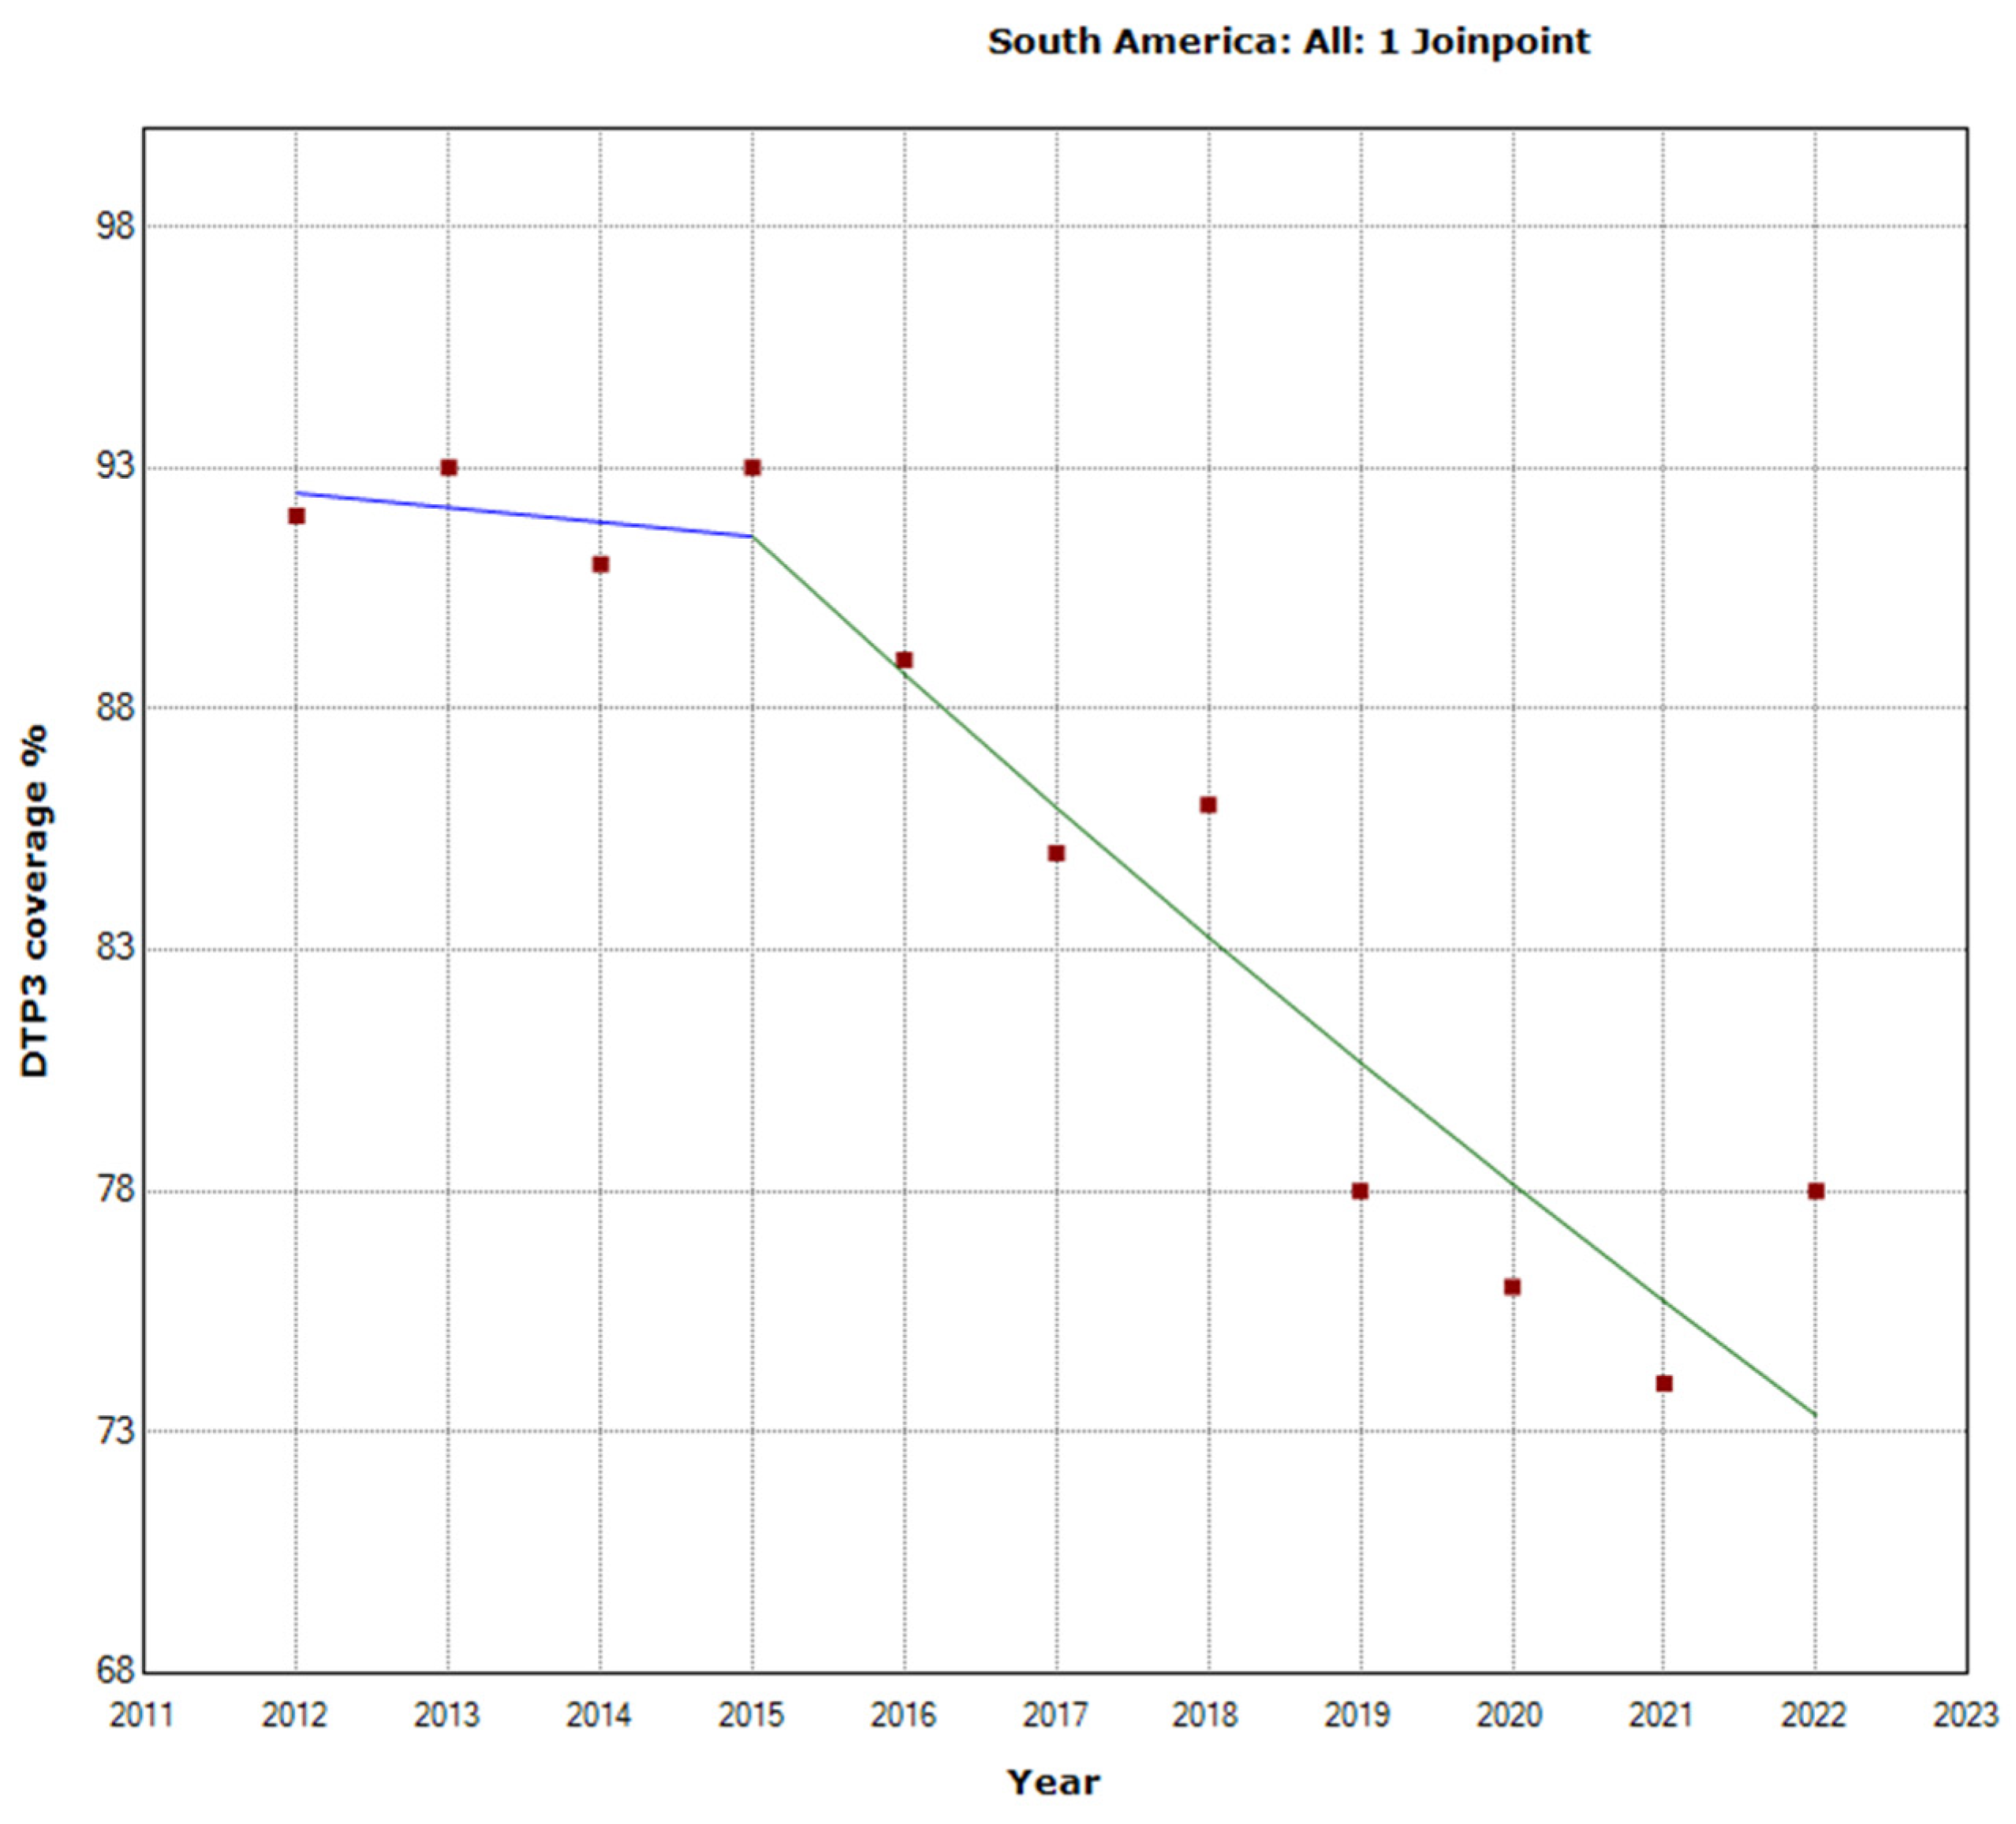
| Periods | Years | APC | 95% LCI | 95% UCI | p |
|---|---|---|---|---|---|
| North America | |||||
| Total Period | 2012–2022 | −0.1 | −0.2 | 0 | 0.136 |
| Period 1 | 2012–2014 | 0.6 | −0.2 | 1.4 | 0.494 |
| Period 2 | 2014–2022 | −0.2 | −0.9 | 0.1 | 0.057 |
| Latin America and the Caribbean | |||||
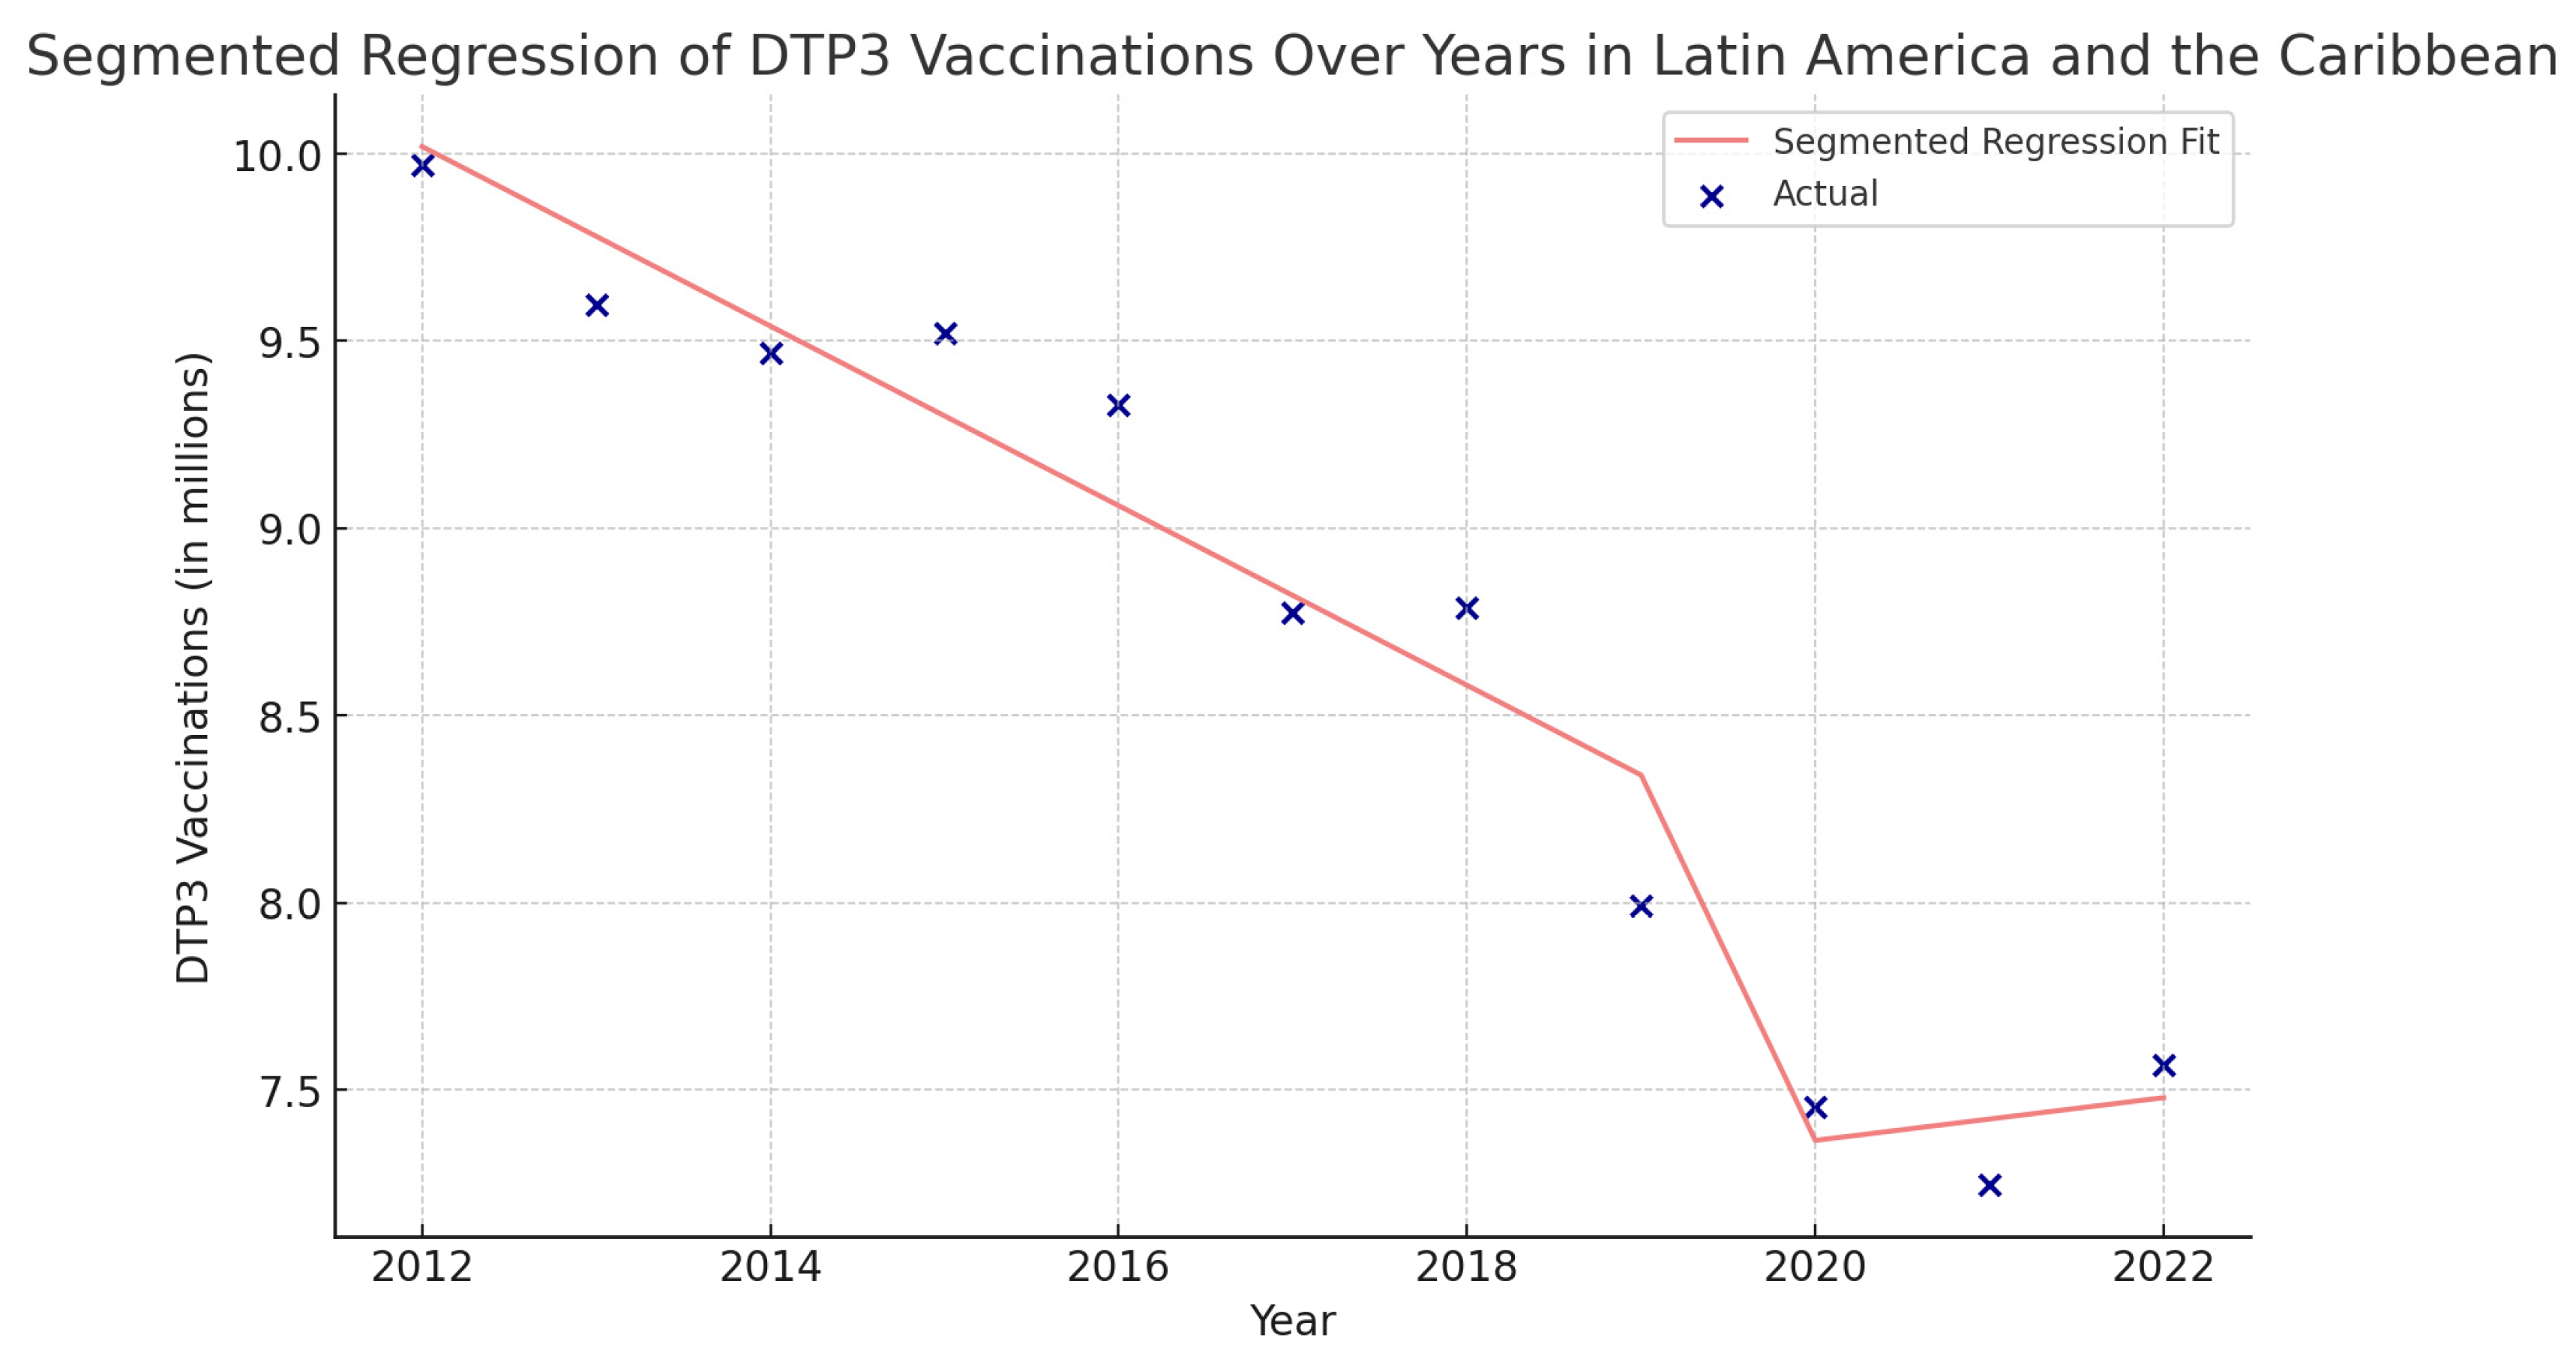
| Total Period | 2012–2022 | −2.1 | −2.7 | −1.5 | <0.001 |
| Period 1 | 2012–2016 | −0.9 | −4.4 | 2.6 | 0.531 |
| Period 2 | 2016–2022 | −2.7 | −4.5 | −0.9 | 0.010 |
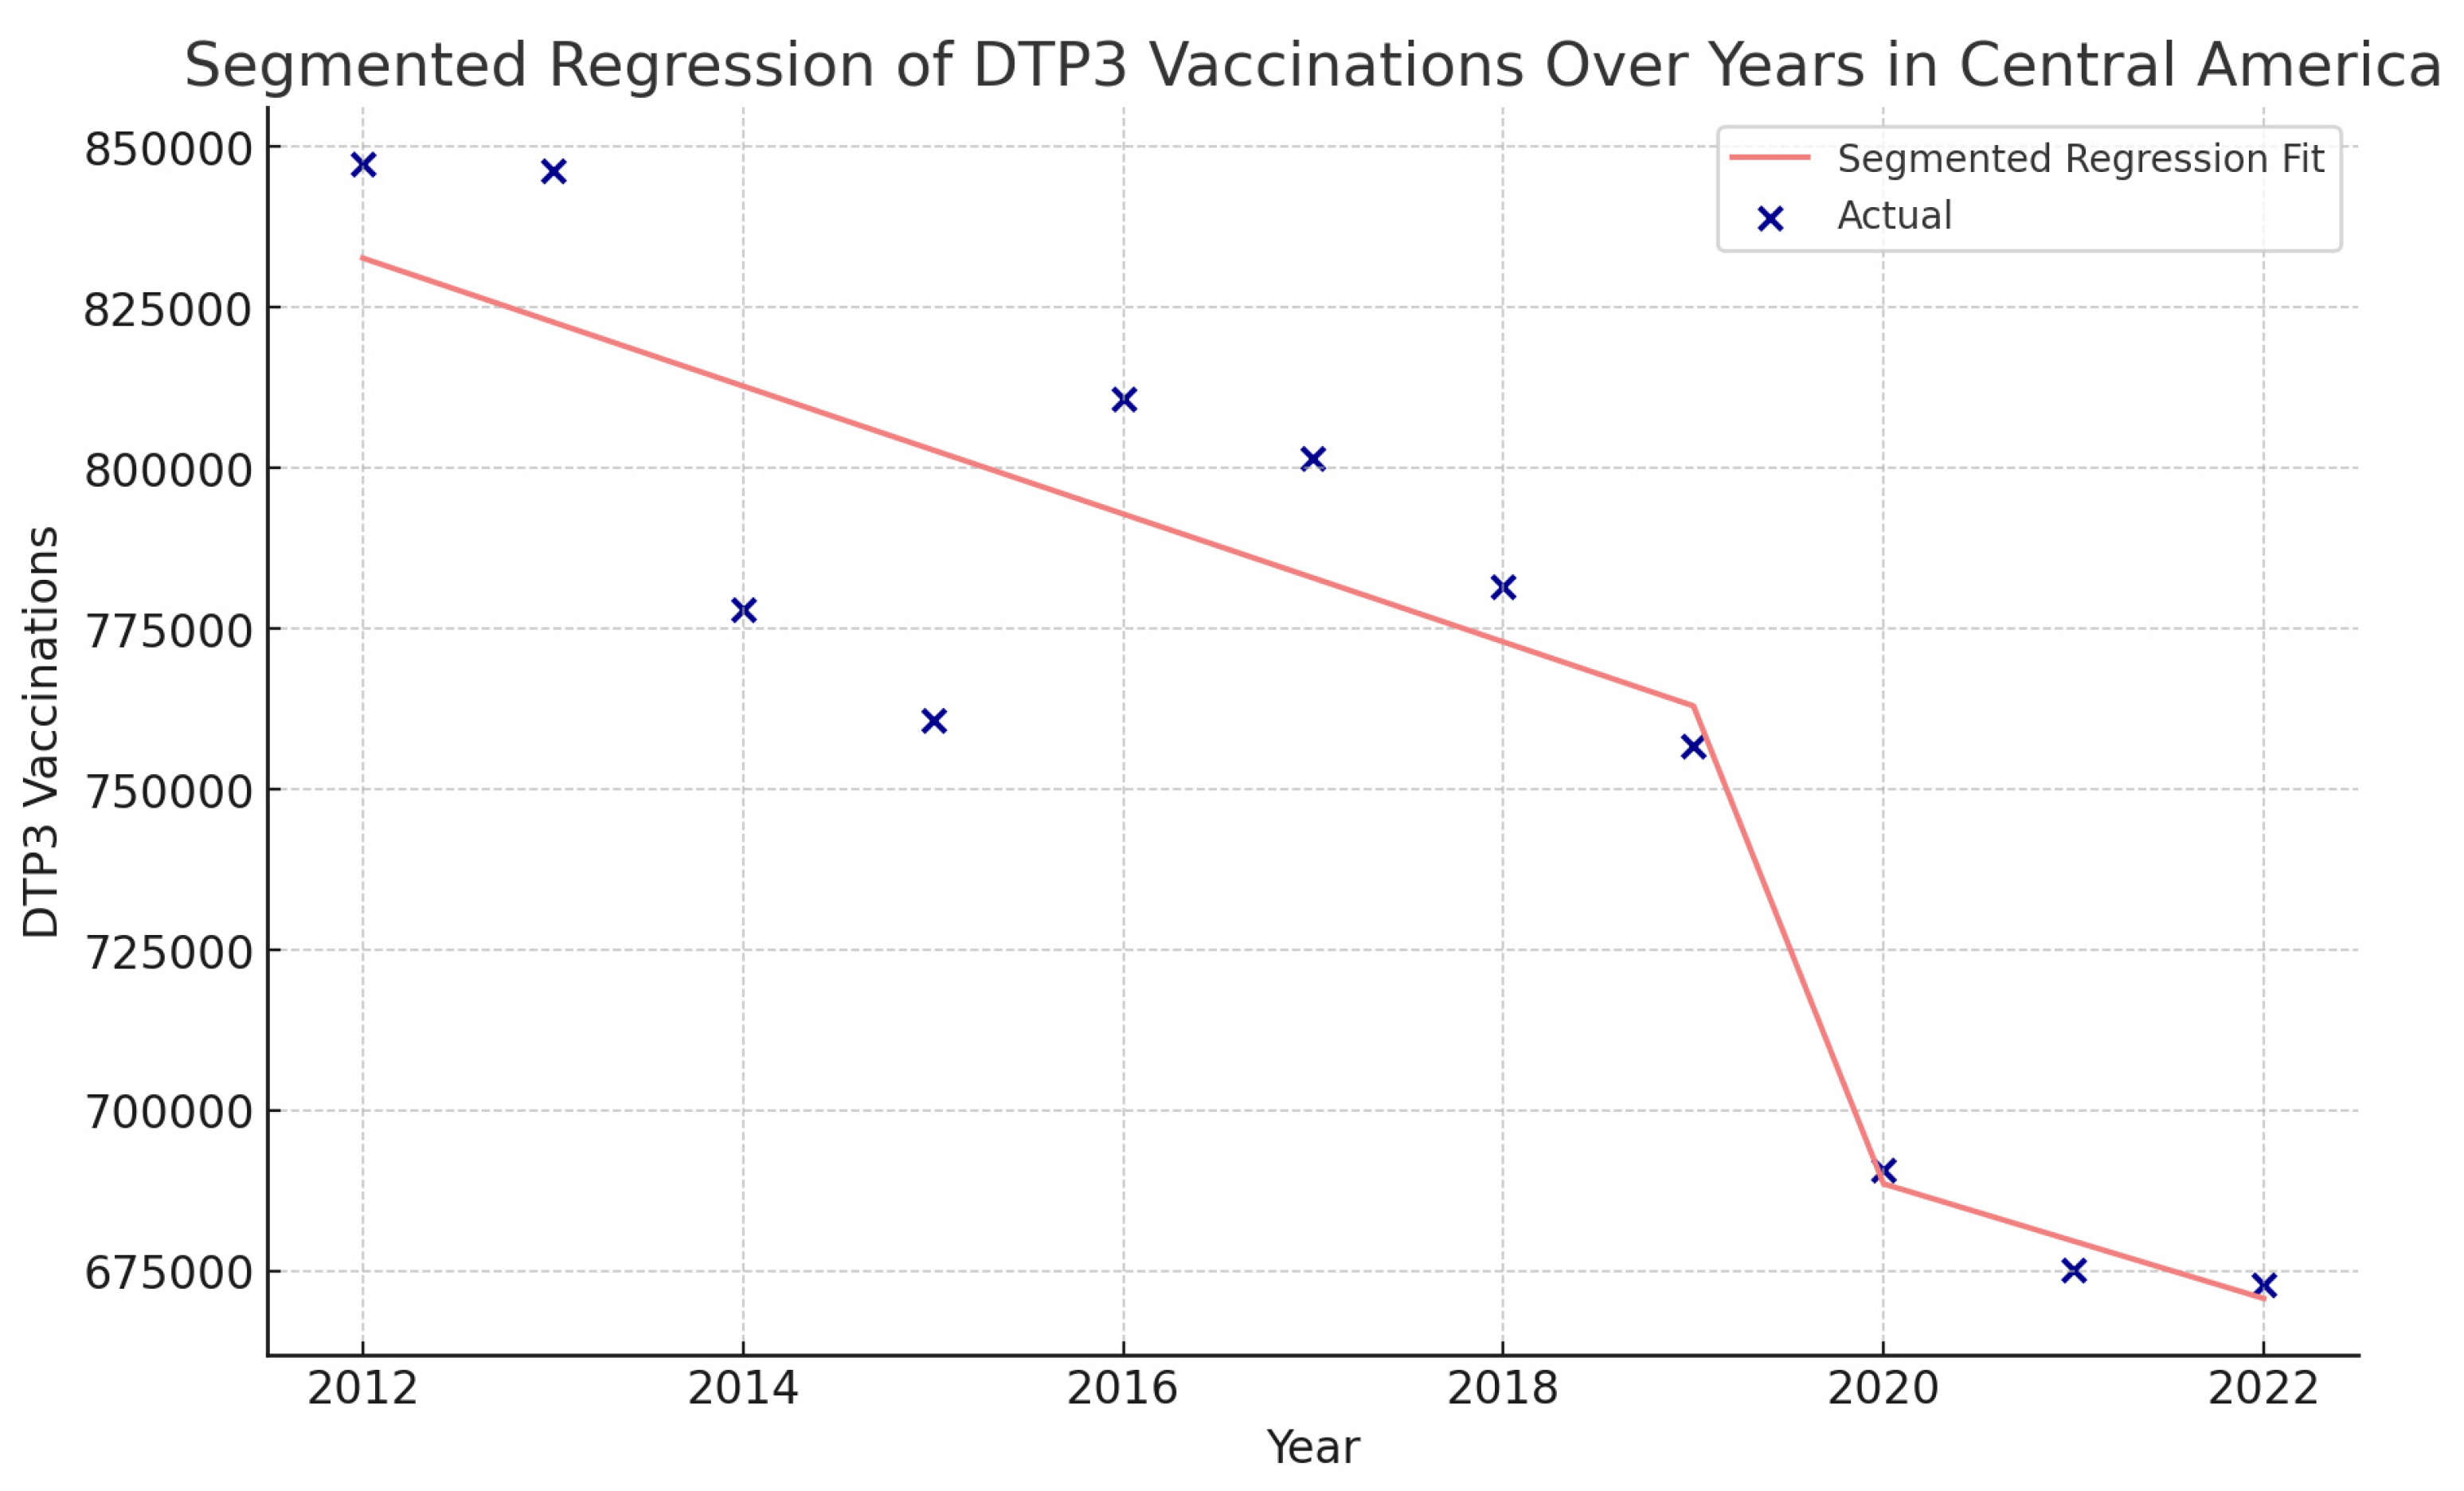
| Central America | |||||
| Total Period | 2012–2022 | −1.3 | −2.1 | −0.4 | 0.009 |
| Period 1 | 2012–2019 | −0.9 | −2.8 | 1.1 | 0.321 |
| Period 2 | 2019–2022 | −2.6 | −8.6 | 3.8 | 0.354 |
| Caribbean | |||||
| Total Period | 2012–2022 | −0.7 | −1.1 | −0.4 | 0.001 |
| Period 1 | 2012–2016 | 0.0 | −1.9 | 2.0 | 0.996 |
| Period 2 | 2016–2022 | −1.1 | −2.1 | −0.1 | 0.031 |
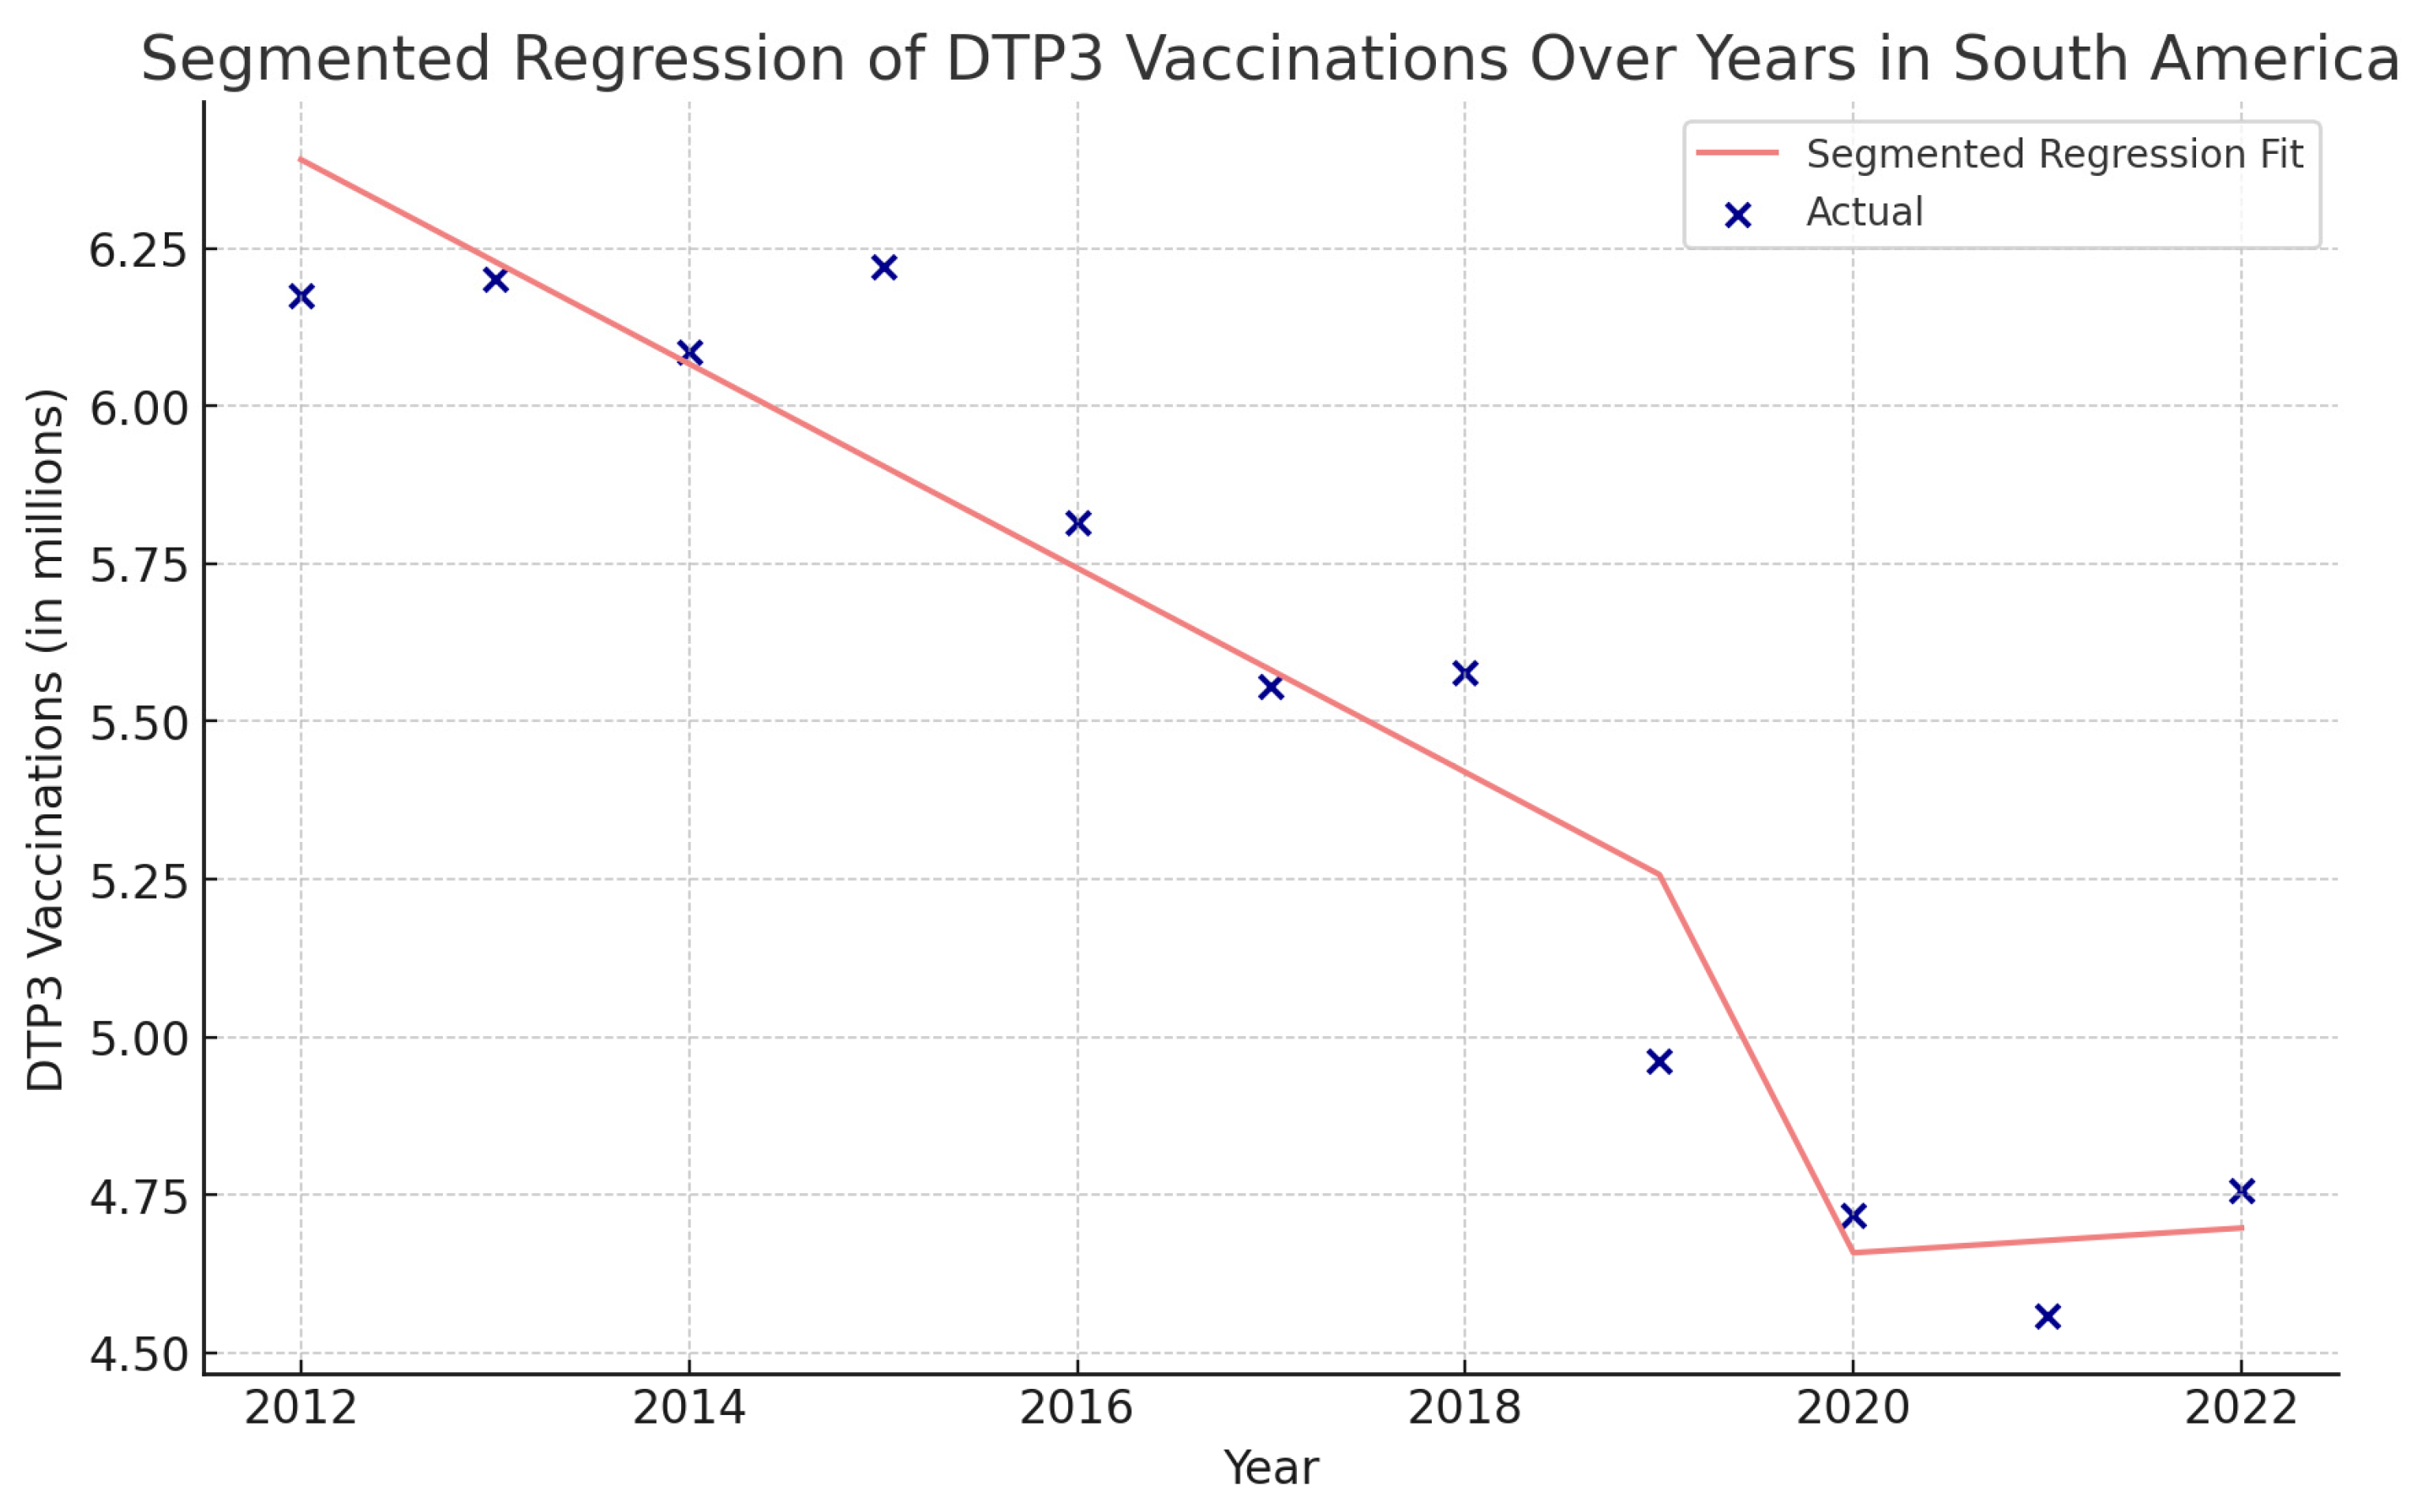
| South America | |||||
| Total Period | 2012–2022 | −2.5 | −3.1 | −1.8 | <0.001 |
| Period 1 | 2012–2015 | −0.3 | −5.9 | 5.6 | 0.895 |
| Period 2 | 2015–2022 | −3.1 | −4.4 | −1.8 | 0.001 |
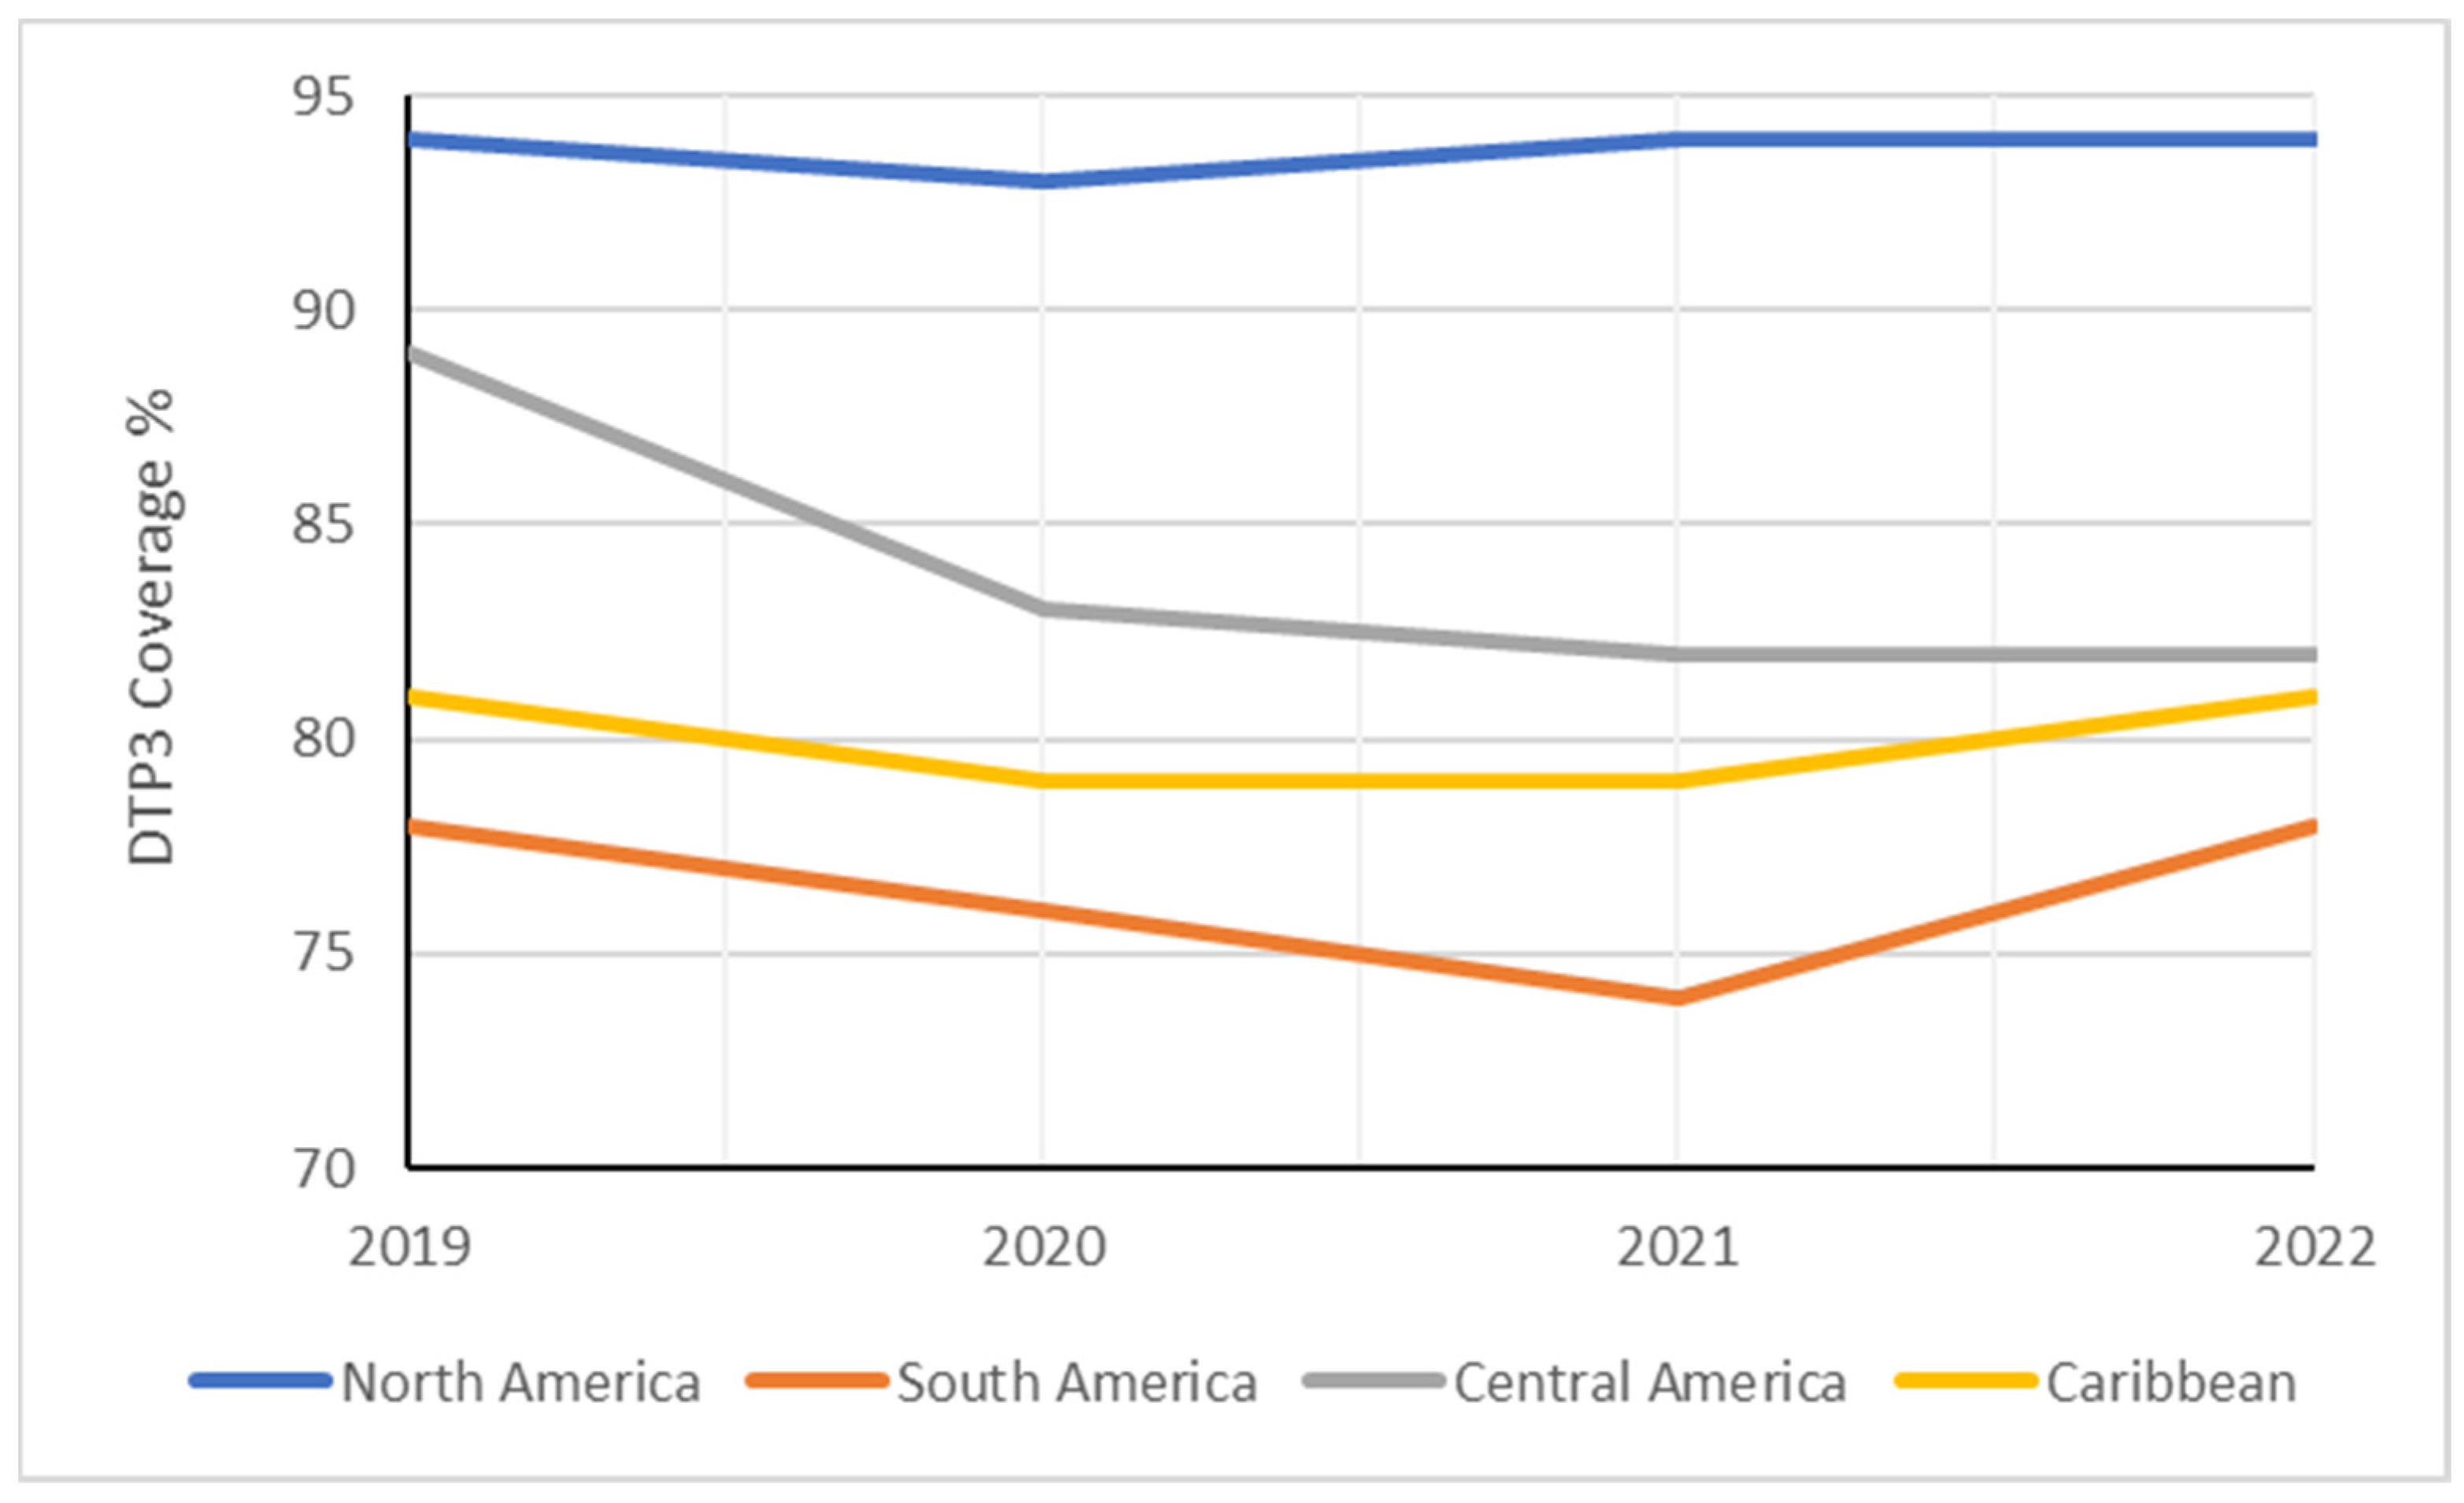
| Region | 2019 | 2020 | 2021 | 2022 | Absolute Changes 2019–2022 | Relative Changes 2019–2022 |
|---|---|---|---|---|---|---|
| Americas | 84 | 81 | 81 | 83 | −1% | −1.19% |
| North America | 94 | 93 | 94 | 94 | 0% | 0.00% |
| Latin America and the Caribbean | 80 | 76 | 75 | 79 | −1% | −1.25% |
| South America | 78 | 76 | 74 | 78 | 0% | 0.00% |
| Central America | 89 | 83 | 82 | 82 | −7% | −7.87% |
| Caribbean | 81 | 79 | 79 | 81 | 0% | 0.00% |
| 2019 | 2022 | ||||
|---|---|---|---|---|---|
| Country | DTP3 (%) | Births (n) | DTP3 (%) | Births (n) | p † |
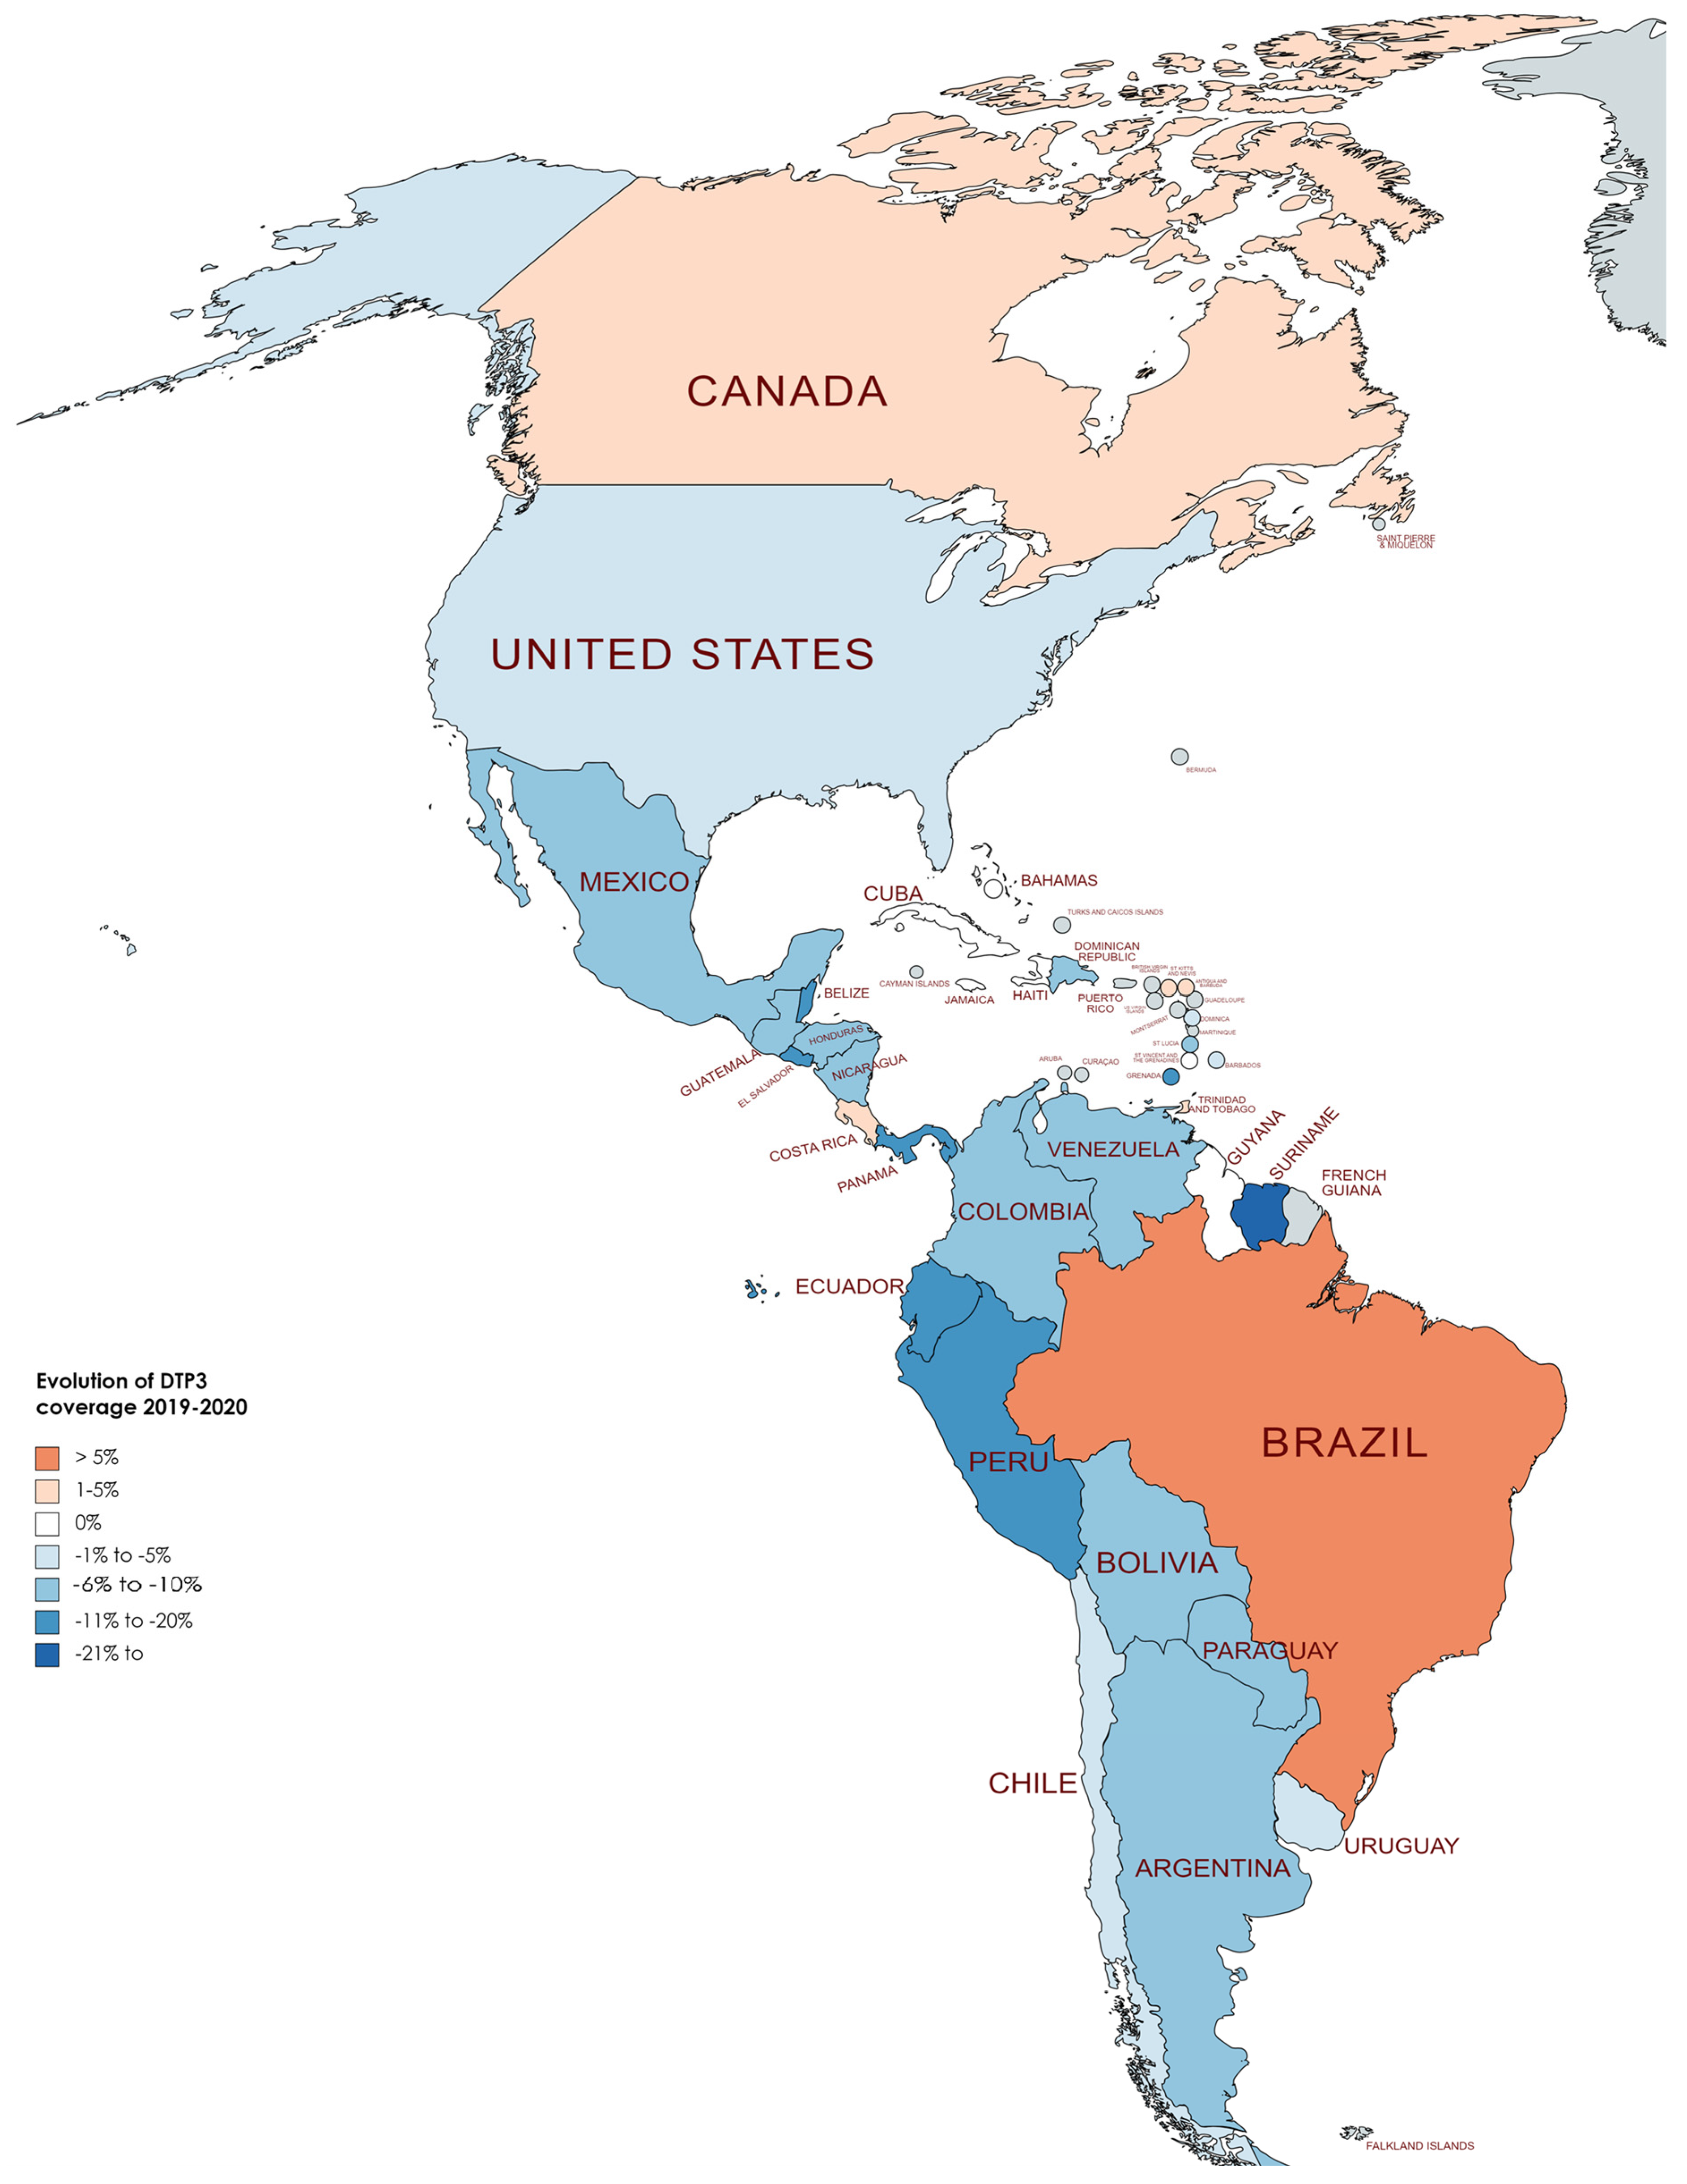
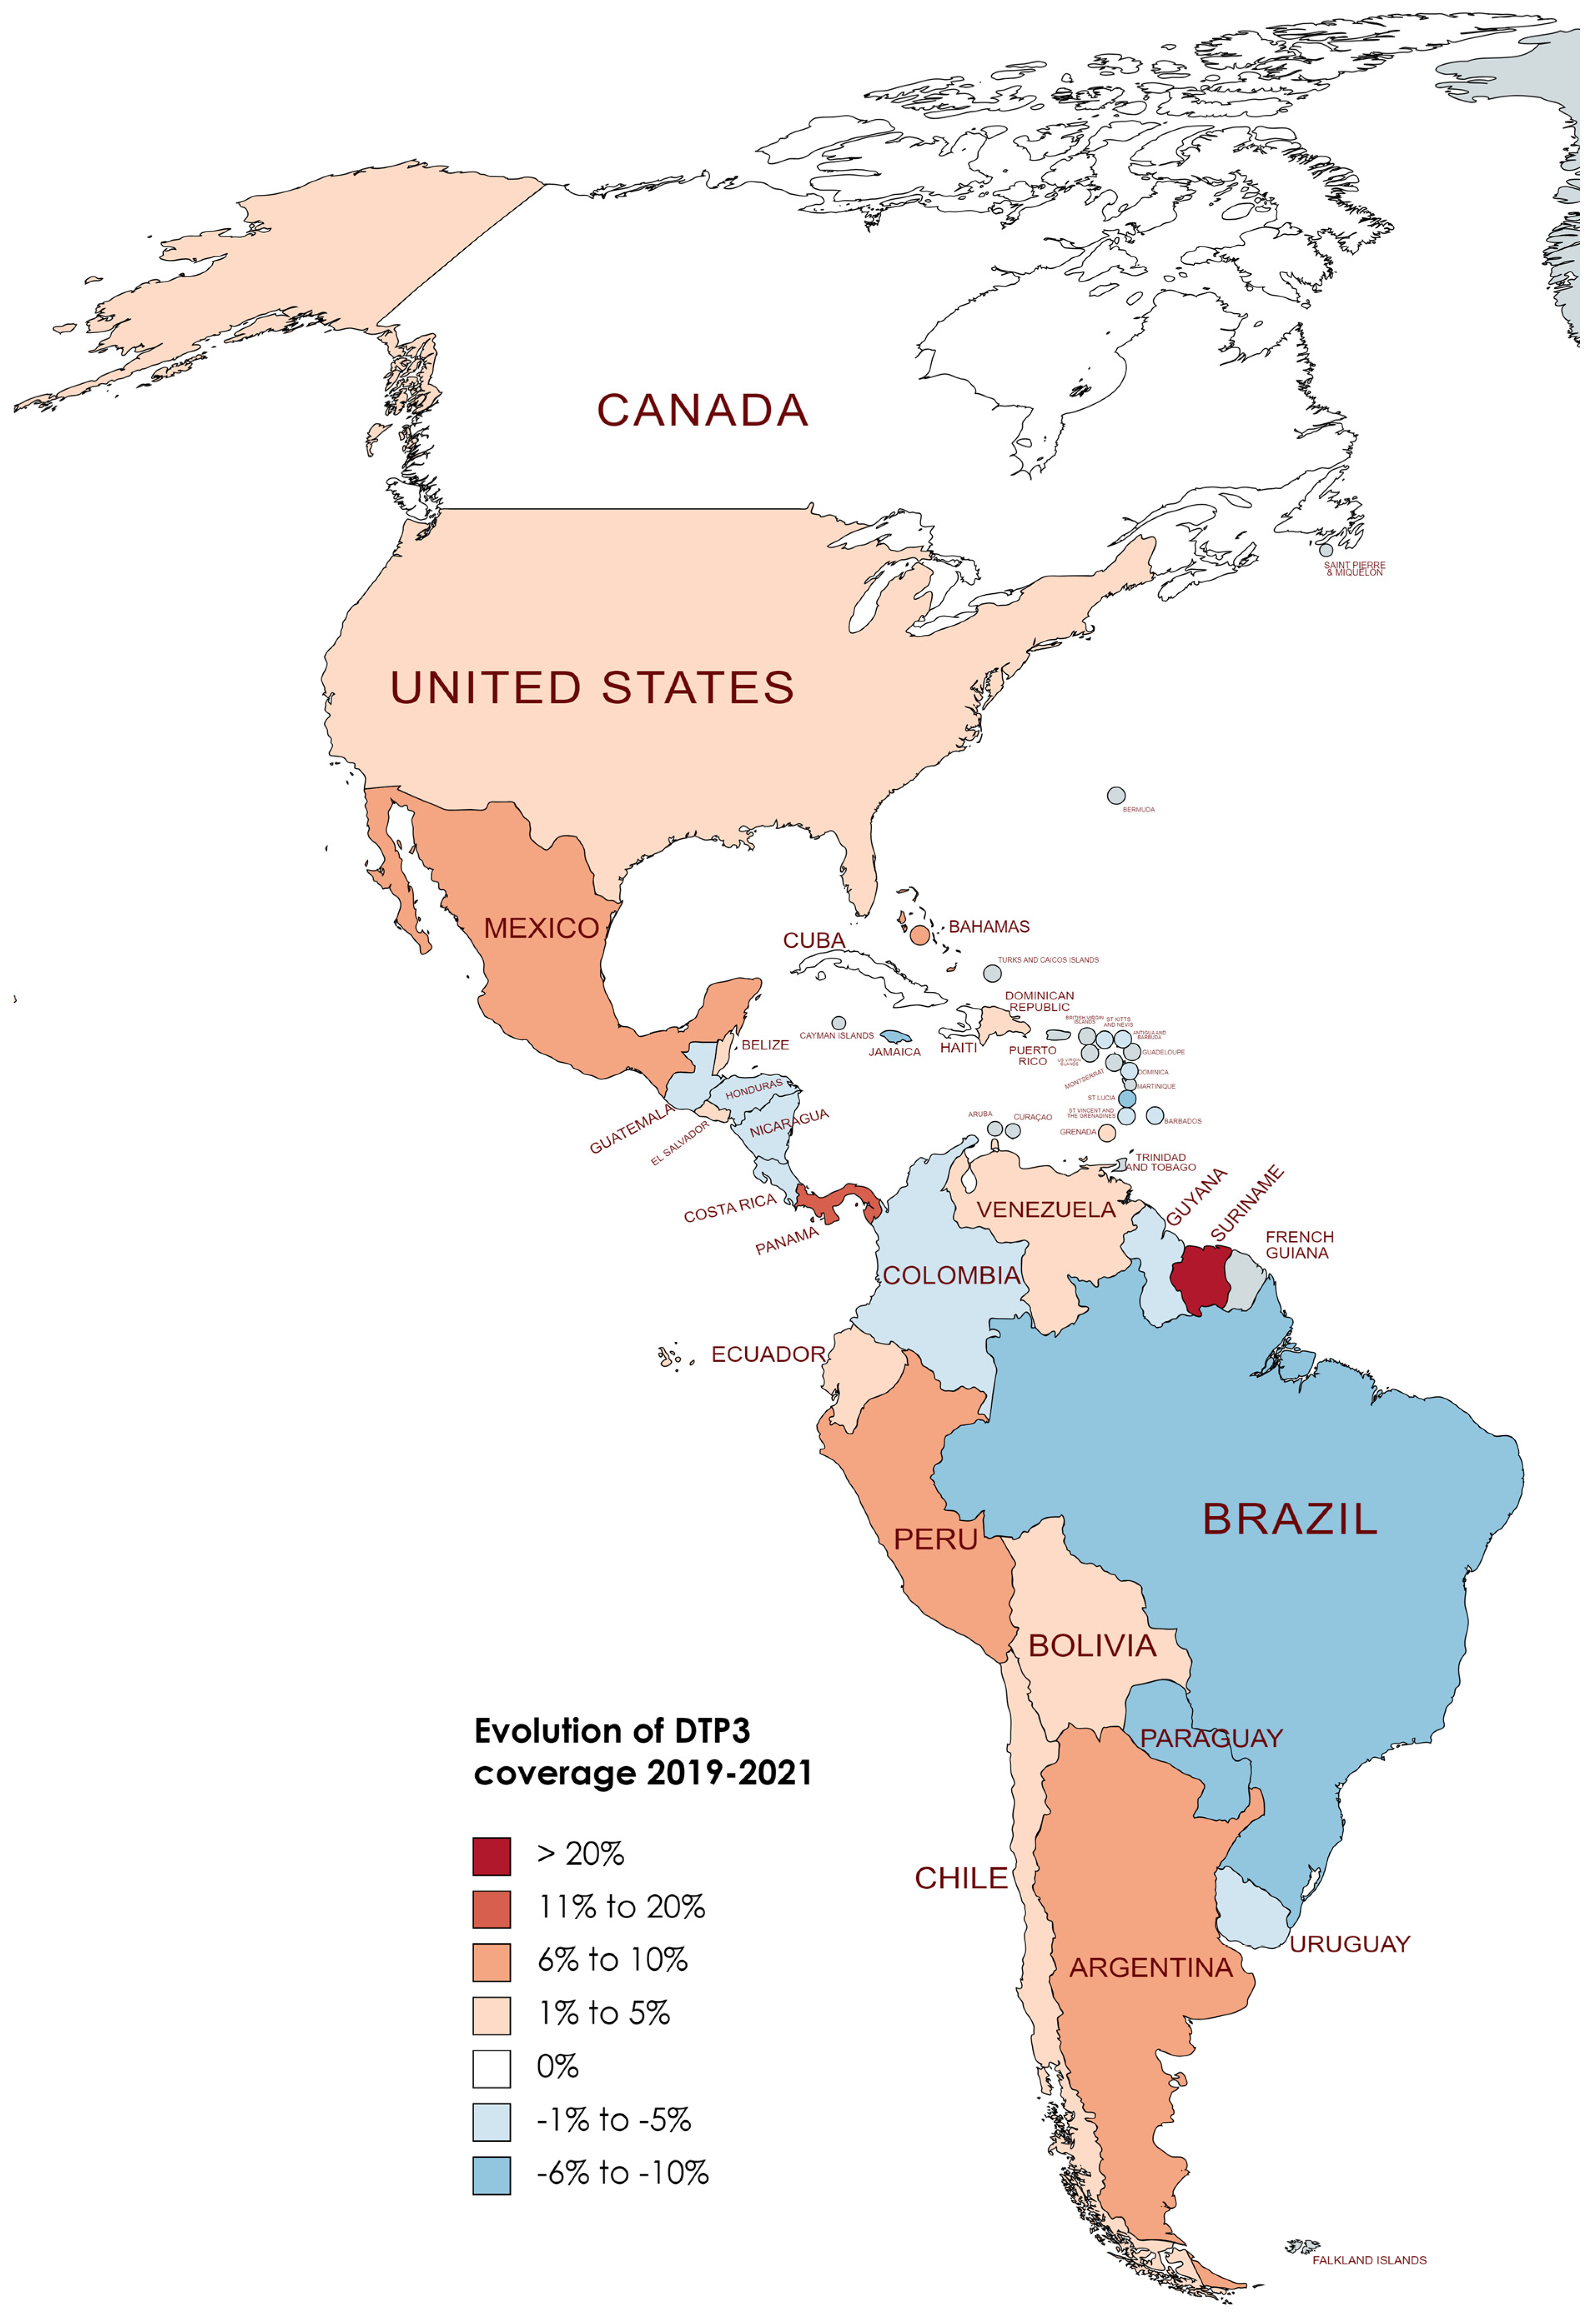
| Antigua and Barbuda | 95 | 1058 | 99 | 1124 | <0.001 |
| Argentina | 83 | 661,385 | 81 | 627,741 | <0.001 |
| Bahamas | 89 | 4641 | 87 | 4659 | ns |
| Barbados | 90 | 3050 | 86 | 3037 | ns |
| Belize | 98 | 7333 | 84 | 7193 | 0.003 |
| Bolivia | 75 | 263,006 | 69 | 264,070 | <0.001 |
| Brazil | 70 | 2,886,359 | 77 | 2,723,266 | <0.001 |
| Canada | 91 | 363,393 | 92 | 376,188 | ns |
| Chile | 96 | 224,350 | 96 | 230,824 | ns |
| Colombia | 94 | 733,940 | 87 | 723,264 | <0.001 |
| Costa Rica | 95 | 65,282 | 95 | 60,517 | ns |
| Cuba | 99 | 110,404 | 99 | 99,693 | ns |
| Dominica | 99 | 946 | 92 | 966 | ns |
| Dominican Republic | 89 | 210,196 | 88 | 203,625 | ns |
| Ecuador | 85 | 300,075 | 70 | 298,666 | <0.001 |
| El Salvador | 90 | 103,547 | 75 | 100,313 | <0.001 |
| Grenada | 94 | 2041 | 77 | 1960 | 0.054 |
| Guatemala | 85 | 391,582 | 79 | 372,335 | <0.001 |
| Guyana | 99 | 16,898 | 98 | 16,129 | ns |
| Haiti | 51 | 271,669 | 51 | 268,523 | ns |
| Honduras | 88 | 215,469 | 78 | 217,590 | <0.001 |
| Jamaica | 96 | 33,815 | 98 | 32,663 | ns |
| Mexico | 82 | 1,965,139 | 83 | 1,866,399 | <0.001 |
| Nicaragua | 98 | 142,181 | 92 | 139,164 | <0.001 |
| Panama | 88 | 77,044 | 87 | 76,637 | ns |
| Paraguay | 86 | 139,138 | 69 | 137,960 | <0.001 |
| Peru | 88 | 591,025 | 82 | 592,156 | <0.001 |
| Saint Kitts and Nevis | 97 | 607 | 96 | 563 | ns |
| Saint Lucia | 92 | 2113 | 81 | 2035 | ns |
| Saint Vincent and the Grenadines | 97 | 1405 | 92 | 1324 | ns |
| Suriname | 77 | 11,049 | 77 | 11,123 | ns |
| Trinidad and Tobago | 93 | 18,904 | 93 | 17,429 | ns |
| Uruguay | 94 | 3,756,830 | 94 | 3,726,867 | ns |
| United States | 94 | 37,107 | 94 | 35,668 | ns |
| Venezuela | 64 | 497,361 | 56 | 438,384 | <0.001 |
| Country | Years | APC | 95% LCI | 95% UCI | p |
|---|---|---|---|---|---|
| Antigua and Barbuda | |||||
| Total Period | 2012–2022 | −0.4 | −0.9 | 0 | 0.04 |
| Period 1 | 2012–2017 | −1.2 | −2.7 | 0.4 | 0.118 |
| Period 2 | 2017–2022 | 0.3 | −1.3 | 1.9 | 0.677 |
| Bahamas | |||||
| Total Period | 2012–2022 | −1.5 | −2 | −0.9 | <0.001 |
| Period 1 | 2012–2020 | −1.8 | −2.2 | −1.4 | <0.001 |
| Period 2 | 2020–2022 | 0.6 | −2.7 | 3.9 | 0.697 |
| Belize | |||||
| Total Period | 2012–2022 | −1.6 | −2.6 | −0.6 | 0.005 |
| Period 1 | 2012–2019 | −0.8 | −1.7 | 0.2 | 0.09 |
| Period 2 | 2019–2022 | −4.4 | −8.3 | −0.3 | 0.04 |
| Canada | |||||
| Total Period | 2012–2022 | 0.1 | 0.1 | 0.2 | 0.003 |
| Period 1 | 2012–2018 | 0 | −0.1 | 0.1 | 0.931 |
| Period 2 | 2018–2022 | 0.3 | 0.1 | 0.6 | 0.008 |
| Colombia | |||||
| Total Period | 2012–2022 | −0.4 | −0.9 | 0.1 | 0.102 |
| Period 1 | 2012–2019 | 0.3 | 0 | 0.6 | 0.071 |
| Period 2 | 2019–2022 | −2.6 | −3.8 | −1.4 | 0.002 |
| Costa Rica | |||||
| Total Period | 2012–2022 | −0.4 | −0.9 | 0.1 | 0.102 |
| Period 1 | 2012–2017 | 0.8 | −0.6 | 2.3 | 0.198 |
| Period 2 | 2017–2022 | −0.2 | −1.6 | 1.2 | 0.702 |
| Dominica | |||||
| Total Period | 2012–2022 | −0.4 | −1 | 0.1 | 0.101 |
| Period 1 | 2012–2020 | −0.2 | −1.3 | 0.9 | 0.677 |
| Period 2 | 2020–2022 | −2.2 | −12.5 | 9.3 | 0.635 |
| Ecuador | |||||
| Total Period | 2012–2022 | −1.9 | −3.2 | −0.7 | 0.007 |
| Period 1 | 2012–2018 | −0.3 | −3.2 | 2.8 | 0.843 |
| Period 2 | 2018–2022 | −4.8 | −10.1 | 0.8 | 0.078 |
| Grenada | |||||
| Total Period | 2012–2022 | −2.7 | −4.1 | −1.3 | 0.002 |
| Period 1 | 2012–2018 | −0.5 | −3.5 | 2.6 | 0.71 |
| Period 2 | 2018–2022 | −6.5 | −12.1 | −0.6 | 0.036 |
| Haiti | |||||
| Total Period | 2012–2022 | −3.0 | −4.3 | −1.7 | 0.001 |
| Period 1 | 2012–2017 | −0.8 | −5.2 | 3.7 | 0.663 |
| Period 2 | 2017–2022 | −5.1 | −9.3 | −0.7 | 0.029 |
| Jamaica | |||||
| Total Period | 2012–2022 | 0.2 | −0.3 | 0.7 | 0.476 |
| Period 1 | 2012–2018 | 0.4 | −0.8 | 1.6 | 0.427 |
| Period 2 | 2018–2022 | −0.7 | −6 | 4.8 | 0.756 |
| Mexico | |||||
| Total Period | 2012–2022 | −1.7 | −3.1 | −0.2 | 0.027 |
| Period 1 | 2012–2020 | −2.3 | −4.5 | 0 | 0.048 |
| Period 2 | 2020–2022 | 2.4 | −16.3 | 25.2 | 0.783 |
| Nicaragua | |||||
| Total Period | 2012–2022 | −0.9 | −1.5 | −0.4 | 0.006 |
| Period 1 | 2012–2018 | 0.1 | −1 | 1.2 | 0.875 |
| Period 2 | 2018–2022 | −2.7 | −4.9 | −0.6 | 0.022 |
| Paraguay | |||||
| Total Period | 2012–2022 | −2.8 | −4.1 | −1.5 | 0.001 |
| Period 1 | 2012–2018 | −0.3 | −1.1 | 0.6 | 0.506 |
| Period 2 | 2018–2022 | −7.2 | −8.8 | −5.6 | <0.001 |
| Peru | |||||
| Total Period | 2012–2022 | −1.5 | −2.6 | −0.4 | 0.012 |
| Period 1 | 2012–2017 | −0.8 | −5.4 | 4.1 | 0.709 |
| Period 2 | 2017–2022 | −2.3 | −6.8 | 2.5 | 0.284 |
| Saint Kitts and Nevis | |||||
| Total Period | 2012–2022 | 0 | −0.3 | 0.2 | 0.87 |
| Period 1 | 2012–2020 | 0.1 | −0.3 | 0.6 | 0.489 |
| Period 2 | 2020–2022 | −1.2 | −7.1 | 5.2 | 0.661 |
| Saint Lucia | |||||
| Total Period | 2012–2022 | −2.2 | −3.2 | −1.1 | 0.001 |
| Period 1 | 2012–2019 | −1.7 | −4.1 | 0.8 | 0.141 |
| Period 2 | 2019–2022 | −3.8 | −13.2 | 6.7 | 0.4 |
| Saint Vincent and the Grenadines | |||||
| Total Period | 2012–2022 | −0.5 | −0.9 | 0 | 0.045 |
| Period 1 | 2012–2017 | 0.6 | −0.2 | 1.5 | 0.105 |
| Period 2 | 2017–2022 | −1.6 | −2.4 | −0.8 | 0.003 |
| Suriname | |||||
| Total Period | 2012–2022 | −1 | −3.3 | 1.4 | 0.361 |
| Period 1 | 2012–2020 | −2.1 | −4 | −0.2 | 0.038 |
| Period 2 | 2020–2022 | 7.3 | −14 | 33.9 | 0.466 |
| Uruguay | 2012–2022 | −0.3 | −0.6 | −0.1 | 0.016 |
| Period 1 | 2012–2020 | −0.4 | −0.9 | 0 | 0.049 |
| Period 2 | 2020–2022 | 0.5 | −4.5 | 5.8 | 0.817 |
| Region | Intercept | Year | COVID-19 | Interaction |
|---|---|---|---|---|
| The Americas | 14,257,167 | −271,700 *** | −3,824,000 † | 339,600 † |
| North America | 6,419,470 | −77,900 *** | −960,900 | 92,490 |
| Latin America and the Caribbean | 10,258,998 | −239,700 | −3,408,000 † | 296,800 |
| Central America | 842,631 | −9958 * | −73,740 | 1035 |
| The Caribbean | 595,044 | −5629 * | −94,750 | 6845 |
| South America | 6,552,726 | −161,900 ** | −2,071,000 | 181,600 |
| Nation | Intercept | Year | COVID-19 | Interaction |
|---|---|---|---|---|
| Antigua and Barbuda | 1166 | −25 * | −242 | 41 |
| Argentina | 747,939 | −21,550 * | −440,868 | 40,473 |
| Bahamas | 5272 | −147 * | −2177 | 235 |
| Barbados | 2906 | −8 | −444 | 19 |
| Belize | 73,689 | −7 | −3833 * | 240 |
| Bolivia | 246,668 | −4856 † | −80,433 | 6430 |
| Brazil | 3,086,377 | −101,299 * | −799,678 | 76,649 |
| Canada | 346,374 | −1670 | −28,913 | 4283 * |
| Chile | 223,231 | −1354 | −54,775 | 6213 |
| Colombia | 671,882 | 277 | 43,507 | −8393 |
| Costa Rica | 68,482 | −580 † | 4127 | −856 |
| Cuba | 128,843 | −2206 * | 1376 | −726 |
| Dominica | 889 | 1 | 160 | −16 |
| Dominican Republic | 183,881 | 170 | −58,735 | 4679 |
| Ecuador | 273,474 | −3456 | −59,827 | 3220 |
| El Salvador | 116,148 | −2777 * | −27,167 | 1609 |
| Grenada | 2040 | −12 † | −838 * | 42 |
| Guatemala | 366,586 | −4476 | 36,154 | −5709 |
| Guyana | 15,500 | 49 | 2205 | −220 |
| Haiti | 183,283 | −3133 | −39,333 | 2490 |
| Honduras | 215,078 | −3019 | −29,014 | 1396 |
| Jamaica | 39,982 | −942 * | −8835 | 955 |
| Mexico | 2,170,515 | −63,127 * | −1,379,021 † | 131,627 |
| Nicaragua | 140,894 | −108 | −4172 | −885 |
| Panama | 62,938 | 493 | −48,279 | 4392 |
| Paraguay | 123,679 | 129 | 48,857 | −7328 |
| Peru | 546,498 | −5221 | −372,338 * | 34,451 * |
| Saint Kitts and Nevis | 672 | −10 * | 123 | −14 |
| Saint Lucia | 2207 | −38 † | 242 | −37 |
| Saint Vincent and the Grenadines | 1843 | −57 * | −25 | 1 |
| Suriname | 8105 | 31 | −15,211 * | 1421 * |
| Trinidad and Tobago | 19,470 | −221 * | 3238 | −372 |
| United States | 3,884,049 | −44,760 * | −1,093,444 † | 107,962 † |
| Uruguay | 49,522 | −1632 * | −21,125 | 2086 |
| Venezuela | 549,286 | −26,220 | −268,317 | 23,130 |
Disclaimer/Publisher’s Note: The statements, opinions and data contained in all publications are solely those of the individual author(s) and contributor(s) and not of MDPI and/or the editor(s). MDPI and/or the editor(s) disclaim responsibility for any injury to people or property resulting from any ideas, methods, instructions or products referred to in the content. |
© 2024 by the authors. Licensee MDPI, Basel, Switzerland. This article is an open access article distributed under the terms and conditions of the Creative Commons Attribution (CC BY) license (https://creativecommons.org/licenses/by/4.0/).
Share and Cite
Aguinaga-Ontoso, I.; Guillén-Aguinaga, S.; Guillén-Aguinaga, L.; Alas-Brun, R.; Aguinaga-Ontoso, E.; Rayón-Valpuesta, E.; Guillén-Grima, F. Has COVID-19 Affected DTP3 Vaccination in the Americas? Vaccines 2024, 12, 238. https://doi.org/10.3390/vaccines12030238
Aguinaga-Ontoso I, Guillén-Aguinaga S, Guillén-Aguinaga L, Alas-Brun R, Aguinaga-Ontoso E, Rayón-Valpuesta E, Guillén-Grima F. Has COVID-19 Affected DTP3 Vaccination in the Americas? Vaccines. 2024; 12(3):238. https://doi.org/10.3390/vaccines12030238
Chicago/Turabian StyleAguinaga-Ontoso, Ines, Sara Guillén-Aguinaga, Laura Guillén-Aguinaga, Rosa Alas-Brun, Enrique Aguinaga-Ontoso, Esperanza Rayón-Valpuesta, and Francisco Guillén-Grima. 2024. "Has COVID-19 Affected DTP3 Vaccination in the Americas?" Vaccines 12, no. 3: 238. https://doi.org/10.3390/vaccines12030238
APA StyleAguinaga-Ontoso, I., Guillén-Aguinaga, S., Guillén-Aguinaga, L., Alas-Brun, R., Aguinaga-Ontoso, E., Rayón-Valpuesta, E., & Guillén-Grima, F. (2024). Has COVID-19 Affected DTP3 Vaccination in the Americas? Vaccines, 12(3), 238. https://doi.org/10.3390/vaccines12030238