

Immune Profile Determines Response to Vaccination against COVID-19 in Kidney Transplant Recipients

 , ,
, , 
Abstract
:1. Introduction
2. Materials and Methods
2.1. Patients
2.1.1. Inclusion Criteria
2.1.2. Exclusion Criteria
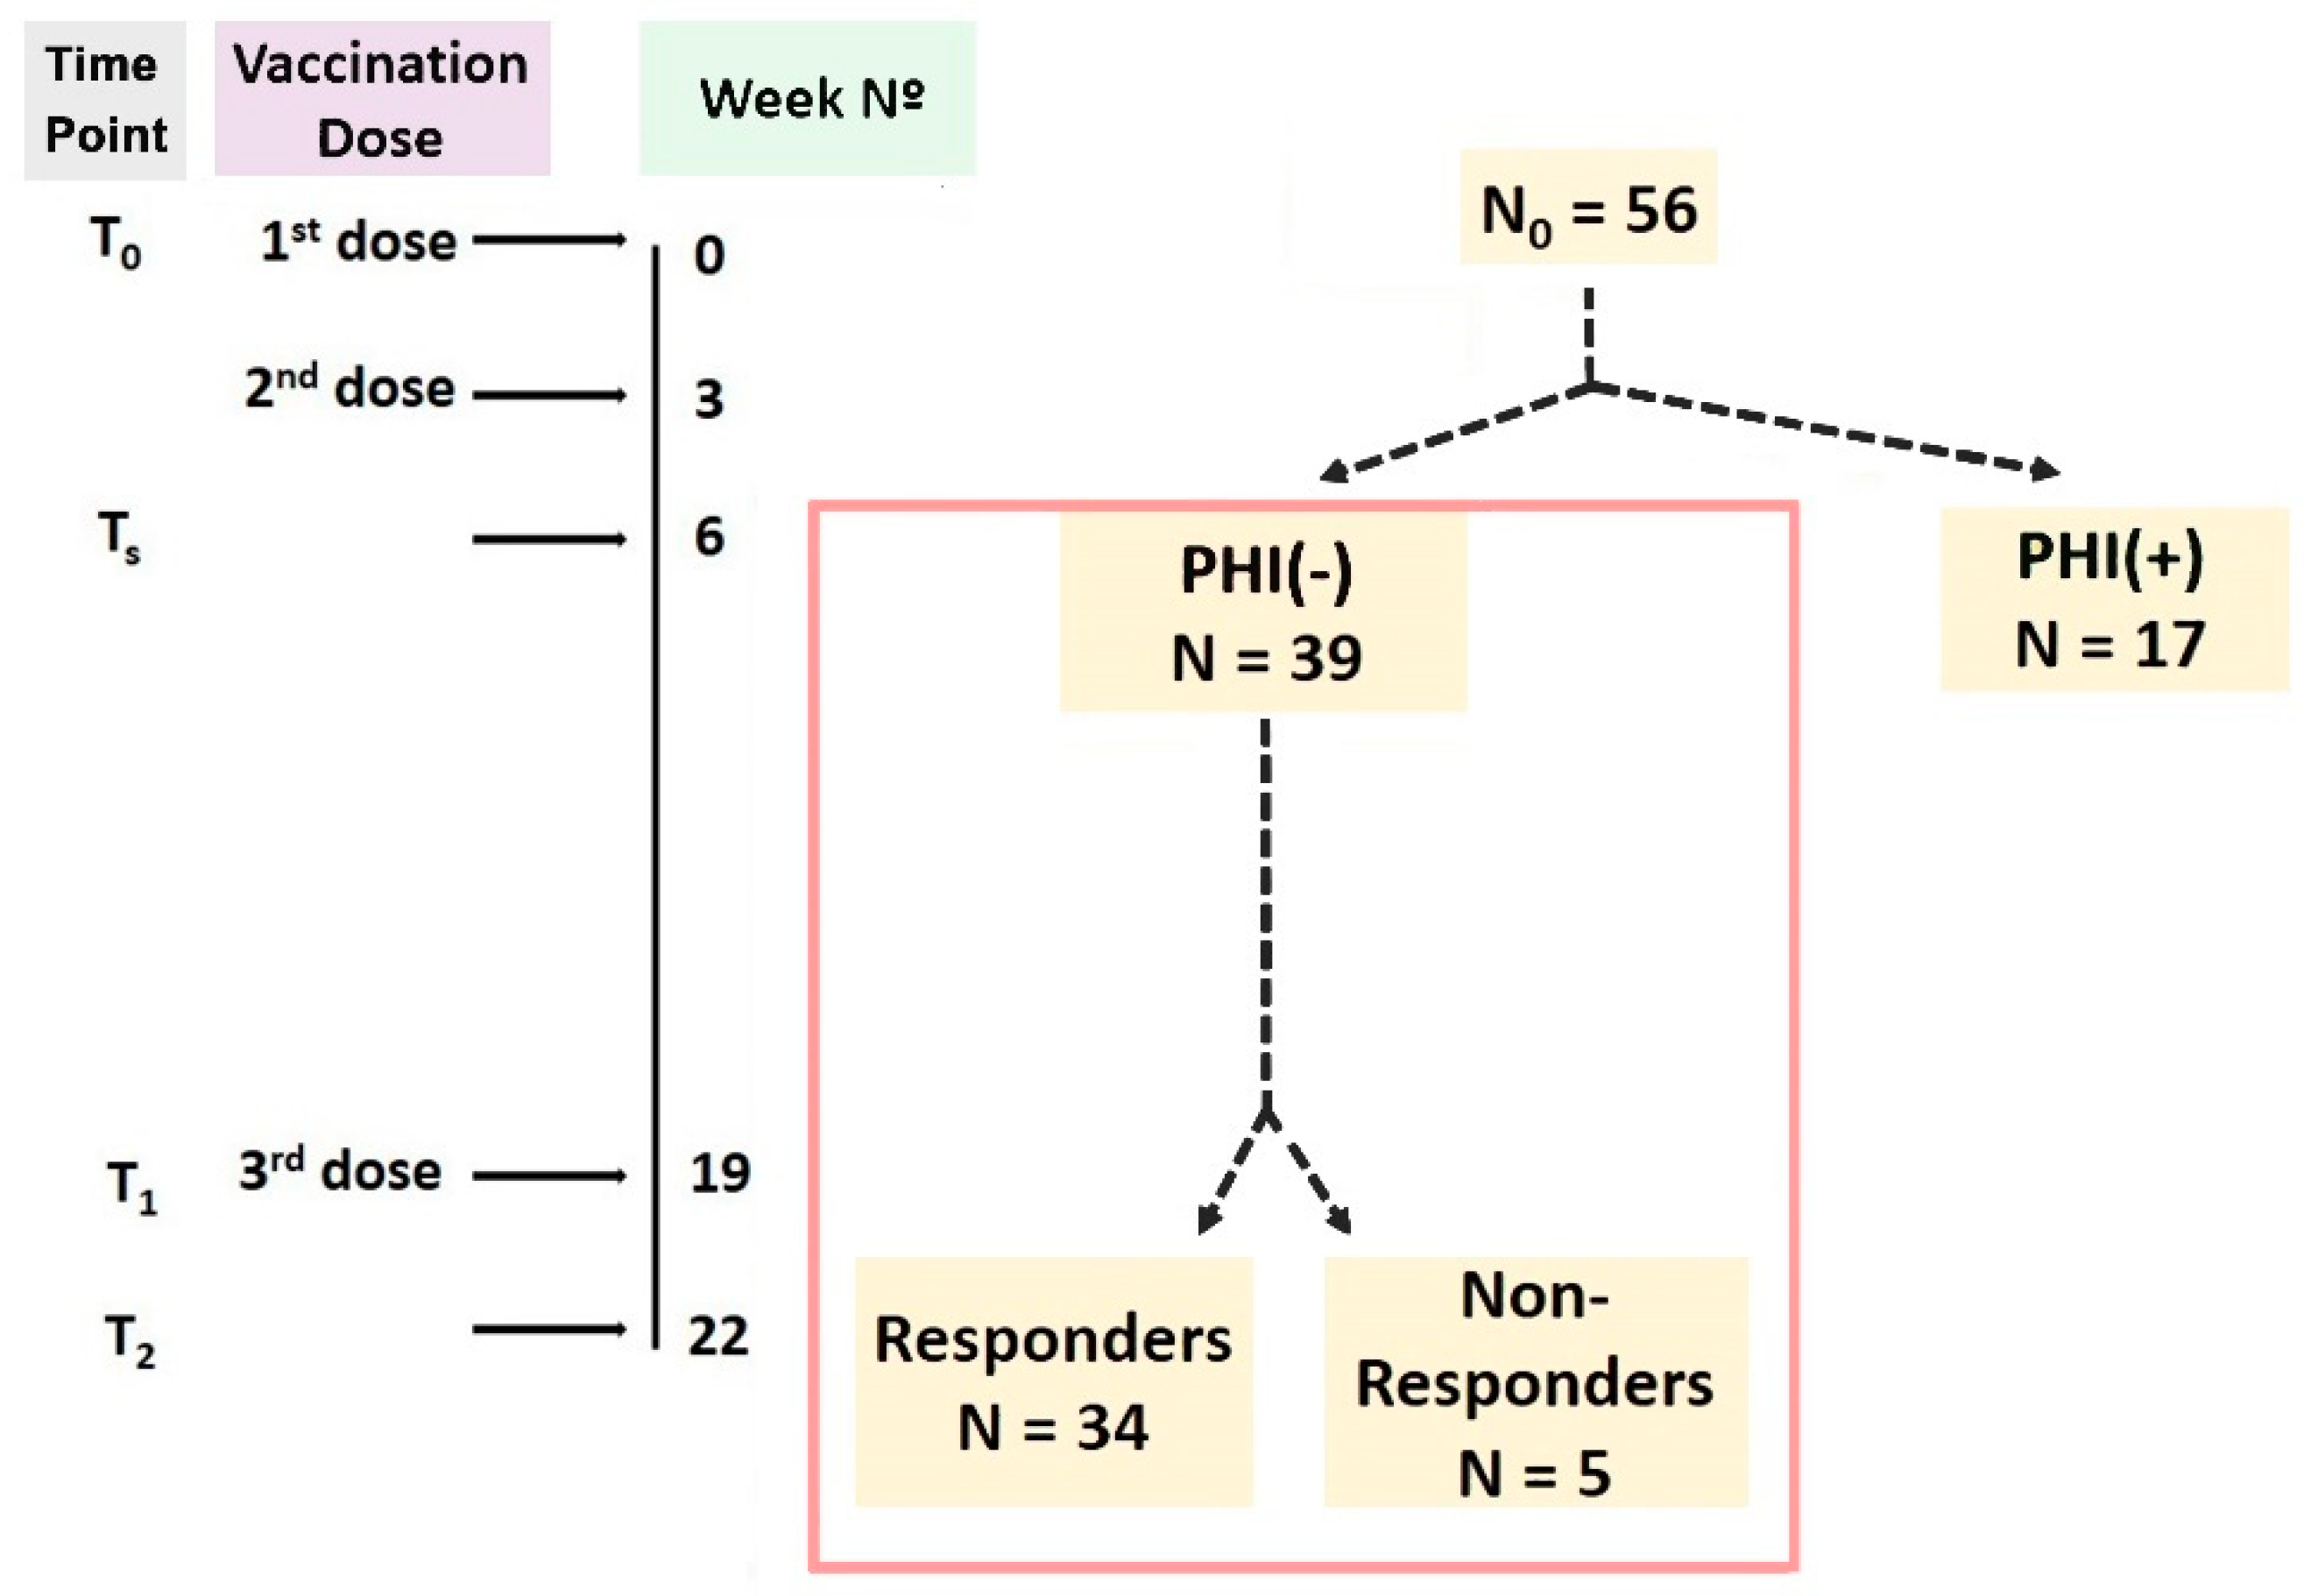
2.2. Schedule of the Study
2.3. Definitions
- (i)
- Protective Humoral Immunity (PHI) against COVID-19, evaluated with regards to the serum concentrations of anti-SARS-CoV-2-neutralizing antibodies (Nabs), measured with the chemiluminescence immunoassay technique. Nab levels ≥ 0.3 AU/mL were regarded as positive, and patients were regarded as PHI (+).
- (ii)
- Specific T-cell immunity, detected with the utilization of an enzyme-linked immunosorbent spot (ELISpot) test. ELISpot test values ≥ 30 spot-forming cells (SFC)/5 × 105 peripheral blood mononuclear cells (PBMCs) were considered positive.
2.4. Laboratory Methods
2.4.1. Flow Cytometry
2.4.2. Chemiluminescence Immunoassay Technique (CLIA)
2.4.3. Enzyme-Linked Immunosorbent Spot Test (ELISpot)
2.5. Statistical Analysis
3. Results
3.1. Differences between Responders and Non-Responders
3.2. Changes in Immune Cell Phenotype during Vaccination
3.2.1. Responders
3.2.2. Non-Responders
4. Discussion
5. Conclusions
Supplementary Materials
Author Contributions
Funding
Institutional Review Board Statement
Informed Consent Statement
Data Availability Statement
Acknowledgments
Conflicts of Interest
References
- Sofi, M.S.; Hamid, A.; Bhat, S.U. SARS-CoV-2: A Critical Review of Its History, Pathogenesis, Transmission, Diagnosis and Treatment. Biosaf. Health 2020, 2, 217–225. [Google Scholar] [CrossRef] [PubMed]
- Mertens, G.; Gerritsen, L.; Duijndam, S.; Salemink, E.; Engelhard, I.M. Fear of the Coronavirus (COVID-19): Predictors in an Online Study Conducted in March 2020. J. Anxiety Disord. 2020, 74, 102258. [Google Scholar] [CrossRef] [PubMed]
- Sun, P.; Lu, X.; Xu, C.; Sun, W.; Pan, B. Understanding of COVID-19 Based on Current Evidence. J. Med. Virol. 2020, 92, 548–551. [Google Scholar] [CrossRef] [PubMed]
- Zeng, H.; Ma, Y.; Zhou, Z.; Liu, W.; Huang, P.; Jiang, M.; Liu, Q.; Chen, P.; Luo, H.; Chen, Y. Spectrum and Clinical Characteristics of Symptomatic and Asymptomatic Coronavirus Disease 2019 (COVID-19) with and without Pneumonia. Front. Med. 2021, 8, 645651. [Google Scholar] [CrossRef]
- da Rosa Mesquita, R.; Francelino Silva Junior, L.C.; Santos Santana, F.M.; Farias de Oliveira, T.; Campos Alcântara, R.; Monteiro Arnozo, G.; Rodrigues da Silva Filho, E.; Galdino dos Santos, A.G.; Oliveira da Cunha, E.J.; Salgueiro de Aquino, S.H.; et al. Clinical Manifestations of COVID-19 in the General Population: Systematic Review. Wien. Klin. Wochenschr. 2020, 133, 377–382. [Google Scholar] [CrossRef] [PubMed]
- Gao, Y.; Ding, M.; Dong, X.; Zhang, J.; Kursat Azkur, A.; Azkur, D.; Gan, H.; Sun, Y.; Fu, W.; Li, W.; et al. Risk Factors for Severe and Critically Ill COVID-19 Patients: A Review. Allergy 2020, 76, 428–455. [Google Scholar] [CrossRef] [PubMed]
- Demir, E.; Ucar, Z.A.; Dheir, H.; Danis, R.; Yelken, B.; Uyar, M.; Parmaksiz, E.; Artan, A.S.; Sinangil, A.; Merhametsiz, O.; et al. COVID-19 in Kidney Transplant Recipients: A Multicenter Experience from the First Two Waves of Pandemic. BMC Nephrol. 2022, 23, 183. [Google Scholar] [CrossRef]
- Stai, S.; Lioulios, G.; Christodoulou, M.; Kasimatis, E.; Fylaktou, A.; Stangou, M. COVID-19 Infection and Response to Vaccination in Chronic Kidney Disease and Renal Transplantation: A Brief Presentation. Life 2022, 12, 1358. [Google Scholar] [CrossRef]
- Khandker, S.S.; Godman, B.; Jawad, M.I.; Meghla, B.A.; Tisha, T.A.; Khondoker, M.U.; Haq, M.A.; Charan, J.; Talukder, A.A.; Azmuda, N.; et al. A Systematic Review on COVID-19 Vaccine Strategies, Their Effectiveness, and Issues. Vaccines 2021, 9, 1387. [Google Scholar] [CrossRef]
- Teo, S.P. Review of COVID-19 mRNA Vaccines: BNT162b2 and mRNA-1273. J. Pharm. Pract. 2021, 35, 947–951. [Google Scholar] [CrossRef]
- Bloom, K.; van den Berg, F.; Arbuthnot, P. Self-Amplifying RNA Vaccines for Infectious Diseases. Gene Ther. 2020, 28, 117–129. [Google Scholar] [CrossRef]
- Blakney, A. The Next Generation of RNA Vaccines: Self-Amplifying RNA. Biochemist 2021, 43, 14–17. [Google Scholar] [CrossRef]
- Lamb, Y.N. BNT162B2 mRNA COVID-19 Vaccine: First Approval. Drugs 2021, 81, 495–501. [Google Scholar] [CrossRef]
- Tsang, J.S.; Dobaño, C.; VanDamme, P.; Moncunill, G.; Marchant, A.; Othman, R.B.; Sadarangani, M.; Koff, W.C.; Kollmann, T.R. Improving Vaccine-Induced Immunity: Can Baseline Predict Outcome? Trends Immunol. 2020, 41, 457–465. [Google Scholar] [CrossRef]
- Huang, W.-T.; Weng, S.-W.; Tzeng, H.-T.; Yen, F.-C.; Chiang, Y.-S.; You, H.-L. Lymphocyte Subpopulations Associated with Neutralizing Antibody Levels of SARS-CoV-2 for COVID-19 Vaccination. Vaccines 2022, 10, 1550. [Google Scholar] [CrossRef] [PubMed]
- Nelli, F.; Fabbri, A.; Panichi, V.; Giannarelli, D.; Topini, G.; Giron Berrios, J.R.; Virtuoso, A.; Marrucci, E.; Mazzotta, M.; Schirripa, M.; et al. Peripheral Lymphocyte Subset Counts Predict Antibody Response after SARS-CoV-2 mRNA-Bnt162b2 Vaccine in Cancer Patients: Results from the VAX-on-Profile Study. Int. Immunopharmacol. 2022, 108, 108774. [Google Scholar] [CrossRef]
- Diks, A.M.; Overduin, L.A.; van Leenen, L.D.; Slobbe, L.; Jolink, H.; Visser, L.G.; van Dongen, J.J.; Berkowska, M.A. B-Cell Immunophenotyping to Predict Vaccination Outcome in the Immunocompromised–A Systematic Review. Front. Immunol. 2021, 12, 690328. [Google Scholar] [CrossRef] [PubMed]
- Morales-Núñez, J.J.; García-Chagollán, M.; Muñoz-Valle, J.F.; Díaz-Pérez, S.A.; Torres-Hernández, P.C.; Rodríguez-Reyes, S.C.; Santoscoy-Ascencio, G.; Sierra García de Quevedo, J.J.; Hernández-Bello, J. Differences in B-Cell Immunophenotypes and Neutralizing Antibodies against SARS-CoV-2 after Administration of BNT162B2 (Pfizer-BioNTech) Vaccine in Individuals with and without Prior COVID-19–A Prospective Cohort Study. J. Inflamm. Res. 2022, 15, 4449–4466. [Google Scholar] [CrossRef]
- Stefanski, A.-L.; Rincon-Arevalo, H.; Schrezenmeier, E.; Karberg, K.; Szelinski, F.; Ritter, J.; Chen, Y.; Jahrsdörfer, B.; Ludwig, C.; Schrezenmeier, H.; et al. B cell characteristics at baseline predict vaccination response in RTX treated patients. Front. Immunol. 2022, 13, 822885. [Google Scholar] [CrossRef]
- Painter, M.M.; Mathew, D.; Goel, R.R.; Apostolidis, S.A.; Pattekar, A.; Kuthuru, O.; Baxter, A.E.; Herati, R.S.; Oldridge, D.A.; Gouma, S.; et al. Rapid Induction of Antigen-Specific CD4+ T Cells Is Associated with Coordinated Humoral and Cellular Immunity to SARS-CoV-2 mRNA Vaccination. Immunity 2021, 54, 2133–2142. [Google Scholar] [CrossRef]
- Lioulios, G.; Fylaktou, A.; Asouchidou, D.; Xochelli, A.; Nikolaidou, V.; Stai, S.; Christodoulou, M.; Giamalis, P.; Tsouchnikas, I.; Papagianni, A.; et al. Effect of Lymphocyte Phenotypic Alterations on the Humoral Response to Vaccination against SARS-CoV-2 in Dialysis Patients. Ann. Lab. Med. 2023, 43, 451–460. [Google Scholar] [CrossRef] [PubMed]
- Farber, D.L.; Yudanin, N.A.; Restifo, N.P. Human Memory T Cells: Generation, Compartmentalization and Homeostasis. Nat. Rev. Immunol. 2013, 14, 24–35. [Google Scholar] [CrossRef] [PubMed]
- Gasper, D.J.; Tejera, M.M.; Suresh, M. CD4 T-Cell Memory Generation and Maintenance. Crit. Rev. Immunol. 2014, 34, 121–146. [Google Scholar] [CrossRef] [PubMed]
- Gandolfo, C.; Anichini, G.; Mugnaini, M.; Bocchia, M.; Terrosi, C.; Sicuranza, A.; Gori Savellini, G.; Gozzetti, A.; Franchi, F.; Cusi, M.G. Overview of Anti-SARS-CoV-2 Immune Response Six Months after BNT162B2 mRNA Vaccine. Vaccines 2022, 10, 171. [Google Scholar] [CrossRef] [PubMed]
- Han, Y.; Liu, D.; Li, L. PD-1/PD-L1 Pathway: Current Researches in Cancer. Am. J. Cancer. Res. 2020, 10, 727–742. [Google Scholar] [PubMed]
- Lee, J.; Ahn, E.; Kissick, H.T.; Ahmed, R. Reinvigorating Exhausted T Cells by Blockade of the PD-1 Pathway. For. Immunopathol. Dis. Therap. 2015, 6, 7–17. [Google Scholar] [CrossRef]
- Lei, Q.; Wang, D.; Sun, K.; Wang, L.; Zhang, Y. Resistance Mechanisms of Anti-PD1/PDL1 Therapy in Solid Tumors. Front. Cell Dev. Biol. 2020, 8, 672. [Google Scholar] [CrossRef]
- Lai, H.-C.; Lin, J.-F.; Hwang, T.I.S.; Liu, Y.-F.; Yang, A.-H.; Wu, C.-K. Programmed Cell Death 1 (PD-1) Inhibitors in Renal Transplant Patients with Advanced Cancer: A Double-Edged Sword? Int. J. Mol. Sci. 2019, 20, 2194. [Google Scholar] [CrossRef]
- Loacker, L.; Kimpel, J.; Bánki, Z.; Schmidt, C.Q.; Griesmacher, A.; Anliker, M. Increased PD-L1 Surface Expression on Peripheral Blood Granulocytes and Monocytes after Vaccination with SARS-CoV-2 mRNA or Vector Vaccine. Clin. Chem. Lab. Med. 2022, 61, e17–e19. [Google Scholar] [CrossRef]
- Goel, R.R.; Apostolidis, S.A.; Painter, M.M.; Mathew, D.; Pattekar, A.; Kuthuru, O.; Gouma, S.; Hicks, P.; Meng, W.; Rosenfeld, A.M.; et al. Distinct Antibody and Memory B Cell Responses in SARS-CoV-2 Naïve and Recovered Individuals after mRNA Vaccination. Sci. Immunol. 2021, 6, eabi6950. [Google Scholar] [CrossRef]
- Attanavanich, K.; Kearney, J.F. Marginal Zone, but Not Follicular B Cells, Are Potent Activators of Naive CD4 T Cells. J. Immunol. 2004, 172, 803–811. [Google Scholar] [CrossRef] [PubMed]
- Altman, J.D.; Miner, D.S.; Lee, A.A.; Asay, A.E.; Nielson, B.U.; Rose, A.M.; Hilton, K.; Poole, B.D. Factors affecting vaccine attitudes influenced by the COVID-19 pandemic. Vaccines 2023, 11, 516. [Google Scholar] [CrossRef] [PubMed]

| CD Markers | Fluorochrome | Clone |
|---|---|---|
| B-cell markers | ||
| CD19 | PC7 | J4.119 |
| IgD | FITC | IA6-2 |
| CD27 | ECD | IA4CD27 |
| CD38 | A750 | LS198-4-3 |
| T-cell markers | ||
| CD3 | FITC | UCHT1 |
| CD45 | KROME | J33 |
| CD4 | APC | 13B8.2 |
| CD8 | PC5.5 | B9.11 |
| CD56 | A700 | N901NKH-1 |
| HLA-DR | PB | Immu-357 |
| CD38 | A750 | LS198-4-3 |
| Clinical Parameter | Responders | Non-Responders | p |
|---|---|---|---|
| Age (years) | 45.5 (16) | 54 (26) | NS |
| eGFR (mL/min/1.73 m2) | 54.95 (24.3) | 52.2 (27.4) | NS |
| Cyclosporin levels (ng/mL) | 253.5 (218) | - | NS |
| Tacrolimus levels (ng/mL) | 6 (2) | 4.5 (2.5) | NS |
| Dialysis Vintage (months) | 12.5 (44) | 41 (30) | NS |
| Transplantation Vintage (years) | 7.2 (14.6) | 6.9 (13.5) | NS |
| Cell Subpopulation Concentration (Cells/μL) | Responders | Non-Responders | p |
|---|---|---|---|
| WBC | 7450 (2725) | 7400 (3600) | NS |
| Lymphocytes | 1772.5 (1444) | 1413 (879) | NS |
| B-lymphocytes | 96.5 (93) | 51 (52) | 0.045 |
| Memory B-cells | 16.5 (28) | 9 (22) | NS |
| Naïve B-cells | 77 (77) | 30 (37) | NS |
| Transitional B-cells | 9 (17) | 1 (2) | 0.031 |
| Marginal Zone B-cells | 5.3 (12.2) | 1.7 (−) | NS |
| CD3+ T-cells | 1399 (1325) | 1076 (790) | NS |
| CD3+CD4+ T-cells | 891 (602) | 589 (456) | NS |
| Activated CD4+ T-cells | 6.5 (4) | 8 (6) | NS |
| CD3+CD8+ T-cells | 454 (628) | 389 (353) | NS |
| Activated CD8+ T-cells | 8 (19) | 7 (28) | NS |
| CD3+PD1+ T-cells | 130 (121) | 59 (81) | NS |
| Monocytes | 173 (158) | 87 (381) | NS |
| Activated monocytes | 2 (2) | 1 (11) | NS |
| CD3-CD56+ natural killer cells | 411 (358) | 487 (516) | NS |
| Activated natural killer T-cells | 260.5 (232) | 329 (384) | NS |
| Cell Subpopulation Concentration (Cells/μL) | T0 | T1 | T2 | p (Friedman Test) | p1 (T0–T1) * | p2 (T1–T2) * |
|---|---|---|---|---|---|---|
| WBC | 7450 (2725) | 7750 (1725) | 9050 (3200) | 0.043 | NS | NS |
| Lymphocytes | 1772.5 (1444) | 1790.95 (807) | 1563.55 (1039) | NS | NS | NS |
| B-lymphocytes | 96.5 (93) | 84.18 (74) | 83.09 (124) | NS | NS | NS |
| Memory B-cells | 16.5 (28) | 24.78 (34) | 25.18 (27) | NS | NS | NS |
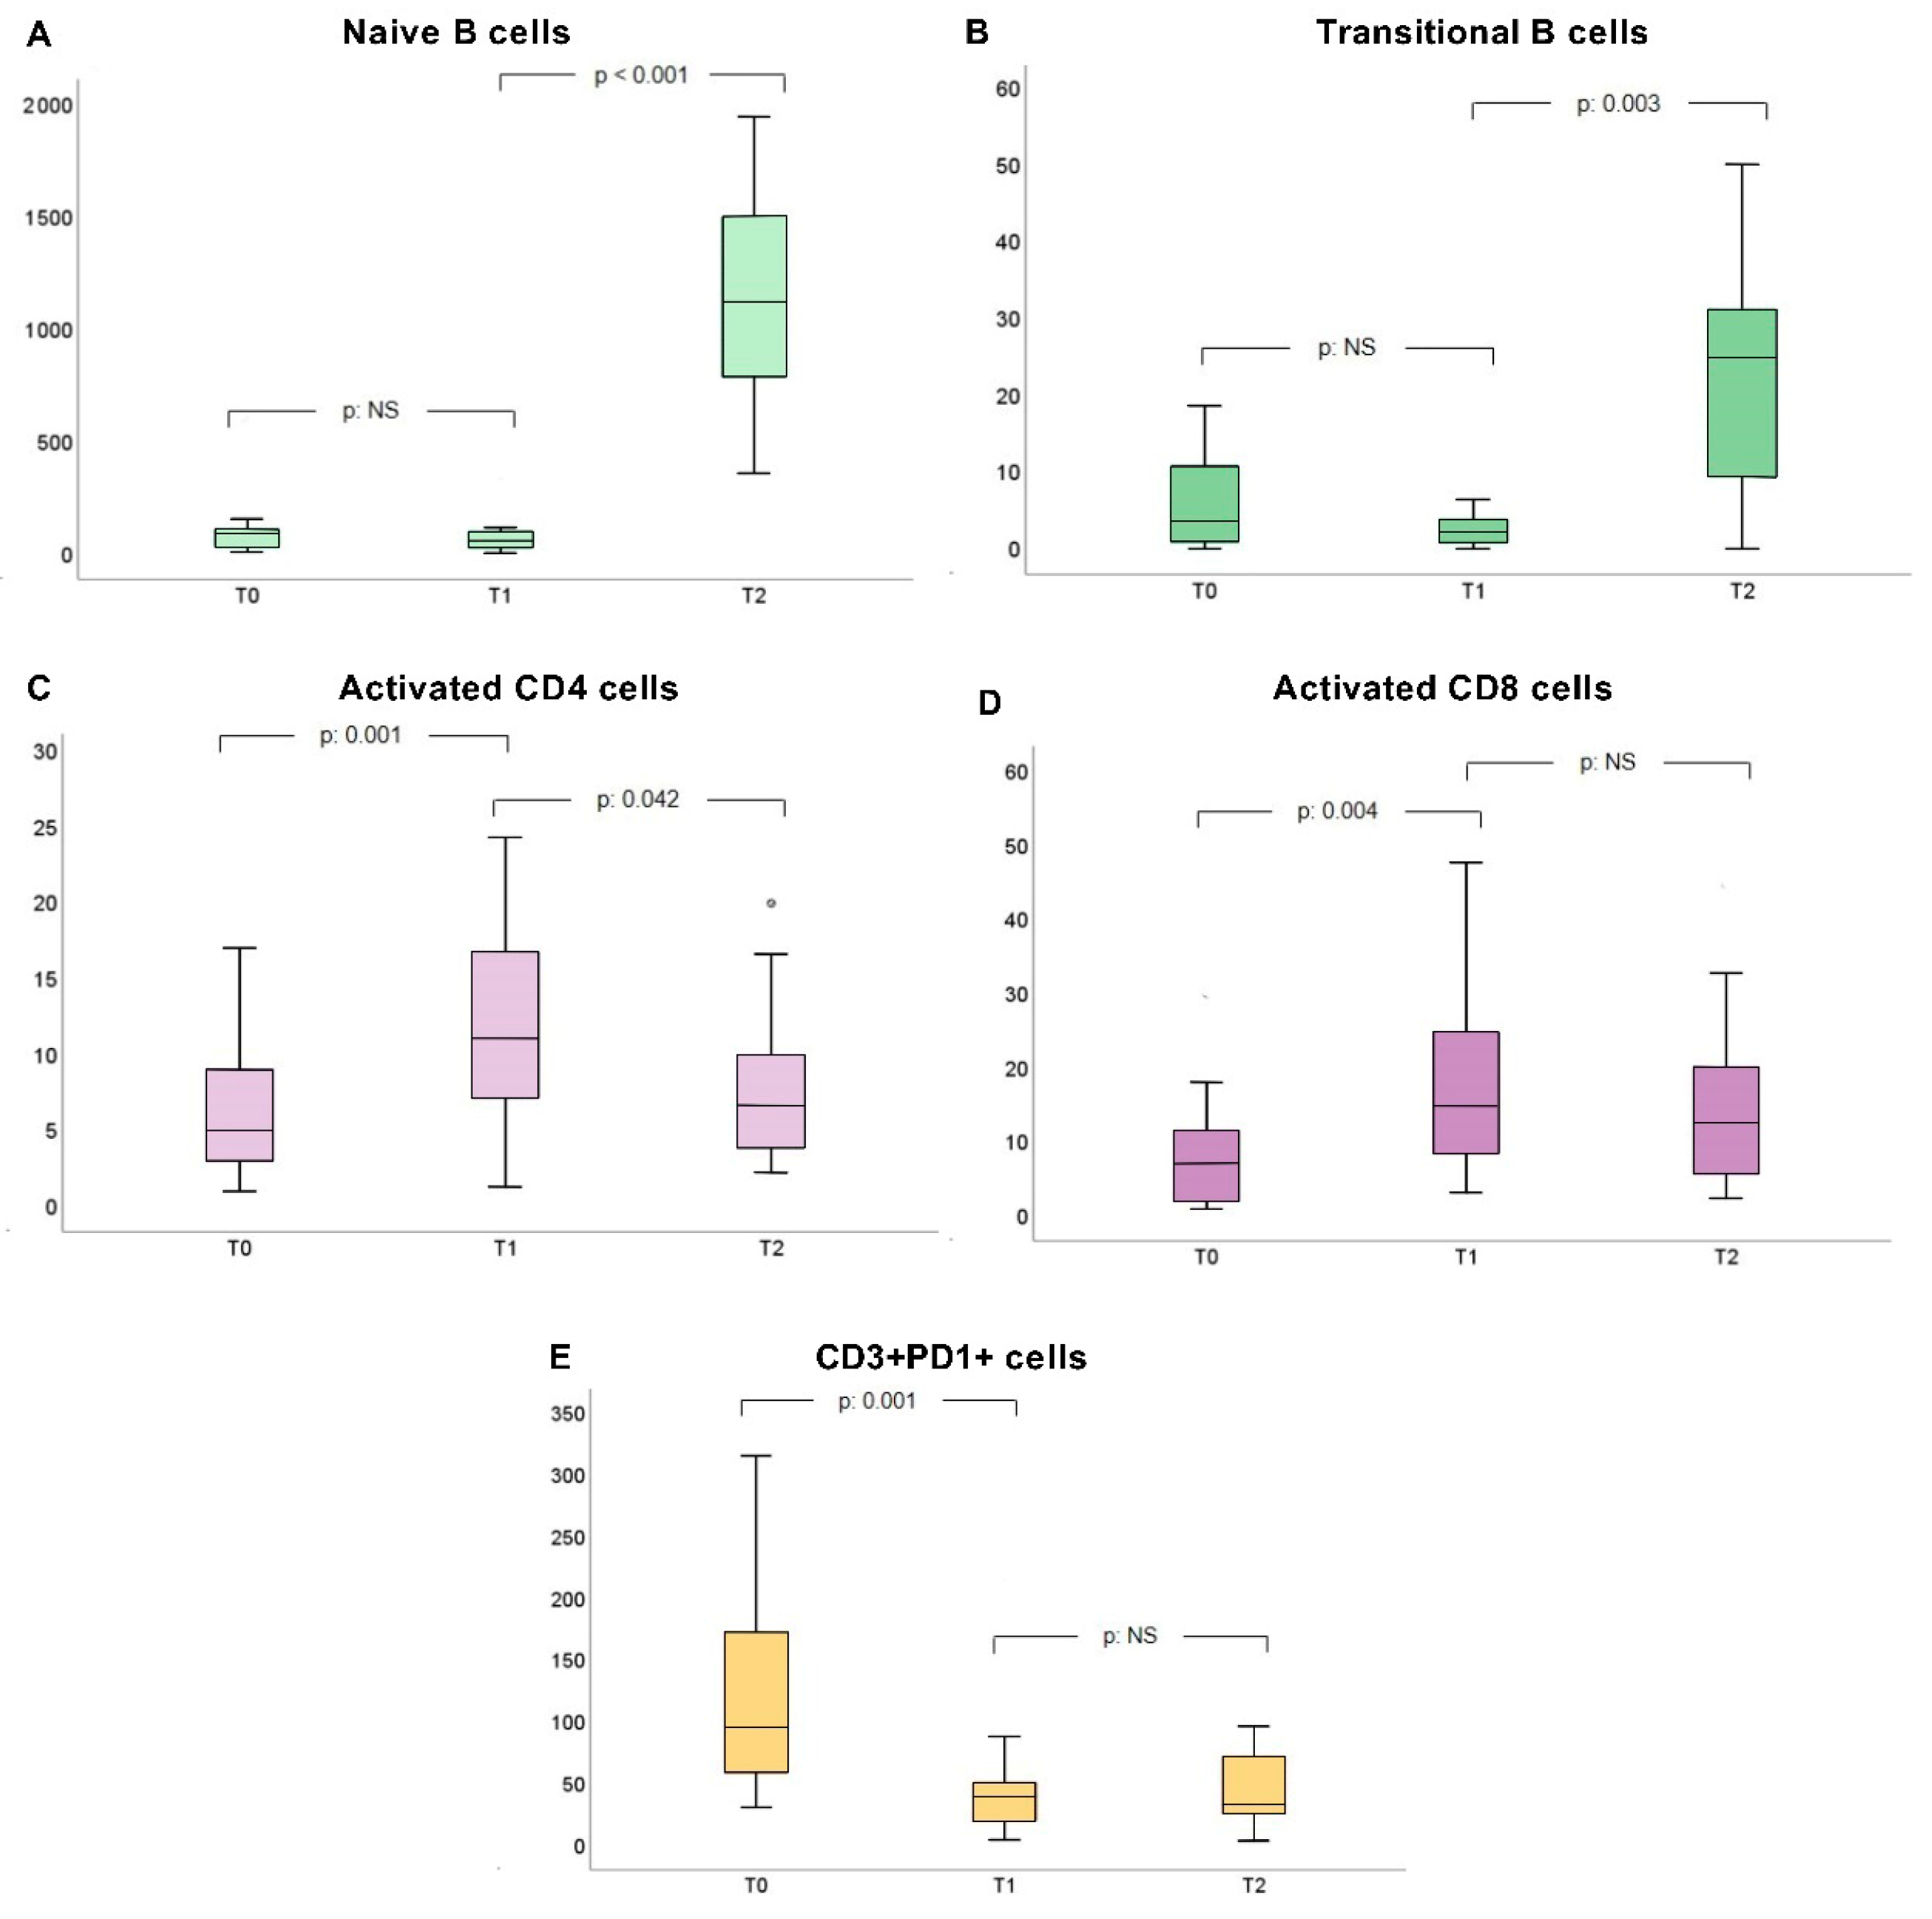
| Naïve B-cells | 77 (77) | 57.55 (66) | 1149.3 (680) | <0.001 | NS | <0.001 |
| Transitional B-cells | 9 (17) | 1.4 (3) | 17.5 (21) | 0.002 | NS | 0.003 |
| Marginal Zone B-cells | 5.3 (12) | 10.04 (17) | 10.6 (12) | NS | NS | NS |
| CD3+ T-cells | 1399.5 (1325) | 1497.69 (829) | 1375.81 (861) | NS | NS | NS |
| CD3+CD4+ T-cells | 891 (602) | 885.07 (456) | 785.6 (499) | NS | NS | NS |
| Activated CD4+ T-cells | 6.5 (4) | 10.08 (11) | 5.29 (5) | 0.001 | 0.001 | 0.042 |
| CD3+CD8+ T-cells | 454.5 (628) | 514.77 (362) | 519.76 (480) | NS | NS | NS |
| Activated CD8+ T-cells | 8 (19) | 14.76 (16) | 13.95 (24) | 0.005 | 0.004 | NS |
| CD3+PD1+ T-cells | 130 (121) | 30.44 (25) | 27.05 (34) | <0.001 | 0.001 | NS |
| Monocytes | 411 (358) | 389.5 (202) | 422.7 (269) | NS | NS | NS |
| Activated monocytes | 260.5 (232) | 292.88 (182) | 315.73 (187) | NS | NS | NS |
| CD3−CD56+ natural killer cells | 173 (158) | 124.56 (115) | 160.11 (102) | NS | NS | NS |
| Activated natural killer T-cells | 2 (2) | 2.85 (4) | 2.78 (3) | NS | NS | NS |
| Cell Subpopulation Concentration (Cells/μL) | T0 | T1 | T2 | p (Friedman Test) | p1 (T0–T1) * | p2 (T1–T2) * |
|---|---|---|---|---|---|---|
| WBC | 7400 (3600) | 8100 (1100) | 7900 (3100) | NS | NS | NS |
| Lymphocytes | 1413 (879) | 1101.6 (892) | 1554 (1270) | 0.041 | NS | 0.034 |
| B-lymphocytes | 51 (52) | 39.61 (45) | 26.86 (42) | NS | NS | NS |
| Memory B-cells | 9 (22) | 13.86 (18) | 10.57 (19) | NS | NS | NS |
| Naïve B-cells | 30 (37) | 16.87 (32) | 867.01 (1279) | 0.039 | NS | 0.04 |
| Transitional B-cells | 1 (2) | 0.34 (1) | 16.17 (15) | 0.039 | NS | 0.04 |
| Marginal Zone B-cells | 1.7 (1) | 6.77 (9) | 1.12 (0.9) | NS | NS | NS |
| CD3+ T-cells | 1076 (790) | 844.17 (931) | 1098.6 (1466) | NS | NS | NS |
| CD3+CD4+ T-cells | 589 (456) | 492.25 (625) | 642.21 (1014) | NS | NS | NS |
| Activated CD4+ T-cells | 8 (6) | 5.97 (11) | 5.31 (7) | NS | NS | NS |
| CD3+CD8+ T-cells | 389 (353) | 359.85 (320) | 458.93 (443) | NS | NS | NS |
| Activated CD8+ T-cells | 7 (28) | 10.5 (21) | 8.29 (14) | NS | NS | NS |
| CD3+PD1+ T-cells | 59 (81) | 32.82 (40) | 59.85 (72) | NS | NS | NS |
| Monocytes | 487 (516) | 495.9 (162) | 394.6 (285) | NS | NS | NS |
| Activated monocytes | 329 (384) | 344.65 (180) | 240.9 (241) | NS | NS | NS |
| CD3-CD56+ natural killer cells | 87 (381) | 74.91 (164) | 192.75 (378) | 0.05 | NS | NS |
| Activated natural killer T-cells | 1 (11) | 2.17 (4) | 1.56 (3.1) | NS | NS | NS |
| Cell Subpopulation Percentage (%) | T0 | T1 | T2 | p (Friedman Test) | p1 (T0–T1) * | p2 (T1–T2) * |
|---|---|---|---|---|---|---|
| Lymphocytes | 23 (18.1) | 21.7 (10.3) | 21.3 (5.8) | 0.014 | 0.027 | NS |
| B-lymphocytes | 4.4 (5) | 5.5 (3.7) | 6.2 (4.6) | NS | NS | NS |
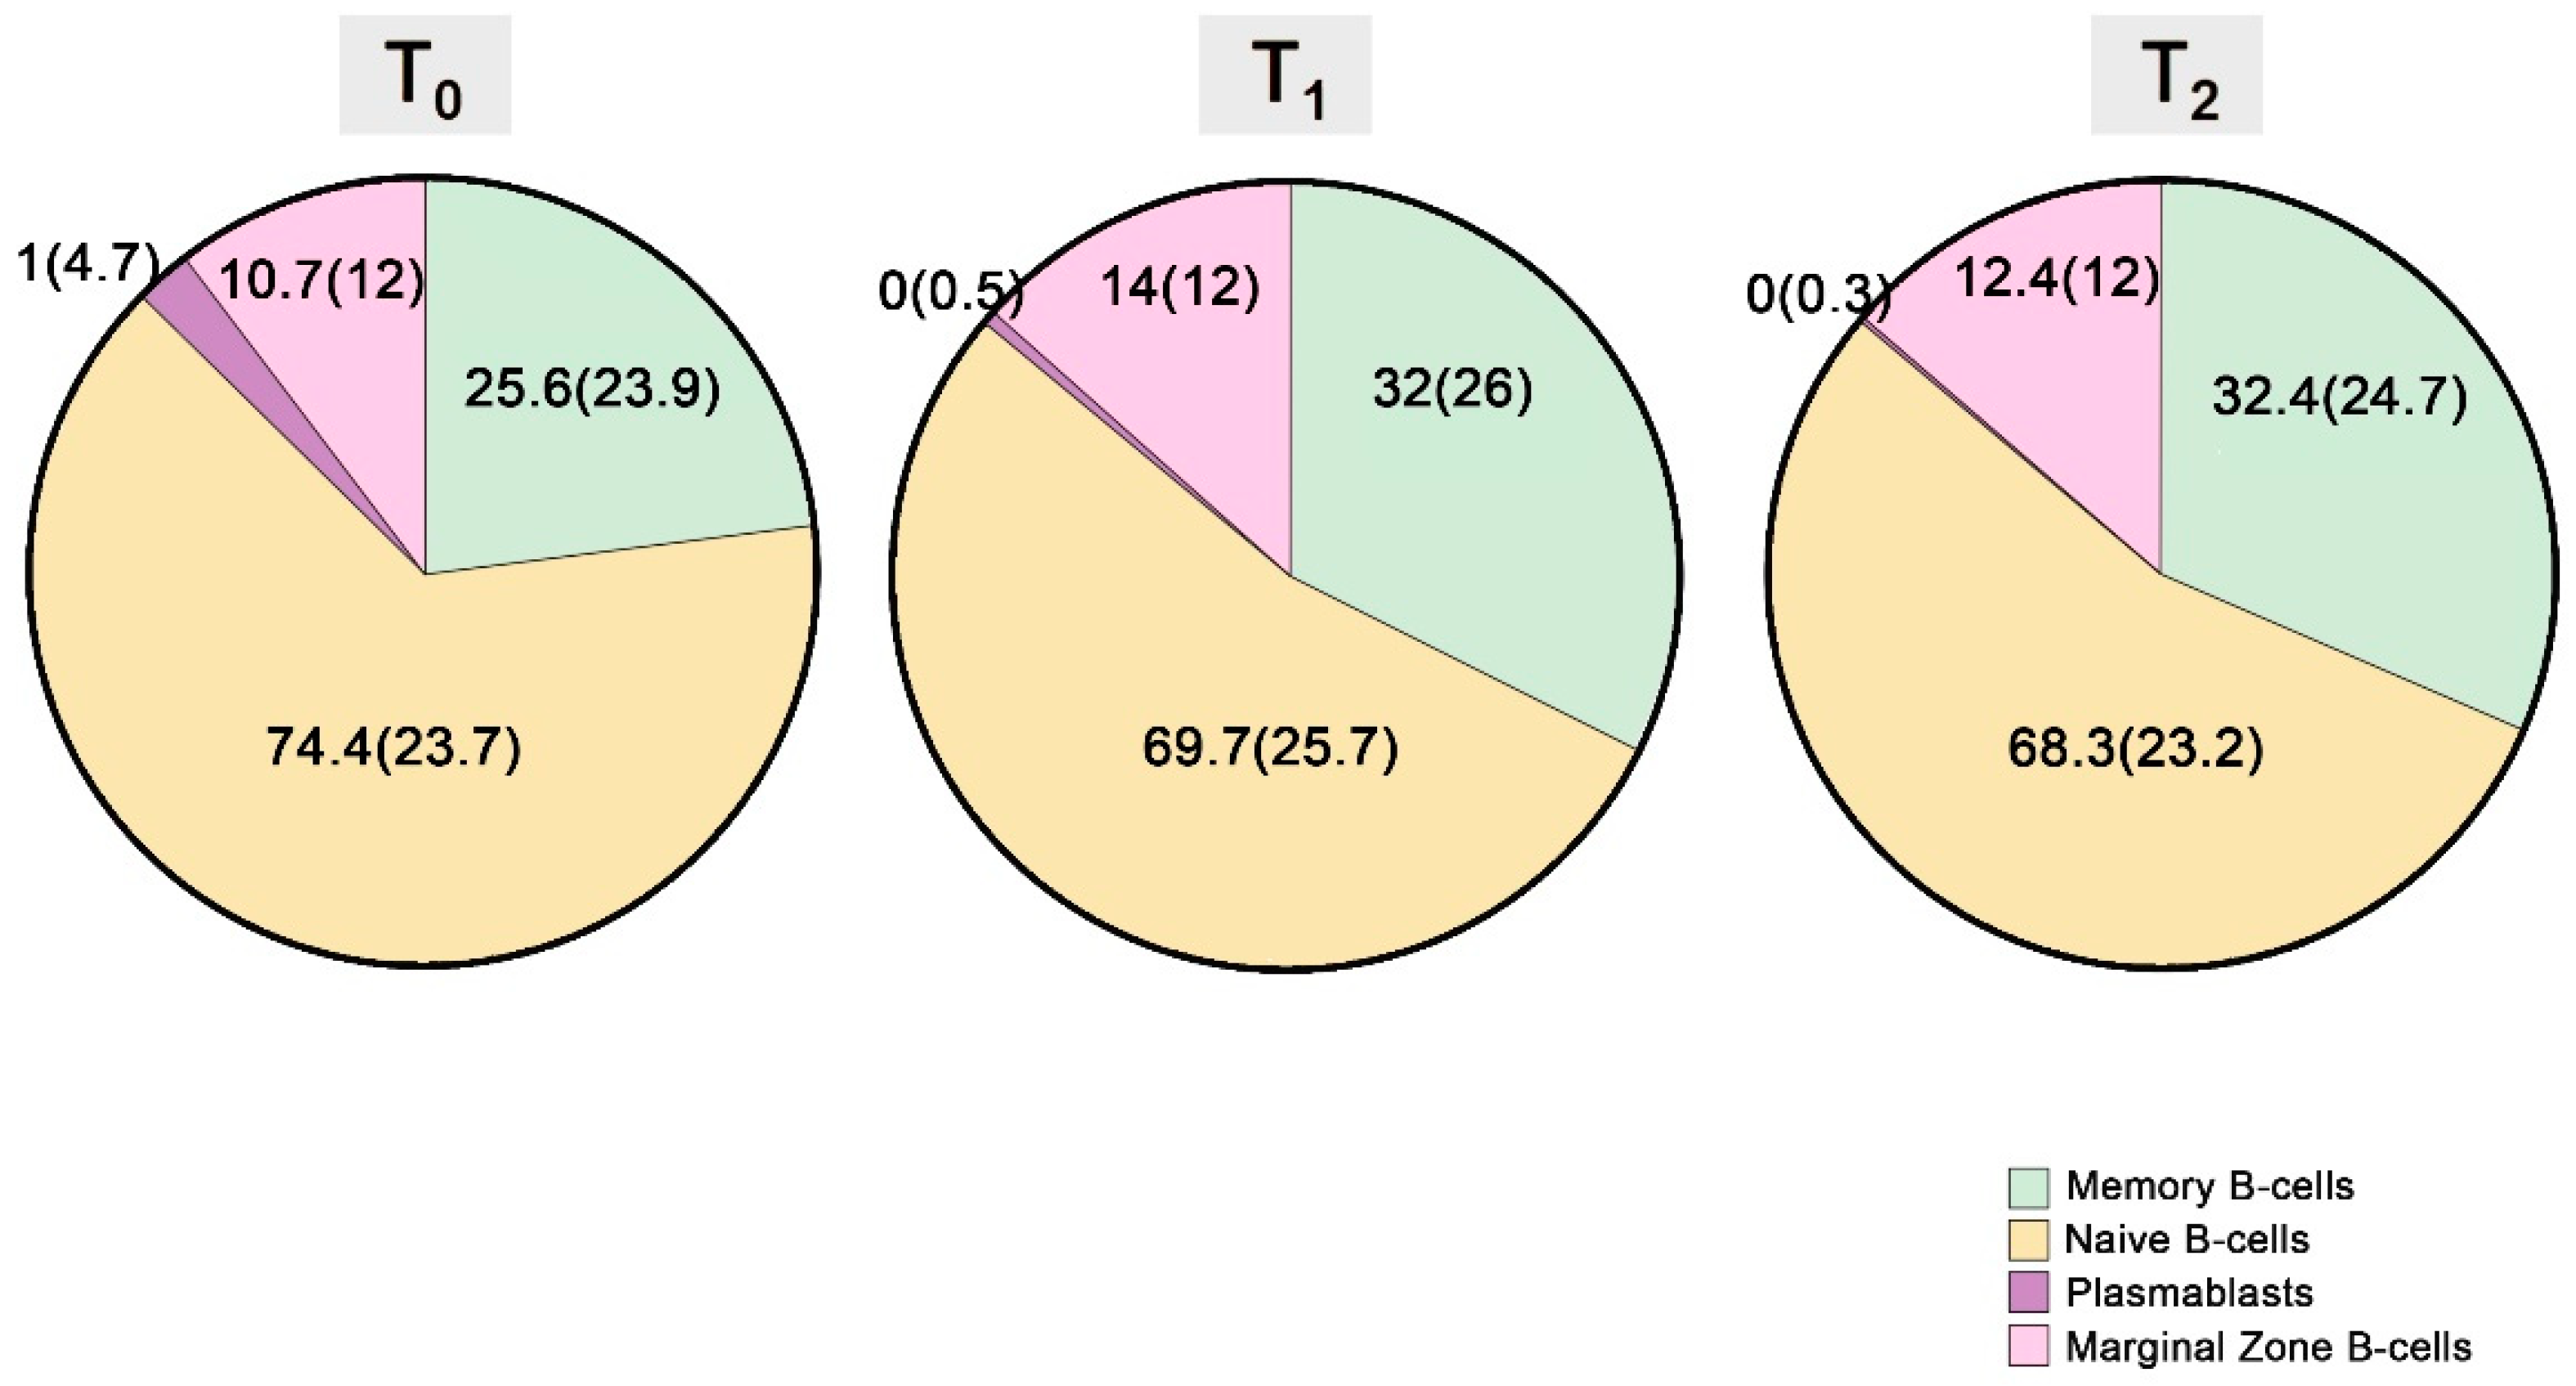
| Memory B-cells | 25.6 (23.9) | 32 (26) | 32.4 (24.7) | 0.001 | 0.001 | NS |
| Naïve B-cells | 74.4 (23.7) | 69.7 (25.7) | 68.3 (23.2) | 0.001 | 0.002 | NS |
| Plasmablasts | 1 (4.7) | 0 (0.5) | 0 (0.3) | 0.03 | NS | NS |
| Switched plasmablasts | 19 (66.7) | 0 (100) | 0 (100) | NS | NS | NS |
| Non-switched plasmablasts | 0 (58.3) | 0 (0) | 0 (0) | NS | NS | NS |
| Transitional B-cells | 9.4 (30.6) | 2 (4.9) | 1.8 (2.1) | 0.006 | NS | NS |
| Marginal Zone B-cells | 10.7 (12.4) | 14 (12.4) | 12.4 (12.2) | 0.016 | 0.031 | NS |
| CD3+ T-cells | 83.3 (15.3) | 82.5 (8.9) | 81.8 (7.9) | NS | NS | NS |
| CD3+CD4+ T-cells | 50.5 (15.4) | 49.5 (11.8) | 49.8 (13.6) | NS | NS | NS |
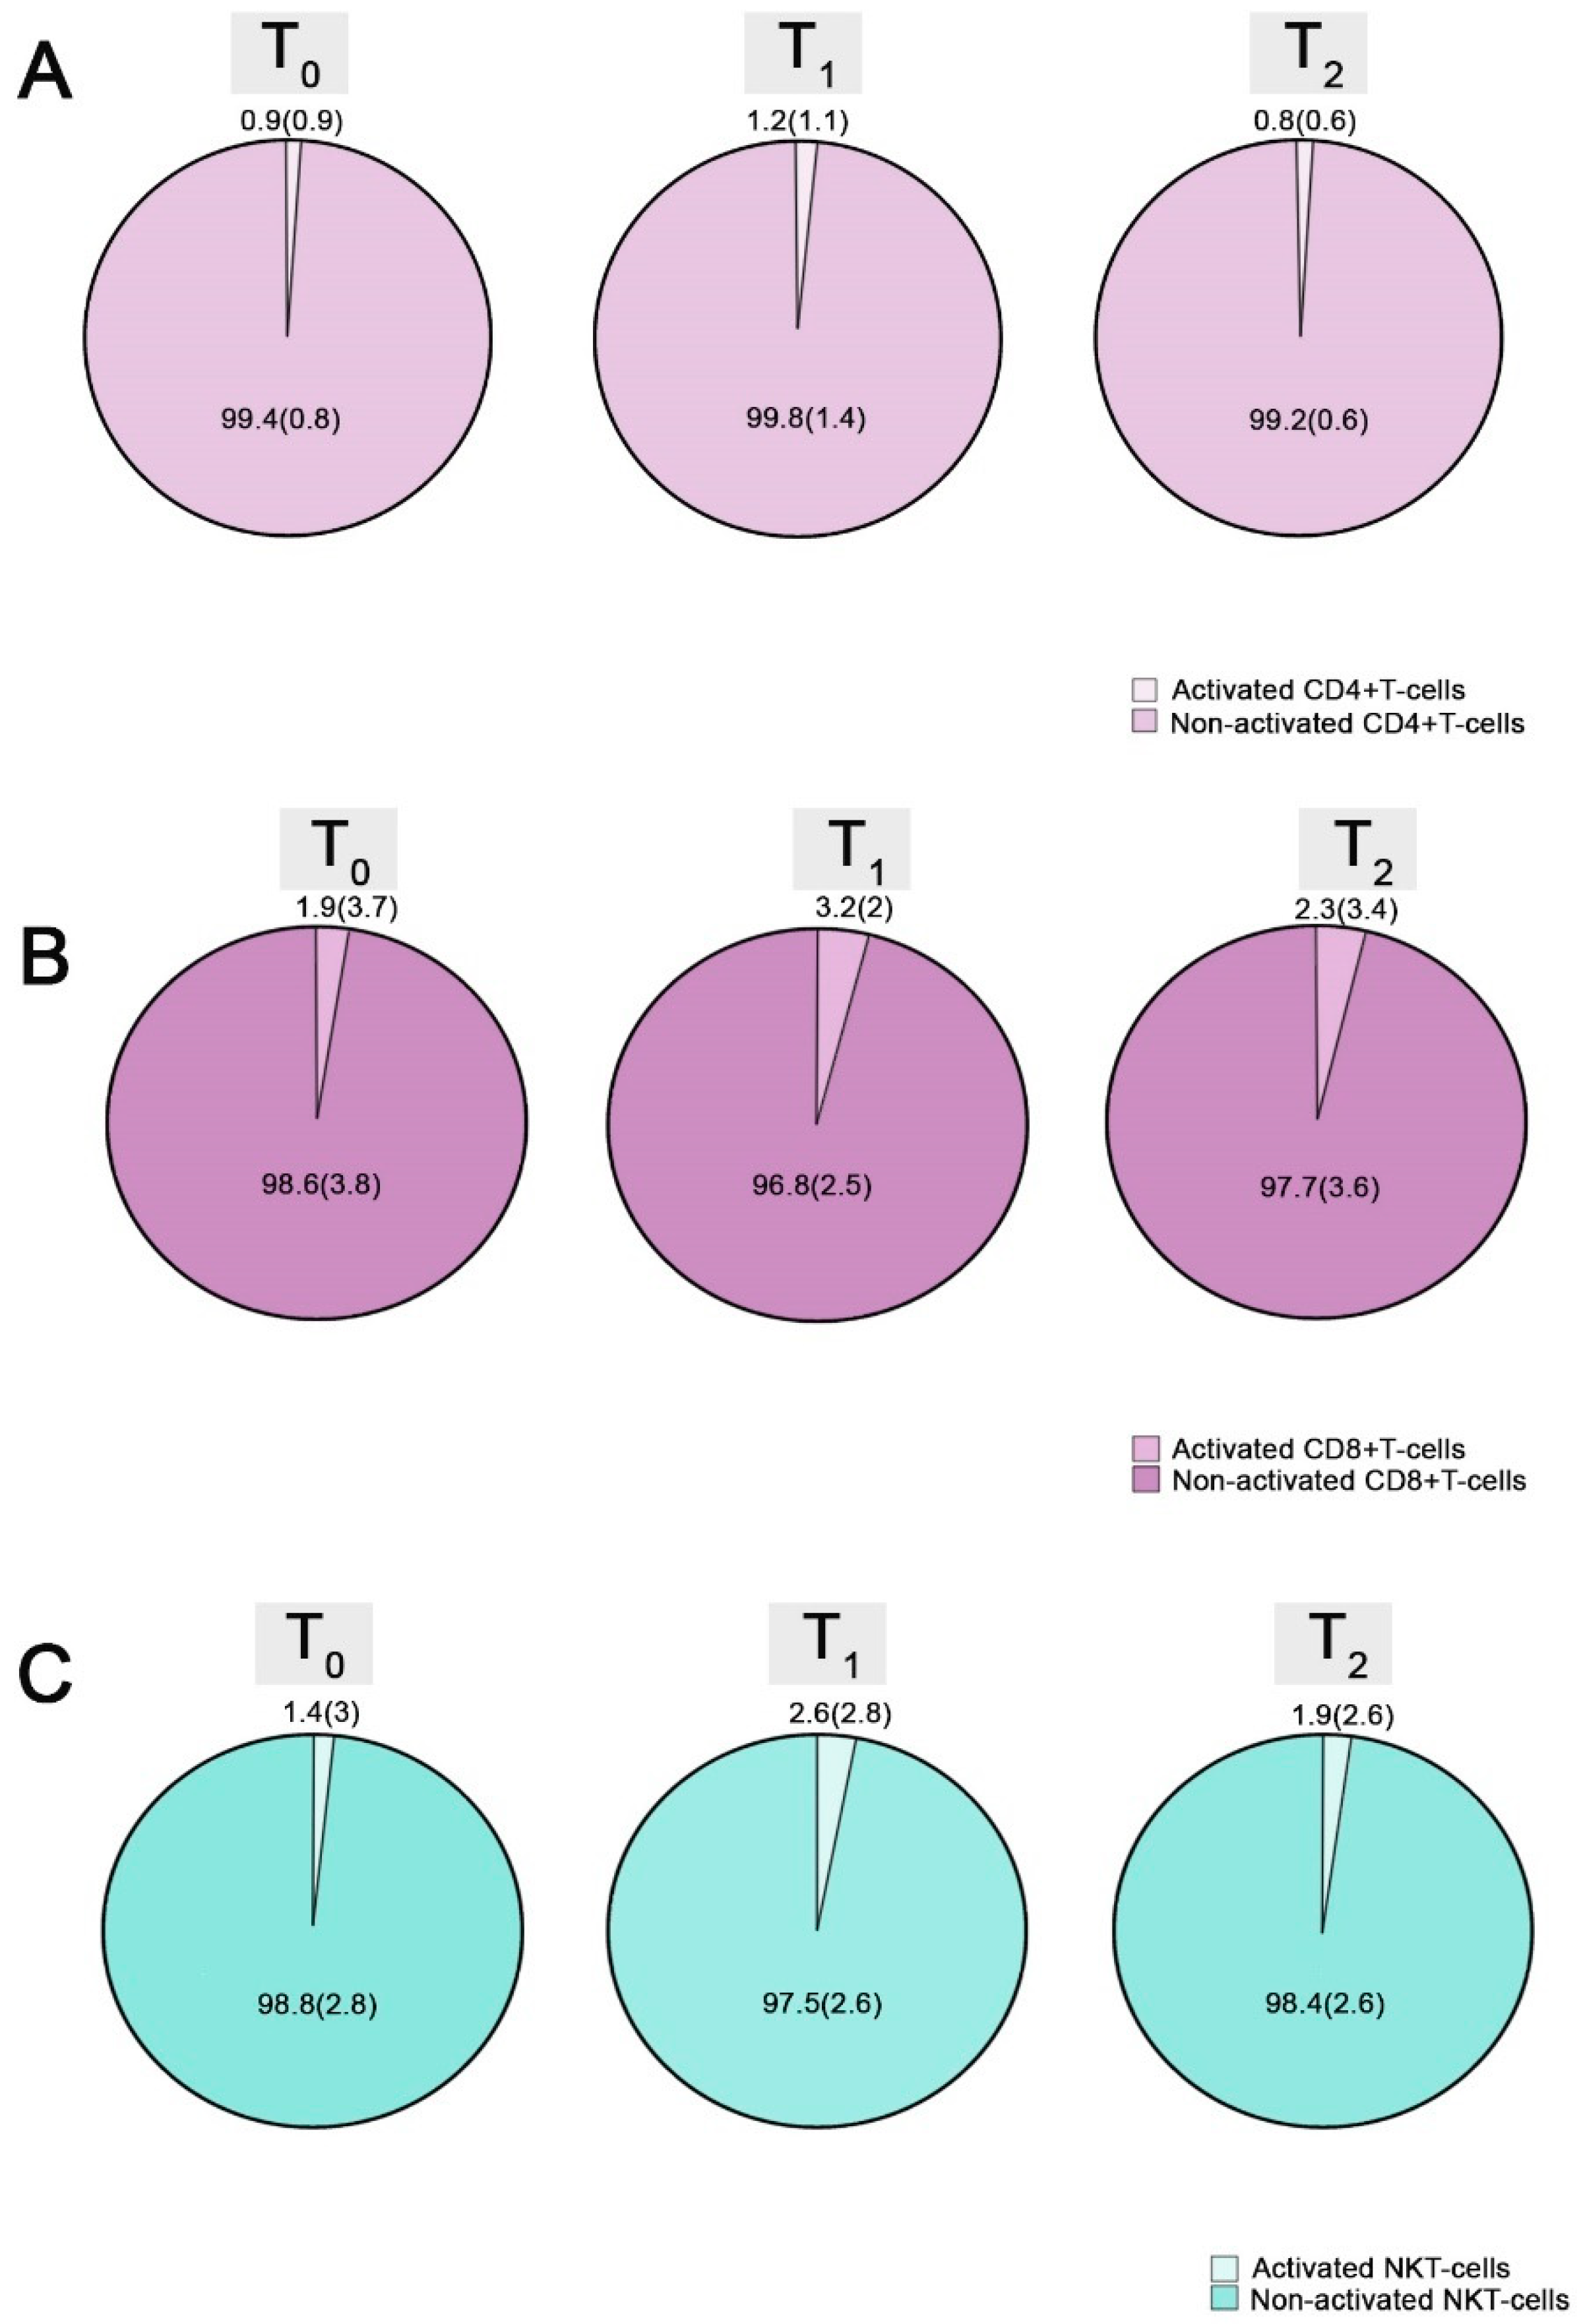
| Activated CD4+ T-cells | 0.9 (0.9) | 1.2 (1.1) | 0.8 (0.6) | 0.001 | 0.001 | 0.031 |
| CD3+CD8+ T-cells | 30 (17) | 30.4 (12) | 30.7 (13.9) | 0.002 | NS | 0.002 |
| Activated CD8+ T-cells | 1.9 (3.7) | 3.2 (2) | 2.3 (3.4) | 0.02 | 0.017 | NS |
| CD3+PD1+ T-cells | 7.3 (4.7) | 1.8 (1.4) | 2.2 (2.1) | <0.001 | <0.001 | NS |
| Monocytes | 5 (3.7) | 4.8 (3) | 5.1 (2.4) | NS | NS | NS |
| Activated monocytes | 77 (22.3) | 77.1 (24.8) | 75.4 (21.8) | NS | NS | NS |
| CD3-CD56+ natural killer cells | 8.4 (4.9) | 8.3 (5.6) | 8.9 (5.7) | NS | NS | NS |
| Activated natural killer T-cells | 1.4 (3) | 2.6 (2.8) | 1.9 (2.6) | 0.001 | 0.001 | 0.03 |
| Cell Subpopulation Percentage (%) | T0 | T1 | T2 | p (Friedman Test) | p1 (T0–T1) * | p2 (T1–T2) * |
|---|---|---|---|---|---|---|
| Lymphocytes | 18.5 (7.4) | 13.6 (11.4) | 18.5 (14.7) | NS | NS | NS |
| B-lymphocytes | 3 (2.9) | 2.8 (2.7) | 1.55 (2.1) | 0.05 | NS | NS |
| Memory B-cells | 27.9 (26) | 32.7 (21.3) | 36.95 (27.6) | NS | NS | NS |
| Naïve B-cells | 73.5 (25.7) | 69.2 (21.9) | 62.2 (28) | NS | NS | NS |
| Plasmablasts | 1.45 (4.3) | 1.2 (3.6) | 0.55 (3.3) | NS | NS | NS |
| Switched plasmablasts | 100 (50) | 100 (62.5) | 50 (100) | NS | NS | NS |
| Non-switched plasmablasts | 0 (0) | 0 (12.5) | 0 (0) | NS | NS | NS |
| Transitional B-cells | 2 (5.5) | 2 (2.3) | 2.55 (3.1) | NS | NS | NS |
| Marginal Zone B-cells | 17.6 (−) | 12.3 (12.5) | 16.1 (16.7) | NS | NS | NS |
| CD3+ T-cells | 82.4 (23.6) | 78 (18.8) | 79 (19.2) | NS | NS | NS |
| CD3+CD4+ T-cells | 52.4 (31.1) | 51.7 (19.3) | 54.2 (27.1) | NS | NS | NS |
| Activated CD4+ T-cells | 1.4 (1.8) | 0.9 (1.9) | 0.65 (0.9) | NS | NS | NS |
| CD3+CD8+ T-cells | 26.6 (13.3) | 24.8 (16) | 26.6 (14.8) | NS | NS | NS |
| Activated CD8+ T-cells | 1.9 (5.7) | 2.7 (4.4) | 1.7 (2) | NS | NS | NS |
| CD3+PD1+ T-cells | 4.7 (4.1) | 2.9 (2.1) | 3.55 (2.2) | 0.039 | 0.04 | NS |
| Monocytes | 8.3 (5.5) | 5.7 (2.4) | 4.95 (2.4) | NS | NS | NS |
| Activated monocytes | 66.9 (9.7) | 70.8 (17.7) | 62.85 (24.6) | NS | NS | NS |
| CD3-CD56+ natural killer cells | 7.9 (21.9) | 10.5 (15.2) | 14.1 (19.7) | NS | NS | NS |
| Activated natural killer T-cells | 1.1 (2.3) | 2.9 (1.6) | 0.8 (-) | NS | NS | NS |
Disclaimer/Publisher’s Note: The statements, opinions and data contained in all publications are solely those of the individual author(s) and contributor(s) and not of MDPI and/or the editor(s). MDPI and/or the editor(s) disclaim responsibility for any injury to people or property resulting from any ideas, methods, instructions or products referred to in the content. |
© 2023 by the authors. Licensee MDPI, Basel, Switzerland. This article is an open access article distributed under the terms and conditions of the Creative Commons Attribution (CC BY) license (https://creativecommons.org/licenses/by/4.0/).
Share and Cite
Stai, S.; Fylaktou, A.; Kasimatis, E.; Xochelli, A.; Lioulios, G.; Nikolaidou, V.; Papadopoulou, A.; Myserlis, G.; Iosifidou, A.M.; Iosifidou, M.A.; et al. Immune Profile Determines Response to Vaccination against COVID-19 in Kidney Transplant Recipients. Vaccines 2023, 11, 1583. https://doi.org/10.3390/vaccines11101583
Stai S, Fylaktou A, Kasimatis E, Xochelli A, Lioulios G, Nikolaidou V, Papadopoulou A, Myserlis G, Iosifidou AM, Iosifidou MA, et al. Immune Profile Determines Response to Vaccination against COVID-19 in Kidney Transplant Recipients. Vaccines. 2023; 11(10):1583. https://doi.org/10.3390/vaccines11101583
Chicago/Turabian StyleStai, Stamatia, Asimina Fylaktou, Efstratios Kasimatis, Aliki Xochelli, Georgios Lioulios, Vasiliki Nikolaidou, Anastasia Papadopoulou, Grigorios Myserlis, Artemis Maria Iosifidou, Myrto Aikaterini Iosifidou, and et al. 2023. "Immune Profile Determines Response to Vaccination against COVID-19 in Kidney Transplant Recipients" Vaccines 11, no. 10: 1583. https://doi.org/10.3390/vaccines11101583
APA StyleStai, S., Fylaktou, A., Kasimatis, E., Xochelli, A., Lioulios, G., Nikolaidou, V., Papadopoulou, A., Myserlis, G., Iosifidou, A. M., Iosifidou, M. A., Papagianni, A., Yannaki, E., Tsoulfas, G., & Stangou, M. (2023). Immune Profile Determines Response to Vaccination against COVID-19 in Kidney Transplant Recipients. Vaccines, 11(10), 1583. https://doi.org/10.3390/vaccines11101583