Near UV-Vis and NMR Spectroscopic Methods for Rapid Screening of Antioxidant Molecules in Extra-Virgin Olive Oil


 and
and 
Abstract
1. Introduction
2. Materials and Methods
2.1. Chemicals
2.2. Sampling Area
2.3. EVOO Analyses
2.4. Statistical Analysis
3. Results
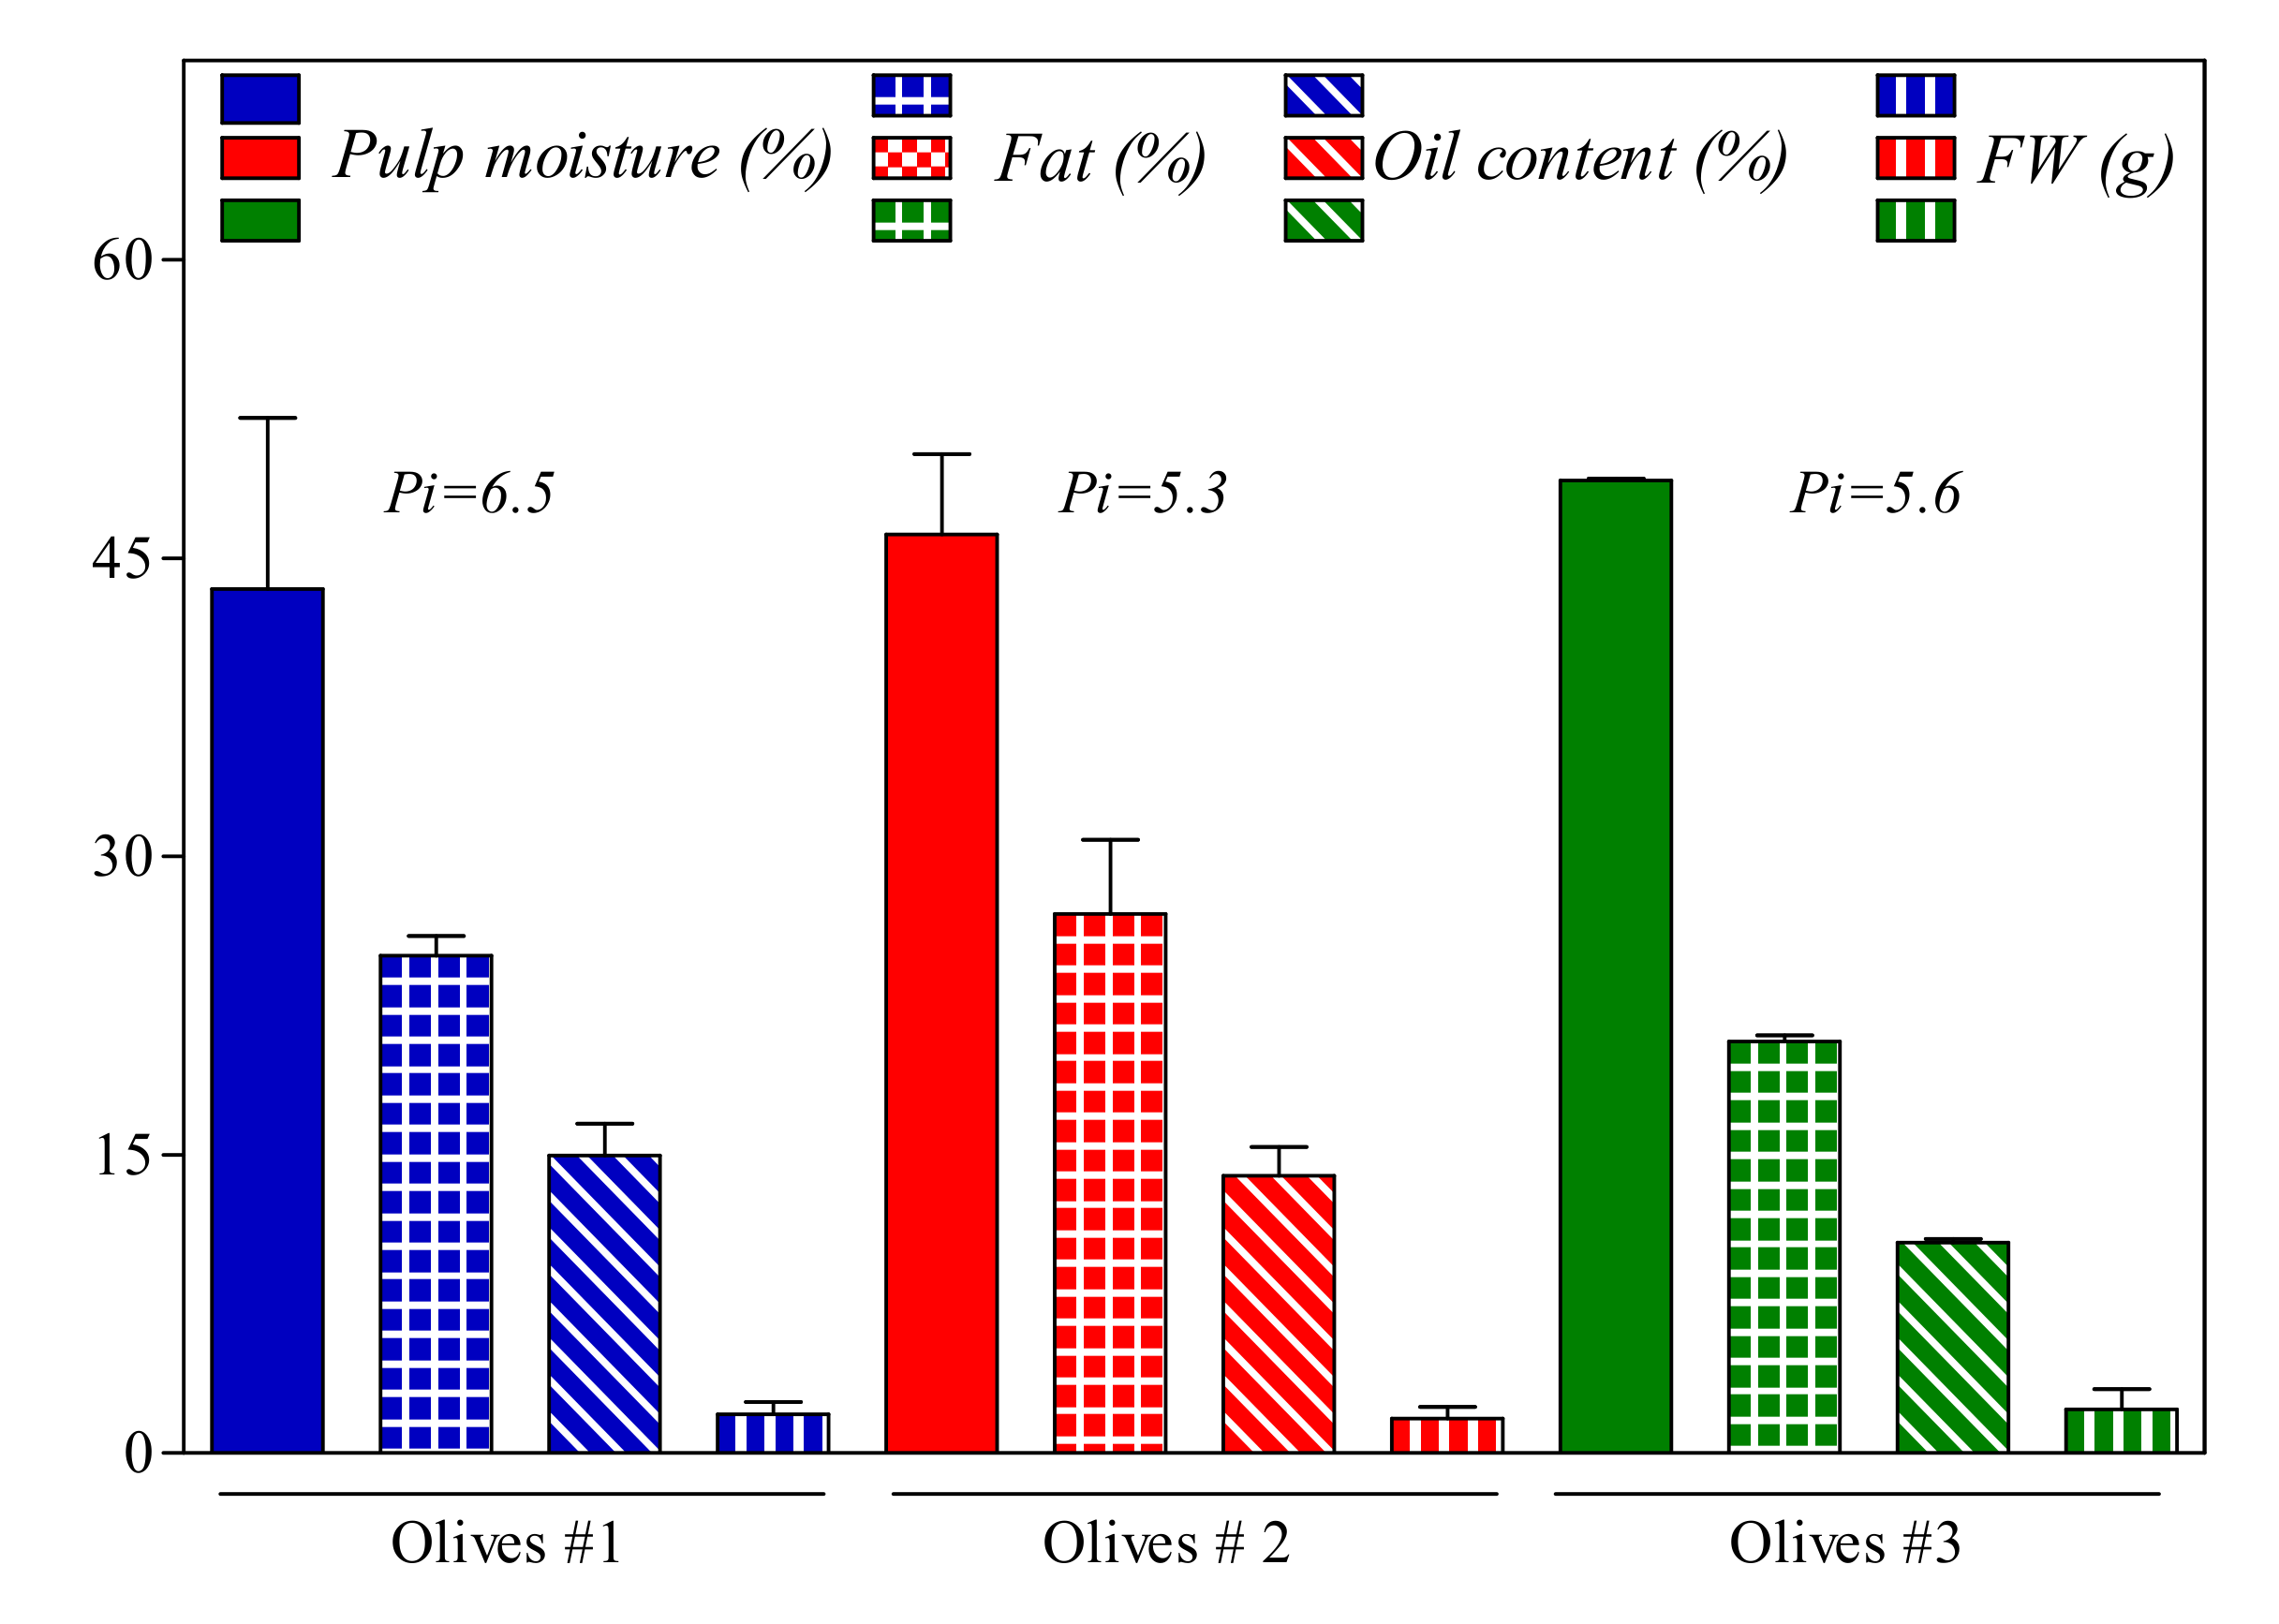
3.1. Olive Fruits Analysis
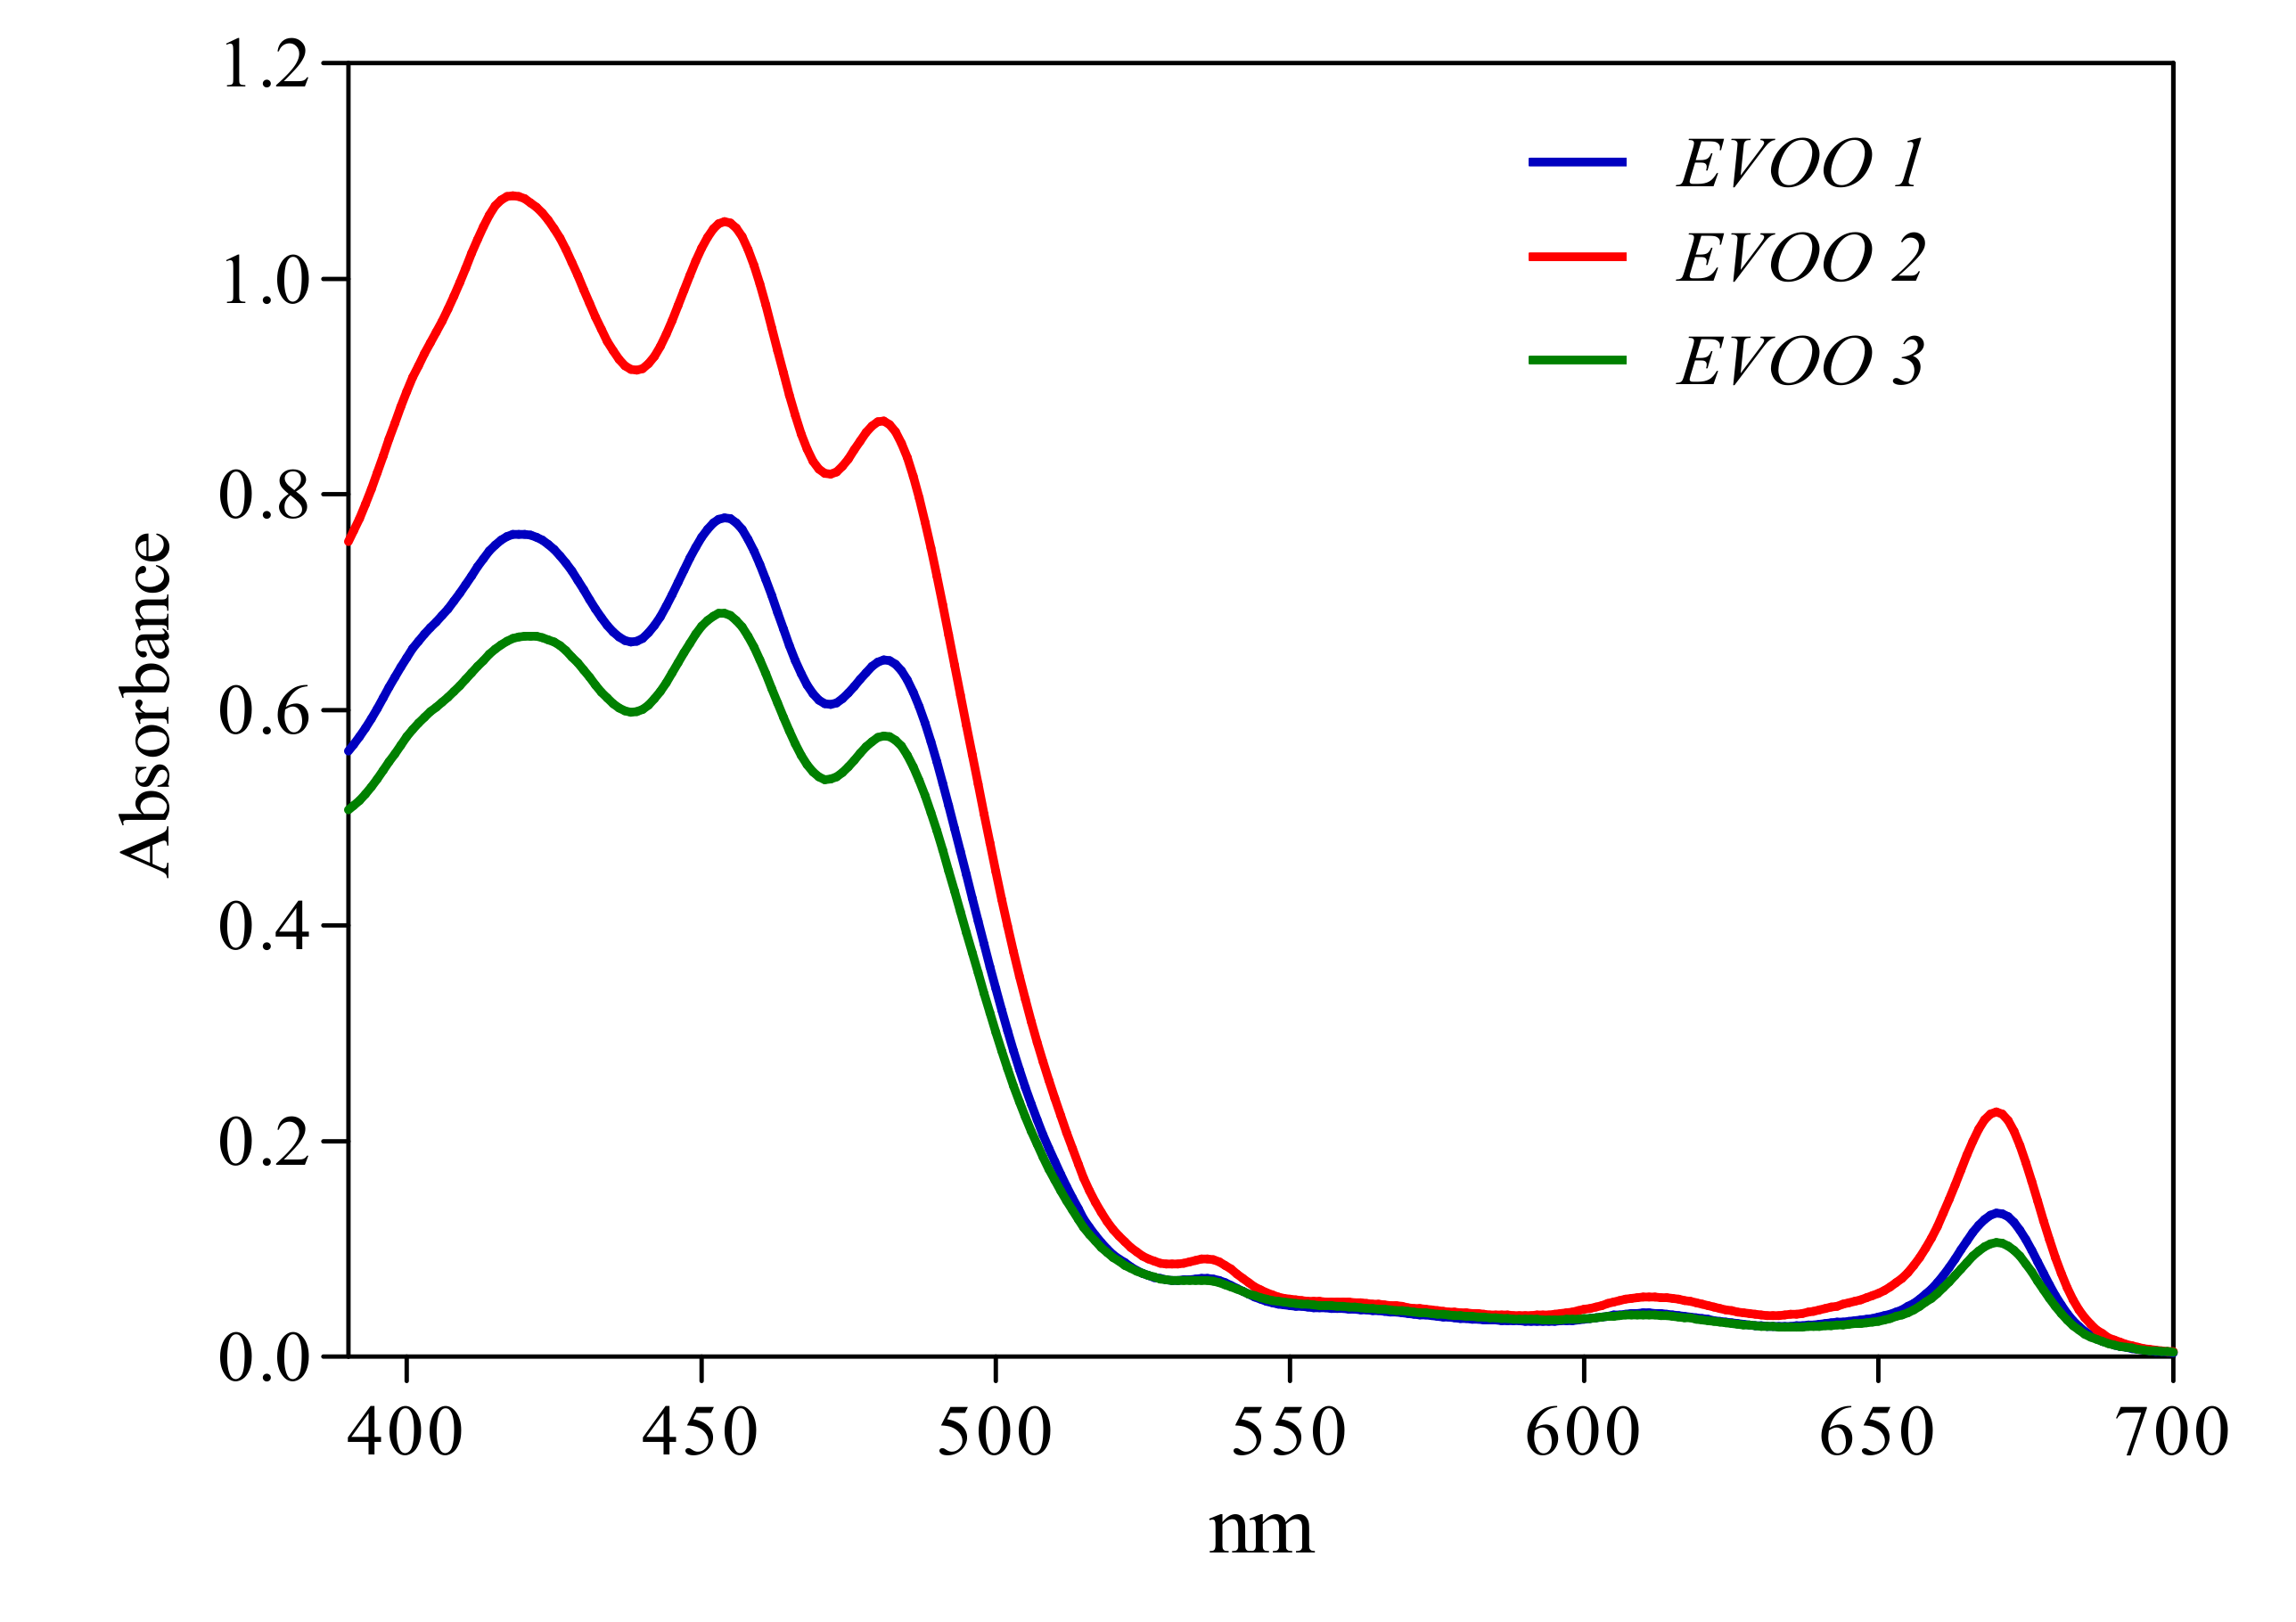
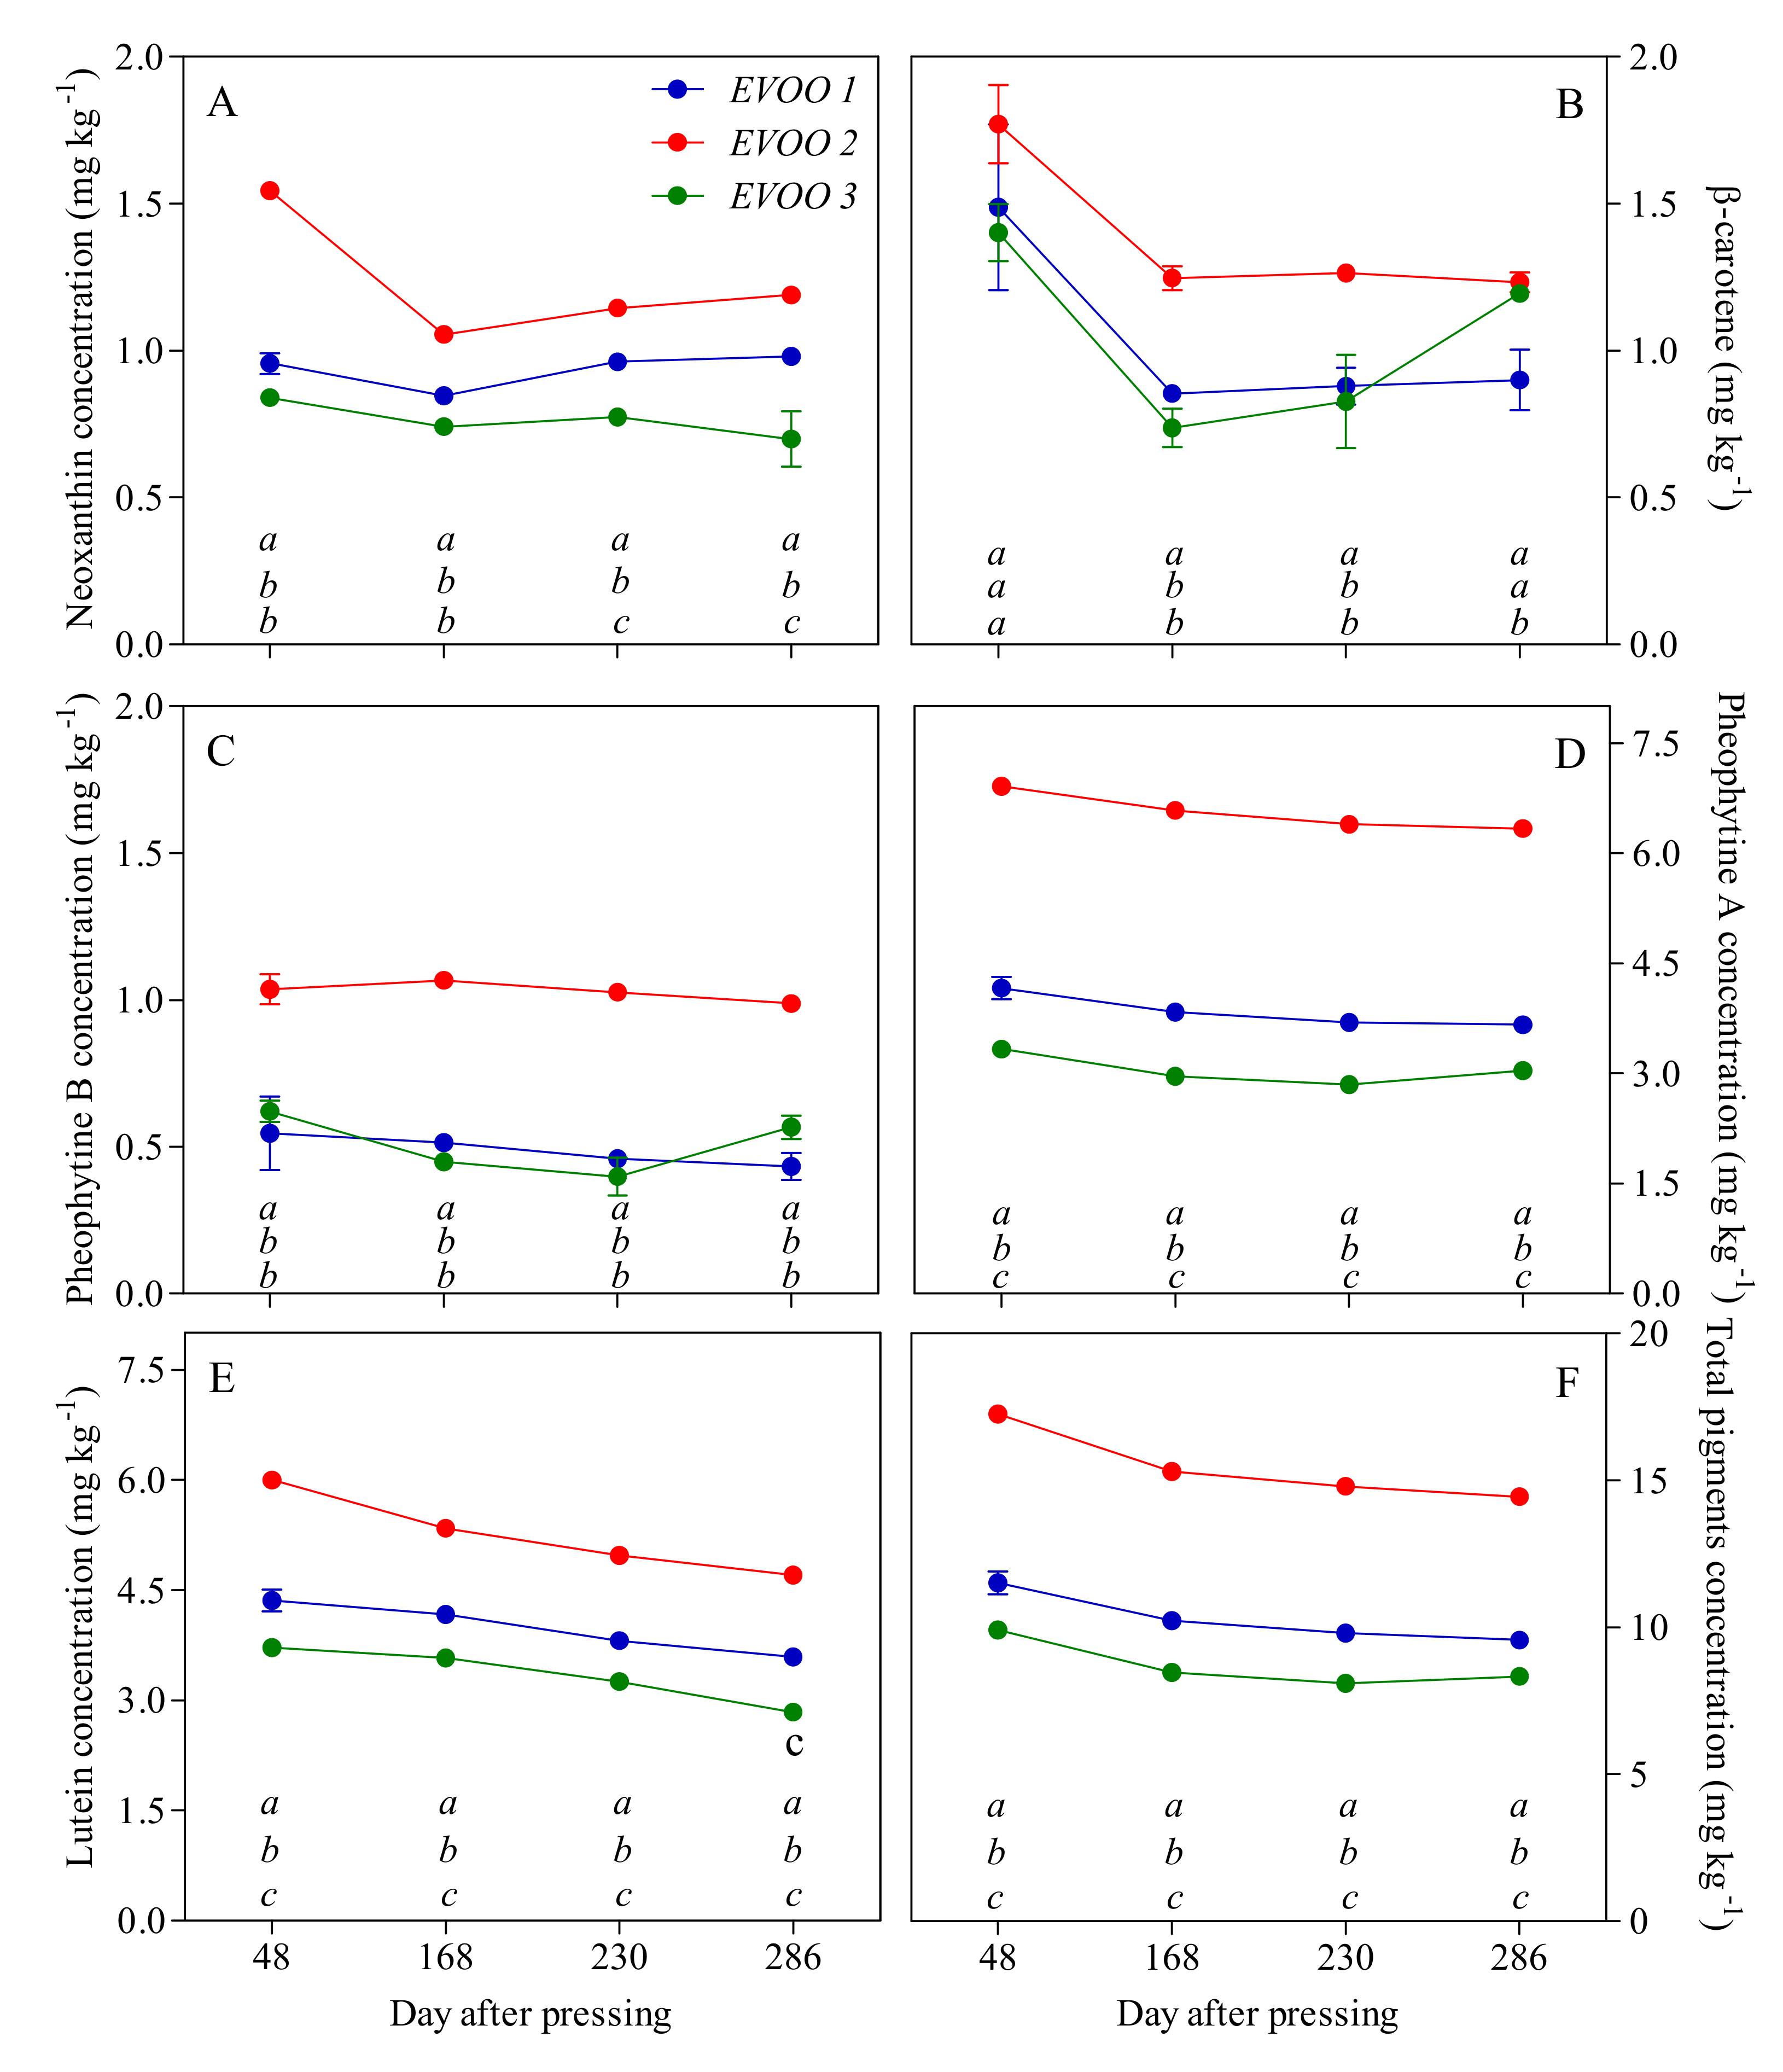
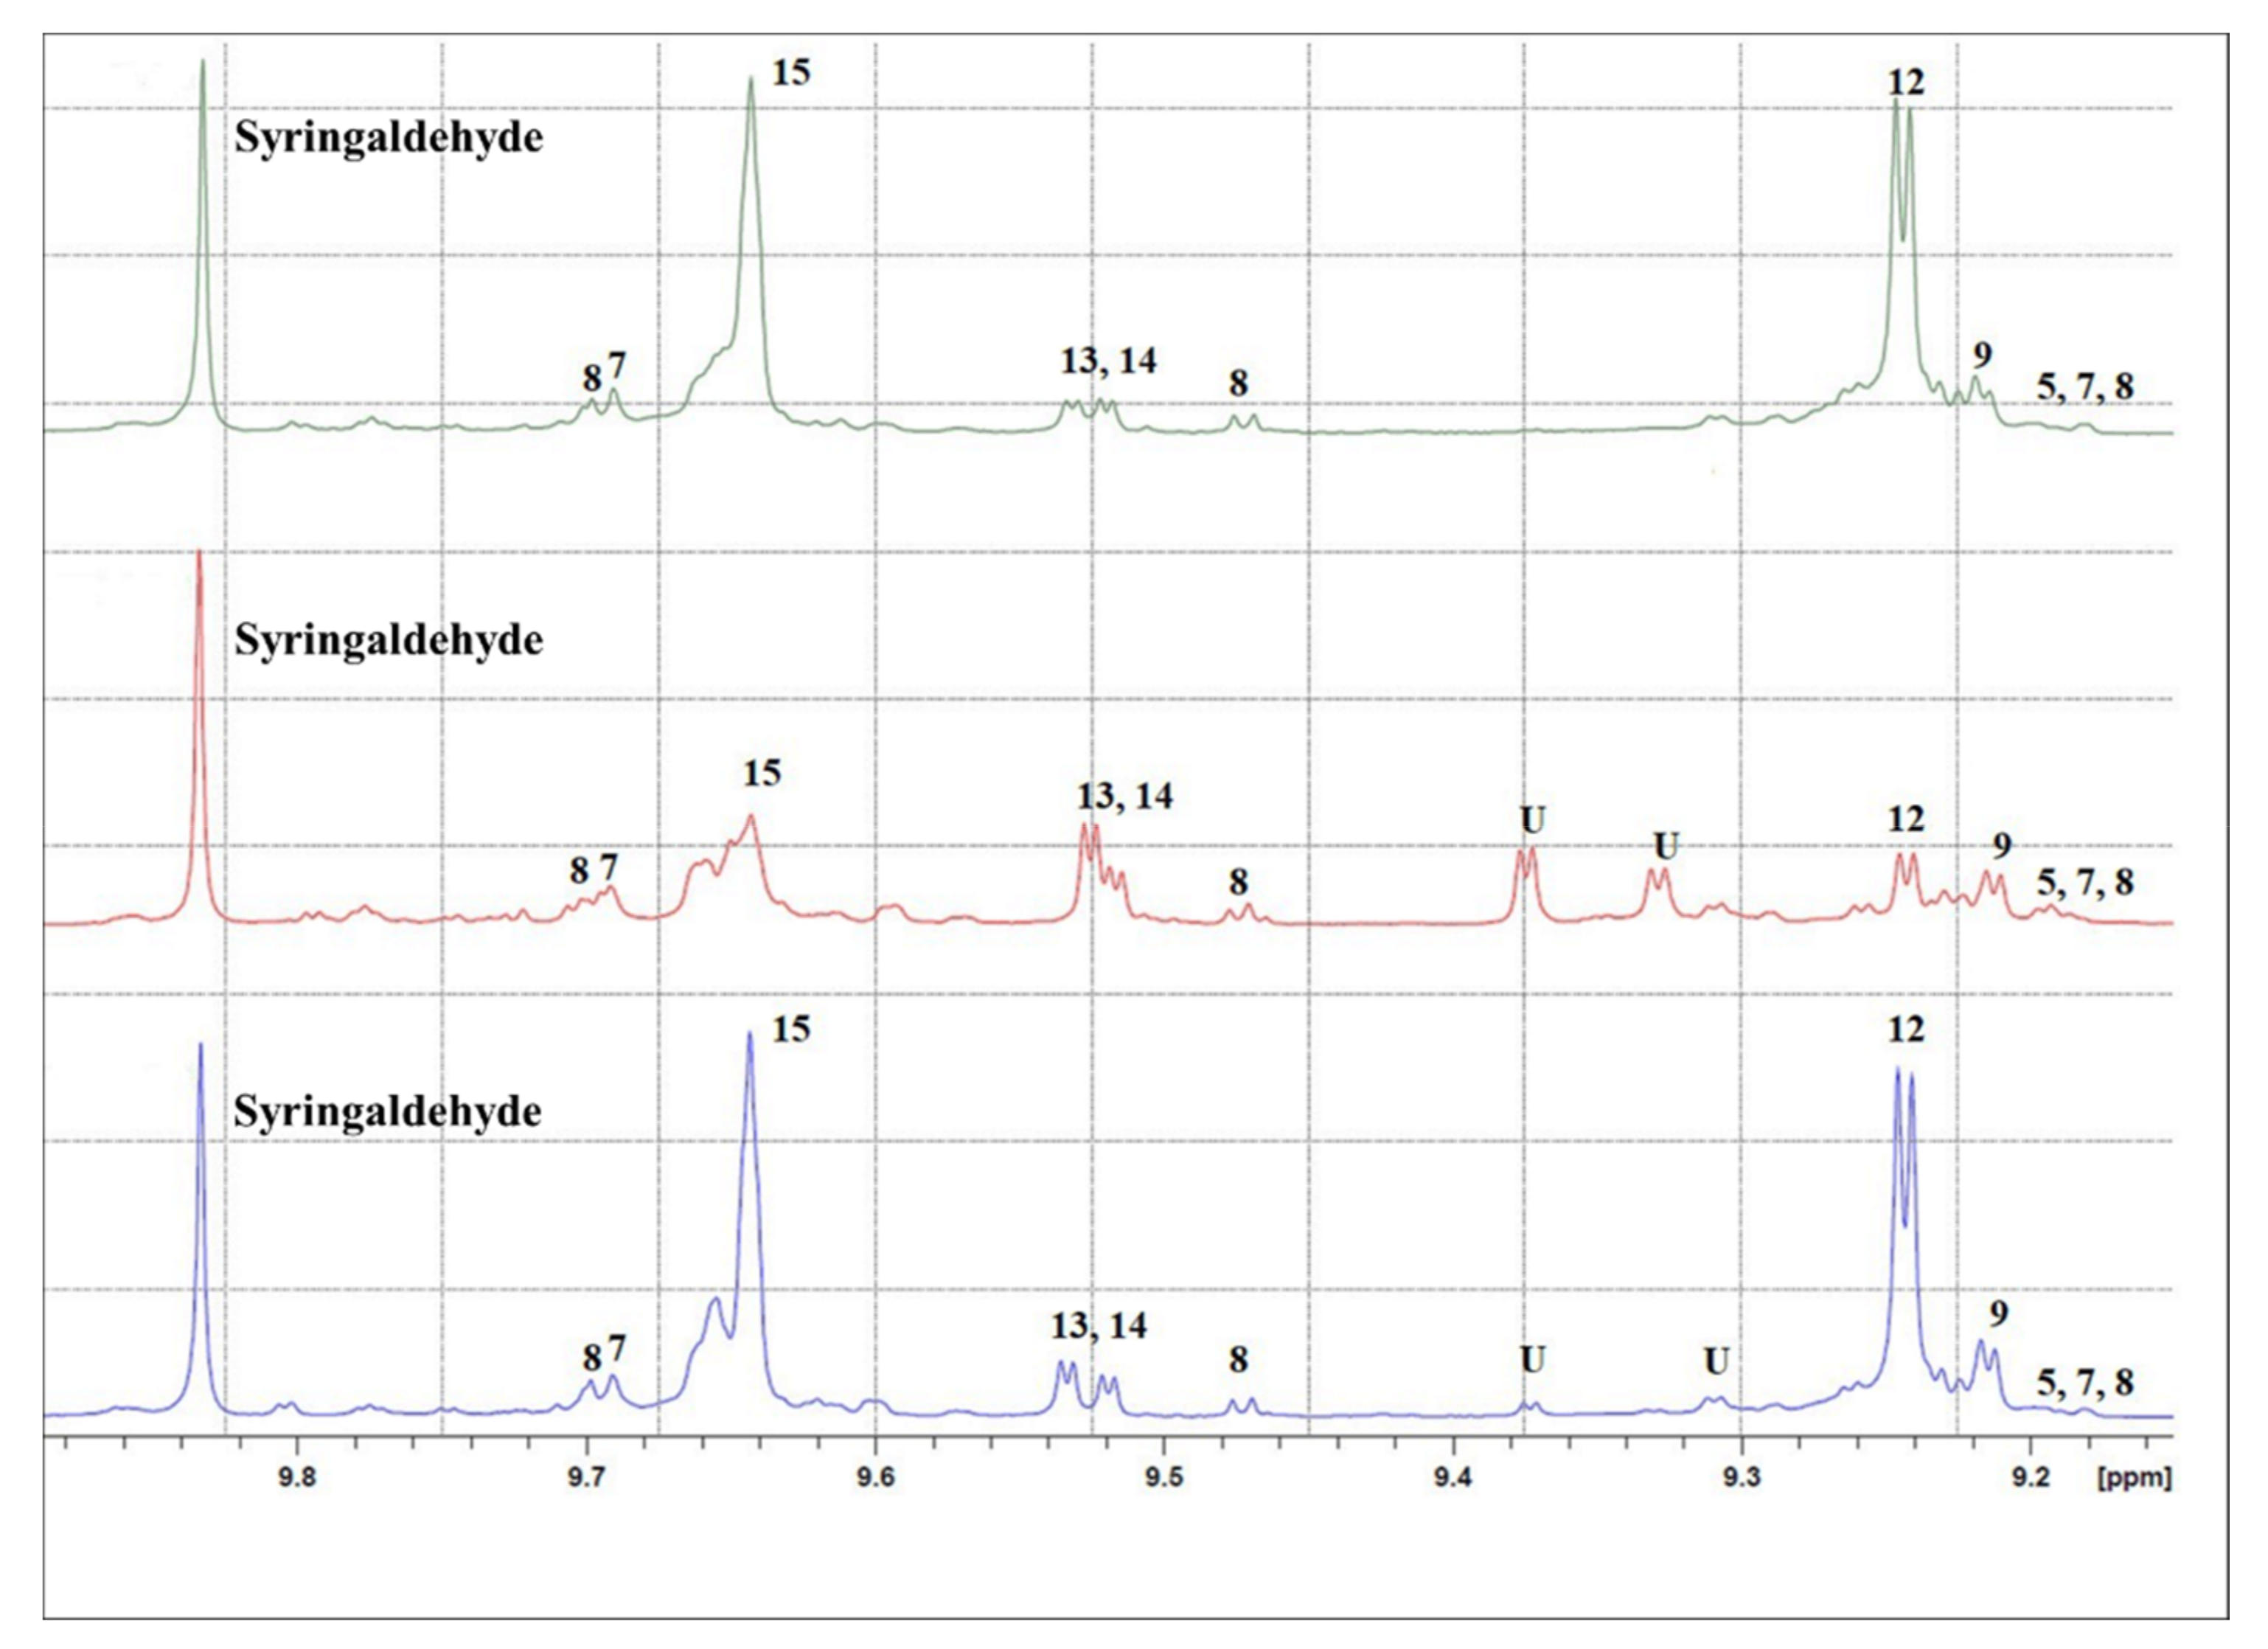
3.2. EVOO Analyses
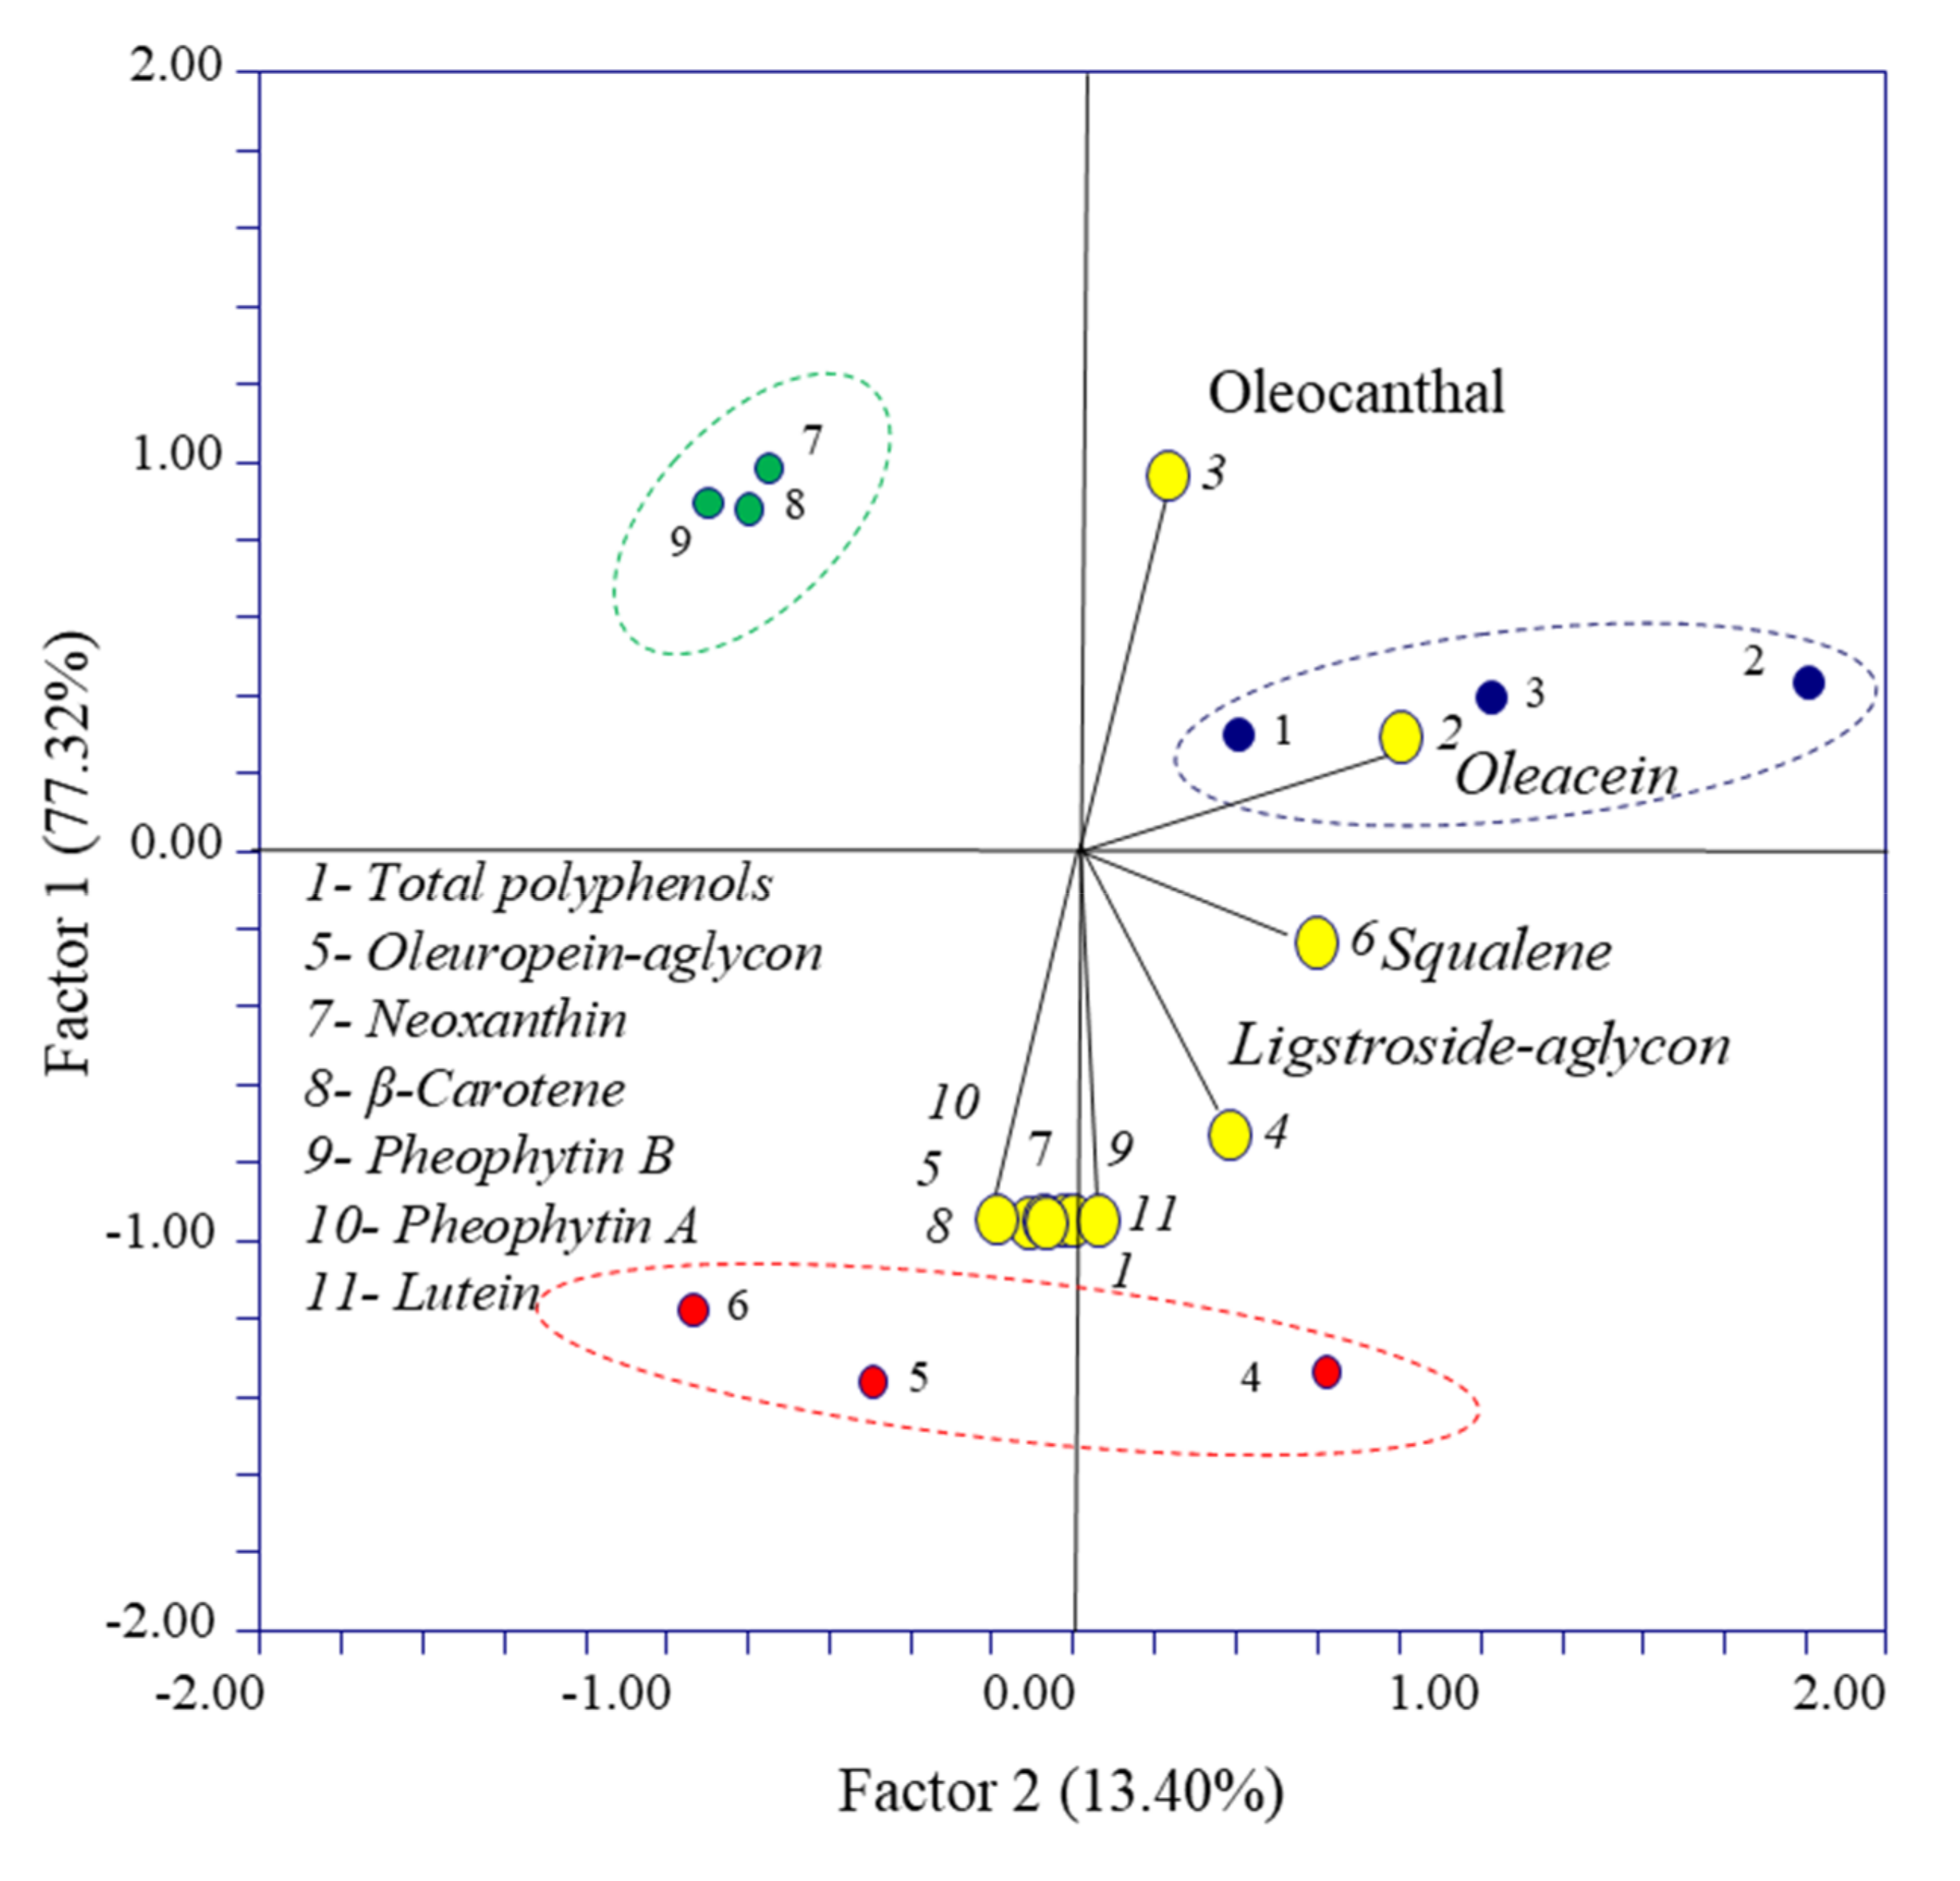
3.3. PCA Results
4. Discussion
5. Conclusions
Supplementary Materials
Author Contributions
Funding
Acknowledgments
Conflicts of Interest
References
- Afsah-Hejri, L.; Hajeb, P.; Ara, P.; Ehsani, R.J. A Comprehensive Review on Food Applications of Terahertz Spectroscopy and Imaging. Compr. Rev. Food Sci. Food Saf. 2019, 18, 1563–1621. [Google Scholar] [CrossRef]
- Valand, R.; Tanna, S.; Lawson, G.; Bengtstrom, L. A review of Fourier Transform Infrared (FTIR) spectroscopy used in food adulteration and authenticity investigations. Food Addit. Contam. Part A 2020, 37, 19–38. [Google Scholar] [CrossRef] [PubMed]
- McGrath, T.F.; Haughey, S.A.; Patterson, J.; Fauhl-Hassek, C.; Donarski, J.; Alewijn, M.; van Ruth, S.; Elliott, C.T. What are the scientific challenges in moving from targeted to non-targeted methods for food fraud testing and how can they be addressed—Spectroscopy case study. Trends Food Sci. Technol. 2018, 76, 38–55. [Google Scholar] [CrossRef]
- Sorensen, K.M.; Khakimov, B.; Engelsen, S.B. The use of rapid spectroscopic screening methods to detect adulteration of food raw materials and ingredients. Curr. Opin. Food Sci. 2016, 10, 45–51. [Google Scholar] [CrossRef]
- Lohumi, S.; Lee, S.; Lee, H.; Cho, B.K. A review of vibrational spectroscopic techniques for the detection of food authenticity and adulteration. Trends Food Sci. Technol. 2015, 46, 85–98. [Google Scholar] [CrossRef]
- Hassoun, A.; Guðjónsdóttir, M.; Prieto, M.A.; Garcia-Oliveira, P.; Simal-Gandara, J.; Marini, F.; di Donato, F.; D’Archivio, A.A.; Biancolillo, A. Application of novel techniques for monitoring quality changes in meat and fish products during traditional processing processes: Reconciling novelty and tradition. Processes 2020, 8, 988. [Google Scholar] [CrossRef]
- Wang, L.; Pang, S.; Zhou, G. Recent advances in spectroscopy technology for trace analysis of persistent organic pollutants. Appl. Sci. 2019, 9, 3439. [Google Scholar] [CrossRef]
- Sobolev, A.P.; Thomas, F.; Donarski, J.; Ingallina, C.; Circi, S.; Marincola, F.C.; Capitani, D.; Mannina, L. Use of NMR applications to tackle future food fraud issues. Trends Food Sci. Technol. 2019, 91, 347–353. [Google Scholar] [CrossRef]
- Dais, P.; Hatzakis, E. Quality assessment and authentication of virgin olive oil by NMR spectroscopy: A critical review. Anal. Chim. Acta 2013, 765, 1–27. [Google Scholar] [CrossRef]
- Lazzerini, C.; Cifelli, M.; Domenici, V. Pigments in extra virgin olive oils produced in different Mediterranean countries in 2014: Near UV-vis spectroscopy versus HPLC-DAD. LWT Food Sci. Technol. 2017, 84, 586–594. [Google Scholar] [CrossRef]
- Valli, E.; Bendini, A.; Berardinelli, A.; Ragni, L.; Ricco, B.; Grossi, M.; Gallina Toschi, T. Rapid and innovative instrumental approaches for quality and authenticity of olive oils. Eur. J. Lipid Sci. Technol. 2016, 118, 1601–1619. [Google Scholar] [CrossRef]
- Meenu, M.; Cai, Q.; Xu, B. A critical review on analytical techniques to detect adulteration of extra virgin olive oil. Trends Food Sci. Technol. 2019, 91, 391–408. [Google Scholar] [CrossRef]
- Ok, S. Detection of olive oil adulteration by low-field NMR relaxometry and UV-Vis spectroscopy upon mixing olive oil with various edible oils. Grasas Y Aceites 2017, 68, e173. [Google Scholar] [CrossRef]
- Agiomyrgianaki, A.; Petrakis, P.V.; Dais, P. Detection of refined olive oil adulteration with refined hazelnut oil by employing NMR spectroscopy and multivariate statistical analysis. Talanta 2010, 80, 2165–2171. [Google Scholar] [CrossRef] [PubMed]
- Mahesar, S.A.; Lucarini, M.; Durazzo, A.; Santini, A.; Lampe, A.I.; Kiefer, J. Application of Infrared Spectroscopy for Functional Compounds Evaluation in Olive Oil: A Current Snapshot. J. Spectrosc. 2019, 2019, 5319024. [Google Scholar] [CrossRef]
- Nenadis, N.; Tsimidou, M.Z. Perspective of vibrational spectroscopy analytical methods in on-field/official control of olives and virgin olive oil. Eur. J. Lipid Sci. Tech. 2017, 119, 1600148. [Google Scholar] [CrossRef]
- Casale, M.; Simonetti, R. Review: Near infrared spectroscopy for analysing olive oils. J. Near Infrared Spectr. 2014, 22, 59–80. [Google Scholar] [CrossRef]
- Gertz, C.; Matthaus, B.; Willenberg, I. Detection of Soft-Deodorized Olive Oil and Refined Vegetable Oils in Virgin Olive Oil Using Near Infrared Spectroscopy and Traditional Analytical Parameters. Eur. J. Lipid Sci. Technl. 2020, 122, 1900355. [Google Scholar] [CrossRef]
- Sohng, W.; Park, Y.; Jang, D.; Cha, K.; Jung, Y.M.; Chung, H. Incorporation of two-dimensional correlation analysis into discriminant analysis as a potential tool for improving discrimination accuracy: Near-infrared spectroscopic discrimination of adulterated olive oils. Talanta 2020, 212, 120748. [Google Scholar] [CrossRef]
- el Orche, A.; Bouatia, M.; Mbarki, M. Rapid analytical method to characterize the freshness of olive oils using fluorescence spectroscopy and chemometric algorithms. J. Anal. Met. Chem. 2020, 2020, 8860161. [Google Scholar] [CrossRef]
- Ali, H.; Iqbal, M.A.; Atta, B.M.; Ullah, R.; Khan, M.B. Phenolic Profile and Thermal Stability of Monovarietal Extra Virgin Olive Oils Based on Synchronous Fluorescence Spectroscopy. J. Fluo. 2020, 30, 939–947. [Google Scholar] [CrossRef] [PubMed]
- Torrecilla, J.S.; Rojo, E.; Domínguez, J.C.; Rodríguez, F.A. Novel Method To Quantify the Adulteration of Extra Virgin Olive Oil with Low-Grade Olive Oils by UV−Vis. J. Agric. Food Chem. 2010, 58, 1679–1684. [Google Scholar] [CrossRef] [PubMed]
- Casale, M.; Armanino, C.; Casolino, C.; Forina, M. Combining information from headspace mass spectrometry and visible spectroscopy in the classification of the Ligurian olive oils. Anal. Chim. Acta 2007, 589, 89–95. [Google Scholar] [CrossRef] [PubMed]
- Casale, M.; Oliveri, P.; Casolino, C.; Sinelli, N.; Zunin, P.; Armanino, C.; Forina, M.; Lanteri, S. Characterisation of PDO olive oil Chianti Classico by non-selective (UV-Visible, NIR and MIR spectroscopy) and selective (fatty acid composition) analytical techniques. Anal. Chim. Acta 2012, 712, 56–63. [Google Scholar] [CrossRef] [PubMed]
- Gonçalves, R.P.; Março, P.H.; Valderrama, P. Thermal edible oil evaluation by UV-Vis spectroscopy and chemometrics. Food Chem. 2014, 163, 83–86. [Google Scholar] [CrossRef]
- Domenici, V.; Ancora, D.; Cifelli, M.; Serani, A.; Veracini, C.A.; Zandomeneghi, M. Extraction of Pigment Information from Near-UV Vis absorption spectra of Extra Virgin Olive oils. J. Agric. Food Chem. 2014, 62, 9317–9325. [Google Scholar] [CrossRef]
- Buti, F. Implementation of a Spectroscopic Method to Determine Pigments’ Content in Olive Oil. Master’s Thesis, University of Pisa, Pisa, Italy, 2016. [Google Scholar]
- Borrello, E.; Domenici, V. Determination of pigments in virgin and extra-virgin olive oils: A comparison between two Near UV-Vis Spectroscopic Techniques. Foods 2019, 8, 18. [Google Scholar] [CrossRef]
- Lazzerini, C.; Domenici, V. Pigments in extra-virgin olive oils produced in Tuscany (Italy) in different years. Foods 2017, 6, 25. [Google Scholar] [CrossRef]
- Olmo-Cunillera, A.; Lopez-Yerena, A.; Lozano-Castellon, J.; Tresserra-Rimbau, A.; Vallverdu-Queralt, A.; Perez, M. NMR spectroscopy: A powerful tool for the analysis of polyphenols in extra virgin olive oil. J. Sci. Food Agric. 2020, 100, 1842–1851. [Google Scholar] [CrossRef]
- Dais, P.; Spyros, A. P31 NMR spectroscopy in the quality control and authentication of extra-virgin olive oil: A review of recent progress. Magn. Reson. Chem. 2007, 45, 367–377. [Google Scholar] [CrossRef]
- Spyros, A.; Dais, P. Application of 31P NMR Spectroscopy in Food Analysis. 1. Quantitative determination of the mono- and diglyceride composition of olive oils. J. Agric. Food Chem 2000, 48, 802–805. [Google Scholar] [CrossRef] [PubMed]
- Sacchi, R.; Mannina, L.; Fiordiponti, P.; Barone, P.; Paolillo, L.; Patumi, M.; Segre, A. Characterization of Italian extra virgin olive oils using H1 NMR spectroscopy. J. Agric. Food Chem. 1998, 46, 3947–3951. [Google Scholar] [CrossRef]
- Barison, A.; Pereira da Silva, W.; Campos, F.R.; Simonelli, F.; Lenz, C.A.; Ferreira, A.G. A simple methodology for the determination of fatty acid composition in edible oils through 1H NMR spectroscopy. Mang. Reson.Chem. 2010, 48, 642–650. [Google Scholar]
- Mannina, L.; Patumi, M.; Proietti, N.; Bassi, D.; Segre, A.L. Geographical characterization of Italian extra virgin olive oils using high-field H1 NMR spectroscopy. J. Agri. Food Chem. 2001, 49, 2687–2696. [Google Scholar] [CrossRef] [PubMed]
- Christophoridou, S.; Dais, P.; Tseng, L.H.; Spraul, M. Separation and identification of phenolic compounds in olive oil by coupling high-performance liquid chromatography with post-column solid-phase extraction to nuclear magnetic resonance spectroscopy (LC-SPE-NMR). J. Agric. Food. Chem. 2005, 53, 4667–4679. [Google Scholar] [CrossRef] [PubMed]
- Perez-Trujillo, M.; Gomez-Caravaca, A.M.; Segura-Carretero, A.; Fernandez-Gutierrez, A.; Parella, T. Separation and Identification of Phenolic Compounds of Extra Virgin Olive Oil from Olea europaea L. by HPLC-DAD-SPE-NMR/MS. Identification of a new diastereoisomer of the aldehydic form of oleuropein aglycone. J. Agric. Food Chem. 2010, 58, 9129–9136. [Google Scholar] [CrossRef] [PubMed]
- Fauhl, C.; Reniero, F.; Guillou, C. 1H NMR as a tool for the analysis of mixtures of virgin olive oil with oils of different botanical origin. Magn. Reson. Chem. 2000, 38, 436–443. [Google Scholar] [CrossRef]
- Girelli, C.R.; del Coco, L.; Zelasco, S.; Salimonti, A.; Conforti, F.L.; Biagianti, A.; Barbini, D.; Fanizzi, F.P. Traceability of “Tuscan PGI” Extra Virgin Olive Oils by H NMR Metabolic Profiles Collection and Analysis. Metabolites 2018, 8, 60. [Google Scholar] [CrossRef]
- Mannina, L.; Luchinat, C.; Patumi, M.; Emanuele, M.C.; Rossi, E.; Segre, A. Concentration dependence of C-13 NMR spectra of triglycerides: Implications for the NMR analysis of olive oils. Magn. Reson. Chem. 2000, 38, 886–890. [Google Scholar] [CrossRef]
- D’Imperio, M.; Gobbino, M.; Picanza, A.; Costanzo, S.; Della Corte, A.; Mannina, L. Influence of harvest method and period on olive oil composition: An NMR and statistical study. J. Agric. Food Chem. 2010, 58, 11043–11051. [Google Scholar] [CrossRef]
- del Coco, L.; de Pascali, S.A.; Iacovelli, V.; Cesari, G.; Schena, F.P.; Fanizzi, F.P. Following the olive oil production chain: 1D and 2D NMR study of olive paste, pomace, and oil. Eur. J. Lipid Sci. Technol. 2014, 116, 1513–1521. [Google Scholar] [CrossRef]
- Reddy, G.N.M.; Mannina, L.; Sobolev, A.P.; Caldarelli, S. Polyphenols Fingerprinting in Olive Oils Through Maximum-Quantum NMR Spectroscopy. Food Anal. Methods 2018, 11, 1012–1020. [Google Scholar] [CrossRef]
- Uceda, M.; Frias, L. Trend of the quality and quantitative composition of olive fruit oil during ripening. In Proceedings of the International Meeting on Olive Oil, Cordoba, Spain, 6–17 October 1975; pp. 25–46. [Google Scholar]
- Goldsmith, C.D.; Stathopoulos, C.E.; Golding, J.B.; Roach, D.P. Fate of the phenolic compounds during olive oil production with the traditional press method. Int. Food Res. J. 2014, 21, 101–109. [Google Scholar]
- Ruiz-Aracama, A.; Goicoechea, E.; Guillen, M.D. Direct study of minor extra-virgin olive oil components without any sample modification. 1H NMR multisupression experiment: A powerful tool. Food Chem. 2017, 228, 301–314. [Google Scholar] [CrossRef]
- Mannina, L.; Sobolev, A.P. High resolution NMR characterization of olive oils in terms of quality, authenticity and geographical origin. Magn. Reson. Chem. 2011, 49, S3–S11. [Google Scholar] [CrossRef]
- Guillen, M.D.; Uriarte, P.S. Relationships between the evolution of the percentage in weight of polar compounds and that of the molar percentage of acyl groups of edible oils submitted to frying temperature. Food Chem. 2013, 138, 1351–1354. [Google Scholar] [CrossRef]
- Karkoula, E.; Shantzari, A.; Melliou, E.; Magiatis, P. Direct Measurement of Oleocanthal and Oleacein Levels in Olive Oil by Quantitative 1H NMR. Establishment of a New Index for the Characterization of Extra Virgin Olive Oils. J. Agric. Food Chem. 2012, 60, 11696–11703. [Google Scholar] [CrossRef]
- Karkoula, E.; Skantzari, A.; Meliou, E.; Magiatis, P. Quantitative Measurement of Major Secoiridoid Derivatives in Olive Oil Using qNMR. Proof of the Artificial Formation of Aldehydic Oleuropein and Ligstroside Aglycon Isomers. J. Agric. Food Chem. 2014, 62, 600–607. [Google Scholar] [CrossRef]
- Nam, A.M.; Bighelli, A.; Tomi, F.; Casanova, J.; Paoli, M. Quantification of Squalene in Olive Oil Using 13C Nuclear Magnetic Resonance Spectroscopy. Magnetochemistry 2017, 3, 34. [Google Scholar] [CrossRef]
- Merchak, N.; Silvestre, V.; Loquet, D.; Rizk, T.; Akoka, S.; Bejjani, J. A strategy for simultaneous determination of fatty acid composition, fatty acid position, and position-specific isotope contents in triacylglycerol matrices by C-13-NMR. Anal. Bioanal. Chem. 2017, 409, 307–315. [Google Scholar] [CrossRef]
- Mansour, A.B.; Gargouri, B.; Flamini, G.; Bouaziz, M. Effect of agricultural sites on differentiation between Chemlali and Neb Jmel olive oils. Oleo Sci. 2015, 64, 381–392. [Google Scholar] [CrossRef] [PubMed]
- Aguilera, M.P.; Beltrán, G.; Ortega, D.; Fernández, A.; Jiménez, A.; Uceda, M. Characterization of virgin olive oil of Italian olive cultivars: ‘Frantoio’ and ‘Leccino’, grown in Andalusia. Food Chem. 2005, 89, 387–391. [Google Scholar] [CrossRef]
- Bengana, M.; Bakhouche, A.; Lozano-Sánchez, J.; Amir, Y.; Youyou, A.; Segura-Carretero, A.; Fernández-Gutiérrez, A. Influence of olive ripeness on chemical properties and phenolic composition of Chemlal extra-virgin olive oil. Food Res. Int. 2013, 54, 1868–1875. [Google Scholar] [CrossRef]
- Jimenez-Herrera, B.; Rivas-Velasco, A.; Sanchez-Ortiz, A.; Lorenzo-Tovar, M.L.; Ubeda-Muñoz, M.; Callejon, R.; de Quirós, E.O.B. Influencia del proceso de maduración del fruto en la calidad sensorial de aceites de oliva virgen de las variedades Picual, Hojiblanca y Picudo. Grasas Aceites 2012, 63, 403–410. [Google Scholar] [CrossRef]
- Rotondi, A.; Bendini, A.; Cerretani, L.; Mari, M.; Lercker, G.; Toschi, T.G. Effect of olive ripening degree on the oxidative stability and organoleptic properties of cv. Nostrana di Brisighella extra virgin olive oil. J. Agric. Food Chem. 2004, 52, 3649–3654. [Google Scholar]
- Fang, M.; Tsai, C.-F.; Wu, G.-Y.; Tseng, S.-H.; Cheng, H.-F.; Kuo, C.-H.; Hsu, C.-L.; Kao, Y.-M.; Shih, D.Y.; Chiang, Y.-M. Identification and quantification of Cu-chlorophyll adulteration of edible oils. Food Addit. Contam. Part B Surveill 2015, 8, 157–162. [Google Scholar] [CrossRef] [PubMed]
- Gorzynik-Debicka, M.; Przychodzen, P.; Cappello, F.; Kuban-Janowska, A.; Marino Gamazza, A.; Wozniak, M.; Gorska-Ponikowska, M. Potential Health Benefits of Olive Oil and Plant Polyphenols. Int. J. Mol. Sci. 2018, 19, 547. [Google Scholar] [CrossRef]
- Cecchi, L.; Migliorini, M.; Cherubini, C.; Giusti, M.; Zanoni, B.; Innocenti, M.; Mulinacci, N. Phenolic profiles, oil amount and sugar content during olive ripening of three typical Tuscan cultivars to detect the best harvesting time for oil production. Food. Res. Int. 2013, 54, 1876–1884. [Google Scholar] [CrossRef]
- Ortega-García, F.; Blanco, S.; Peinado, M.A.; Peragón, J. Polyphenol Oxidase and Its Relationship with Oleuropein Concentration in Fruits and Leaves of Olive (Olea europaea) cv. “Picual” Trees during Fruit Development. Tree Physiol. 2008, 28, 45–54. [Google Scholar]
- Sánchez, R.; García-Vico, L.; Sanz, C.; Pérez, A.G. An aromatic aldehyde synthase controls the synthesis of hydroxytyrosol derivatives present in virgin olive oil. Antioxidants 2019, 8, 352. [Google Scholar] [CrossRef]
- Barbieri, S.; Bendini, A.; Valli, E.; Gallina-Toschi, T. Do consumers recognize the positive sensorial attributes of extra virgin olive oils related with their composition? A case study on conventional and organic products. J. Food Compos. Anal. 2015, 44, 186–195. [Google Scholar] [CrossRef]
- Montedoro, G.; Servilli, M.; Baldioli, M.; Selvaggini, R.; Miniati, E.; Macchioni, A. Simple and hydrolysable compounds in virgin olive oil. Spectroscopic characterizations of the secoiridoid derivatives. J. Agric. Food Chem. 1993, 41, 2228–2234. [Google Scholar] [CrossRef]
- Pang, K.L.; Chin, K.Y. The biological activities of oleocanthal from a molecular perspective. Nutrients 2018, 10, 570. [Google Scholar] [CrossRef] [PubMed]
- Segura-Carretero, A.; Curiel, J.A. Current disease-targets for oleocanthal as promising natural therapeutic agent. Int. J. Mol. Sci. 2018, 19, 2899. [Google Scholar] [CrossRef]
- Mateos, R.; Cert, A.; Pérez-Camino, M.C.; García, J.M. Evaluation of virgin olive oil bitterness by quantification of secoiridoid derivatives. J. Am. Oil Chem. Soc. 2004, 81, 71–75. [Google Scholar] [CrossRef]
- Servili, M.; Selvaggini, R.; Esposto, S.; Taticchi, A.; Montedoro, G.; Morozzi, G. Health and sensory properties of virgin olive oil hydrophilic phenols: Agronomic and technological aspects of production that affect their occurrence in the oil. J. Chromatogr. A 2004, 1054, 113–127. [Google Scholar] [CrossRef]
- Vlahov, G. Application of NMR to the study of olive oils. Prog. Nucl. Magn. Reson. Spectrosc. 1999, 35, 341–357. [Google Scholar] [CrossRef]
- Vlahov, G. 13C nuclear magnetic resonance spectroscopy to determine olive oil grades. Anal. Chim. Acta 2006, 577, 281–287. [Google Scholar] [CrossRef]


| Total Phenols Content | |
|---|---|
| EVOO 1 | 129.64 ± 3.22 b |
| EVOO 2 | 200.88 ± 1.90 a |
| EVOO 3 | 111.03 ± 2.38 c |
| EVOO 1 | EVOO 2 | EVOO 3 | |
|---|---|---|---|
| Ligstroside aglycone | 27.9 ± 1.43 | 29.9 ± 2.27 | 25.4 ± 1.23 |
| Oleuropein aglycone | 39.6 ± 2.05 b | 67.8 ± 1.80 a | 26.2 ± 2.52 c |
| Total aglycones content | 67.5 ± 2.25 b | 97.7 ± 2.56 a | 51.5 ± 1.56 c |
| Oleacein | 43.1 ± 10.51 | 31.0 ± 4.37 | 31.9 ± 1.64 |
| Oleocanthal | 207.4 ± 13.97 a | 40.0 ± 2.34 b | 193.6 ± 24.56 a |
| Squalene content | 3161 ± 554 | 2906 ± 248 | 2488 ± 78 |
| Variables | PC1 | PC2 | |
|---|---|---|---|
| 1 | Total polyphenols | −0.998 | −0.051 |
| 2 | Oleacein | 0.261 | 0.861 |
| 3 | Oleocanthal | 0.937 | 0.289 |
| 4 | Ligstroside–aglycon | −0.769 | 0.439 |
| 5 | Oleuropein–aglycon | −0.990 | 0.037 |
| 6 | Squalene | −0.270 | 0.650 |
| 7 | Neoxanthin | −0.991 | 0.060 |
| 8 | β-Carotene | −0.988 | −0.012 |
| 9 | Pheophytin-B | −0.987 | −0.129 |
| 10 | Pheophytin-A | −0.997 | −0.007 |
| 11 | Lutein | −0.991 | 0.084 |
Publisher’s Note: MDPI stays neutral with regard to jurisdictional claims in published maps and institutional affiliations. |
© 2020 by the authors. Licensee MDPI, Basel, Switzerland. This article is an open access article distributed under the terms and conditions of the Creative Commons Attribution (CC BY) license (http://creativecommons.org/licenses/by/4.0/).
Share and Cite
Vicario, G.; Francini, A.; Cifelli, M.; Domenici, V.; Sebastiani, L. Near UV-Vis and NMR Spectroscopic Methods for Rapid Screening of Antioxidant Molecules in Extra-Virgin Olive Oil. Antioxidants 2020, 9, 1245. https://doi.org/10.3390/antiox9121245
Vicario G, Francini A, Cifelli M, Domenici V, Sebastiani L. Near UV-Vis and NMR Spectroscopic Methods for Rapid Screening of Antioxidant Molecules in Extra-Virgin Olive Oil. Antioxidants. 2020; 9(12):1245. https://doi.org/10.3390/antiox9121245
Chicago/Turabian StyleVicario, Giulia, Alessandra Francini, Mario Cifelli, Valentina Domenici, and Luca Sebastiani. 2020. "Near UV-Vis and NMR Spectroscopic Methods for Rapid Screening of Antioxidant Molecules in Extra-Virgin Olive Oil" Antioxidants 9, no. 12: 1245. https://doi.org/10.3390/antiox9121245
APA StyleVicario, G., Francini, A., Cifelli, M., Domenici, V., & Sebastiani, L. (2020). Near UV-Vis and NMR Spectroscopic Methods for Rapid Screening of Antioxidant Molecules in Extra-Virgin Olive Oil. Antioxidants, 9(12), 1245. https://doi.org/10.3390/antiox9121245