Chemical Composition and Antioxidant Activity of the Main Fruits Consumed in the Western Coastal Region of Ecuador as a Source of Health-Promoting Compounds


 , and
, and
Abstract
1. Introduction
2. Material and Methods
2.1. Fruit Samples
2.2. Determination of Total Phenolic, Total Flavonoid, and Total Anthocyanin Contents
2.3. Equipment and Conditions for the HPLC-DAD Analysis
2.3.1. Vitamin C Content Analysis
2.3.2. Carotenoid Content Analysis
2.3.3. Organic Acids Content Analysis
2.4. HPLC-Refractive Index Detector Analysis of Glucose, Fructose, and Sucrose Contents
2.5. Determination of Total Antioxidant Capacity (TAC)
2.6. Statistical Analysis
3. Results and Discussion
3.1. Total Phenolic, Flavonoid, Anthocyanin, and Vitamin C Contents
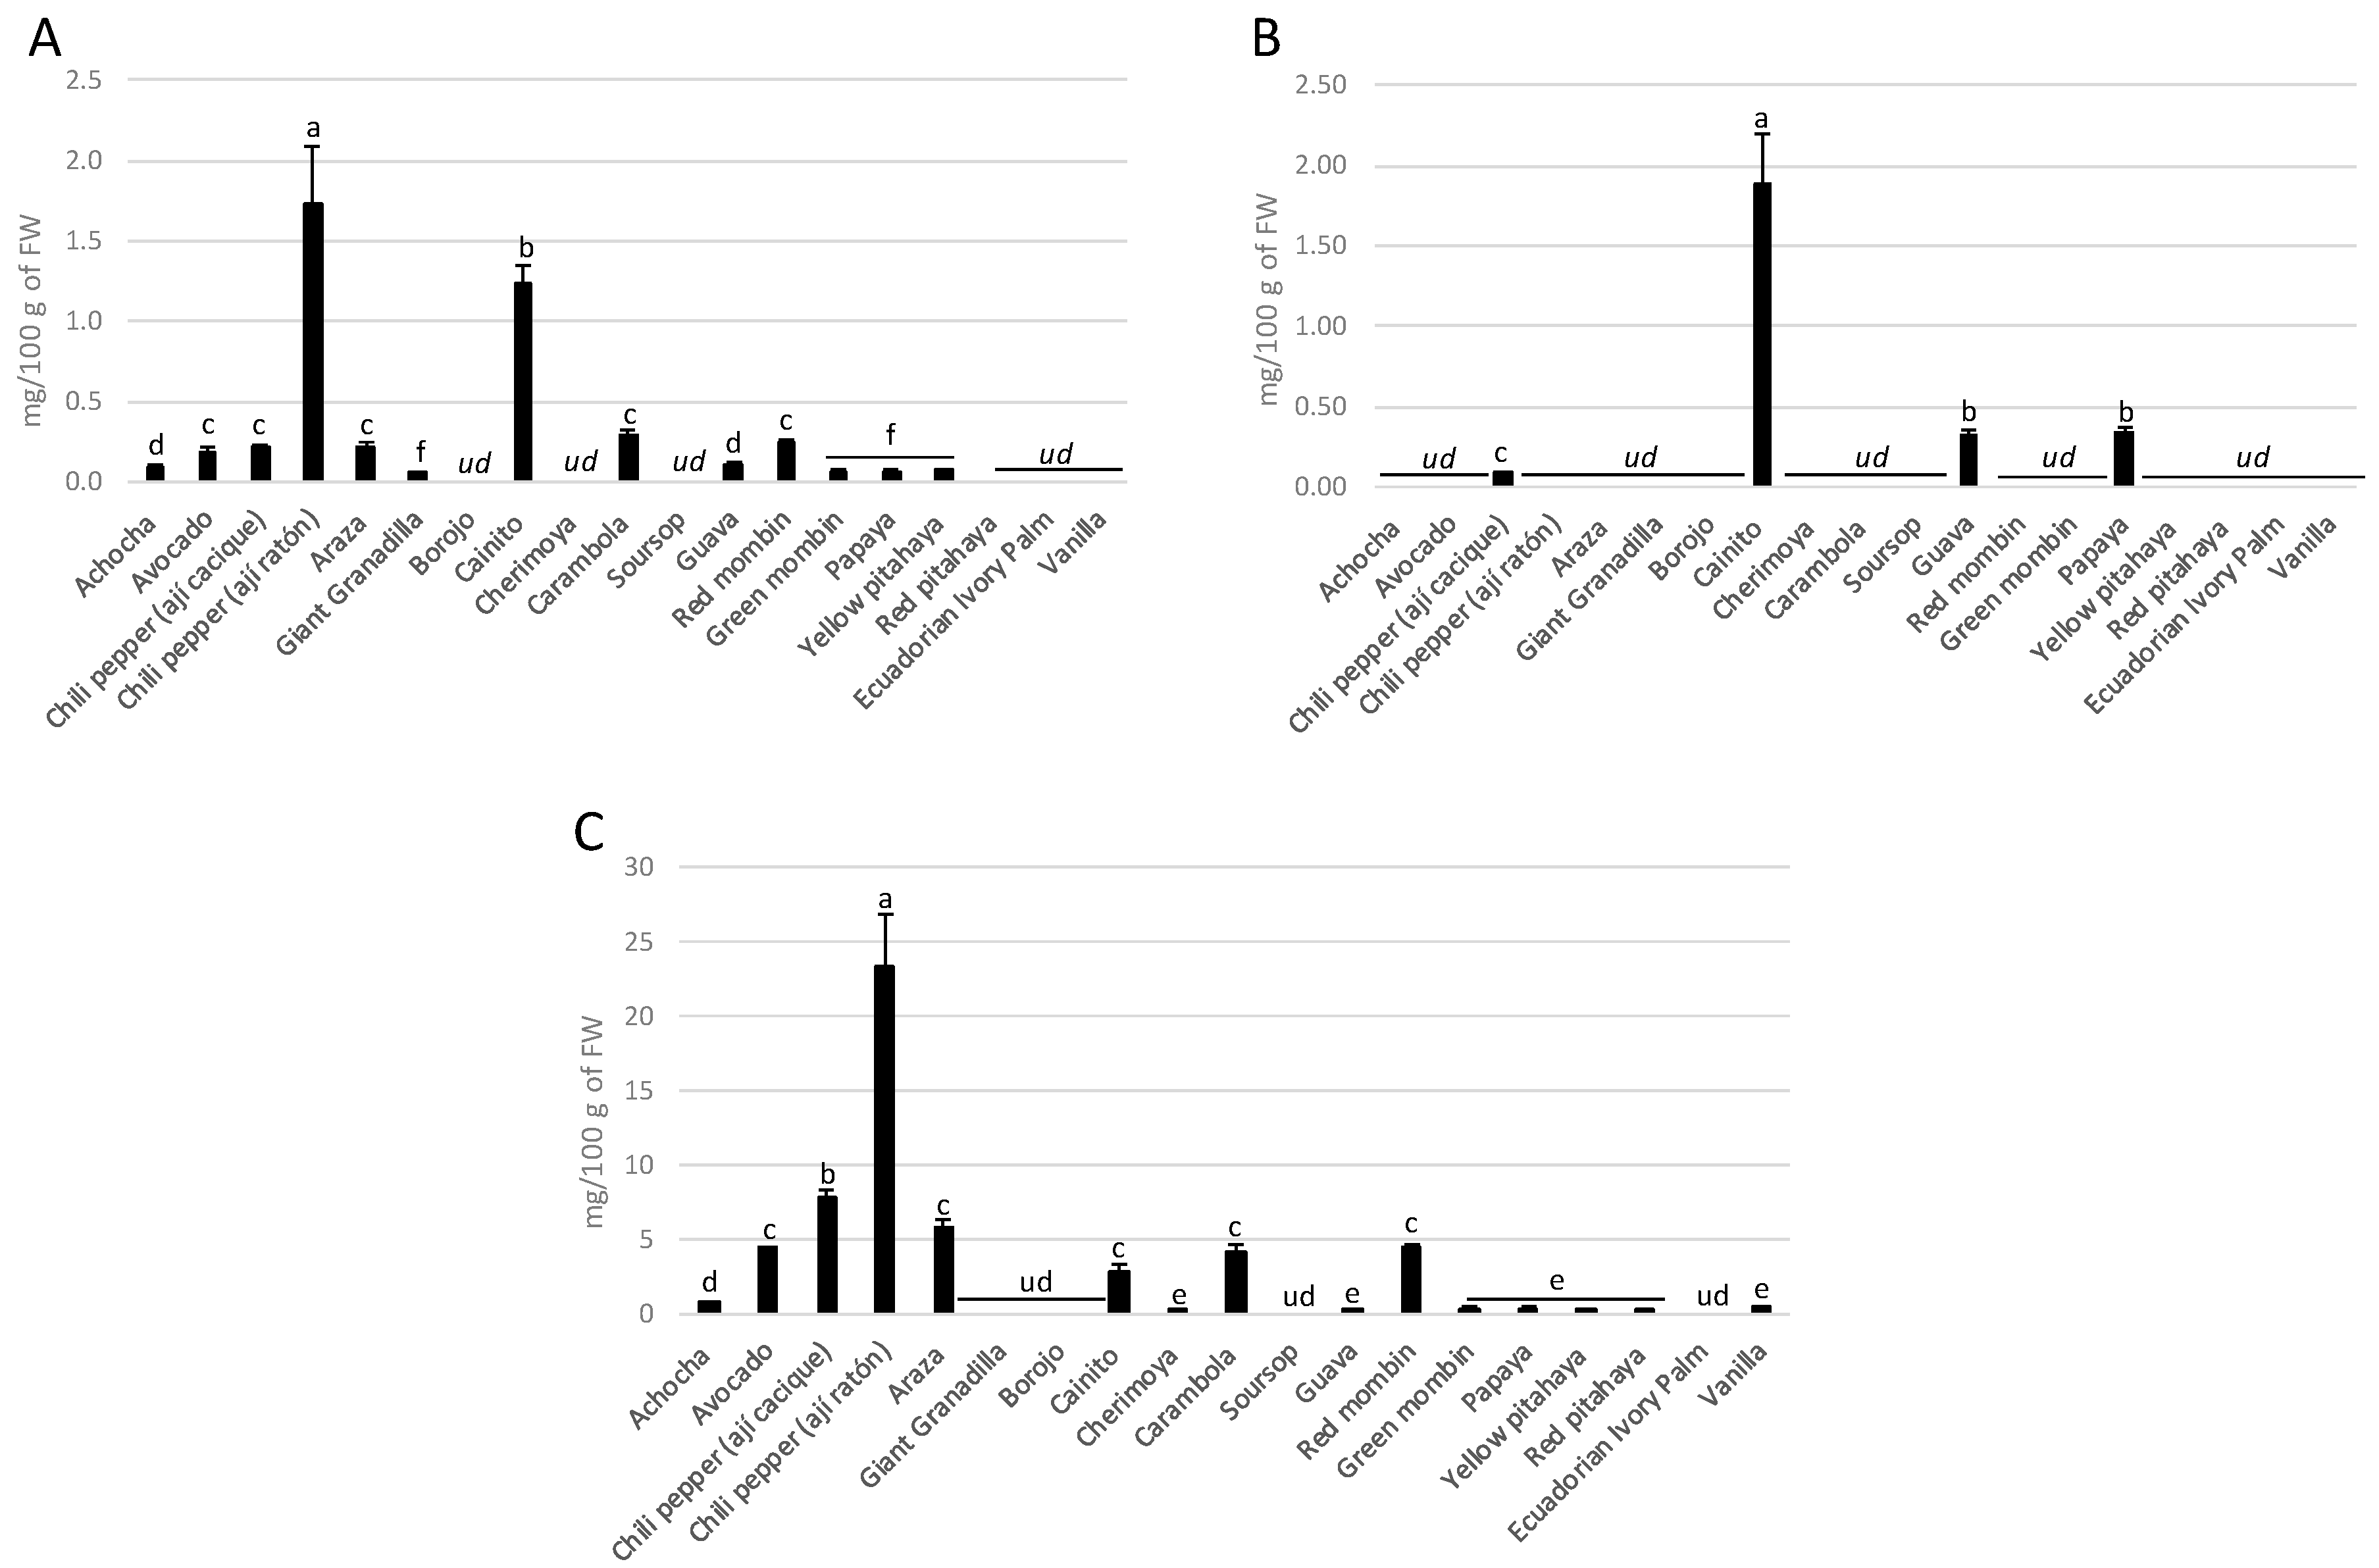
3.2. Total Carotenoid Content
3.3. Organic Acids Contents
3.4. Sugar Content
3.5. Total Antioxidant Activity
4. Conclusions
Author Contributions
Funding
Conflicts of Interest
References
- De la Torre, L.; Muriel, M.; Navarrete, H.; Macía, M.J.; Balslev, H. Enciclopedia de Las Plantas Útiles Del Ecuador; Herbario QCA & Herbario AAU: Quito, Ecuador; Aarhus, Denmark, 2008; p. 949. [Google Scholar]
- Ahn-Jarvis, J.H.; Parihar, A.; Doseff, A.I. Dietary Flavonoids for Immunoregulation and Cancer: Food Design for Targeting Disease. Antioxidants 2019, 8, 202. [Google Scholar] [CrossRef] [PubMed]
- Rodríguez-García, C.; Sánchez-Quesada, C.; Gaforio, J.J. Dietary Flavonoids as Cancer Chemopreventive Agents: An Updated Review of Human Studies. Antioxidants 2019, 8, 137. [Google Scholar] [CrossRef] [PubMed]
- Slavin, J.L.; Lloyd, B. Health Benefits of Fruits and Vegetables. Adv. Nutr. 2012, 3, 506–516. [Google Scholar] [CrossRef] [PubMed]
- Santhakumar, A.B.; Battino, M.; Alvarez-Suarez, J.M. Dietary Polyphenols: Structures, Bioavailability and Protective Effects against Atherosclerosis. Food Chem. Toxicol. 2018, 113, 49–65. [Google Scholar] [CrossRef] [PubMed]
- Li, Y.; Schellhorn, H.E. New Developments and Novel Therapeutic Perspectives for Vitamin C. J. Nutr. 2018, 137, 2171–2184. [Google Scholar] [CrossRef] [PubMed]
- Alvarez-Suarez, J.M.; Carrillo-Perdomo, E.; Aller, A.; Giampieri, F.; Gasparrini, M.; González-Pérez, L.; Beltrán-Ayala, P.; Battino, M. Anti-Inflammatory Effect of Capuli Cherry against LPS-Induced Cytotoxic Damage in RAW 264.7 Macrophages. Food Chem. Toxicol. 2017, 102, 46–52. [Google Scholar] [CrossRef] [PubMed]
- Zhong, L.; Bornman, J.F.; Wu, G.; Hornoff, A.; Dovi, K.A.P.; Al-Ali, H.; Aslam, N.; Johnson, S.K. The Nutritional and Phytochemical Composition of the Indigenous Australian Pindan Walnut (Terminalia Cunninghamii) Kernels. Plant Foods Hum. Nutr. 2018, 73, 40–46. [Google Scholar] [CrossRef] [PubMed]
- Alvarez-Suarez, J.M.; Giampieri, F.; Gasparrini, M.; Mazzoni, L.; Forbes-Hernández, T.Y.; Afrin, S.; Battino, M. Guava (Psidium guajava L. Cv. Red Suprema) Crude Extract Protect Human Dermal Fibroblasts against Cytotoxic Damage Mediated by Oxidative Stress. Plant Foods Hum. Nutr. 2018, 73, 18–24. [Google Scholar] [CrossRef] [PubMed]
- Vasco, C.; Ruales, J.; Kamal-Eldin, A. Total Phenolic Compounds and Antioxidant Capacities of Major Fruits from Ecuador. Food Chem. 2008, 111, 816–823. [Google Scholar] [CrossRef]
- Vasco, C.; Riihinen, K.; Ruales, J.; Kamal-Eldin, A. Phenolic Compounds in Rosaceae Fruits from Ecuador. J. Agric. Food Chem. 2009, 57, 1204–1212. [Google Scholar] [CrossRef]
- Pérez-Balladares, D.; Castañeda-Terán, M.; Granda-Albuja, M.G.; Tejera, E.; Iturralde, G.; Granda-Albuja, S.; Jaramillo-Vivanco, T.; Giampieri, F.; Battino, M.; Alvarez-Suarez, J.M. Chemical Composition and Antioxidant Activity of the Main Fruits, Tubers and Legumes Traditionally Consumed in the Andean Regions of Ecuador as a Source of Health-Promoting Compounds. Plant Foods Hum. Nutr. 2019, 74, 350–357. [Google Scholar] [CrossRef] [PubMed]
- Alarcón-Barrera, K.S.; Armijos-Montesinos, D.S.; García-Tenesaca, M.; Iturralde, G.; Jaramilo-Vivanco, T.; Granda-Albuja, M.G.; Giampieri, F.; Alvarez-Suarez, J.M. Wild Andean Blackberry (Rubus glaucus Benth) and Andean Blueberry (Vaccinium floribundum Kunth) from the Highlands of Ecuador: Nutritional Composition and Protective Effect on Human Dermal Fibroblasts against Cytotoxic Oxidative Damage. J. Berry Res. 2018, 8, 223–236. [Google Scholar] [CrossRef]
- Giampieri, F.; Gasparrini, M.; Forbes-Hernandez, T.Y.; Mazzoni, L.; Capocasa, F.; Sabbadini, S.; Alvarez-Suarez, J.M.; Afrin, S.; Rosati, C.; Pandolfini, T.; et al. Overexpression of the Anthocyanidin Synthase Gene in Strawberry Enhances Antioxidant Capacity and Cytotoxic Effects on Human Hepatic Cancer Cells. J. Agric. Food Chem. 2018, 66, 581–592. [Google Scholar] [CrossRef] [PubMed]
- Singleton, V.L.; Orthofer, R.; Lamuela-Raventós, R.M. Analysis of Total Phenols and Other Oxidation Substrates and Antioxidants by Means of Folin-Ciocalteu Reagent. Methods Enzymol. 1998, 299, 152–178. [Google Scholar] [CrossRef]
- Dewanto, V.; Wu, X.; Adom, K.K.; Liu, R.H. Thermal Processing Enhances the Nutritional Value of Tomatoes by Increasing Total Antioxidant Activity. J. Agric. Food Chem. 2002, 50, 3010–3014. [Google Scholar] [CrossRef] [PubMed]
- Giusti, M.; Wrolstad, R.E. Characterization and Measurement of Anthocyanins by UV-Visible Spectroscopy. In Handbook of Food Analytical Chemistry; John Wiley & Sons, Ltd.: Hoboken, NJ, USA, 2005; Volume 2, pp. 19–31. [Google Scholar]
- Wang, L.; Fu, H.; Wang, W.; Wang, Y.; Zheng, F.; Ni, H.; Chen, F. Analysis of Reducing Sugars, Organic Acids and Minerals in 15 Cultivars of Jujube (Ziziphus jujuba Mill.) Fruits in China. J. Food Compos. Anal. 2018, 73, 10–16. [Google Scholar] [CrossRef]
- Doyon, G.; Gaudreau, G.; St-Gelais, D.; Beaulieu, Y.; Randall, C.J. Simultaneous HPLC Determination of Organic Acids, Sugars and Alcohols. Can. Inst. Food Sci. Technol. J. 2013, 24, 87–94. [Google Scholar] [CrossRef]
- Benzie, I.F.F.; Strain, J.J. The Ferric Reducing Ability of Plasma (FRAP) as a Measure of “Antioxidant Power”: The FRAP Assay. Anal. Biochem. 1996, 239, 70–76. [Google Scholar] [CrossRef]
- Prymont-Przyminska, A.; Zwolinska, A.; Sarniak, A.; Wlodarczyk, A.; Krol, M.; Nowak, M.; de Graft-Johnson, J.; Padula, G.; Bialasiewicz, P.; Markowski, J.; et al. Consumption of Strawberries on a Daily Basis Increases the Non-Urate 2,2-Diphenyl-1-Picryl-Hydrazyl (DPPH) Radical Scavenging Activity of Fasting Plasma in Healthy Subjects. J. Clin. Biochem. Nutr. 2014, 55, 48–55. [Google Scholar] [CrossRef]
- Rufino, M.D.S.M.; Alves, R.E.; de Brito, E.S.; Pérez-Jiménez, J.; Saura-Calixto, F.; Mancini-Filho, J. Bioactive Compounds and Antioxidant Capacities of 18 Non-Traditional Tropical Fruits from Brazil. Food Chem. 2010, 121, 996–1002. [Google Scholar] [CrossRef]
- Schiassi, M.C.E.V.; de Souza, V.R.; Lago, A.M.T.; Campos, L.G.; Queiroz, F. Fruits from the Brazilian Cerrado Region: Physico-Chemical Characterization, Bioactive Compounds, Antioxidant Activities, and Sensory Evaluation. Food Chem. 2018, 245, 305–311. [Google Scholar] [CrossRef] [PubMed]
- Núcleo de Estudos e Pesquisa em Alimentação (NEPA); Universidade Estadual de Campinas (UNICAMP). Tabela Brasileira de Composicao de Alimentos—TACO 4 Edicao Ampliada e Revisada; UNIVERSIDADE ESTADUAL DE CAMPINAS—UNICAMP: Campinas, Brazil, 2011; p. 164. [Google Scholar]
- United States USDA National Nutrient Database for Standard Reference, Release 27 | GHDx. Available online: http://ghdx.healthdata.org/record/united-states-usda-national-nutrient-database-standard-reference-release-27 (accessed on 25 February 2019).
- Almeida, M.M.B.; de Sousa, P.H.M.; Arriaga, Â.M.C.; do Prado, G.M.; Magalhães, C.E.D.C.; Maia, G.A.; de Lemos, T.L.G. Bioactive Compounds and Antioxidant Activity of Fresh Exotic Fruits from Northeastern Brazil. Food Res. Int. 2011, 44, 2155–2159. [Google Scholar] [CrossRef]
- United States Department of Agriculture Agricultural Marketing Service Fruit and Vegetable Division Processed Products Branch. United States Standards for Grades of Extracted Honey. Available online: http://onlinebooks.library.upenn.edu/webbin/book/lookupname?key=United%20States.%20Agricultural%20Marketing%20Service.%20Fruit%20and%20Vegetable%20Division (accessed on 20 June 2019).
- Ramful, D.; Tarnus, E.; Aruoma, O.I.; Bourdon, E.; Bahorun, T. Polyphenol Composition, Vitamin C Content and Antioxidant Capacity of Mauritian Citrus Fruit Pulps. Food Res. Int. 2011, 44, 2088–2099. [Google Scholar] [CrossRef]
- Institute of Medicine (US) Panel on Dietary Antioxidants and Related Compounds. Dietary Reference Intakes for Vitamin C, Vitamin E, Selenium, and Carotenoids; National Academies Press (US): Washington, DC, USA, 2000. [Google Scholar] [CrossRef]
- Campos, D.; Chirinos, R.; Gálvez Ranilla, L.; Pedreschi, R. Bioactive Potential of Andean Fruits, Seeds, and Tubers. In Advances in Food and Nutrition Research; Academic Press: San Diego, CA, USA, 2018; Volume 84, pp. 287–343. [Google Scholar]
- De Souza, V.R.; Pereira, P.A.P.; Queiroz, F.; Borges, S.V.; De Deus Souza Carneiro, J. Determination of Bioactive Compounds, Antioxidant Activity and Chemical Composition of Cerrado Brazilian Fruits. Food Chem. 2012, 134, 381–386. [Google Scholar] [CrossRef]
- García-Cruz, L.; Valle-Guadarrama, S.; Salinas-Moreno, Y.; Joaquín-Cruz, E. Physical, Chemical, and Antioxidant Activity Characterization of Pitaya (Stenocereus Pruinosus) Fruits. Plant Foods Hum. Nutr. 2013, 68, 403–410. [Google Scholar] [CrossRef]
- Khoo, H.E.; Ismail, A.; Mohd-Esa, N.; Idris, S. Carotenoid Content of Underutilized Tropical Fruits. Plant Foods Hum. Nutr. 2008, 63, 170–175. [Google Scholar] [CrossRef]
- Berni, P.; Campoli, S.S.; Negri, T.C.; de Toledo, N.M.V.; Canniatti-Brazaca, S.G. Non-Conventional Tropical Fruits: Characterization, Antioxidant Potential and Carotenoid Bioaccessibility. Plant Foods Hum. Nutr. 2019, 141–148. [Google Scholar] [CrossRef]
- Bazalar Pereda, M.S.; Nazareno, M.A.; Viturro, C.I. Nutritional and Antioxidant Properties of Physalis peruviana L. Fruits from the Argentinean Northern Andean Region. Plant Foods Hum. Nutr. 2018, 68–75. [Google Scholar] [CrossRef]
- Khayyat, M.; Barati, Z.; Aminifard, M.H.; Samadzadeh, A. Changes in Fruit Maturity Indices and Growth Pattern along the Harvest Season in Seedless Barberry under Different Altitude Conditions. J. Berry Res. 2018, 8, 25–40. [Google Scholar] [CrossRef]
- Walker, R.P.; Famiani, F. Organic Acids in Fruits. In Horticultural Reviews; John Wiley & Sons, Inc.: Hoboken, NJ, USA, 2018; pp. 371–430. [Google Scholar]
- Galani, J.H.Y.; Patel, J.S.; Patel, N.J.; Talati, J.G.; Galani, J.H.Y.; Patel, J.S.; Patel, N.J.; Talati, J.G. Storage of Fruits and Vegetables in Refrigerator Increases Their Phenolic Acids but Decreases the Total Phenolics, Anthocyanins and Vitamin C with Subsequent Loss of Their Antioxidant Capacity. Antioxidants 2017, 6, 59. [Google Scholar] [CrossRef]
- Trumbo, P.; Schlicker, S.; Yates, A.A.; Poos, M. Dietary Reference Intakes for Energy, Carbohydrate, Fiber, Fat, Fatty Acids, Cholesterol, Protein and Amino Acids. J. Am. Diet. Assoc. 2002, 102, 1621–1630. [Google Scholar] [CrossRef]
- Kosińska-Cagnazzo, A.; Weber, B.; Chablais, R.; Vouillamoz, J.F.; Molnár, B.; Crovadore, J.; Lefort, F.; Andlauer, W. Bioactive Compound Profile and Antioxidant Activity of Fruits from Six Goji Cultivars Cultivated in Switzerland. J. Berry Res. 2017, 7, 43–59. [Google Scholar] [CrossRef]


| Local Name | Common Name | Scientific Name | Type | Status |
|---|---|---|---|---|
| Achogchas | Achocha/caihua | Cyclanthera pedata (L.) Schrad. | Vine | Native and cultivated |
| Aguacate | Avocado | Persea americana Mill. | Tree | Cultivated |
| Ají cacique | Chili pepper | Capsicum annuum L. | Herb | Cultivated |
| Ají ratón | Chili pepper | Capsicum chinense Jacq | Herb | Cultivated |
| Arazá | Araza/araca boi | Eugenia stipitata McVaugh | Shrub | Native and cultivated |
| Badea | Giant granadilla, badea | Passiflora quadrangularis L. | Vine or liana | Cultivated |
| Borojó | Borojo | Borojoa patinoi Cuatrec. | Tree | Introduced |
| Caimito | Cainito/tar apple/star apple | Chrysophyllum cainito L. | Tree | Introduced |
| Chirimoya | Cherimoya/custard apple | Annona cherimola Mill | Shrub | Native and cultivated |
| Fruta china | Carambola/star fruit | Averrhoa carambola L. | Tree | Introduced |
| Guanábana | Soursop | Annona muricata L. | Tree | Native and cultivated |
| Guayaba | Guava | Psidium guajava L. | Shrub | Native and cultivated |
| Hobo rojo | Red mombin | Spondias mombin L. | Tree | Native |
| Hobo verde | Green mombin | Spondias mombin L. | Tree | Native |
| Papaya | Papaya | Carica papaya L. | Tree | Native and cultivated |
| Pitahaya amarilla | Yellow pitahaya/yellow dragon fruit | Cereus megalanthus K. Schum. ex Vaupel | Epiphyte | Native |
| Pitahaya roja | Red pitahaya/strawberry pear | Cereus ocamponis Salm-Dyck | Epiphyte | Introduced |
| Tagua | Ecuadorian ivory palm | Phytelephas aequatorialis Spruce | Tree | Endemic |
| Vainilla | Vanilla | Vanilla planifolia Andrews | Epiphyte | Native and cultivated |
| Common Name | TAC (µmol TEq/g FW) | Bioactive Compounds | ||||
|---|---|---|---|---|---|---|
| FRAP | DPPH | TPC (mg GAE/100 g FW) | TFC (mg CatEq/g FW) | ACY (mg PgEq/g FW) | Vit C (mg Vit C/100 g FW) | |
| Achocha | 264.78 ± 21.14 e | 0.24 ± 0.05 i | 482.07 ± 48.99 d | 2.88 ± 0.23 e | 0.68 ± 0.07 b | 18.03 ± 4.07 f |
| Avocado | 189.09 ± 37.31 e | ud | 317.02 ± 10.42 d | 2.50 ± 0.63 e | 0.42 ± 0.09 c | 1.63 ± 0.43 g |
| Chili pepper | 1666.66 ± 139.00 b | 91.47 ± 5.56 e | 1282.15 ± 352.90 b | 7.40 ± 1.17 c | 1.33 ± 0.26 a | 248.13 ± 56.53 c |
| Chili pepper | 923.05 ± 53.85 c | 85.49 ± 5.97 e | 1184.67 ± 199.85 b | 3.61 ± 0.38 d | 0.76 ± 0.07 b | 294.00 ± 27.36 c |
| Araza | 24.56 ± 5.35 h | 210.78 ± 16.50 d | 543.32 ± 21.94 d | 1.84 ± 0.46 e | 0.32 ± 0.04 c | 181.13 ± 13.01 d |
| Giant Granadilla | 387.89 ± 33.11 d | 90.68 ± 8.05 e | 324.18 ± 36.35 d | 1.79 ± 0.24 e | 0.33 ± 0.02 c | 277.72 ± 22.24 c |
| Borojo | 3.66 ± 0.92 j | 50.07 ± 8.18 g | 142.53 ± 16.20 e | 3.88 ± 0.29 d | 0.30 ± 0.05 c | ud |
| Cainito | 1591.93 ± 398.06 b | 537.61 ± 43.81 c | 1181.44 ± 172.13 b | 8.25 ± 0.37 c | 0.83 ± 0.10 b | 12.23 ± 1.61 f |
| Cherimoya | 1167.18 ± 183.84 c | 843.80 ± 19.28 b | 1472.18 ± 332.49 b | 23.43 ± 5.00 b | 0.27 ± 0.05 c | 78.96 ± 6.13 e |
| Carambola | 3370.94 ± 308.02 a | 1215.34 ± 101.98 a | 4280.83 ± 673.83 a | 48.52 ± 5.40 a | 0.51 ± 0.07 b | 199.44 ± 11.28 d |
| Soursop | 422.11 ± 57.72 d | 92.96 ± 9.46 e | 485.85 ± 36.38 d | 2.15 ± 0.18 e | 0.21 ± 0.06 c | 106.00 ± 8.50 d |
| Guava | 1568.48 ± 273.20 b | 607.48 ± 18.96 c | 1163.94 ± 159.50 b | 5.80 ± 0.53 c | 0.57 ± 0.05 b | 496.73 ± 14.32 a |
| Red mombin | 45.31 ± 6.85 g | 1081.79 ± 50.18 a | 827.51 ± 14.58 c | 4.39 ± 0.34 d | 0.35 ± 0.03 c | 201.02 ± 17.93 d |
| Green mombin | 46.63 ± 8.39 g | 519.18 ± 30.99 c | 787.87 ± 38.87 c | 4.40 ± 0.49 d | 0.33 ± 0.03 c | 176.25 ± 14.03 d |
| Papaya | 571.26 ± 59.62 d | 77.77 ± 8.35 f | 341.70 ± 42.97 d | 1.99 ± 0.48 e | 0.54 ± 0.04 b | 341.98 ± 20.22 b |
| Yellow pitahaya | 9.04 ± 1.30 i | 31.91 ± 4.40 h | 389.74 ± 39.49 d | 3.57 ± 0.3 d | 0.33 ± 0.07 c | 4.80 ± 0.58 g |
| Red pitahaya | 10.53 ± 2.30 i | 84.61 ± 3.89 e | 251.22 ± 39.04 e | 3.41 ± 0.34 d | 0.32 ± 0.02 c | 12.93 ± 2.52 f |
| Ecuadorian ivory palm | 381.85 ± 46.36 d | 116.06 ± 7.55 d | 203.54 ± 20.008 e | 4.50 ± 0.34 d | 0.34 ± 0.06 c | ud |
| Vanilla | 78.86 ± 9.64 f | 530.32 ± 22.88 c | 1447.25 ± 171.05 b | 6.71 ± 0.66 c | 0.52 ± 0.09 b | ud |
| Common Name | Organic Acids (mg/100 g of FW) | |||
|---|---|---|---|---|
| Lactic Acid | Acetic Acid | Citric Acid | Oxalic Acid | |
| Achocha | 1.85 ± 0.01 c | 1.66 ± 0.02 b | 0.47 ± 0.05 c | 0.04 ± 0.00 e |
| Avocado | 2.01 ± 0.30 c | 2.83 ± 0.16 b | 0.03 ± 0.00 e | 0.05 ± 0.00 e |
| Chili pepper | 1.65 ± 0.13 c | 0.76 ± 0.02 c | 1.88 ± 0.04 a | 0.05 ± 0.00 e |
| Chili pepper | 4.44 ± 0.71 b | 0.59 ± 0.03 c | 0.42 ± 0.05 c | 0.02 ± 0.00 e |
| Araza | 5.18 ± 0.07 b | 0.53 ± 0.01 c | 0.11 ± 0.00 d | ud |
| Giant Granadilla | 0.56 ± 0.03 e | 1.29 ± 0.09 b | 0.90 ± 0.01 b | 0.13 ± 0.00 d |
| Borojo | 1.48 ± 0.17 c | 0.12 ± 0.01 d | 0.02 ± 0.00 e | 0.58 ± 0.05 b |
| Cainito | 1.32 ± 0.01 c | 1.65 ± 0.07 b | 0.04 ± 0.00 e | 0.21 ± 0.01 c |
| Cherimoya | 1.12 ± 0.03 d | 1.57 ± 0.01 b | 0.53 ± 0.00 c | 0.01 ± 0.00 e |
| Carambola | 0.93 ± 0.04 d | 0.67 ± 0.06 c | 0.02 ± 0.00 e | 2.15 ± 0.11 a |
| Soursop | 13.56 ± 2.00 a | 1.42 ± 0.24 b | 0.41 ± 0.02 c | 0.02 ± 0.00 e |
| Guava | 0.92 ± 0.06 d | 7.39 ± 0.64 a | 2.12 ± 0.26 a | 0.06 ± 0.00 e |
| Red mombin | 0.64 ± 0.03 e | 1.54 ± 0.04 b | 0.12 ± 0.01 d | 0.02 ± 0.00 e |
| Green mombin | 0.41 ± 0.05 e | 1.39 ± 0.03 b | 0.09 ± 0.01 d | ud |
| Papaya | 1.82 ± 0.36 c | 0.08 ± 0.00 d | 1.10 ± 0.02 b | 0.23 ± 0.01 c |
| Yellow pitahaya | 0.58 ± 0.04 e | 0.13 ± 0.03 d | 0.88 ± 0.01 b | 0.07 ± 0.00 e |
| Red pitahaya | 2.12 ± 0.02 c | ud | 0.08 ± 0.00 d | 0.14 ± 0.01 d |
| Ecuadorian ivory palm | 4.66 ± 0.18 b | 8.01 ± 0.38 a | 0.11 ± 0.01 d | 0.02 ± 0.00 e |
| Vanilla | 0.07 ± 0.01 f | 0.02 ± 0.00 e | 1.98 ± 0.73 a | 0.02 ± 0.00 e |
| Common Name | Sugar Content (g/100 g of FW) | |||
|---|---|---|---|---|
| Glucose | Fructose | Sucrose | Total ∑ Gluc+Fruct+Sucr | |
| Achocha | 2.04 ± 0.32 c | 2.12 ± 0.20 c | 1.80 ± 0.62 c | 5.97 ± 0.26 c |
| Avocado | 0.56 ± 0.04 d | 4.86 ± 0.23 b | 0.28 ± 0.09 e | 5.70 ± 1.56 c |
| Chili pepper | ud | 0.06 ± 0.01 g | 0.41 ± 0.02 e | 0.47 ± 0.12 f |
| Chili pepper | 0.02 ± 0.00 f | 4.47 ± 0.71 b | 0.60 ± 0.01 d | 5.10 ± 1.42 c |
| Araza | 0.54 ± 0.02 d | 0.18 ± 0.04 f | 0.07 ± 0.00 f | 0.80 ± 0.14 f |
| Giant Granadilla | 5.88 ± 0.67 a | 0.26 ± 0.03 f | 0.52 ± 0.08 d | 6.66 ± 1.79 c |
| Borojo | 2.82 ± 0.10 b | 1.84 ± 0.16 c | 0.27 ± 0.03 e | 4.93 ± 1.27 c |
| Cainito | 0.04 ± 0.00 f | 1.60 ± 0.06 c | 1.63 ± 0.07 c | 3.27 ± 0.84 d |
| Cherimoya | 3.40 ± 0.38 b | 0.51 ± 0.11 e | 0.05 ± 0.00 f | 3.96 ± 1.27 d |
| Carambola | 0.65 ± 0.13 d | 0.64 ± 0.11 e | 0.04 ± 0.00 f | 1.33 ± 0.35 e |
| Soursop | 0.42 ± 0.01 d | 0.67 ± 0.05 e | 1.92 ± 0.06 c | 3.01 ± 0.80 d |
| Guava | 0.15 ± 0.02 e | 0.92 ± 0.01 d | 7.40 ± 0.65 a | 8.47 ± 2.18 b |
| Red mombin | 1.65 ± 0.17 c | 7.22 ± 0.08 a | 2.17 ± 0.22 c | 11.04 ± 2.94 a |
| Green mombin | 1.51 ± 0.27 c | 0.17 ± 0.02 f | 0.08 ± 0.00 f | 1.76 ± 0.80 e |
| Papaya | 1.48 ± 0.34 c | 0.71 ± 0.04 d | 3.45 ± 0.29 b | 5.64 ± 1.40 c |
| Yellow pitahaya | 2.81 ± 0.13 b | 0.82 ± 0.10 d | 0.75 ± 0.04 d | 4.38 ± 1.17 c |
| Red pitahaya | ud | 0.21 ± 0.01 f | 2.21 ± 0.18 c | 2.42 ± 0.82 d |
| Ecuadorian ivory palm | 0.46 ± 0.06 d | 0.86 ± 0.03 d | 0.02 ± 0.00 f | 1.34 ± 0.42 e |
| Vanilla | 0.17 ± 0.02 e | 0.51 ± 0.06 e | 1.48 ± 0.68 c | 2.16 ± 0.67 d |
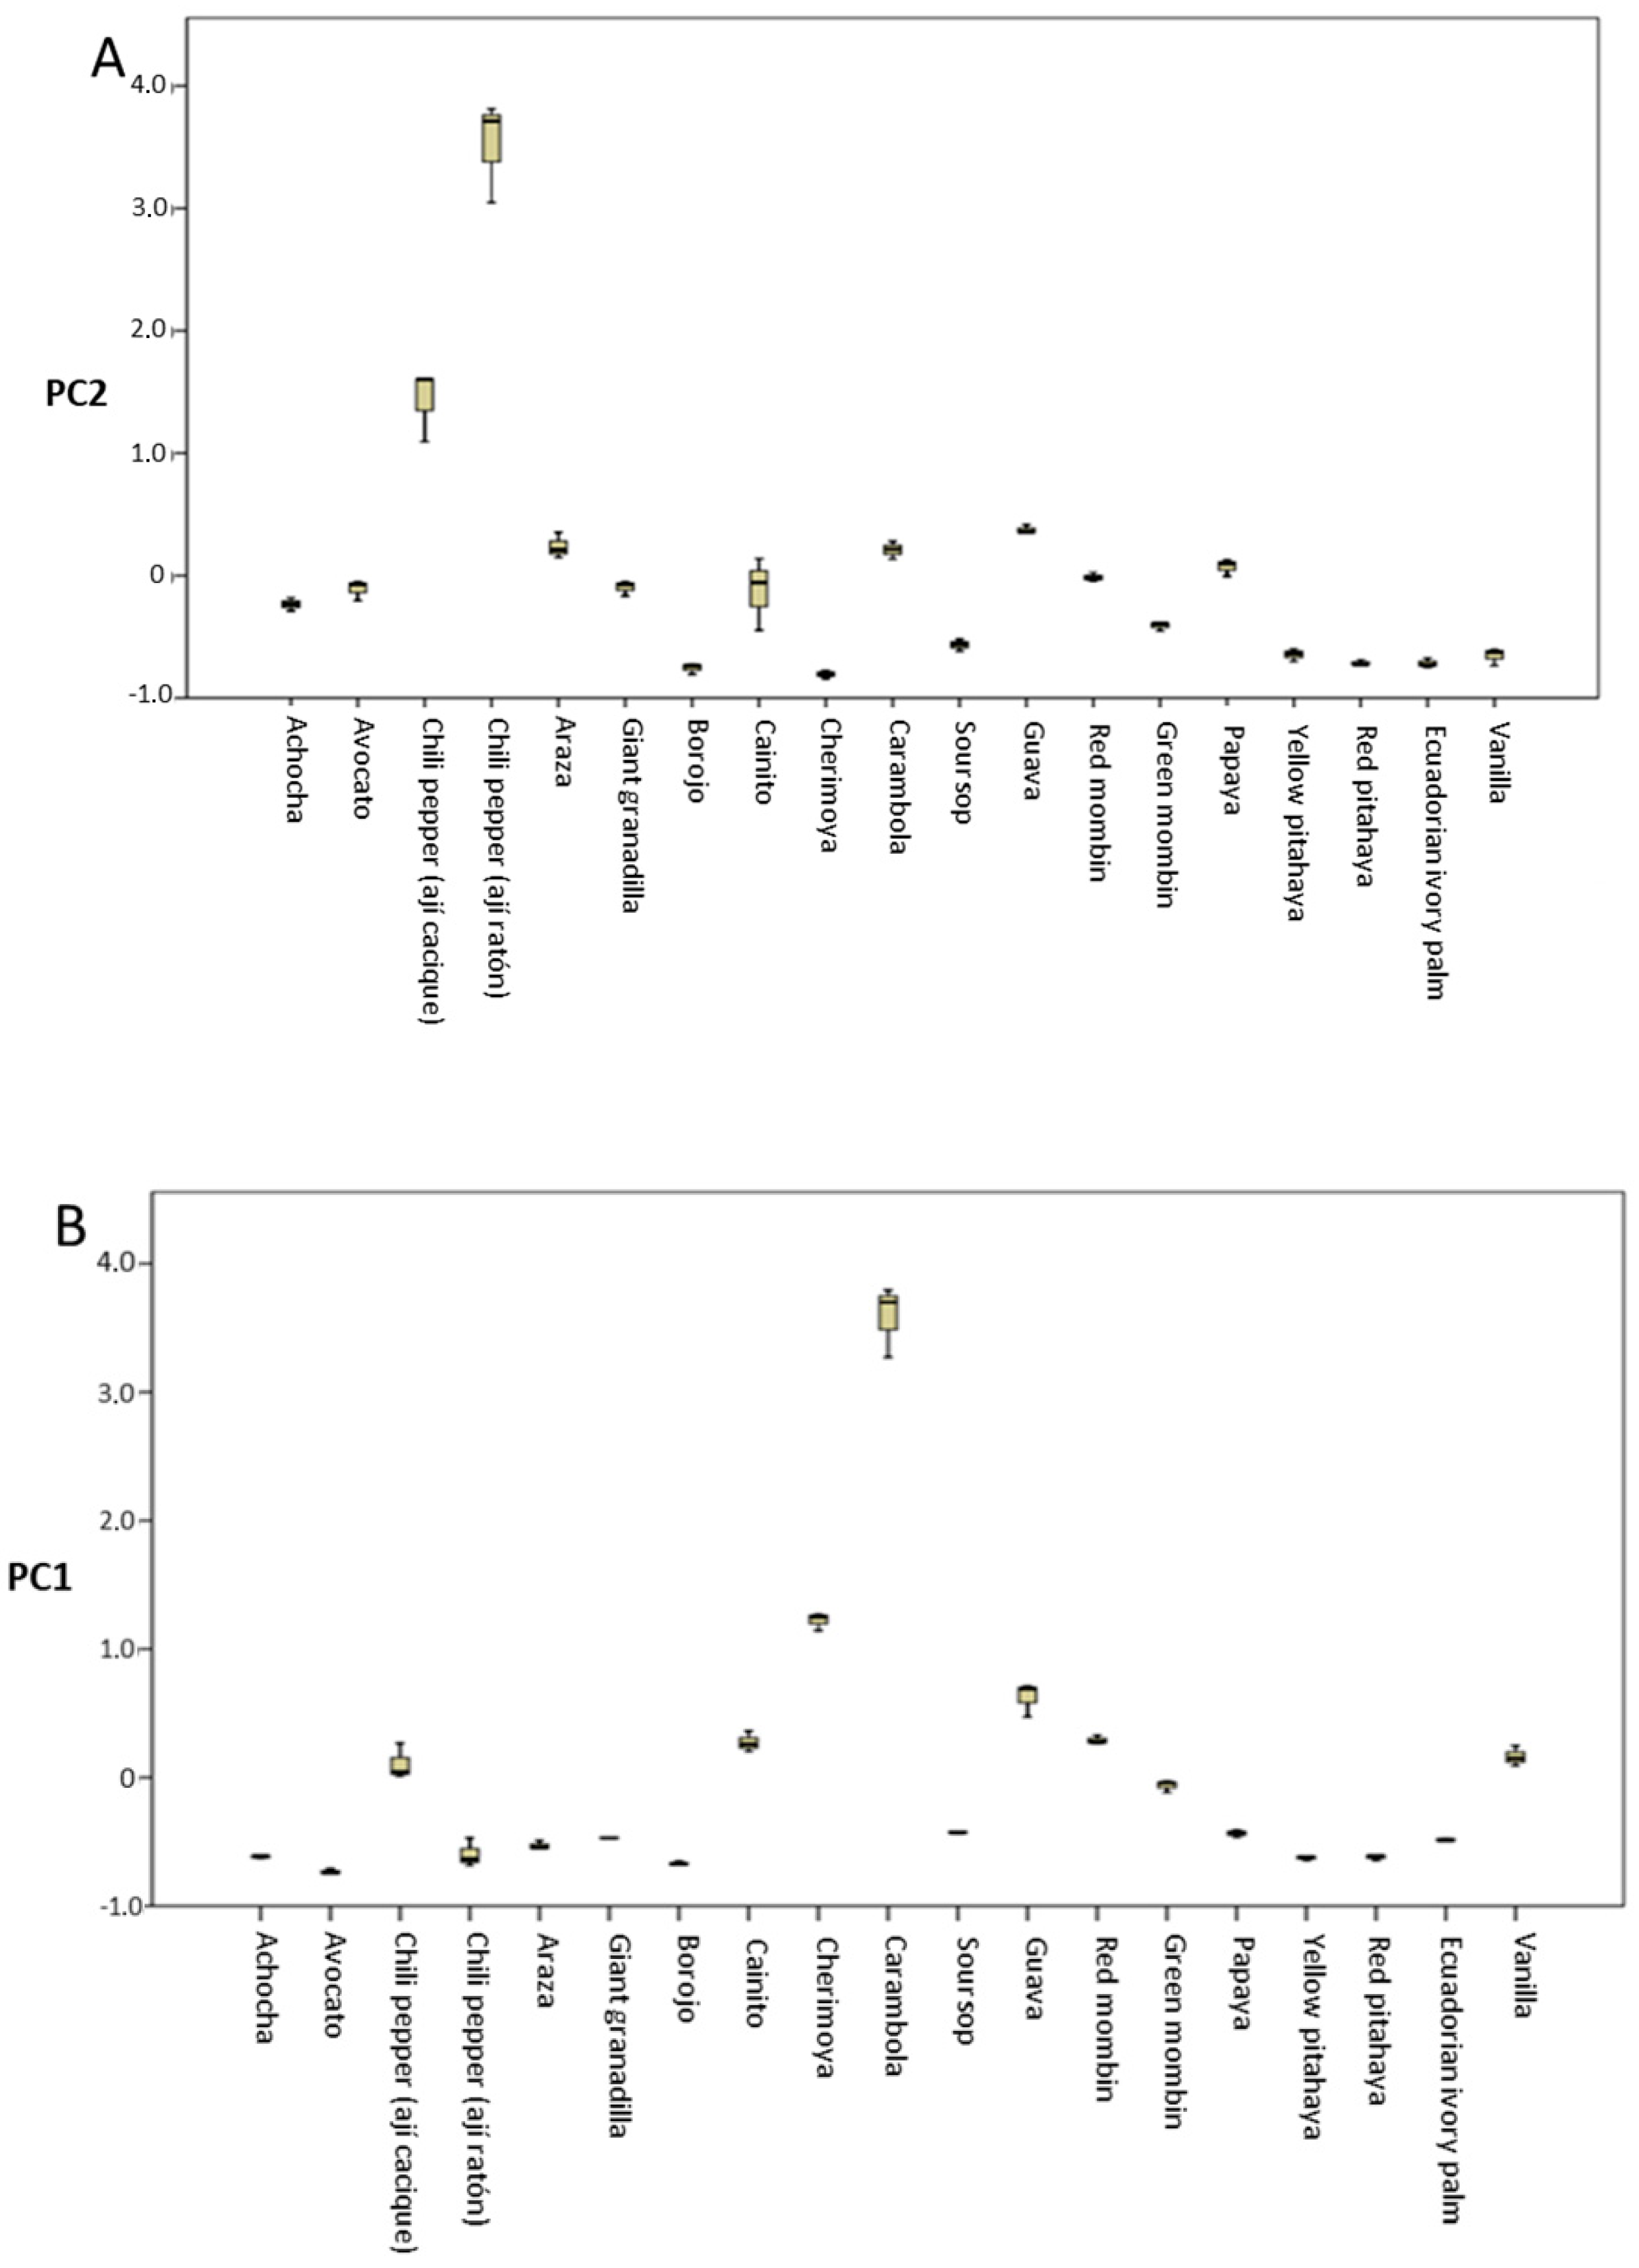
| Variable | PC1 | PC2 | PC3 |
|---|---|---|---|
| TFC | 0.951 | −0.014 | −0.037 |
| TPC | 0.939 | 0.218 | 0.025 |
| FRAP | 0.836 | 0.322 | 0.262 |
| DPPH | 0.835 | −0.090 | −0.002 |
| Lutein | −0.015 | 0.935 | −0.029 |
| B-Carotene | 0.003 | 0.774 | 0.441 |
| ACY | 0.091 | 0.604 | 0.469 |
| Vit C | 0.218 | 0.546 | −0.203 |
| Licp | 0.072 | 0.002 | 0.952 |
| Variables | FRAP | DPPH | TPC | TFC | Vit C | ACY | β-Carot | Licp | Lut |
|---|---|---|---|---|---|---|---|---|---|
| FRAP | 1 | 0.526 ** | 0.838 ** | 0.797 ** | 0.366 ** | 0.449 ** | 0.293 * | 0.294 * | 0.217 |
| DPPH | 1 | 0.719 ** | 0.699 ** | 0.201 | −0.084 | 0.012 | 0.126 | −0.047 | |
| TPC | 1 | 0.908 ** | 0.210 | 0.250 | 0.197 | 0.058 | 0.214 | ||
| TFC | 1 | 0.045 | 0.049 | 0.016 | −0.015 | 0.025 | |||
| Vit C | 1 | 0.261 * | 0.168 | 0.001 | 0.295 * | ||||
| ACY | 1 | 0.437 ** | 0.345 ** | 0.445 ** | |||||
| β-Carot | 1 | 0.433 ** | 0.821 ** | ||||||
| Licp | 1 | −0.050 | |||||||
| Lut | 1 |
© 2019 by the authors. Licensee MDPI, Basel, Switzerland. This article is an open access article distributed under the terms and conditions of the Creative Commons Attribution (CC BY) license (http://creativecommons.org/licenses/by/4.0/).
Share and Cite
Guevara, M.; Tejera, E.; Granda-Albuja, M.G.; Iturralde, G.; Chisaguano-Tonato, M.; Granda-Albuja, S.; Jaramillo-Vivanco, T.; Giampieri, F.; Battino, M.; Alvarez-Suarez, J.M. Chemical Composition and Antioxidant Activity of the Main Fruits Consumed in the Western Coastal Region of Ecuador as a Source of Health-Promoting Compounds. Antioxidants 2019, 8, 387. https://doi.org/10.3390/antiox8090387
Guevara M, Tejera E, Granda-Albuja MG, Iturralde G, Chisaguano-Tonato M, Granda-Albuja S, Jaramillo-Vivanco T, Giampieri F, Battino M, Alvarez-Suarez JM. Chemical Composition and Antioxidant Activity of the Main Fruits Consumed in the Western Coastal Region of Ecuador as a Source of Health-Promoting Compounds. Antioxidants. 2019; 8(9):387. https://doi.org/10.3390/antiox8090387
Chicago/Turabian StyleGuevara, Mabel, Eduardo Tejera, María G. Granda-Albuja, Gabriel Iturralde, Maribel Chisaguano-Tonato, Silvana Granda-Albuja, Tatiana Jaramillo-Vivanco, Francesca Giampieri, Maurizio Battino, and José M. Alvarez-Suarez. 2019. "Chemical Composition and Antioxidant Activity of the Main Fruits Consumed in the Western Coastal Region of Ecuador as a Source of Health-Promoting Compounds" Antioxidants 8, no. 9: 387. https://doi.org/10.3390/antiox8090387
APA StyleGuevara, M., Tejera, E., Granda-Albuja, M. G., Iturralde, G., Chisaguano-Tonato, M., Granda-Albuja, S., Jaramillo-Vivanco, T., Giampieri, F., Battino, M., & Alvarez-Suarez, J. M. (2019). Chemical Composition and Antioxidant Activity of the Main Fruits Consumed in the Western Coastal Region of Ecuador as a Source of Health-Promoting Compounds. Antioxidants, 8(9), 387. https://doi.org/10.3390/antiox8090387