Phytochemical Composition and Antioxidant Capacity of 30 Chinese Teas

 ,
, 
Abstract
1. Introduction
2. Materials and Methods
2.1. Chemicals
2.2. Sample Preparation
2.3. Ferric-Reducing Antioxidant Power (FRAP) Assay
2.4. Trolox Equivalent Antioxidant Capacity (TEAC) Assay
2.5. Determination of Total Phenolic Content (TPC)
2.6. Detection of Phytochemicals by High-Performance Liquid Chromatography (HPLC)
2.7. Data Analysis
3. Results
3.1. Ferric-Reducing Antioxidant Power (FRAP) Values of the Tested Teas
3.2. Trolox Equivalent Antioxidant Capacity (TEAC) Values of the Tested Teas
3.3. Total Phenolic Content (TPC) of the Tested Teas
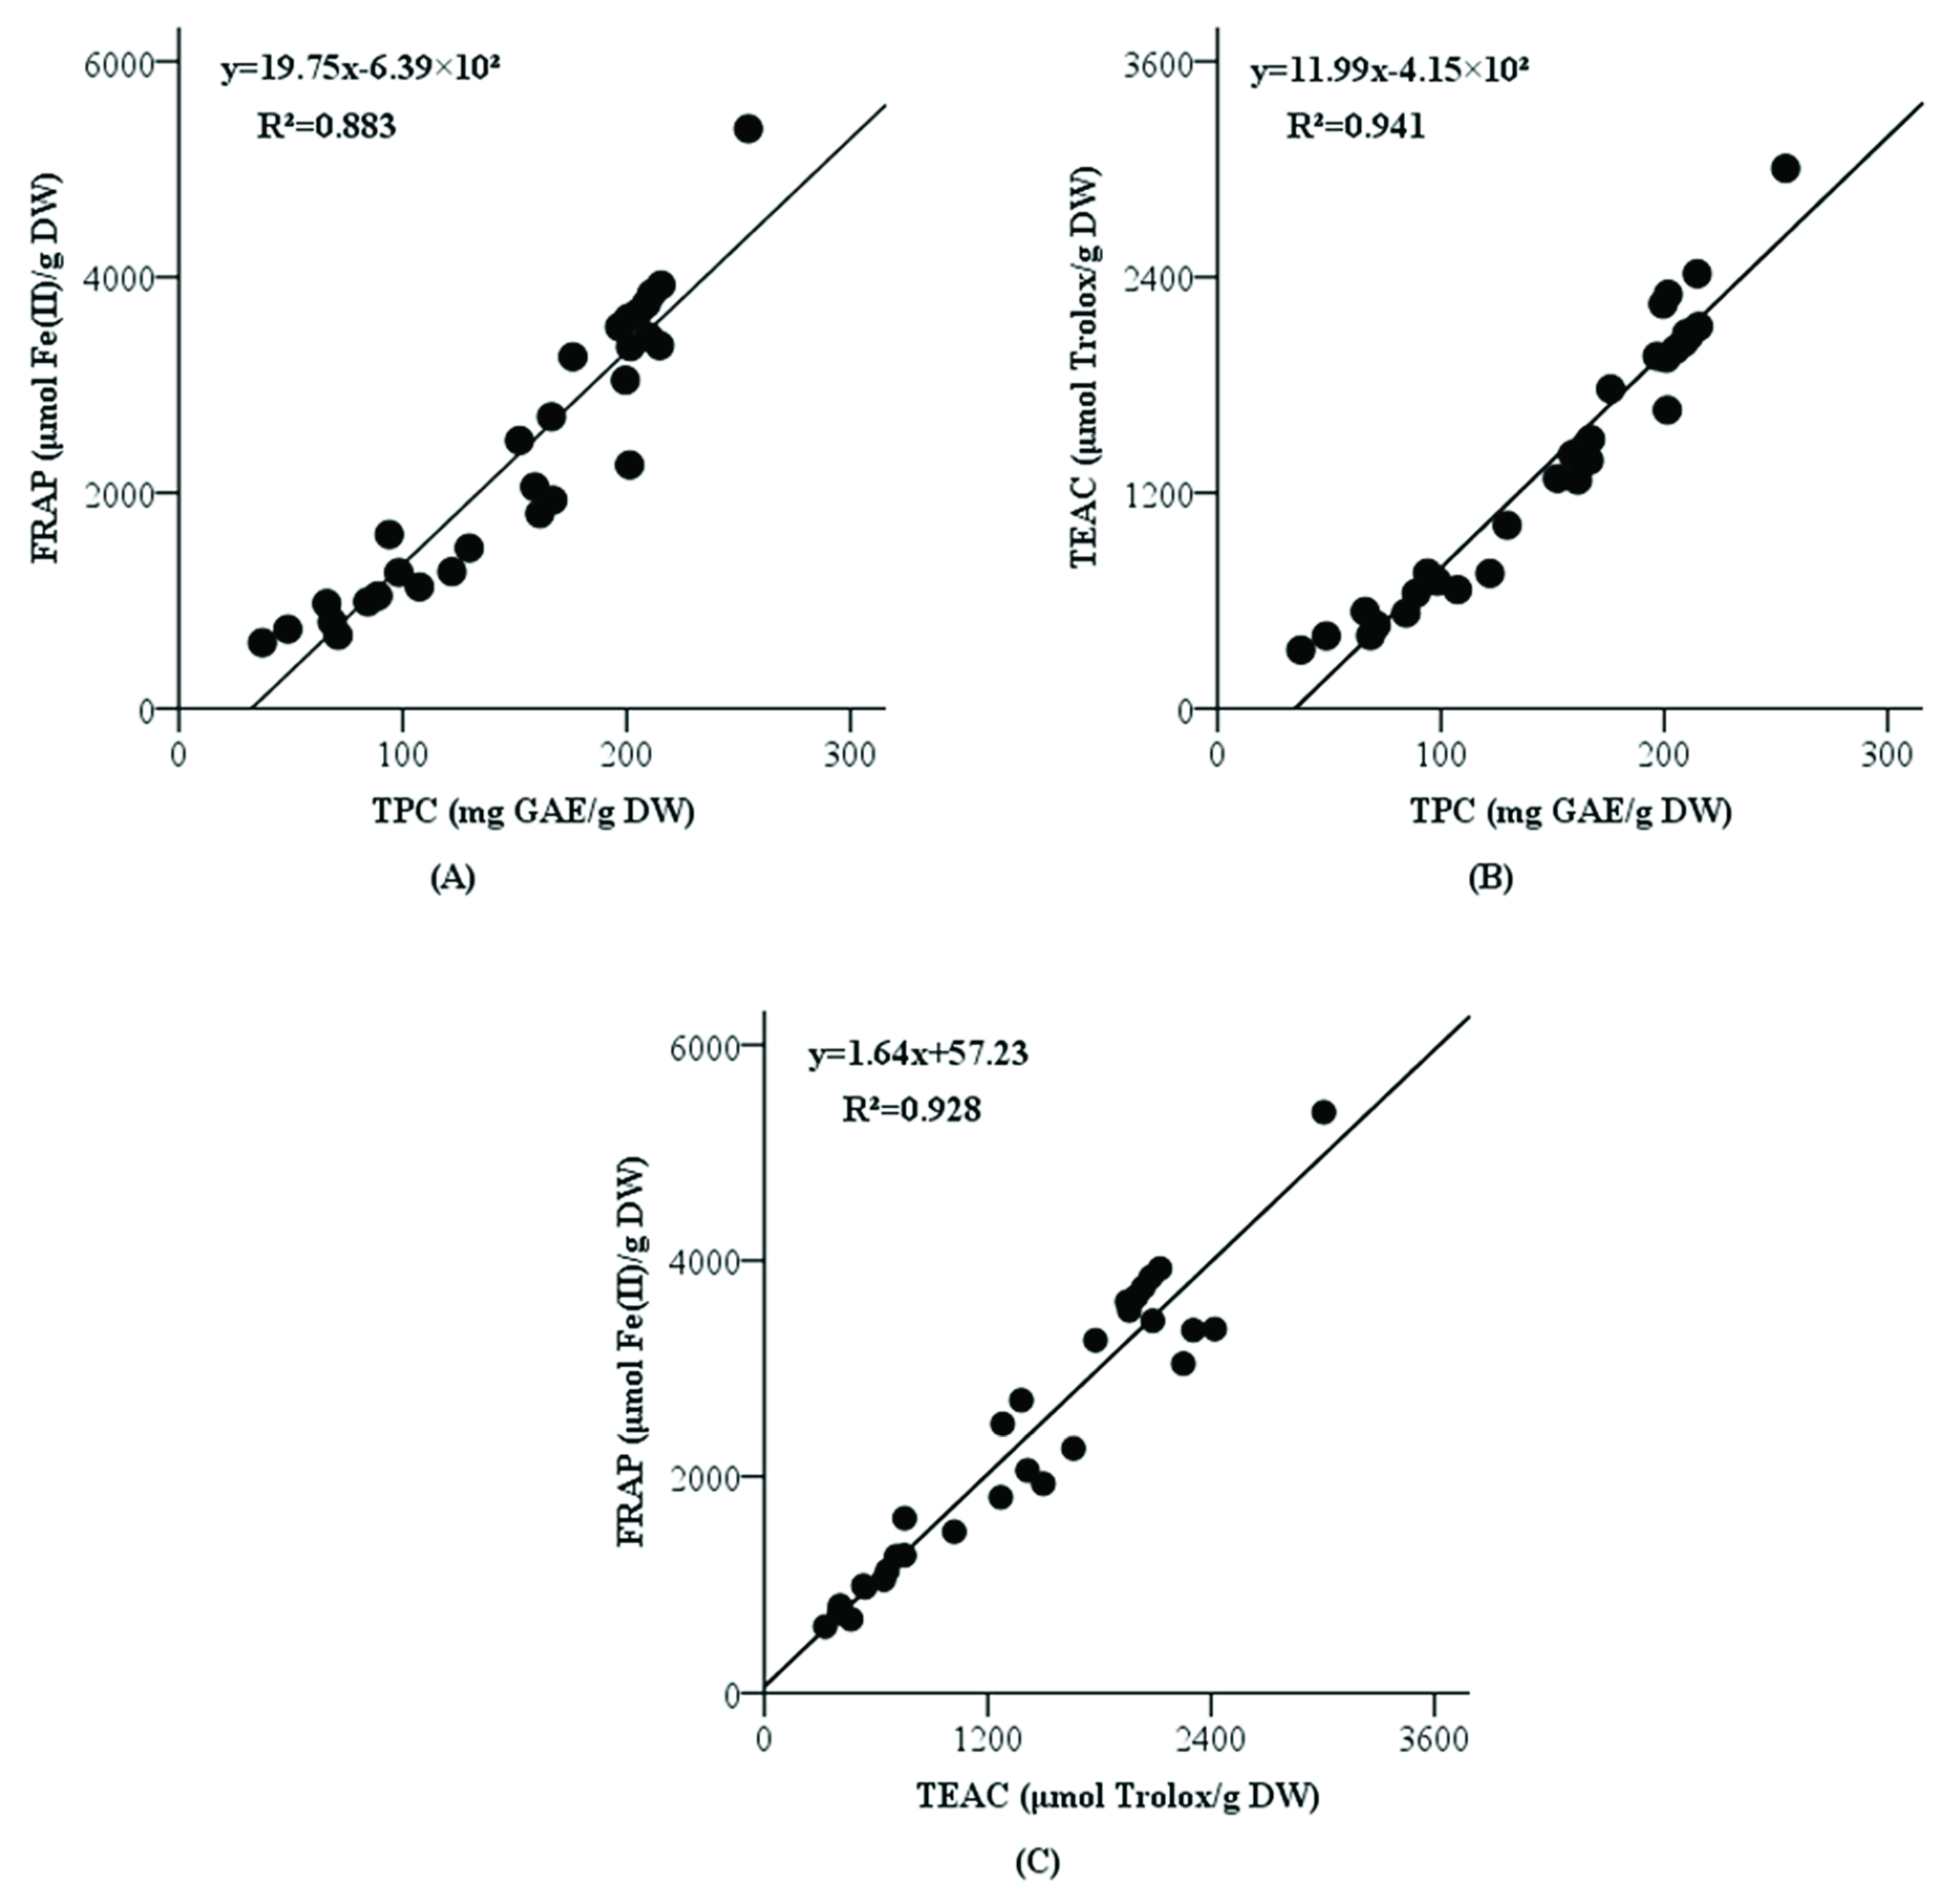
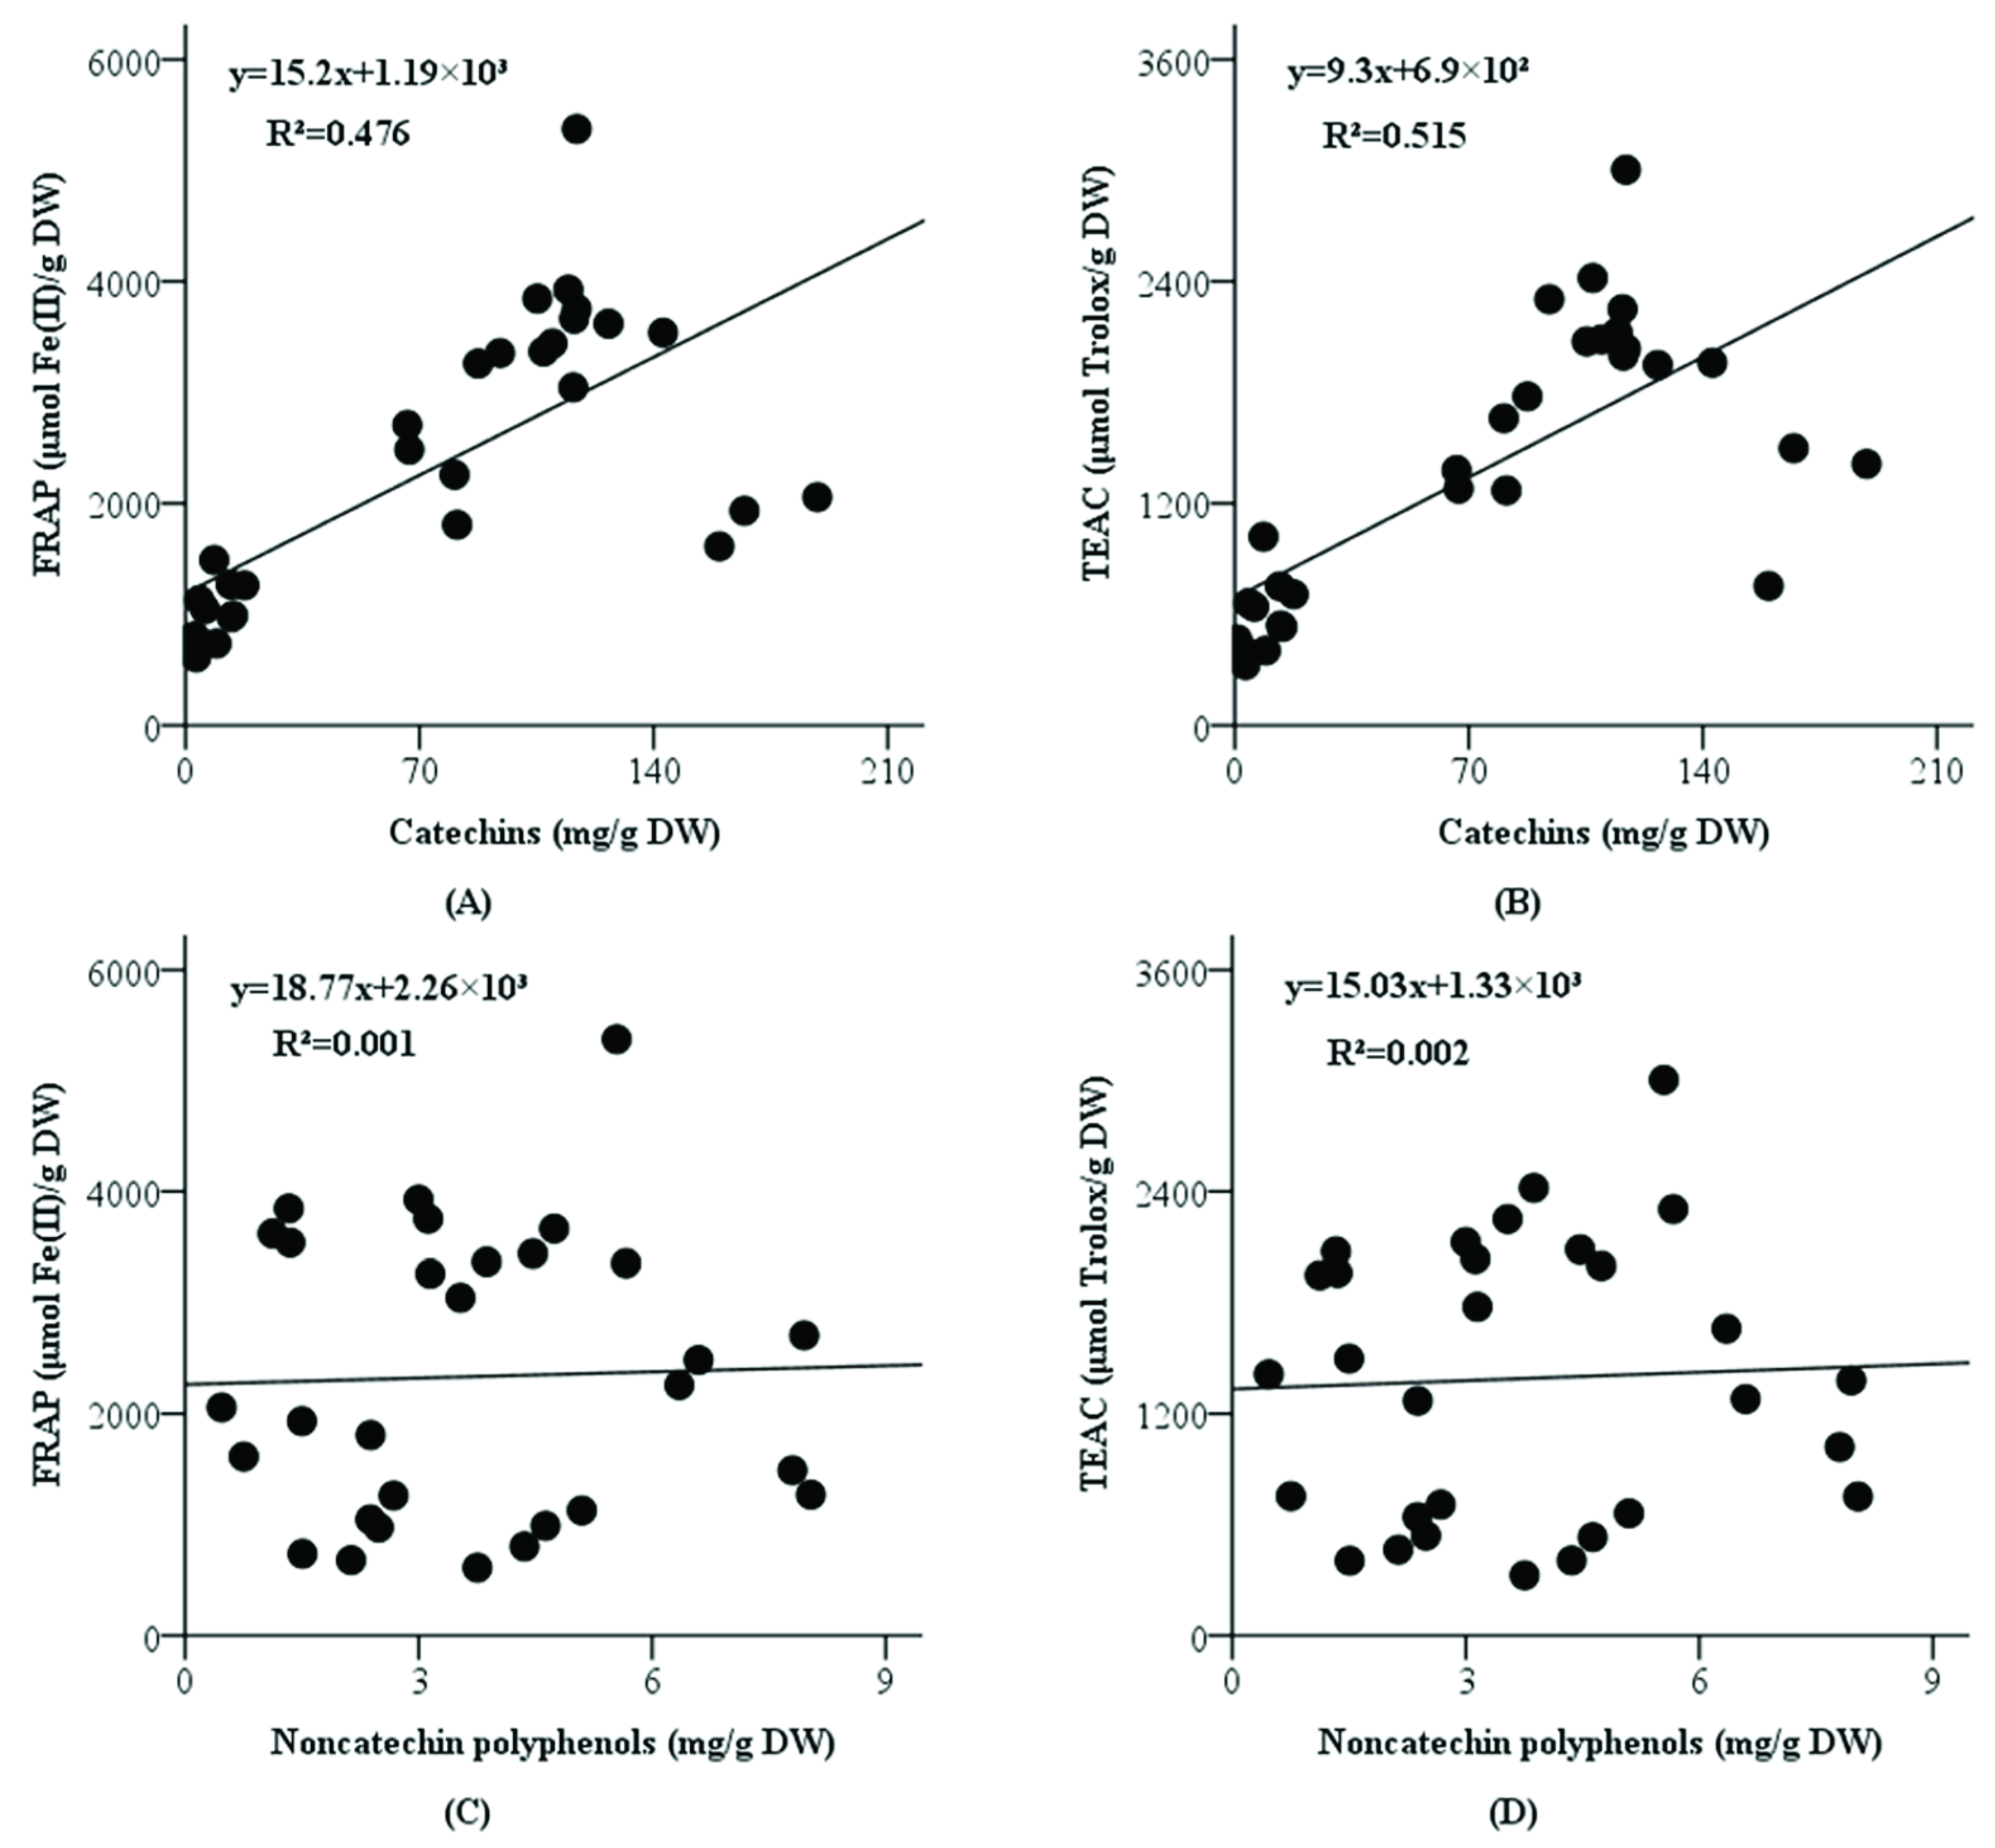
3.4. Correlations among Ferric-Reducing Antioxidant Power (FRAP), Trolox Equivalent Antioxidant Capacity (TEAC), and Total Phenolic Content (TPC) Values
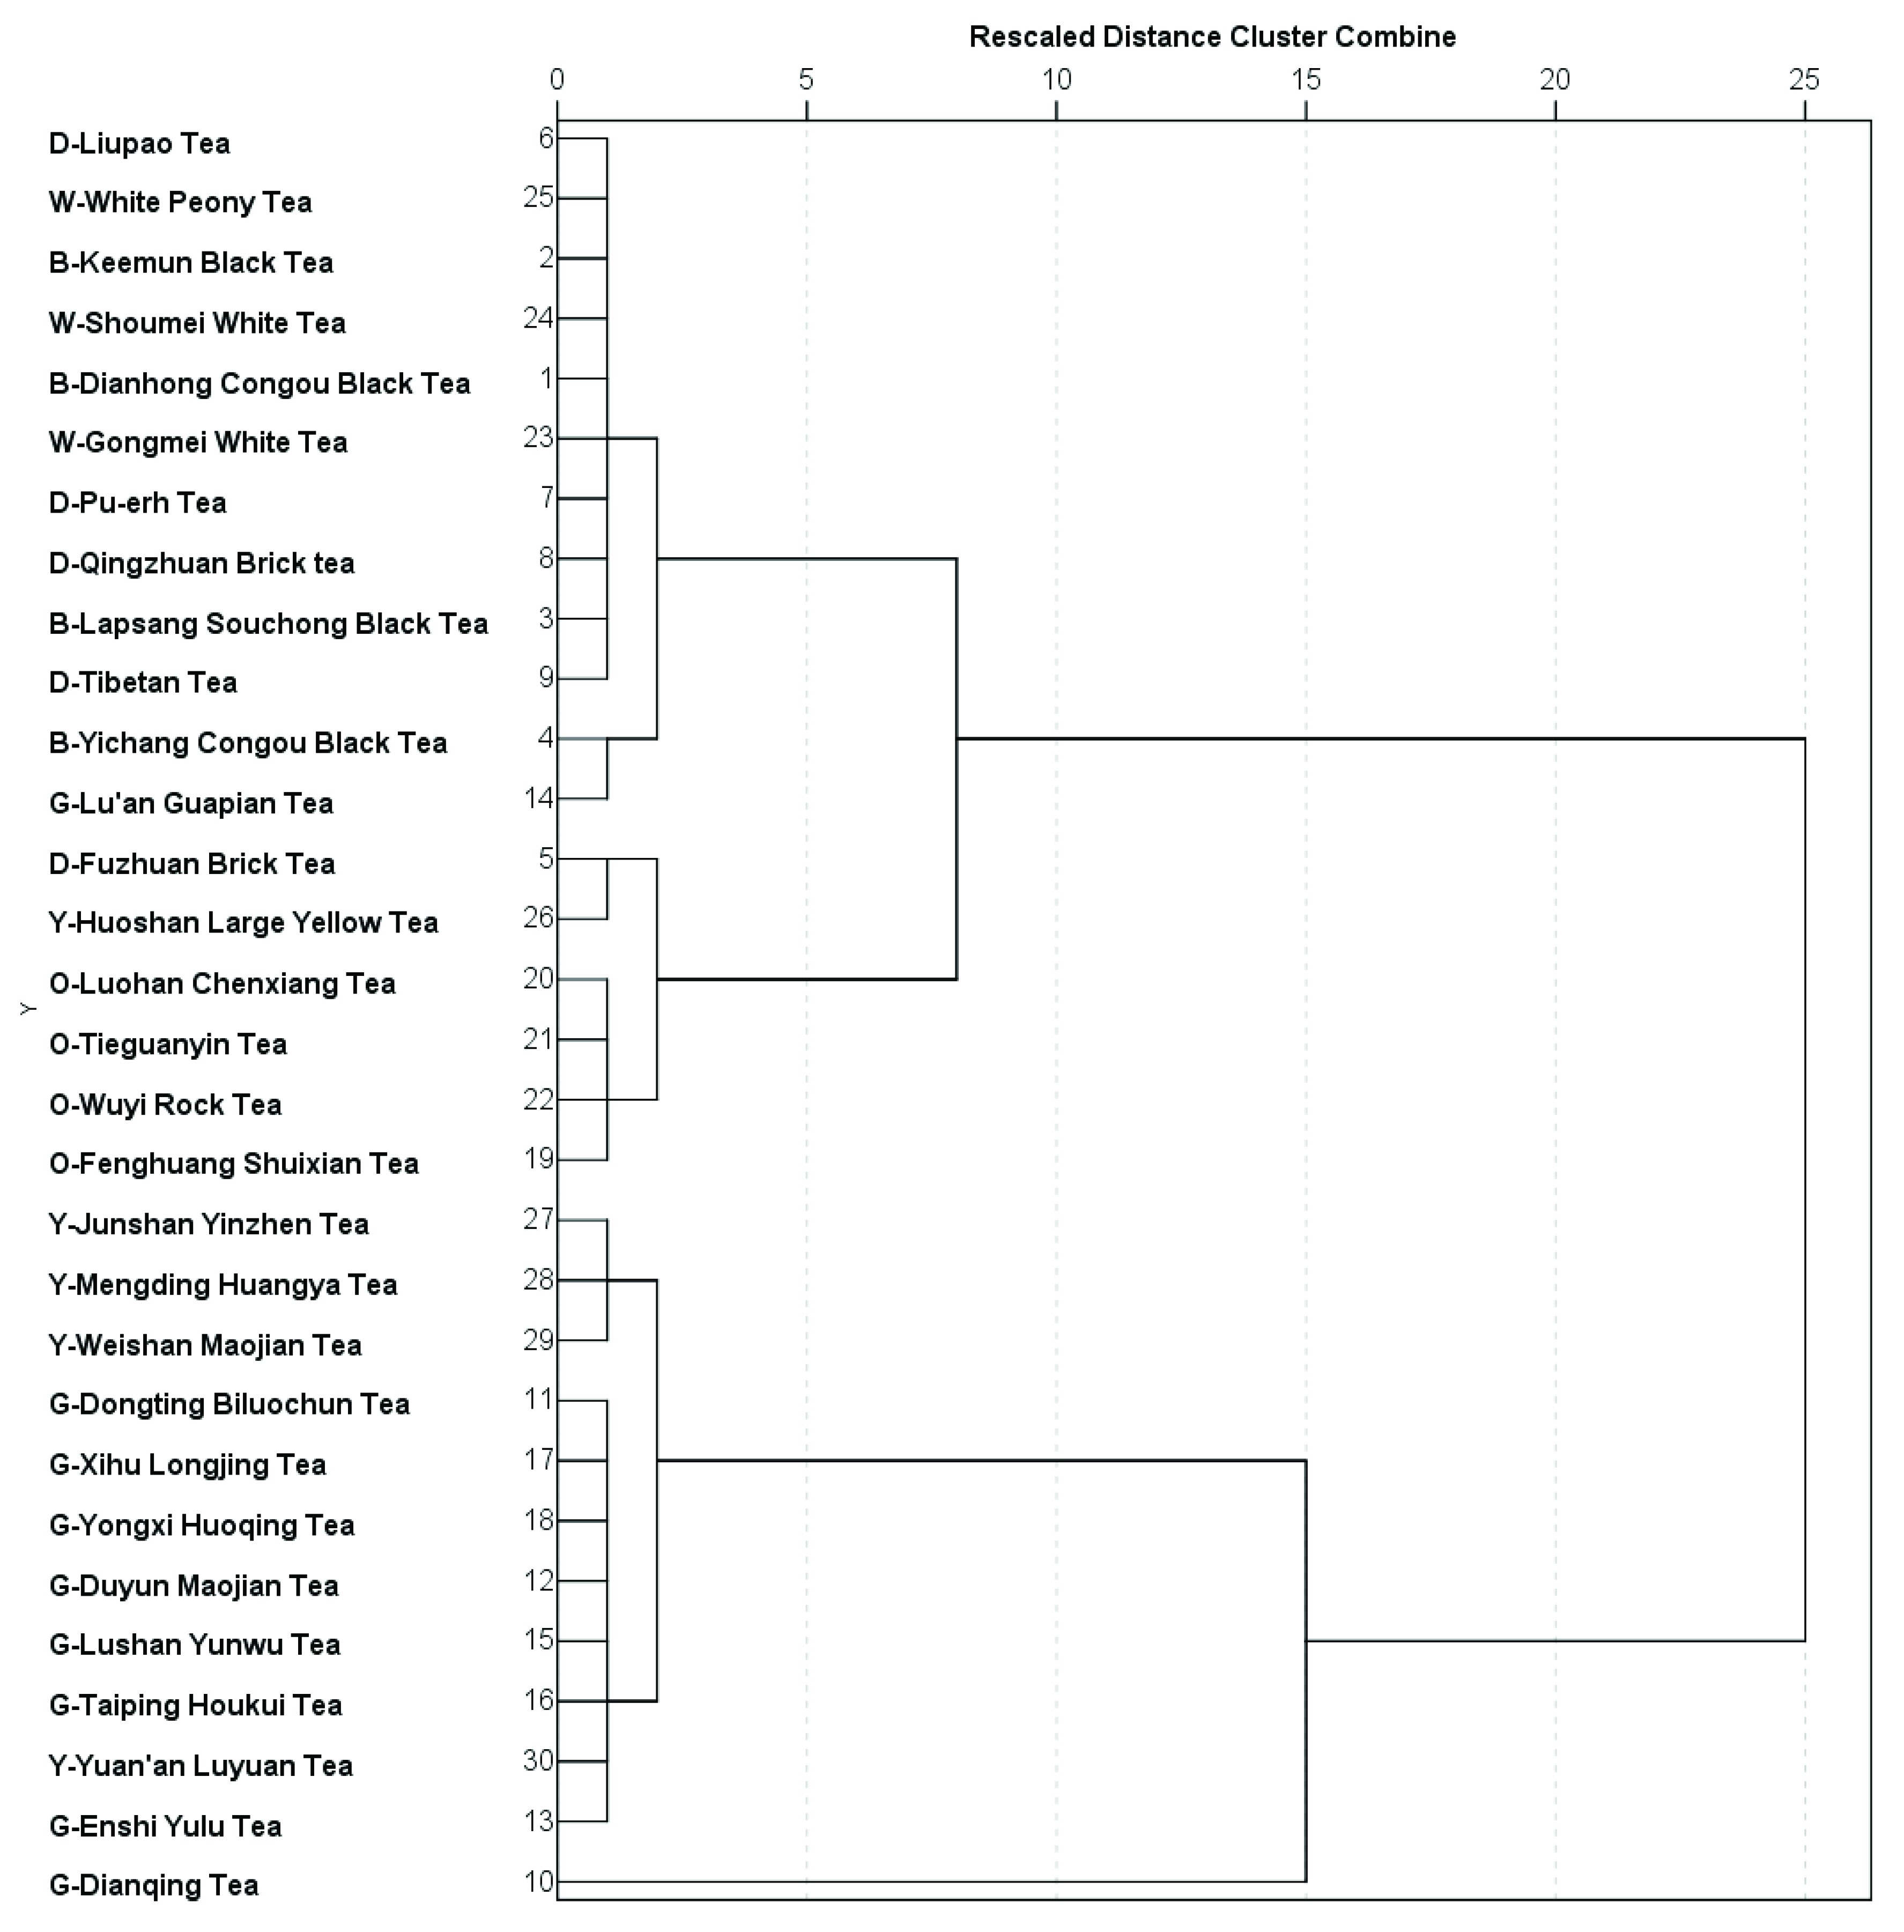
3.5. Systematic Cluster of the Tested Teas
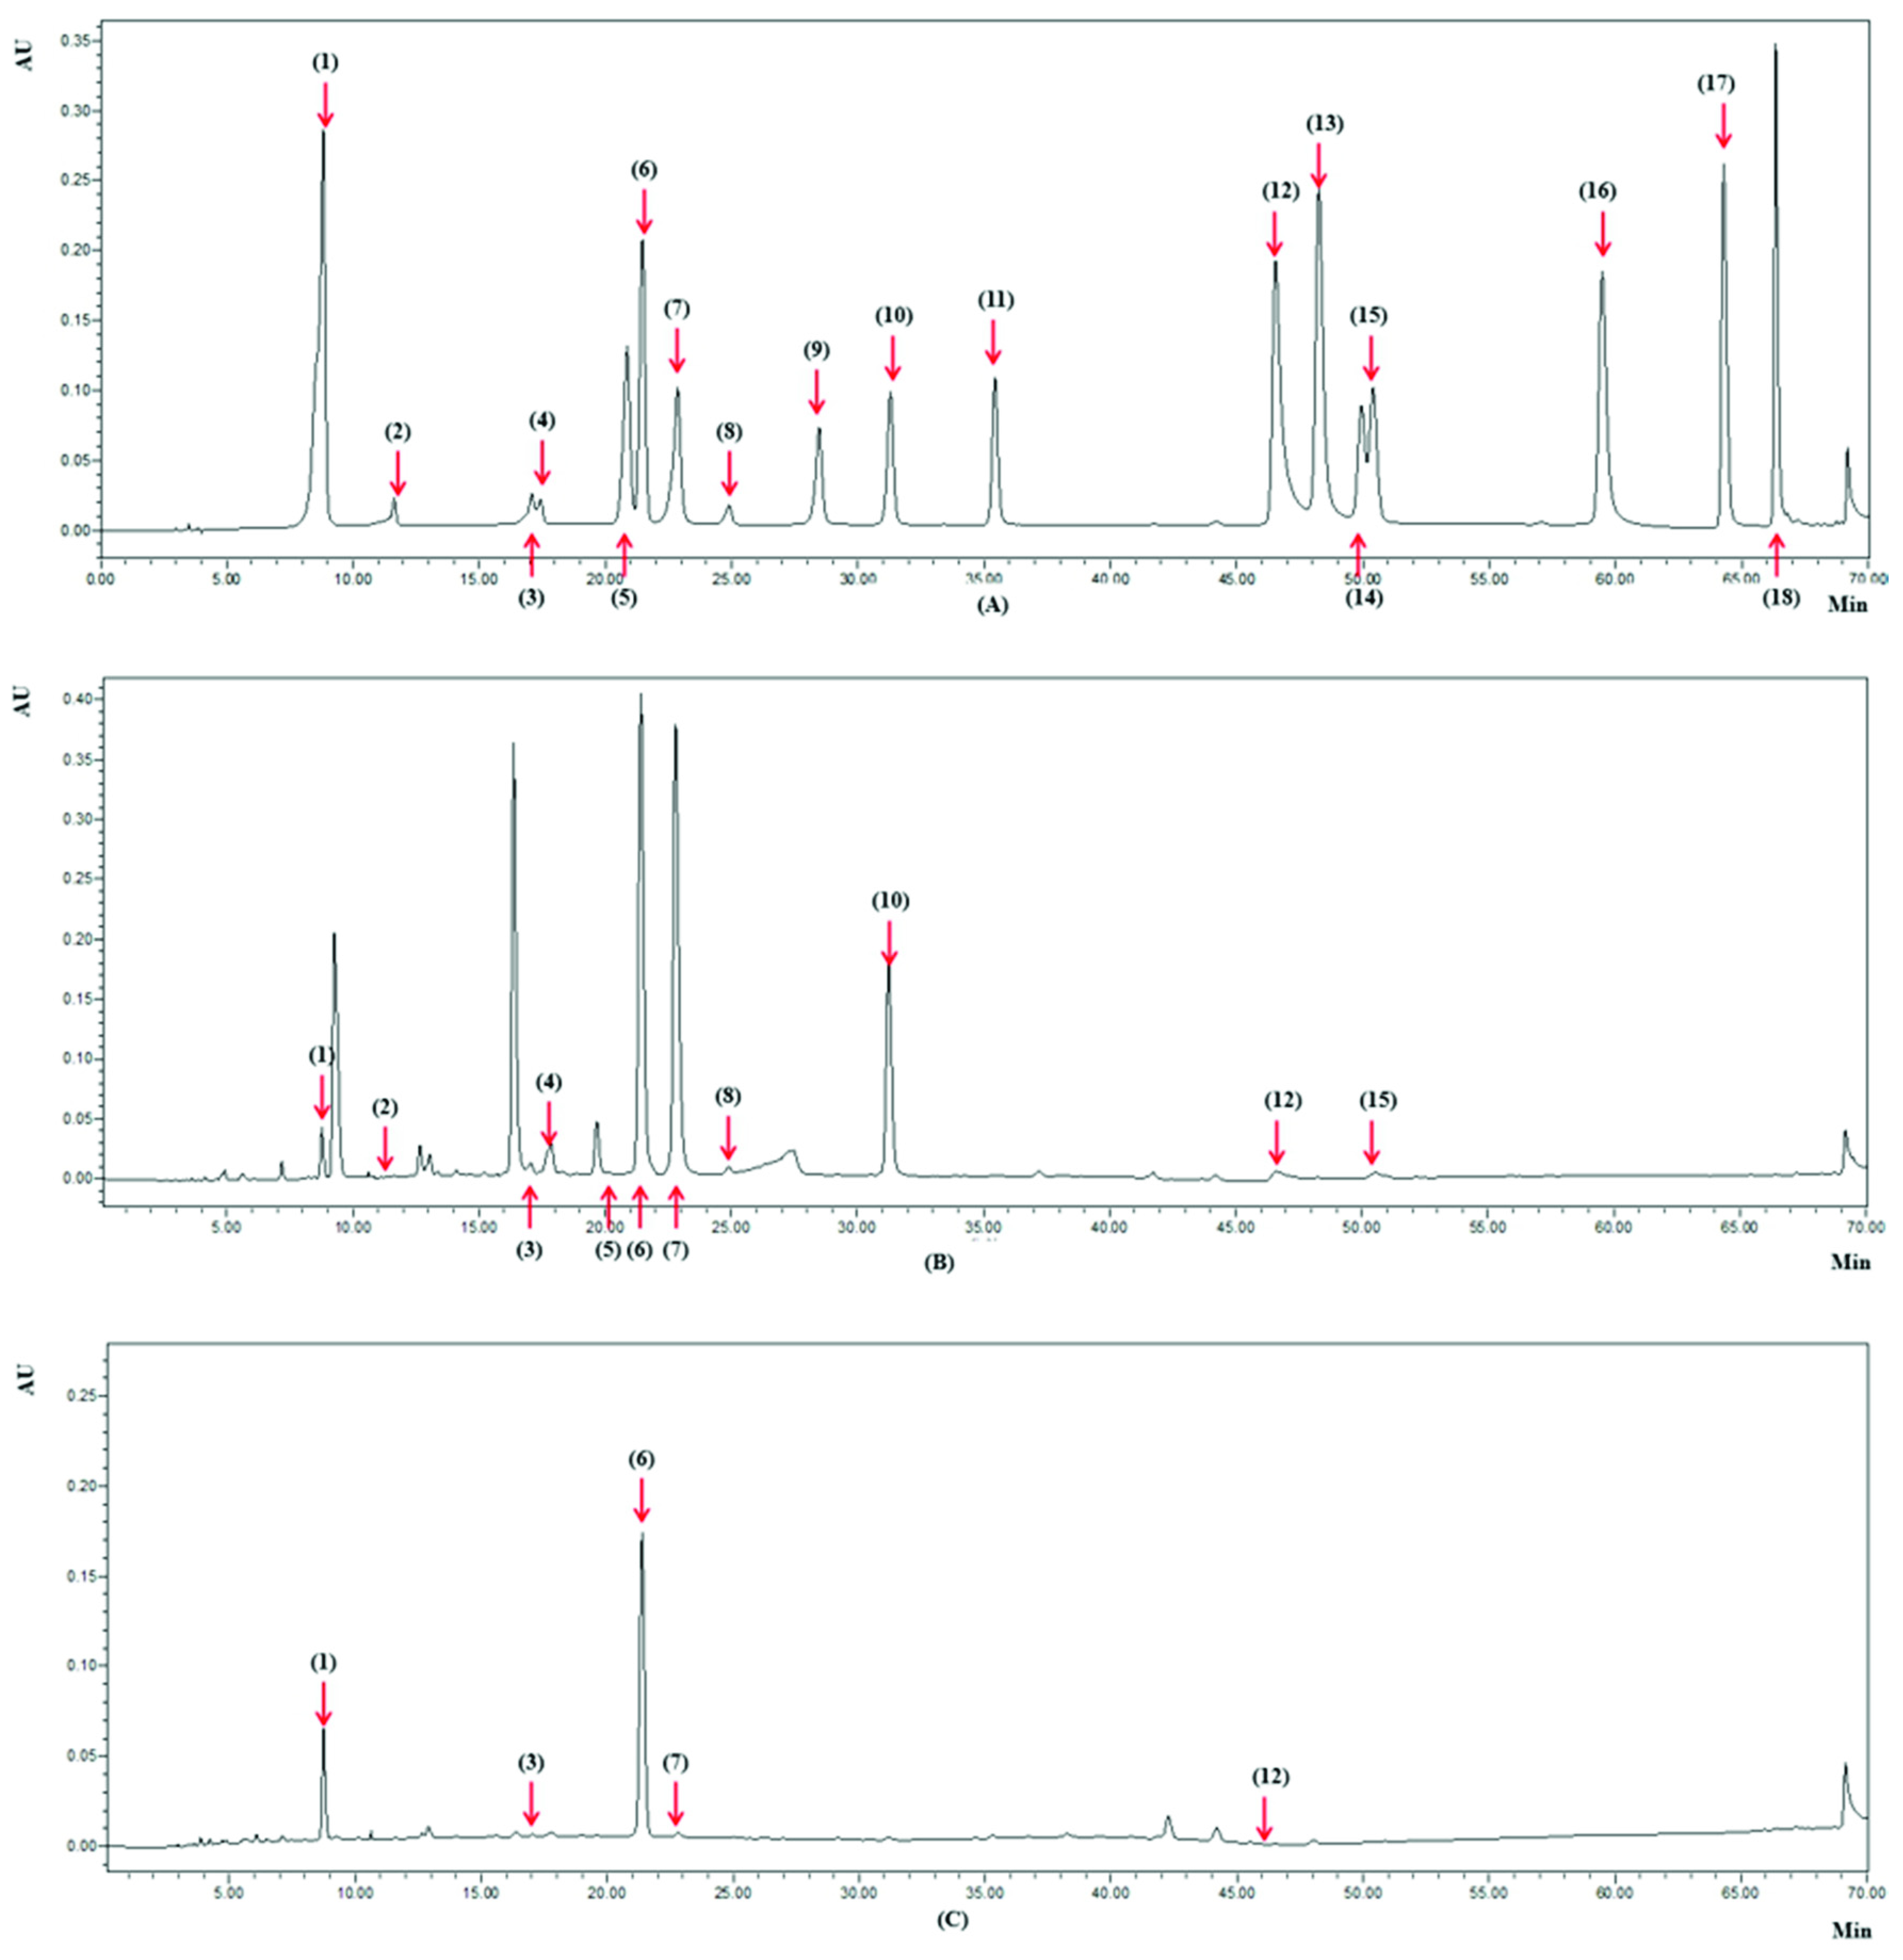
3.6. Contents of Phytochemical Compounds in Teas
4. Discussion
4.1. Antioxidant Capacities of the Tested Chinese Teas
4.2. Antioxidant Phytochemical Components of the Tested Chinese Teas
4.3. Comparison of Antioxidant Phytochemicals among Different Chinese Teas
5. Conclusions
Author Contributions
Funding
Conflicts of Interest
References
- Hashimoto, T.; Goto, M.; Sakakibara, H.; Oi, N.; Okamoto, M.; Kanazawa, K. Yellow tea is more potent than other types of tea in suppressing liver toxicity induced by carbon tetrachloride in rats. Phytother. Res. 2007, 21, 668–670. [Google Scholar] [CrossRef] [PubMed]
- Braud, L.; Battault, S.; Meyer, G.; Nascimento, A.; Gaillard, S.; de Sousa, G.; Rahmani, R.; Riva, C.; Armand, M.; Maixent, J.M.; et al. Antioxidant properties of tea blunt ROS-dependent lipogenesis: Beneficial effect on hepatic steatosis in a high fat-high sucrose diet NAFLD obese rat model. J. Nutr. Biochem. 2017, 40, 95–104. [Google Scholar] [CrossRef]
- Di Lorenzo, A.; Nabavi, S.F.; Sureda, A.; Moghaddam, A.H.; Khanjani, S.; Arcidiaco, P.; Nabavi, S.M.; Daglia, M. Antidepressive-like effects and antioxidant activity of green tea and GABA green tea in a mouse model of post-stroke depression. Mol. Nutr. Food Res. 2016, 60, 566–579. [Google Scholar] [CrossRef] [PubMed]
- Guo, Y.J.; Sun, L.Q.; Yu, B.Y.; Qi, J. An integrated antioxidant activity fingerprint for commercial teas based on their capacities to scavenge reactive oxygen species. Food Chem. 2017, 237, 645–653. [Google Scholar] [CrossRef] [PubMed]
- Kim, Y.H.; Won, Y.S.; Yang, X.; Kumazoe, M.; Yamashita, S.; Hara, A.; Takagaki, A.; Goto, K.; Nanjo, F.; Tachibana, H. Green tea catechin metabolites exert immunoregulatory effects on CD4+ T cell and natural killer cell activities. J. Agr. Food Chem. 2016, 64, 3591–3597. [Google Scholar] [CrossRef] [PubMed]
- Leung, F.P.; Yung, L.M.; Ngai, C.Y.; Cheang, W.S.; Tian, X.Y.; Lau, C.W.; Zhang, Y.; Liu, J.; Chen, Z.Y.; Bian, Z.X.; et al. Chronic black tea extract consumption improves endothelial function in ovariectomized rats. Eur. J. Nutr. 2016, 55, 1963–1972. [Google Scholar] [CrossRef] [PubMed]
- Liu, K.; Zhou, R.; Wang, B.; Chen, K.; Shi, L.Y.; Zhu, T.D.; Mi, M.T. Effect of green tea on glucose control and insulin sensitivity: A meta-analysis of 17 randomized controlled trials. Am. J. Clin. Nutr. 2013, 98, 340–348. [Google Scholar] [CrossRef] [PubMed]
- Nam, M.; Choi, M.S.; Choi, J.Y.; Kim, N.; Kim, M.S.; Jung, S.; Kim, J.; Ryu, D.H.; Hwang, G.S. Effect of green tea on hepatic lipid metabolism in mice fed a high-fat diet. J. Nutr. Biochem. 2018, 51, 1–7. [Google Scholar] [CrossRef]
- Scoparo, C.T.; de Souza, L.M.; Rattmann, Y.D.; Kiatkoski, E.C.; Dartora, N.; Iacomini, M. The protective effect of green and black teas (Camellia sinensis) and their identified compounds against murine sepsis. Food Res. Int. 2016, 83, 102–111. [Google Scholar] [CrossRef]
- Torello, C.O.; Shiraishi, R.N.; Della Via, F.I.; de Castro, T.; Longhini, A.L.; Santos, I.; Bombeiro, A.L.; Silva, C.; Queiroz, M.; Rego, E.M.; et al. Reactive oxygen species production triggers green tea-induced anti-leukaemic effects on acute promyelocytic leukaemia model. Cancer Lett. 2018, 414, 116–126. [Google Scholar] [CrossRef]
- Bi, W.; He, C.N.; Ma, Y.Y.; Shen, J.; Zhang, L.H.; Peng, Y.; Xiao, P.G. Investigation of free amino acid, total phenolics, antioxidant activity and purine alkaloids to assess the health properties of non-Camellia tea. ACTA Pharm. Sin. B 2016, 6, 170–181. [Google Scholar] [CrossRef] [PubMed]
- Pan, H.B.; Wang, F.; Rankin, G.O.; Rojanasakul, Y.; Tu, Y.Y.; Chen, Y.C. Inhibitory effect of black tea pigments, theaflavin-3/3′-gallate against cisplatin-resistant ovarian cancer cells by inducing apoptosis and G1 cell cycle arrest. Int. J. Oncol. 2017, 51, 1508–1520. [Google Scholar] [CrossRef]
- Sun, L.J.; Warren, F.J.; Gidley, M.J. Soluble polysaccharides reduce binding and inhibitory activity of tea polyphenols against porcine pancreatic α-amylase. Food Hydrocolloid. 2018, 79, 63–70. [Google Scholar] [CrossRef]
- Tao, L.; Park, J.Y.; Lambert, J.D. Differential prooxidative effects of the green tea polyphenol, (−)-epigallocatechin-3-gallate, in normal and oral cancer cells are related to differences in sirtuin 3 signaling. Mol. Nutr. Food Res. 2015, 59, 203–211. [Google Scholar] [CrossRef] [PubMed]
- Wang, B.; Tu, Y.; Zhao, S.P.; Hao, Y.H.; Liu, J.X.; Liu, F.H.; Xiong, B.H.; Jiang, L.S. Effect of tea saponins on milk performance, milk fatty acids, and immune function in dairy cow. J. Dairy Sci. 2017, 100, 8043–8052. [Google Scholar] [CrossRef] [PubMed]
- Li, L.; Chen, C.Y.O.; Chun, H.; Cho, S.; Park, K.; Lee-Kim, Y.C.; Blumberg, J.B.; Russell, R.M.; Yeum, K. A fluorometric assay to determine antioxidant activity of both hydrophilic and lipophilic components in plant foods. J. Nutr. Biochem. 2009, 20, 219–226. [Google Scholar] [CrossRef] [PubMed]
- Nardini, M.; Cirillo, E.; Natella, F.; Mencarelli, D.; Comisso, A.; Scaccini, C. Detection of bound phenolic acids: Prevention by ascorbic acid and ethylenediaminetetraacetic acid of degradation of phenolic acids during alkaline hydrolysis. Food Chem. 2002, 79, 119–124. [Google Scholar] [CrossRef]
- Tang, G.Y.; Zhao, C.N.; Liu, Q.; Feng, X.L.; Xu, X.Y.; Cao, S.Y.; Meng, X.; Li, S.; Gan, R.Y.; Li, H.B. Potential of grape wastes as a natural source of bioactive compounds. Molecules 2018, 23, 2598. [Google Scholar] [CrossRef] [PubMed]
- Benzie, I.F.F.; Strain, J.J. The ferric reducing ability of plasma (FRAP) as a measure of “Antioxidant power”: The FRAP assay. Anal. Biochem. 1996, 239, 70–76. [Google Scholar] [CrossRef] [PubMed]
- Re, R.; Pellegrini, N.; Proteggente, A.; Pannala, A.; Yang, M.; Rice-Evans, C. Antioxidant activity applying an improved ABTS radical cation decolorization assay. Free Radi. Biol. Med. 1999, 26, 1231–1237. [Google Scholar] [CrossRef]
- Singleton, V.L.; Orthofer, R.; Lamuela-Raventos, R.M. Analysis of total phenols and other oxidation substrates and antioxidants by means of Folin–Ciocalteu reagent. In Oxidants and Antioxidants; Packer, L., Ed.; Elsevier Academic Press Inc.: San Diego, CA, USA, 1999; Volume 299, pp. 152–178. [Google Scholar]
- Cai, Y.Z.; Luo, Q.; Sun, M.; Corke, H. Antioxidant activity and phenolic compounds of 112 traditional Chinese medicinal plants associated with anticancer. Life Sci. 2004, 74, 2157–2184. [Google Scholar] [CrossRef] [PubMed]
- Deng, G.F.; Lin, X.; Xu, X.R.; Gao, L.L.; Xie, J.F.; Li, H.B. Antioxidant capacities and total phenolic contents of 56 vegetables. J. Funct. Foods. 2013, 5, 260–266. [Google Scholar] [CrossRef]
- Fu, L.; Xu, B.T.; Xu, X.R.; Gan, R.Y.; Zhang, Y.; Xia, E.Q.; Li, H.B. Antioxidant capacities and total phenolic contents of 62 fruits. Food Chem. 2011, 129, 345–350. [Google Scholar] [CrossRef] [PubMed]
- Gan, R.Y.; Li, H.B.; Gunaratne, A.; Sui, Z.Q.; Corke, H. Effects of fermented edible seeds and their products on human health: Bioactive components and bioactivities. Compr. Rev. Food Sci. Food Saf. 2017, 16, 489–531. [Google Scholar] [CrossRef]
- Li, S.; Li, S.K.; Gan, R.Y.; Song, F.L.; Kuang, L.; Li, H.B. Antioxidant capacities and total phenolic contents of infusions from 223 medicinal plants. Ind. Crop. Prod. 2013, 51, 289–298. [Google Scholar] [CrossRef]
- Meng, X.; Li, Y.; Li, S.; Gan, R.Y.; Li, H.B. Natural products for prevention and treatment of chemical-induced liver injuries. Compr. Rev. Food Sci. Food Saf. 2018, 17, 472–495. [Google Scholar] [CrossRef]
- Tang, G.Y.; Meng, X.; Li, Y.; Zhao, C.N.; Liu, Q.; Li, H.B. Effects of vegetables on cardiovascular diseases and related mechanisms. Nutrients 2017, 9, 857. [Google Scholar] [CrossRef]
- Zhao, C.N.; Meng, X.; Li, Y.; Li, S.; Liu, Q.; Tang, G.Y.; Li, H.B. Fruits for prevention and treatment of cardiovascular diseases. Nutrients 2017, 9, 598. [Google Scholar] [CrossRef]
- Nilsson, J.; Pillai, D.; Onning, G.; Persson, C.; Nilsson, A.; Akesson, B. Comparison of the 2,2′-azinobis-3-ethylbenzotiazoline-6-sulfonic acid (ABTS) and ferric reducing antioxidant power (FRAP) methods to asses the total antioxidant capacity in extracts of fruit and vegetables. Mol. Nutr. Food Res. 2005, 49, 239–246. [Google Scholar] [CrossRef]
- Raudonis, R.; Raudone, L.; Jakstas, V.; Janulis, V. Comparative evaluation of post-column free radical scavenging and ferric reducing antioxidant power assays for screening of antioxidants in strawberries. J. Chromatogr. A. 2012, 1233, 8–15. [Google Scholar] [CrossRef]
- Pastoriza, S.; Perez-Burillo, S.; Rufian-Henares, J.A. How brewing parameters affect the healthy profile of tea. Curr. Opin. Food Sci. 2017, 14, 7–12. [Google Scholar] [CrossRef]
- Hayes, W.A.; Mills, D.S.; Neville, R.F.; Kiddie, J.; Collins, L.M. Determination of the molar extinction coefficient for the ferric reducing/antioxidant power assay. Anal. Biochem. 2011, 416, 202–205. [Google Scholar] [CrossRef]
- Pohanka, M.; Bandouchova, H.; Sobotka, J.; Sedlackova, J.; Soukupova, I.; Pikula, J. Ferric reducing antioxidant power and square wave voltammetry for assay of low molecular weight antioxidants in blood plasma: Performance and comparison of methods. Sensors 2009, 9, 9094–9103. [Google Scholar] [CrossRef] [PubMed]
- Van den Berg, R.; Haenen, G.; van den Berg, H.; van der Vijgh, W.; Bast, A. The predictive value of the antioxidant capacity of structurally related flavonoids using the Trolox equivalent antioxidant capacity (TEAC) assay. Food Chem. 2000, 70, 391–395. [Google Scholar] [CrossRef]
- Deng, G.F.; Shen, C.; Xu, X.R.; Kuang, R.D.; Guo, Y.J.; Zeng, L.S.; Gao, L.L.; Lin, X.; Xie, J.F.; Xia, E.Q.; et al. Potential of fruit wastes as natural resources of bioactive compounds. Int. J. Mol. Sci. 2012, 13, 8308–8323. [Google Scholar] [CrossRef] [PubMed]
- Fu, L.; Xu, B.T.; Xu, X.R.; Qin, X.S.; Gan, R.Y.; Li, H.B. Antioxidant capacities and total phenolic contents of 56 wild fruits from South China. Molecules 2010, 15, 8602–8617. [Google Scholar] [CrossRef] [PubMed]
- Guo, Y.J.; Deng, G.F.; Xu, X.R.; Wu, S.; Li, S.; Xia, E.Q.; Li, F.; Chen, F.; Ling, W.H.; Li, H.B. Antioxidant capacities, phenolic compounds and polysaccharide contents of 49 edible macro-fungi. Food Funct. 2012, 3, 1195–1205. [Google Scholar] [CrossRef] [PubMed]
- Li, A.N.; Li, S.; Li, H.B.; Xu, D.P.; Xu, X.R.; Chen, F. Total phenolic contents and antioxidant capacities of 51 edible and wild flowers. J. Funct. Foods. 2014, 6, 319–330. [Google Scholar] [CrossRef]
- Liu, Q.; Tang, G.Y.; Zhao, C.N.; Feng, X.L.; Xu, X.Y.; Cao, S.Y.; Meng, X.; Li, S.; Gan, R.Y.; Li, H.B. Comparison of antioxidant activities of different grape varieties. Molecules 2018, 23, 2432. [Google Scholar] [CrossRef]
- Li, Y.; Li, S.; Meng, X.; Gan, R.Y.; Zhang, J.J.; Li, H.B. Dietary natural products for prevention and treatment of breast cancer. Nutrients 2017, 9, 728. [Google Scholar] [CrossRef]
- Xu, D.P.; Li, Y.; Meng, X.; Zhou, T.; Zhou, Y.; Zheng, J.; Zhang, J.J.; Li, H.B. Natural antioxidants in foods and medicinal plants: Extraction, assessment and resources. Int. J. Mol. Sci. 2017, 18, 18. [Google Scholar] [CrossRef] [PubMed]
- Zheng, J.; Zhou, Y.; Li, S.; Zhang, P.; Zhou, T.; Xu, D.P.; Li, H.B. Effects and mechanisms of fruit and vegetable juices on cardiovascular diseases. Int. J. Mol. Sci. 2017, 18, 555. [Google Scholar] [CrossRef] [PubMed]
- Bartikova, H.; Skalova, L.; Valentova, K.; Matouskova, P.; Szotakova, B.; Martin, J.; Kvita, V.; Bousova, I. Effect of oral administration of green tea extract in various dosage schemes on oxidative stress status of mice in vivo. Acta Pharm. 2015, 65, 65–73. [Google Scholar] [CrossRef] [PubMed]
- Chu, K.O.; Chan, K.P.; Yang, Y.P.; Qin, Y.J.; Li, W.Y.; Chan, S.O.; Wang, C.C.; Pang, C.P. Effects of EGCG content in green tea extract on pharmacokinetics, oxidative status and expression of inflammatory and apoptotic genes in the rat ocular tissues. J. Nutr. Biochem. 2015, 26, 1357–1367. [Google Scholar] [CrossRef] [PubMed]
- Cyboran, S.; Strugala, P.; Wloch, A.; Oszmianski, J.; Kleszczynska, H. Concentrated green tea supplement: Biological activity and molecular mechanisms. Life Sci. 2015, 126, 1–9. [Google Scholar] [CrossRef] [PubMed]
- Fei, T.Y.; Fei, J.; Huang, F.; Xie, T.P.; Xu, J.F.; Zhou, Y.; Yang, P. The anti-aging and anti-oxidation effects of tea water extract in Caenorhabditis elegans. Exp. Gerontol. 2017, 97, 89–96. [Google Scholar] [CrossRef] [PubMed]
- Liu, S.M.; Huang, H.H. Assessments of antioxidant effect of black tea extract and its rationals by erythrocyte haemolysis assay, plasma oxidation assay and cellular antioxidant activity (CAA) assay. J. Funct. Foods. 2015, 18, 1095–1105. [Google Scholar] [CrossRef]
- Peluso, I.; Manafikhi, H.; Raguzzini, A.; Longhitano, Y.; Reggi, R.; Zanza, C.; Palmery, M. The peroxidation of leukocytes index ratio reveals the prooxidant effect of green tea extract. Oxid. Med. Cell. Longev. 2016. [Google Scholar] [CrossRef]
- Xie, H.; Li, X.C.; Ren, Z.X.; Qiu, W.M.; Chen, J.L.; Jiang, Q.; Chen, B.; Chen, D.F. Antioxidant and cytoprotective effects of Tibetan tea and its phenolic components. Molecules 2018, 23, 179. [Google Scholar] [CrossRef]
- Zeng, L.; Luo, L.Y.; Li, H.J.; Liu, R.H. Phytochemical profiles and antioxidant activity of 27 cultivars of tea. Int. J. Food Sci. Nutr. 2017, 68, 525–537. [Google Scholar] [CrossRef]
- Adami, G.R.; Tangney, C.C.; Tang, J.L.; Zhou, Y.; Ghaffari, S.; Naqib, A.; Sinha, S.; Green, S.J.; Schwartz, J.L. Effects of green tea on miRNA and microbiome of oral epithelium. Sci. Rep. 2018, 8, 5873. [Google Scholar] [CrossRef] [PubMed]
- Garcia, M.L.; Pontes, R.B.; Nishi, E.E.; Ibuki, F.K.; Oliveira, V.; Sawaya, A.; Carvalho, P.O.; Nogueira, F.N.; Franco, M.D.; Campos, R.R.; et al. The antioxidant effects of green tea reduces blood pressure and sympathoexcitation in an experimental model of hypertension. J. Hypertens. 2017, 35, 348–354. [Google Scholar] [CrossRef] [PubMed]
- Reddyvari, H.; Govatati, S.; Matha, S.K.; Korla, S.V.; Malempati, S.; Pasupuleti, S.R.; Bhanoori, M.; Nallanchakravarthula, V. Therapeutic effect of green tea extract on alcohol induced hepatic mitochondrial DNA damage in albino wistar rats. J. Adv. Res. 2017, 8, 289–295. [Google Scholar] [CrossRef] [PubMed]
- Schimidt, H.L.; Garcia, A.; Martins, A.; Mello-Carpes, P.B.; Carpes, F.P. Green tea supplementation produces better neuroprotective effects than red and black tea in Alzheimer-like rat model. Food Res. Int. 2017, 100, 442–448. [Google Scholar] [CrossRef] [PubMed]
- Xie, X.; Yi, W.J.; Zhang, P.W.; Wu, N.N.; Yan, Q.Q.; Yang, H.; Tian, C.; Xiang, S.Y.; Du, M.Y.; Assefa, E.G.; et al. Green tea polyphenols, mimicking the effects of dietary restriction, ameliorate high-fat diet-induced kidney injury via regulating autophagy flux. Nutrients 2017, 9, 497. [Google Scholar] [CrossRef] [PubMed]
- Gupta, S.; Chaudhuri, T.; Seth, P.; Ganguly, D.K.; Giri, A.K. Antimutagenic effects of black tea (world blend) and its two active polyphenols theaflavins and thearubigins in Salmonella assays. Phytother. Res. 2002, 16, 655–661. [Google Scholar] [CrossRef]
- Pereira-Caro, G.; Moreno-Rojas, J.M.; Brindani, N.; Del Rio, D.; Lean, M.; Hara, Y.; Crozier, A. Bioavailability of black tea theaflavins: Absorption, metabolism, and colonic catabolism. J. Agr. Food Chem. 2017, 65, 5365–5374. [Google Scholar] [CrossRef]
- Wang, Q.P.; Belscak-Cvitanovic, A.; Durgo, K.; Chisti, Y.; Gong, J.S.; Sirisansaneeyakul, S.; Komes, D. Physicochemical properties and biological activities of a high-theabrownins instant Pu-erh tea produced using Aspergillus tubingensis. LWT-Food Sci. Technol. 2018, 90, 598–605. [Google Scholar] [CrossRef]
- Baptista, J.; Lima, E.; Paiva, L.; Andrade, A.L.; Alves, M.G. Comparison of Azorean tea theanine to teas from other origins by HPLC/DAD/FD. Effect of fermentation, drying temperature, drying time and shoot maturity. Food Chem. 2012, 132, 2181–2187. [Google Scholar] [CrossRef]
- Jayabalan, R.; Malbasa, R.V.; Loncar, E.S.; Vitas, J.S.; Sathishkumar, M. A review on Kombucha tea microbiology, composition, fermentation, beneficial effects, toxicity, and tea fungus. Compr. Rev. Food Sci. Food Saf. 2014, 13, 538–550. [Google Scholar] [CrossRef]
- Zhao, D.Y.; Shah, N.P. Concomitant ingestion of lactic acid bacteria and black tea synergistically enhances flavonoid bioavailability and attenuates D-galactose-induced oxidative stress in mice via modulating glutathione antioxidant system. J. Nutr. Biochem. 2016, 38, 116–124. [Google Scholar] [CrossRef] [PubMed]
- Jochmann, N.; Lorenz, M.; von Krosigk, A.; Martus, P.; Bohm, V.; Baumann, G.; Stangl, K.; Stangl, V. The efficacy of black tea in ameliorating endothelial function is equivalent to that of green tea. Brit. J. Nutr. 2008, 99, 863–868. [Google Scholar] [CrossRef] [PubMed]


| No. | Name | Category | Fermentation Degree | Production Place |
|---|---|---|---|---|
| 1 | Dianhong Congou Black Tea | Black tea | Deep-fermented | Kunming, Yunnan |
| 2 | Keemun Black Tea | Black tea | Deep-fermented | Qimen, Anhui |
| 3 | Lapsang Souchong Black Tea | Black tea | Deep-fermented | Wuyishan, Fujian |
| 4 | Yichang Congou Black Tea | Black tea | Deep-fermented | Yichang, Hubei |
| 5 | Fuzhuan Brick Tea | Dark tea | Post-fermented | Anhua, Hubei |
| 6 | Liupao Tea | Dark tea | Post-fermented | Wuzhou, Guangxi |
| 7 | Pu-erh Tea | Dark tea | Post-fermented | Pu’er, Yunnan |
| 8 | Qingzhuan Brick tea | Dark tea | Post-fermented | Chibi, Hubei |
| 9 | Tibetan Tea | Dark tea | Post-fermented | Ya’an, Sichuan |
| 10 | Dianqing Tea | Green tea | Unfermented | Kunming, Yunnan |
| 11 | Dongting Biluochun Tea | Green tea | Unfermented | Suzhou, Jiangsu |
| 12 | Duyun Maojian Tea | Green tea | Unfermented | Duyun, Guizhou |
| 13 | Enshi Yulu Tea | Green tea | Unfermented | Enshi, Hubei |
| 14 | Lu’an Guapian Tea | Green tea | Unfermented | Lu’an, Anhui |
| 15 | Lushan Yunwu Tea | Green tea | Unfermented | Jiujiang, Jiangxi |
| 16 | Taiping Houkui Tea | Green tea | Unfermented | Huangshan, Anhui |
| 17 | Xihu Longjing Tea | Green tea | Unfermented | Hangzhou, Zhejiang |
| 18 | Yongxi Huoqing Tea | Green tea | Unfermented | Jingxian, Anhui |
| 19 | Fenghuang Shuixian Tea | Oolong tea | Semi-fermented | Chao’an, Guangdong |
| 20 | Luohan Chenxiang Tea | Oolong tea | Semi-fermented | Mengdingshan, Sichuan |
| 21 | Tieguanyin Tea | Oolong tea | Semi-fermented | Anxi, Fujian |
| 22 | Wuyi Rock Tea | Oolong tea | Semi-fermented | Wuyishan, Fujian |
| 23 | Gongmei White Tea | White tea | Mild-fermented | Nanping, Fujian |
| 24 | Shoumei White Tea | White tea | Mild-fermented | Nanping, Fujian |
| 25 | White Peony Tea | White tea | Mild-fermented | Nanping, Fujian |
| 26 | Huoshan Large Yellow Tea | Yellow tea | Light-fermented | Lu’an, Anhui |
| 27 | Junshan Yinzhen Tea | Yellow tea | Light-fermented | Yueyang, Hunan |
| 28 | Mengding Huangya Tea | Yellow tea | Light-fermented | Mengdingshan, Sichuan |
| 29 | Weishan Maojian Tea | Yellow tea | Light-fermented | Ningxiang, Hunan |
| 30 | Yuan’an Luyuan Tea | Yellow tea | Light-fermented | Yichang, Hubei |
| No. | Name | Category | FRAP Value (μmol Fe(II)/g DW) | ||||
|---|---|---|---|---|---|---|---|
| Fat-Soluble Fraction | Water-Soluble Fraction | Bound-Insoluble Fraction | Total | Mean ± SD of Categories | |||
| 1 | Dianhong Congou Black Tea | Black tea | 11.53 ± 0.27 | 1142.49 ± 5.55 | 115.29 ± 0.54 | 1269.31 ± 5.88 | 1141.58 ± 13.92 a |
| 2 | Keemun Black Tea | Black tea | 5.20 ± 0.17 | 1034.93 ± 36.25 | 88.41 ± 1.93 | 1128.53 ± 34.52 | |
| 3 | Lapsang Souchong Black Tea | Black tea | 15.53 ± 0.58 | 585.60 ± 7.42 | 78.32 ± 2.79 | 679.45 ± 8.29 | |
| 4 | Yichang Congou Black Tea | Black tea | 4.56 ± 0.43 | 1371.38 ± 5.05 | 113.07 ± 1.53 | 1489.01 ± 6.98 | |
| 5 | Fuzhuan Brick Tea | Dark tea | 65.53 ± 1.89 | 2318.76 ± 77.12 | 100.66 ± 3.01 | 2484.94 ± 80.20 | 1124.96 ± 23.87 a |
| 6 | Liupao Tea | Dark tea | 5.01 ± 0.29 | 922.49 ± 12.03 | 62.13 ± 0.70 | 989.62 ± 11.40 | |
| 7 | Pu-erh Tea | Dark tea | 5.10 ± 0.11 | 725.60 ± 18.04 | 72.77 ± 1.16 | 803.46 ± 16.99 | |
| 8 | Qingzhuan Brick tea | Dark tea | 38.20 ± 0.73 | 648.71 ± 6.16 | 48.68 ± 0.96 | 735.59 ± 5.64 | |
| 9 | Tibetan Tea | Dark tea | 31.31 ± 0.69 | 534.04 ± 4.68 | 45.82 ± 0.59 | 611.18 ± 5.09 | |
| 10 | Dianqing Tea | Green tea | 250.73 ± 8.97 | 4937.24 ± 236.20 | 187.20 ± 0.88 | 5375.18 ± 228.43 | 3621.75 ± 81.44 b |
| 11 | Dongting Biluochun Tea | Green tea | 230.51 ± 10.31 | 3515.73 ± 37.33 | 98.96 ± 1.56 | 3845.21 ± 44.17 | |
| 12 | Duyun Maojian Tea | Green tea | 71.31 ± 1.58 | 3442.84 ± 50.69 | 150.81 ± 4.30 | 3664.97 ± 53.33 | |
| 13 | Enshi Yulu Tea | Green tea | 44.26 ± 1.55 | 3037.51 ± 13.42 | 179.64 ± 2.28 | 3261.41 ± 14.50 | |
| 14 | Lu’an Guapian Tea | Green tea | 67.92 ± 1.01 | 1413.60 ± 43.90 | 131.76 ± 3.17 | 1613.28 ± 43.98 | |
| 15 | Lushan Yunwu Tea | Green tea | 93.42 ± 2.68 | 3396.62 ± 83.02 | 128.98 ± 3.08 | 3619.02 ± 83.57 | |
| 16 | Taiping Houkui Tea | Green tea | 139.26 ± 4.23 | 3272.18 ± 117.50 | 126.42 ± 2.34 | 3537.86 ± 112.24 | |
| 17 | Xihu Longjing Tea | Green tea | 196.62 ± 4.99 | 3650.84 ± 53.42 | 78.85 ± 5.71 | 3926.32 ± 56.00 | |
| 18 | Yongxi Huoqing Tea | Green tea | 90.20 ± 1.69 | 3512.18 ± 96.79 | 150.14 ± 1.39 | 3752.52 ± 96.75 | |
| 19 | Fenghuang Shuixian Tea | Oolong tea | 43.40 ± 4.37 | 2069.87 ± 55.49 | 144.26 ± 1.51 | 2257.52 ± 50.42 | 2013.37 ± 26.17 a |
| 20 | Luohan Chenxiang Tea | Oolong tea | 26.03 ± 0.29 | 1827.20 ± 12.22 | 79.77 ± 0.30 | 1933.00 ± 12.52 | |
| 21 | Tieguanyin Tea | Oolong tea | 84.73 ± 5.69 | 1911.64 ± 10.10 | 59.82 ± 0.39 | 2056.20 ± 4.96 | |
| 22 | Wuyi Rock Tea | Oolong tea | 20.62 ± 1.40 | 1696.53 ± 34.87 | 89.60 ± 1.81 | 1806.75 ± 36.77 | |
| 23 | Gongmei White Tea | White tea | 31.03 ± 1.69 | 1149.16 ± 16.67 | 81.63 ± 1.86 | 1261.82 ± 18.31 | 1093.64 ± 16.82 a |
| 24 | Shoumei White Tea | White tea | 28.09 ± 1.25 | 934.49 ± 28.98 | 82.85 ± 1.39 | 1045.43 ± 29.22 | |
| 25 | White Peony Tea | White tea | 32.37 ± 0.76 | 849.16 ± 2.04 | 92.16 ± 1.47 | 973.68 ± 2.92 | |
| 26 | Huoshan Large Yellow Tea | Yellow tea | 77.64 ± 2.28 | 2539.20 ± 14.11 | 89.24 ± 0.50 | 2706.08 ± 15.16 | 3182.34 ± 31.31 b |
| 27 | Junshan Yinzhen Tea | Yellow tea | 144.81 ± 3.73 | 3137.42 ± 26.71 | 84.27 ± 1.97 | 3366.50 ± 21.49 | |
| 28 | Mengding Huangya Tea | Yellow tea | 112.03 ± 5.95 | 3173.87 ± 16.22 | 68.02 ± 1.80 | 3353.92 ± 10.48 | |
| 29 | Weishan Maojian Tea | Yellow tea | 82.53 ± 4.64 | 2862.76 ± 80.24 | 98.46 ± 1.17 | 3043.75 ± 78.43 | |
| 30 | Yuan’an Luyuan Tea | Yellow tea | 93.31 ± 3.08 | 3254.40 ± 29.70 | 93.74 ± 0.19 | 3441.45 ± 30.99 | |
| Index | Fraction | Statistical Description | p Value by Non-Parametric Test | ||||||||
|---|---|---|---|---|---|---|---|---|---|---|---|
| MIN | QL | M | QU | MAX | Item | M-W | Moses | K-S | W-W | ||
| FRAP | 1 | 4.56 | 24.68 | 54.89 | 93.34 | 250.73 | a | <0.001 | <0.001 | <0.001 | <0.001 |
| 2 | 534.04 | 1009.82 | 1990.76 | 3258.84 | 4937.24 | b | <0.001 | <0.001 | <0.001 | <0.001 | |
| 3 | 45.82 | 78.72 | 90.88 | 127.06 | 187.20 | c | =0.003 | =1.000 | =0.001 | =0.025 | |
| TEAC | 1 | 9.25 | 24.17 | 45.53 | 66.21 | 137.97 | a | <0.001 | <0.001 | <0.001 | <0.001 |
| 2 | 277.41 | 568.63 | 1295.08 | 1881.65 | 2754.98 | b | <0.001 | <0.001 | <0.001 | <0.001 | |
| 3 | 34.34 | 51.52 | 61.42 | 77.67 | 111.45 | c | =0.005 | =1.000 | =0.016 | 0.181 | |
| TPC | 1 | 1.56 | 3.47 | 4.75 | 6.50 | 11.26 | a | <0.001 | <0.001 | <0.001 | <0.001 |
| 2 | 32.26 | 81.37 | 149.58 | 190.77 | 236.50 | b | <0.001 | <0.001 | <0.001 | <0.001 | |
| 3 | 3.08 | 5.36 | 6.43 | 8.45 | 11.04 | c | =0.006 | =1.000 | =0.016 | =0.347 | |
| No. | Name | Category | TEAC Value (μmol Trolox/g DW) | ||||
|---|---|---|---|---|---|---|---|
| Fat-Soluble Fraction | Water-Soluble Fraction | Bound-Insoluble Fraction | Total | Mean ± SD of Categories | |||
| 1 | Dianhong Congou Black Tea | Black tea | 44.84 ± 1.38 | 627.92 ± 6.80 | 78.68 ± 1.19 | 751.44 ± 7.20 | 724.28 ± 12.63 a |
| 2 | Keemun Black Tea | Black tea | 26.43 ± 0.70 | 570.24 ± 17.10 | 64.24 ± 1.54 | 660.91 ± 15.26 | |
| 3 | Lapsang Souchong Black Tea | Black tea | 53.14 ± 2.44 | 355.48 ± 8.80 | 56.04 ± 1.92 | 464.67 ± 8.89 | |
| 4 | Yichang Congou Black Tea | Black tea | 24.12 ± 0.77 | 918.66 ± 18.82 | 77.34 ± 1.26 | 1020.11 ± 19.17 | |
| 5 | Fuzhuan Brick Tea | Dark tea | 40.58 ± 0.66 | 1172.97 ± 21.52 | 66.19 ± 1.19 | 1279.74 ± 21.17 | 589.43 ± 8.35 a |
| 6 | Liupao Tea | Dark tea | 22.90 ± 1.29 | 460.32 ± 9.97 | 48.23 ± 1.04 | 531.45 ± 9.97 | |
| 7 | Pu-erh Tea | Dark tea | 19.45 ± 1.11 | 338.44 ± 5.76 | 48.13 ± 1.11 | 406.02 ± 6.98 | |
| 8 | Qingzhuan Brick tea | Dark tea | 17.85 ± 1.19 | 351.43 ± 3.59 | 34.34 ± 0.28 | 403.62 ± 3.15 | |
| 9 | Tibetan Tea | Dark tea | 9.25 ± 0.40 | 277.41 ± 0.00 | 39.66 ± 0.45 | 326.32 ± 0.48 | |
| 10 | Dianqing Tea | Green tea | 137.97 ± 3.13 | 2754.98 ± 113.83 | 111.45 ± 2.50 | 3004.40 ± 112.89 | 1964.50 ± 38.29 b |
| 11 | Dongting Biluochun Tea | Green tea | 127.03 ± 3.43 | 1883.90 ± 11.31 | 64.02 ± 0.88 | 2074.94 ± 9.06 | |
| 12 | Duyun Maojian Tea | Green tea | 41.05 ± 1.48 | 1853.93 ± 27.46 | 102.89 ± 1.82 | 1997.86 ± 25.04 | |
| 13 | Enshi Yulu Tea | Green tea | 29.42 ± 0.49 | 1639.68 ± 27.34 | 109.31 ± 4.09 | 1778.42 ± 30.71 | |
| 14 | Lu’an Guapian Tea | Green tea | 42.57 ± 0.31 | 635.75 ± 11.53 | 75.13 ± 0.34 | 753.45 ± 11.73 | |
| 15 | Lushan Yunwu Tea | Green tea | 47.95 ± 0.54 | 1820.97 ± 44.12 | 79.77 ± 1.11 | 1948.69 ± 45.05 | |
| 16 | Taiping Houkui Tea | Green tea | 74.28 ± 0.43 | 1808.98 ± 26.34 | 77.21 ± 0.77 | 1960.47 ± 26.50 | |
| 17 | Xihu Longjing Tea | Green tea | 117.50 ± 4.53 | 1955.81 ± 40.78 | 52.61 ± 0.44 | 2125.92 ± 44.43 | |
| 18 | Yongxi Huoqing Tea | Green tea | 48.85 ± 1.35 | 1880.90 ± 38.23 | 106.61 ± 2.24 | 2036.36 ± 39.18 | |
| 19 | Fenghuang Shuixian Tea | Oolong tea | 38.72 ± 2.22 | 1541.83 ± 16.35 | 80.07 ± 0.70 | 1660.62 ± 18.36 | 1460.46 ± 22.23 b |
| 20 | Luohan Chenxiang Tea | Oolong tea | 73.86 ± 2.98 | 1376.32 ± 22.44 | 47.53 ± 4.07 | 1497.72 ± 23.35 | |
| 21 | Tieguanyin Tea | Oolong tea | 61.30 ± 1.59 | 1311.56 ± 35.34 | 40.75 ± 1.41 | 1413.61 ± 33.12 | |
| 22 | Wuyi Rock Tea | Oolong tea | 66.52 ± 2.19 | 1141.73 ± 17.45 | 61.64 ± 1.19 | 1269.89 ± 14.09 | |
| 23 | Gongmei White Tea | White tea | 21.85 ± 0.50 | 628.51 ± 21.09 | 57.27 ± 0.21 | 707.63 ± 20.78 | 629.61 ± 10.92 a |
| 24 | Shoumei White Tea | White tea | 20.03 ± 1.33 | 563.80 ± 7.43 | 57.18 ± 1.13 | 641.01 ± 7.33 | |
| 25 | White Peony Tea | White tea | 24.18 ± 0.23 | 452.93 ± 4.48 | 63.08 ± 0.65 | 540.19 ± 4.64 | |
| 26 | Huoshan Large Yellow Tea | Yellow tea | 46.21 ± 1.06 | 1278.60 ± 27.90 | 54.92 ± 2.72 | 1379.72 ± 29.46 | 2087.81 ± 42.89 b |
| 27 | Junshan Yinzhen Tea | Yellow tea | 80.05 ± 0.63 | 2278.99 ± 27.87 | 59.67 ± 1.68 | 2418.71 ± 26.70 | |
| 28 | Mengding Huangya Tea | Yellow tea | 66.10 ± 1.29 | 2192.70 ± 53.25 | 44.92 ± 1.04 | 2303.72 ± 53.67 | |
| 29 | Weishan Maojian Tea | Yellow tea | 50.07 ± 1.43 | 2139.15 ± 38.99 | 61.19 ± 2.41 | 2250.40 ± 37.95 | |
| 30 | Yuan’an Luyuan Tea | Yellow tea | 56.30 ± 0.50 | 1971.03 ± 64.83 | 59.16 ± 1.42 | 2086.49 ± 66.69 | |
| No. | Name | Category | TPC Value (mg GAE/g DW) | ||||
|---|---|---|---|---|---|---|---|
| Fat-Soluble Fraction | Water-Soluble Fraction | Bound-Insoluble Fraction | Total | Mean ± SD of Categories | |||
| 1 | Dianhong Congou Black Tea | Black tea | 6.43 ± 0.55 | 106.68 ± 1.26 | 8.86 ± 0.06 | 121.97 ± 1.31 | 107.54 ± 1.80 a |
| 2 | Keemun Black Tea | Black tea | 4.72 ± 0.08 | 96.26 ± 3.42 | 6.47 ± 0.03 | 107.44 ± 3.43 | |
| 3 | Lapsang Souchong Black Tea | Black tea | 2.31 ± 0.05 | 62.51 ± 1.65 | 6.29 ± 0.10 | 71.11 ± 1.63 | |
| 4 | Yichang Congou Black Tea | Black tea | 3.86 ± 0.23 | 117.54 ± 0.84 | 8.25 ± 0.01 | 129.64 ± 0.85 | |
| 5 | Fuzhuan Brick Tea | Dark tea | 4.21 ± 0.18 | 141.06 ± 3.39 | 6.89 ± 0.07 | 152.17 ± 3.57 | 78.16 ± 1.33 a |
| 6 | Liupao Tea | Dark tea | 4.31 ± 0.13 | 74.28 ± 1.38 | 5.74 ± 0.06 | 84.33 ± 1.37 | |
| 7 | Pu-erh Tea | Dark tea | 4.10 ± 0.10 | 59.52 ± 0.72 | 4.79 ± 0.05 | 68.40 ± 0.81 | |
| 8 | Qingzhuan Brick tea | Dark tea | 2.37 ± 0.06 | 42.95 ± 0.77 | 3.34 ± 0.05 | 48.66 ± 0.75 | |
| 9 | Tibetan Tea | Dark tea | 1.91 ± 0.07 | 32.26 ± 0.20 | 3.08 ± 0.12 | 37.25 ± 0.16 | |
| 10 | Dianqing Tea | Green tea | 7.23 ± 0.22 | 236.50 ± 15.52 | 10.56 ± 0.21 | 254.29 ± 15.51 | 195.79 ± 5.45 b |
| 11 | Dongting Biluochun Tea | Green tea | 6.66 ± 0.20 | 198.52 ± 2.45 | 6.02 ± 0.11 | 211.20 ± 2.52 | |
| 12 | Duyun Maojian Tea | Green tea | 4.12 ± 0.04 | 191.19 ± 2.53 | 9.71 ± 0.23 | 205.02 ±2.74 | |
| 13 | Enshi Yulu Tea | Green tea | 2.34 ± 0.16 | 162.53 ± 3.00 | 11.04 ± 0.87 | 175.91 ± 2.01 | |
| 14 | Lu’an Guapian Tea | Green tea | 4.03 ± 0.05 | 81.52 ± 2.34 | 8.41 ± 0.18 | 93.96 ± 2.47 | |
| 15 | Lushan Yunwu Tea | Green tea | 5.46 ± 0.11 | 186.77 ± 4.90 | 8.56 ± 0.19 | 200.80 ± 4.76 | |
| 16 | Taiping Houkui Tea | Green tea | 8.65 ± 0.06 | 179.88 ± 1.80 | 8.21 ± 0.18 | 196.74 ± 1.82 | |
| 17 | Xihu Longjing Tea | Green tea | 5.90 ± 0.29 | 204.88 ± 11.38 | 4.61 ± 0.20 | 215.39 ± 11.87 | |
| 18 | Yongxi Huoqing Tea | Green tea | 5.40 ± 0.02 | 193.67 ± 5.26 | 9.75 ± 0.11 | 208.83 ± 5.32 | |
| 19 | Fenghuang Shuixian Tea | Oolong tea | 3.84 ± 0.31 | 188.80 ± 2.08 | 8.73 ± 0.28 | 201.36 ± 1.74 | 172.11 ± 2.09 b |
| 20 | Luohan Chenxiang Tea | Oolong tea | 11.26 ± 0.54 | 150.49 ± 1.77 | 5.19 ± 0.10 | 166.94 ± 1.64 | |
| 21 | Tieguanyin Tea | Oolong tea | 6.44 ± 0.51 | 148.66 ± 1.82 | 3.81 ± 0.08 | 158.91 ± 2.17 | |
| 22 | Wuyi Rock Tea | Oolong tea | 10.67 ± 0.20 | 144.46 ± 2.89 | 6.10 ± 0.05 | 161.23 ± 2.83 | |
| 23 | Gongmei White Tea | White tea | 1.57 ± 0.04 | 90.11 ± 0.57 | 6.59 ± 0.37 | 98.28 ± 0.92 | 84.39 ± 0.79 a |
| 24 | Shoumei White Tea | White tea | 1.56 ± 0.08 | 80.90 ± 0.81 | 6.40 ± 0.07 | 88.87 ± 0.93 | |
| 25 | White Peony Tea | White tea | 1.73 ± 0.04 | 57.25 ± 0.45 | 7.06 ± 0.07 | 66.04 ± 0.51 | |
| 26 | Huoshan Large Yellow Tea | Yellow tea | 4.79 ± 0.17 | 156.15 ± 1.96 | 5.42 ± 0.10 | 166.35 ± 1.93 | 198.44 ± 5.39 b |
| 27 | Junshan Yinzhen Tea | Yellow tea | 9.35 ± 0.16 | 199.41 ± 3.27 | 5.97 ± 0.04 | 214.72 ± 3.22 | |
| 28 | Mengding Huangya Tea | Yellow tea | 6.82 ± 0.15 | 190.63 ± 3.98 | 4.22 ± 0.15 | 201.67 ± 3.82 | |
| 29 | Weishan Maojian Tea | Yellow tea | 4.83 ± 0.28 | 187.72 ± 10.14 | 6.87 ± 0.01 | 199.42 ± 10.13 | |
| 30 | Yuan’an Luyuan Tea | Yellow tea | 5.56 ± 0.10 | 198.52 ± 7.76 | 5.97 ± 0.08 | 210.05 ± 7.84 | |
| Average Linkage | FRAP | TEAC | TPC | |
|---|---|---|---|---|
| 1 | SUM | 12600.37 | 7206.81 | 1015.94 |
| N | 12 | 12 | 12 | |
| Mean | 1050.03 | 600.57 | 84.66 | |
| SD | 317.40 | 194.85 | 27.90 | |
| SUM/SUMT (%) | 18.0% | 17.3% | 22.5% | |
| N/NT (%) | 40.0% | 40.0% | 40.0% | |
| 2 | SUM | 13244.50 | 8501.30 | 1006.96 |
| N | 6 | 6 | 6 | |
| Mean | 2207.42 | 1416.88 | 167.83 | |
| SD | 342.61 | 146.80 | 17.30 | |
| SUM/SUMT (%) | 18.9% | 20.4% | 22.3% | |
| N/NT (%) | 20.0% | 20.0% | 20.0% | |
| 3 | SUM | 38812.92 | 2298200 | 2239.75 |
| N | 11 | 11 | 11 | |
| Mean | 3528.45 | 2089.27 | 203.61 | |
| SD | 265.76 | 180.60 | 11.11 | |
| SUM/SUMT (%) | 55.4% | 55.1% | 49.6% | |
| N/NT (%) | 36.7% | 36.7% | 36.7% | |
| 4 | SUM | 5375.18 | 3004.40 | 254.29 |
| N | 1 | 1 | 1 | |
| Mean | 5375.18 | 3004.40 | 254.29 | |
| SD | NA | NA | NA | |
| SUM/SUMT (%) | 7.7% | 7.2% | 5.6% | |
| N/NT (%) | 3.3% | 3.3% | 3.3% | |
| Total | SUM | 70032.96 | 41694.52 | 4516.94 |
| N | 30 | 30 | 30 | |
| Mean | 2334.43 | 1389.82 | 150.57 | |
| SD | 1276.08 | 750.16 | 60.72 | |
| No. | Name | Category | Catechin | Epicatechin | Gallocatechin | Epigallocatechin | Catechin Gallate | Epicatechin Gallate | Gallocatechin Gallate | Epigallocatechin Gallate |
|---|---|---|---|---|---|---|---|---|---|---|
| 1 | Dianhong Congou Black Tea | Black Tea | - | 0.796 ± 0.047 | 1.098 ± 0.052 | 8.479 ± 0.500 | - | 2.583 ± 0.077 | - | 0.539 ± 0.013 |
| 2 | Keemun Black Tea | Black Tea | - | 0.477 ± 0.030 | - | - | - | 1.499 ± 0.033 | - | 2.164 ± 0.102 |
| 3 | Lapsang Souchong Black Tea | Black Tea | - | - | - | - | - | - | - | 0.761 ± 0.031 |
| 4 | Yichang Congou Black Tea | Black Tea | - | 0.740 ± 0.033 | - | - | - | 3.511 ± 0.070 | 0.510 ± 0.013 | 3.795 ± 0.089 |
| 5 | Fuzhuan Brick Tea | Dark Tea | 4.930 ± 0.240 | 10.357 ± 0.268 | 5.535 ± 0.128 | 23.430 ± 0.375 | - | 10.881 ± 0.105 | 0.933 ± 0.063 | 10.885 ± 0.259 |
| 6 | Liupao Tea | Dark Tea | 1.667 ± 0.063 | 3.886 ± 0.112 | 2.120 ± 0.150 | 5.440 ± 0.171 | - | 0.455 ± 0.037 | - | 0.647 ± 0.015 |
| 7 | Pu-erh Tea | Dark Tea | - | 1.574 ± 0.086 | - | - | - | 0.515 ± 0.040 | - | 0.584 ± 0.044 |
| 8 | Qingzhuan Brick tea | Dark Tea | - | 0.977 ± 0.056 | 1.062 ± 0.049 | 5.200 ± 0.140 | - | 0.542 ± 0.015 | - | 1.479 ± 0.083 |
| 9 | Tibetan Tea | Dark Tea | - | - | - | 2.288 ± 0.050 | - | - | - | 0.886 ± 0.027 |
| 10 | Dianqing Tea | Green Tea | 1.315 ± 0.084 | 5.970 ± 0.210 | 1.864 ± 0.080 | 13.094 ± 0.256 | - | 35.395 ± 0.568 | - | 59.354 ± 1.131 |
| 11 | Dongting Biluochun Tea | Green Tea | 0.988 ± 0.039 | 6.310 ± 0.272 | 1.824 ± 0.051 | 24.522 ± 0.060 | - | 27.893 ± 0.426 | 0.630 ± 0.026 | 43.070 ± 0.209 |
| 12 | Duyun Maojian Tea | Green Tea | - | 8.700 ± 0.429 | 2.814 ± 0.167 | 42.063 ± 0.126 | - | 18.443 ± 0.537 | 1.137 ± 0.062 | 43.056 ± 0.455 |
| 13 | Enshi Yulu Tea | Green Tea | - | 6.443 ± 0.166 | 2.135 ± 0.140 | 29.070 ± 0.484 | - | 16.774 ± 0.090 | - | 33.102 ± 0.594 |
| 14 | Lu’an Guapian Tea | Green Tea | - | 7.352 ± 0.147 | 3.015 ± 0.121 | 100.684 ± 0.561 | - | 7.599 ± 0.119 | 0.842 ± 0.044 | 40.161 ± 0.887 |
| 15 | Lushan Yunwu Tea | Green Tea | - | 6.377 ± 0.150 | 3.277 ± 0.150 | 53.447 ± 0.326 | - | 15.130 ± 0.431 | - | 48.272 ± 0.363 |
| 16 | Taiping Houkui Tea | Green Tea | - | 8.580 ± 0.211 | 3.121 ± 0.092 | 74.212 ± 0.226 | - | 11.264 ± 0.097 | 0.640 ± 0.020 | 45.016 ± 0.222 |
| 17 | Xihu Longjing Tea | Green Tea | - | 5.380 ± 0.216 | 4.002 ± 0.112 | 24.494 ± 0.467 | 0.645 ± 0.036 | 22.364 ± 0.869 | 5.844 ± 0.173 | 51.734 ± 0.240 |
| 18 | Yongxi Huoqing Tea | Green Tea | - | 6.260 ± 0.303 | 2.630 ± 0.165 | 38.486 ± 0.994 | - | 18.064 ± 0.181 | 0.601 ± 0.019 | 50.947 ± 0.396 |
| 19 | Fenghuang Shuixian Tea | Oolong Tea | - | 1.579 ± 0.089 | 2.509 ± 0.121 | 31.253 ± 0.206 | - | 8.435 ± 0.270 | - | 36.704 ± 0.362 |
| 20 | Luohan Chenxiang Tea | Oolong Tea | - | 7.531 ± 0.017 | 8.088 ± 0.092 | 125.439 ± 0.678 | - | 3.683 ± 0.102 | - | 22.396 ± 0.505 |
| 21 | Tieguanyin Tea | Oolong Tea | 0.775 ± 0.052 | 13.723 ± 0.216 | 3.938 ± 0.146 | 139.854 ± 1.075 | - | 6.471 ± 0.235 | 0.562 ± 0.022 | 23.663 ± 0.308 |
| 22 | Wuyi Rock Tea | Oolong Tea | - | 4.337 ± 0.223 | 11.528 ± 0.079 | 36.826 ± 0.668 | 0.981 ± 0.121 | 5.083 ± 0.122 | 2.261 ± 0.111 | 20.211 ± 0.223 |
| 23 | Gongmei White Tea | White Tea | - | - | - | 8.419 ± 0.143 | - | 3.144 ± 0.123 | - | 6.010 ± 0.083 |
| 24 | Shoumei White Tea | White Tea | - | - | - | - | - | 2.270 ± 0.062 | - | 3.537 ± 0.072 |
| 25 | White Peony Tea | White Tea | - | 1.311 ± 0.033 | - | - | - | 3.841 ± 0.125 | - | 8.539 ± 0.169 |
| 26 | Huoshan Large Yellow Tea | Yellow Tea | 2.040 ± 0.054 | 2.956 ± 0.115 | 11.858 ± 0.039 | 14.340 ± 0.135 | 1.608 ± 0.026 | 5.549 ± 0.059 | 10.787 ± 0.108 | 17.209 ± 0.177 |
| 27 | Junshan Yinzhen Tea | Yellow Tea | 1.366 ± 0.043 | 6.196 ± 0.178 | 2.736 ± 0.102 | 13.661 ± 0.196 | 0.351 ± 0.014 | 30.491 ± 0.101 | 1.447 ± 0.066 | 50.777 ± 0.224 |
| 28 | Mengding Huangya Tea | Yellow Tea | - | 0.968 ± 0.056 | 4.844 ± 0.064 | 22.950 ± 0.102 | - | 23.805 ± 0.075 | 2.361 ± 0.128 | 39.125 ± 0.082 |
| 29 | Weishan Maojian Tea | Yellow Tea | - | 10.062 ± 0.040 | 2.818 ± 0.072 | 45.484 ± 0.057 | - | - | 24.710 ± 0.247 | 32.856 ± 0.060 |
| 30 | Yuan’an Luyuan Tea | Yellow Tea | - | 5.959 ± 0.147 | 3.918 ± 0.051 | 19.877 ± 0.176 | - | 21.373 ± 0.027 | 1.388 ± 0.043 | 57.230 ± 0.253 |
| No. | Name | Category | Gallic Acid | Chlorogenic Acid | Caffeine | Ellagic Acid | Kaempferol-3-O-Glucoside | Theaflavine |
|---|---|---|---|---|---|---|---|---|
| 1 | Dianhong Congou Black Tea | Black Tea | 2.693 ± 0.161 | 0.187 ± 0.005 | 35.283 ± 0.340 | 3.572 ± 0.087 | 1.588 ± 0.046 | 0.526 ± 0.019 |
| 2 | Keemun Black Tea | Black Tea | 2.706 ± 0.117 | 0.176 ± 0.005 | 31.452 ± 0.140 | 2.214 ± 0.070 | - | 0.542 ± 0.010 |
| 3 | Lapsang Souchong Black Tea | Black Tea | 1.748 ± 0.050 | - | 23.759 ± 0.150 | - | 0.385 ± 0.027 | 0.488 ± 0.012 |
| 4 | Yichang Congou Black Tea | Black Tea | 3.546 ± 0.050 | 0.188 ± 0.005 | 41.631 ± 0.312 | 2.614 ± 0.078 | 1.454 ± 0.099 | 0.559 ± 0.018 |
| 5 | Fuzhuan Brick Tea | Dark Tea | 3.097 ± 0.122 | 0.284 ± 0.016 | 27.075 ± 0.166 | 2.213 ± 0.067 | 1.002 ± 0.040 | 0.480 ± 0.008 |
| 6 | Liupao Tea | Dark Tea | 2.003 ± 0.018 | - | 30.565 ± 0.162 | 2.108 ± 0.022 | 0.519 ± 0.016 | - |
| 7 | Pu-erh Tea | Dark Tea | 1.644 ± 0.081 | - | 31.320 ± 0.310 | 2.165 ± 0.072 | 0.550 ± 0.043 | - |
| 8 | Qingzhuan Brick tea | Dark Tea | 1.507 ± 0.031 | - | 12.273 ± 0.040 | - | - | - |
| 9 | Tibetan Tea | Dark Tea | 2.203 ± 0.062 | - | 16.930 ± 0.101 | 1.553 ± 0.003 | - | - |
| 10 | Dianqing Tea | Green Tea | 1.430 ± 0.086 | 0.374 ± 0.016 | 39.764 ± 0.382 | 2.135 ± 0.037 | 1.605 ± 0.067 | - |
| 11 | Dongting Biluochun Tea | Green Tea | 0.708 ± 0.046 | 0.190 ± 0.006 | 31.993 ± 0.551 | - | 0.434 ± 0.030 | - |
| 12 | Duyun Maojian Tea | Green Tea | 1.129 ± 0.071 | - | 36.230 ± 0.563 | 1.875 ± 0.017 | 1.737 ± 0.090 | - |
| 13 | Enshi Yulu Tea | Green Tea | 1.392 ± 0.079 | - | 34.706 ± 0.383 | 1.756 ± 0.025 | - | - |
| 14 | Lu’an Guapian Tea | Green Tea | 0.533 ± 0.032 | 0.218 ± 0.009 | 29.232 ± 0.438 | - | - | - |
| 15 | Lushan Yunwu Tea | Green Tea | 0.847 ± 0.057 | 0.276 ± 0.013 | 37.778 ± 0.481 | - | - | - |
| 16 | Taiping Houkui Tea | Green Tea | 0.761 ± 0.043 | 0.241 ± 0.013 | 29.493 ± 0.346 | - | 0.347 ± 0.007 | - |
| 17 | Xihu Longjing Tea | Green Tea | 0.931 ± 0.043 | - | 38.508 ± 0.117 | 2.069 ± 0.097 | - | - |
| 18 | Yongxi Huoqing Tea | Green Tea | 1.060 ± 0.037 | 0.262 ± 0.011 | 30.783 ± 0.482 | 1.799 ± 0.026 | - | - |
| 19 | Fenghuang Shuixian Tea | Oolong Tea | 3.284 ± 0.141 | - | 34.770 ± 0.138 | 1.880 ± 0.062 | 1.185 ± 0.079 | - |
| 20 | Luohan Chenxiang Tea | Oolong Tea | 0.696 ± 0.061 | 0.232 ± 0.006 | 30.083 ± 0.287 | - | 0.572 ± 0.047 | - |
| 21 | Tieguanyin Tea | Oolong Tea | 0.294 ± 0.021 | 0.176 ± 0.015 | 14.842 ± 0.167 | - | - | - |
| 22 | Wuyi Rock Tea | Oolong Tea | 2.383 ± 0.142 | - | 25.881 ± 0.335 | - | - | 0.545 ± 0.011 |
| 23 | Gongmei White Tea | White Tea | 2.179 ± 0.038 | - | 27.466 ± 0.059 | - | 0.498 ± 0.015 | - |
| 24 | Shoumei White Tea | White Tea | 2.022 ± 0.026 | - | 25.303 ± 0.035 | - | 0.357 ± 0.021 | - |
| 25 | White Peony Tea | White Tea | 2.486 ± 0.026 | - | 28.758 ± 0.033 | - | - | |
| 26 | Huoshan Large Yellow Tea | Yellow Tea | 3.822 ± 0.111 | 0.241 ± 0.009 | 34.201 ± 0.036 | 3.326 ± 0.037 | 0.562 ± 0.031 | - |
| 27 | Junshan Yinzhen Tea | Yellow Tea | 0.940 ± 0.019 | - | 41.457 ± 0.322 | 1.882 ± 0.052 | 1.051 ± 0.045 | - |
| 28 | Mengding Huangya Tea | Yellow Tea | 1.495 ± 0.073 | 0.313 ± 0.007 | 36.022 ± 0.166 | 3.357 ± 0.065 | 0.499 ± 0.030 | - |
| 29 | Weishan Maojian Tea | Yellow Tea | 0.752 ± 0.038 | 0.249 ± 0.009 | 37.348 ± 0.220 | 1.849 ± 0.039 | 0.688 ± 0.035 | - |
| 30 | Yuan’an Luyuan Tea | Yellow Tea | 0.929 ± 0.031 | 0.273 ± 0.007 | 40.737 ± 0.116 | 2.190 ± 0.023 | 1.076 ± 0.036 | - |
| Index | Natural Product | MIN | QL | M | QU | MAX | Reference |
|---|---|---|---|---|---|---|---|
| FRAP (μmol Fe(II)/g) | 30 Chinese Teas (dry) | 611.2 | 1107.8 | 2156.9 | 3465.6 | 5375.2 | This study |
| 223 Medicinal Plants (dry) | 0.1 | 19.6 | 65.3 | 158.4 | 1844.9 | [26] | |
| 34 Fruit Seeds (fresh) | 0.3 | 5.5 | 11.3 | 16.1 | 181.4 | [36] | |
| 48 Fruit Peels (fresh) | 0.0 | 6.1 | 14.2 | 27.3 | 155.7 | [36] | |
| 56 Wild Fruits (fresh) | 1.3 | 12.9 | 40.3 | 135.8 | 502.0 | [37] | |
| 49 Macro-fungi (dry) | 7.9 | 15.1 | 22.1 | 34.5 | 204.7 | [38] | |
| 51 Flowers (fresh) | 0.2 | 16.2 | 27.6 | 70.0 | 660.2 | [39] | |
| 10 Grape Seeds (fresh) | 312.4 | 357.0 | 497.3 | 671.7 | 858.1 | [18] | |
| 30 Grape Peels (fresh) | 18.3 | 59.9 | 99.9 | 131.9 | 253.0 | [18] | |
| 30 Grape Pulps (fresh) | 1.3 | 2.9 | 4.9 | 6.7 | 11.8 | [40] | |
| 62 Fruits (fresh) | 0.1 | 3.9 | 6.7 | 10.2 | 72.1 | [24] | |
| 56 Vegetables (fresh) | 2.7 | 6.9 | 10.1 | 13.7 | 60.9 | [23] | |
| TEAC (μmol Trolox/g) | 30 Chinese Teas (dry) | 326.3 | 655.9 | 1396.7 | 2046.0 | 3004.4 | This study |
| 223 Medicinal Plants (dry) | 1.0 | 23.5 | 55.8 | 116.6 | 1544.4 | [26] | |
| 34 Fruit Seeds (fresh) | 2.5 | 7.6 | 12.5 | 19.1 | 92.6 | [36] | |
| 48 Fruit Peels (fresh) | 0.0 | 6.7 | 14.2 | 28.6 | 93.1 | [36] | |
| 56 Wild Fruits (fresh) | 3.4 | 17.6 | 32.7 | 114.8 | 1140.0 | [37] | |
| 49 Macro-fungi (dry) | 4.7 | 8.6 | 9.8 | 20.3 | 85.7 | [38] | |
| 51 Flowers (fresh) | 0.2 | 8.0 | 12.8 | 35.1 | 191.8 | [39] | |
| 10 Grape Seeds (fresh) | 207.8 | 227.6 | 274.5 | 345.8 | 473.5 | [18] | |
| 30 Grape Peels (fresh) | 5.2 | 27.8 | 50.4 | 64.2 | 123.7 | [18] | |
| 30 Grape Pulps (fresh) | 0.3 | 1.1 | 1.9 | 2.6 | 4.8 | [40] | |
| 62 Fruits (fresh) | 0.8 | 2.4 | 3.6 | 5.0 | 80.7 | [24] | |
| 56 Vegetables (fresh) | 6.9 | 10.3 | 12.8 | 15.3 | 33.6 | [23] | |
| TPC (mg GAE/g) | 30 Chinese Teas (dry) | 37.3 | 92.7 | 163.8 | 202.5 | 254.3 | This study |
| 223 Medicinal Plants (dry) | 0.2 | 3.8 | 8.1 | 14.4 | 98.9 | [26] | |
| 34 Fruit Seeds (fresh) | 0.3 | 2.8 | 3.7 | 4.8 | 23.0 | [36] | |
| 48 Fruit Peels (fresh) | 0.4 | 3.5 | 4.2 | 6.5 | 23.0 | [36] | |
| 56 Wild Fruits (fresh) | 0.5 | 1.9 | 6.1 | 15.8 | 54.8 | [37] | |
| 49 Macro-fungi (dry) | 2.4 | 4.0 | 4.9 | 6.5 | 44.8 | [38] | |
| 51 Flowers (fresh) | 0.6 | 3.4 | 4.9 | 8.0 | 36.7 | [39] | |
| 10 Grape Seeds (fresh) | 34.6 | 37.3 | 47.2 | 59.4 | 71.2 | [18] | |
| 30 Grape Peels (fresh) | 1.6 | 6.3 | 10.6 | 13.2 | 25.7 | [18] | |
| 30 Grape Pulps (fresh) | 0.3 | 0.6 | 0.8 | 1.0 | 1.4 | [40] | |
| 62 Fruits (fresh) | 0.1 | 0.3 | 0.6 | 0.8 | 5.9 | [24] | |
| 56 Vegetables (fresh) | 5.0 | 6.7 | 7.8 | 9.4 | 23.3 | [23] |
© 2019 by the authors. Licensee MDPI, Basel, Switzerland. This article is an open access article distributed under the terms and conditions of the Creative Commons Attribution (CC BY) license (http://creativecommons.org/licenses/by/4.0/).
Share and Cite
Tang, G.-Y.; Zhao, C.-N.; Xu, X.-Y.; Gan, R.-Y.; Cao, S.-Y.; Liu, Q.; Shang, A.; Mao, Q.-Q.; Li, H.-B. Phytochemical Composition and Antioxidant Capacity of 30 Chinese Teas. Antioxidants 2019, 8, 180. https://doi.org/10.3390/antiox8060180
Tang G-Y, Zhao C-N, Xu X-Y, Gan R-Y, Cao S-Y, Liu Q, Shang A, Mao Q-Q, Li H-B. Phytochemical Composition and Antioxidant Capacity of 30 Chinese Teas. Antioxidants. 2019; 8(6):180. https://doi.org/10.3390/antiox8060180
Chicago/Turabian StyleTang, Guo-Yi, Cai-Ning Zhao, Xiao-Yu Xu, Ren-You Gan, Shi-Yu Cao, Qing Liu, Ao Shang, Qian-Qian Mao, and Hua-Bin Li. 2019. "Phytochemical Composition and Antioxidant Capacity of 30 Chinese Teas" Antioxidants 8, no. 6: 180. https://doi.org/10.3390/antiox8060180
APA StyleTang, G.-Y., Zhao, C.-N., Xu, X.-Y., Gan, R.-Y., Cao, S.-Y., Liu, Q., Shang, A., Mao, Q.-Q., & Li, H.-B. (2019). Phytochemical Composition and Antioxidant Capacity of 30 Chinese Teas. Antioxidants, 8(6), 180. https://doi.org/10.3390/antiox8060180