Inhibitory Effect of β-Carotene on Helicobacter pylori-Induced TRAF Expression and Hyper-Proliferation in Gastric Epithelial Cells


Abstract
1. Introduction
2. Materials and Methods
2.1. Cell Line and Culture Conditions
2.2. Cell Culture with H. pylori Infection
2.3. Plasmid Construction and Transfection
2.4. Experimental Protocol
2.5. Determination of Cell Viability
2.6. Annexin V/Propidium Iodide (PI)-Staining Assay
2.7. Determination of TRAF1 and TRAF2 mRNA Using Real-Time PCR Analysis
2.8. Preparation of Whole-Cell Extracts, Membrane Extracts, and Nuclear Extracts
2.9. Western Blot Analysis for TRAF1, TRAF2, and IκBα
2.10. Determination of ROS Levels
2.11. Determination of NADPH Oxidase Activity
2.12. Electrophoretic Mobility Shift Assay (EMSA) for NF-κB
2.13. Immunoprecipitation of the TRAF1-TRAF2 Complex
2.14. Statistical Analysis
3. Results
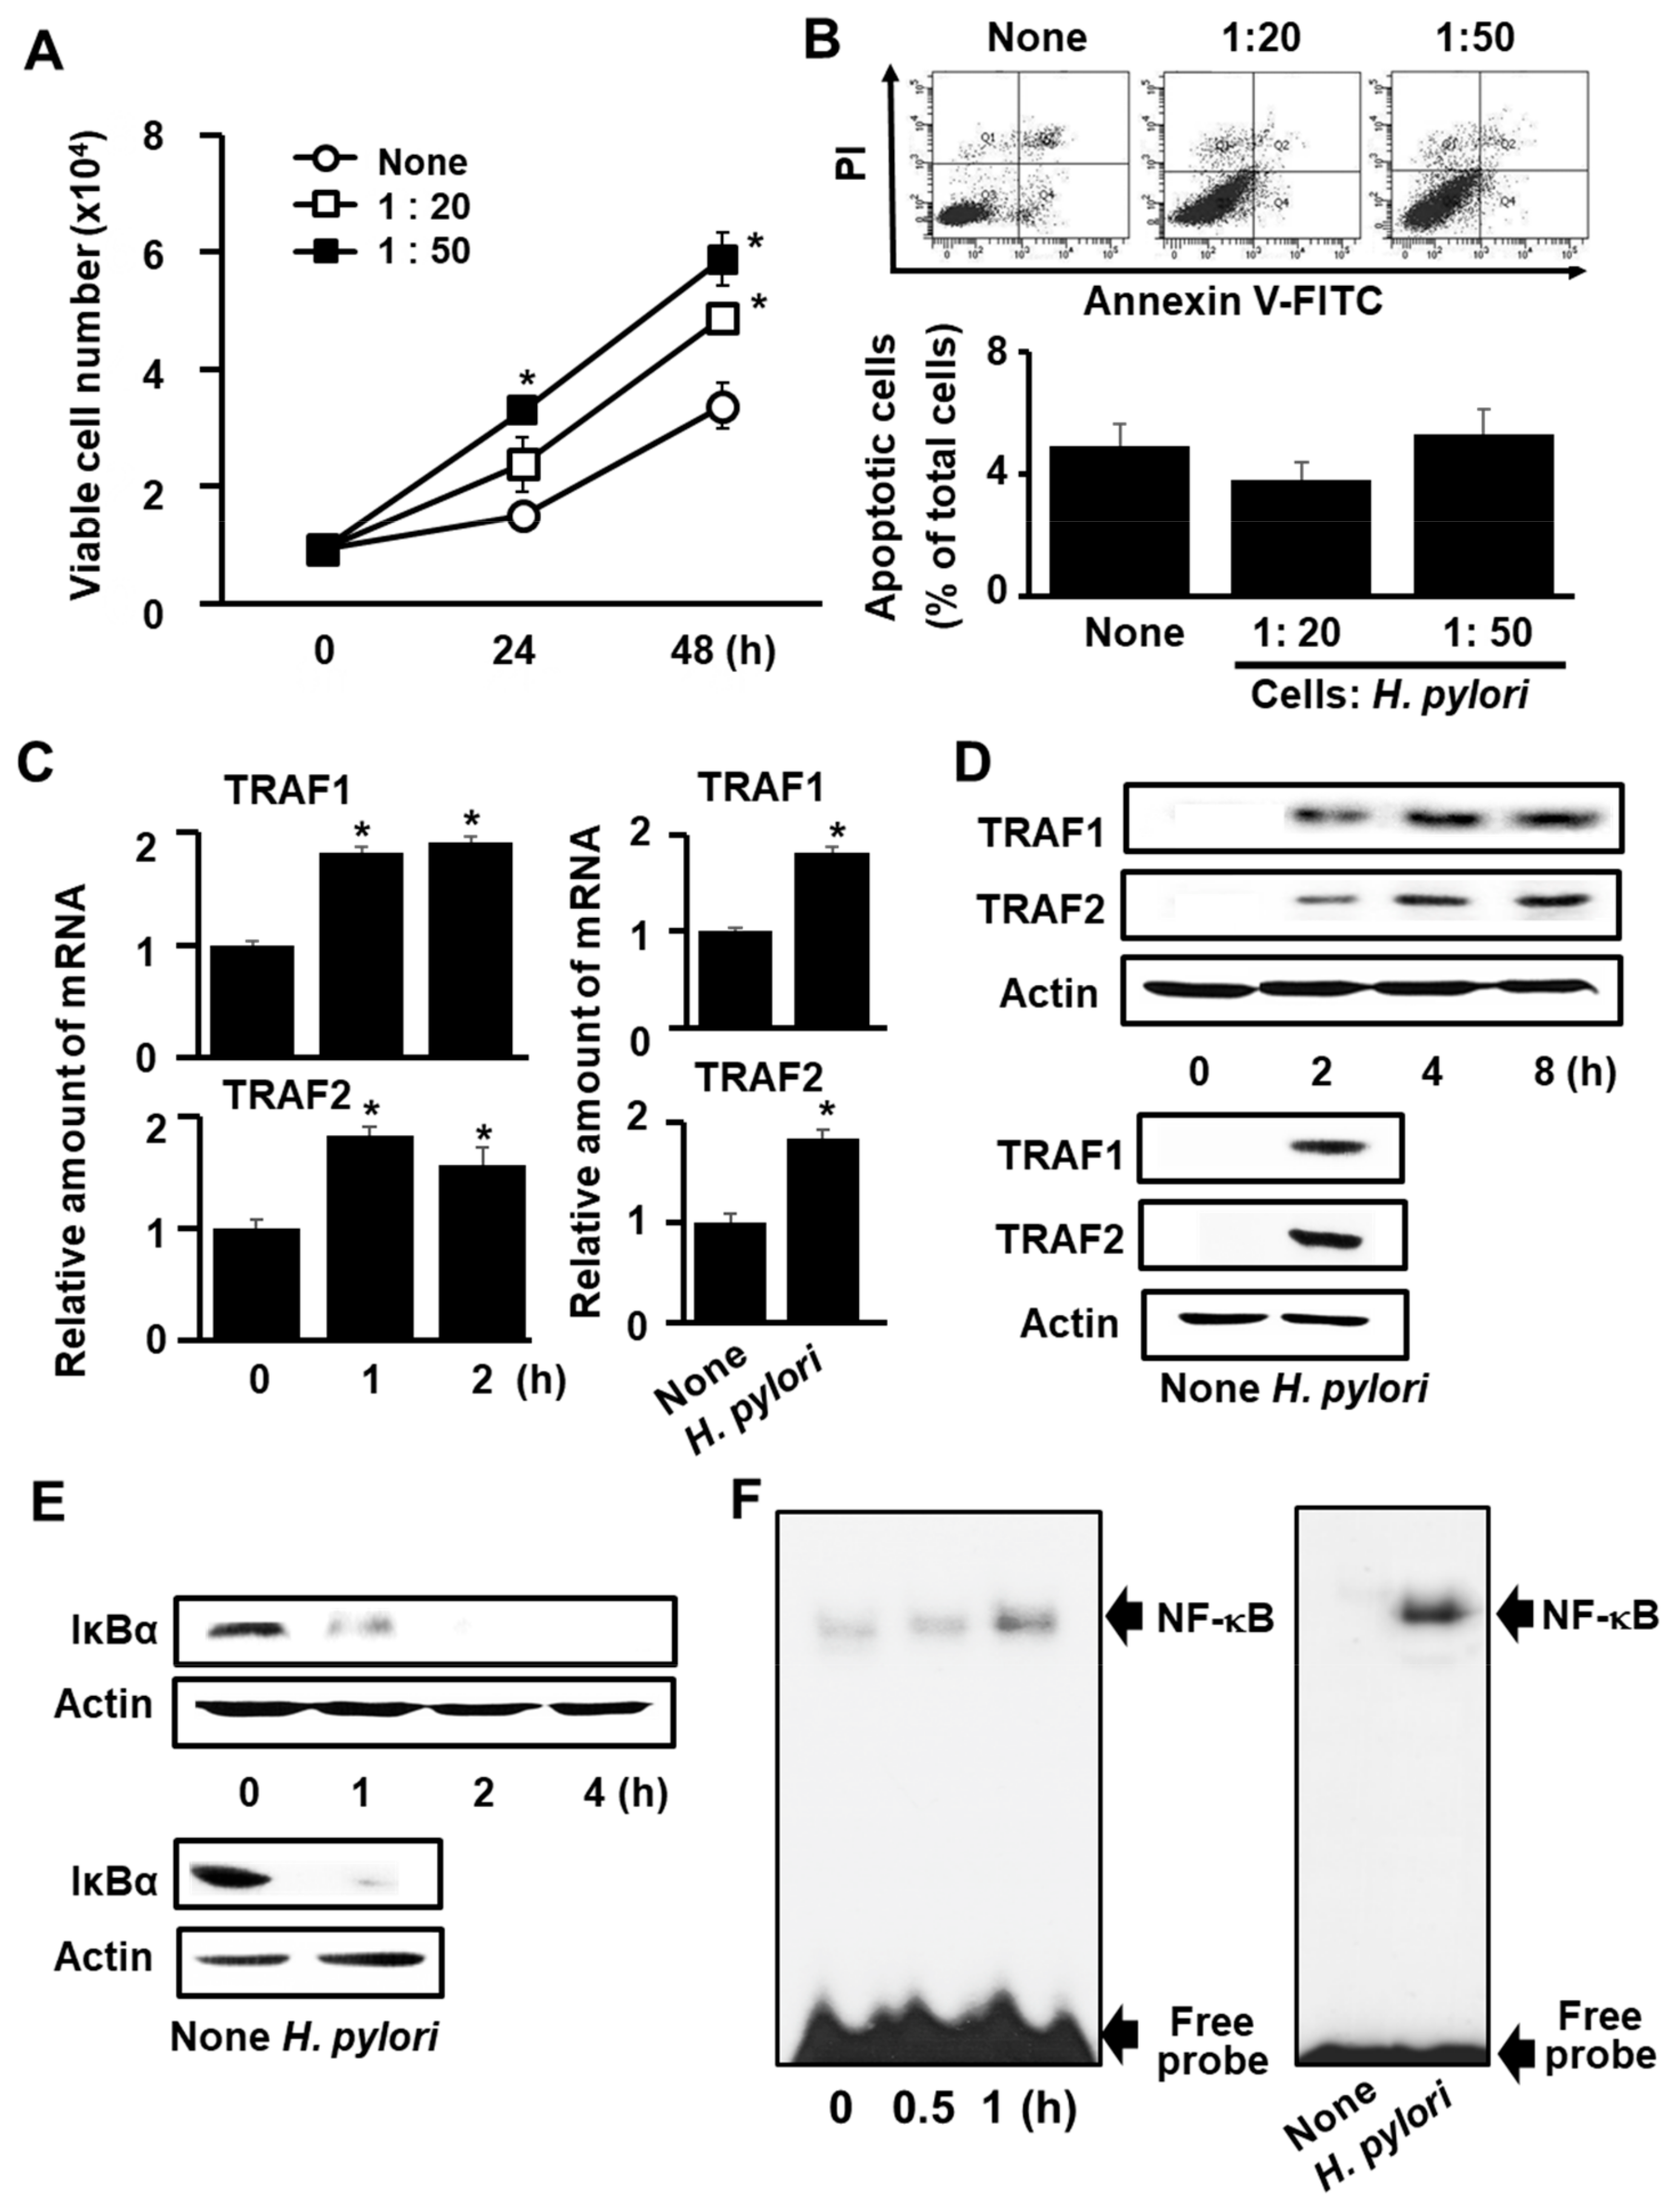
3.1. H. pylori Induces Expression of TRAF1 and TRAF2, IκBα Degradation, NF-κB Activation, and Cell Proliferation, but Does Not Induce Apoptosis in AGS Cells
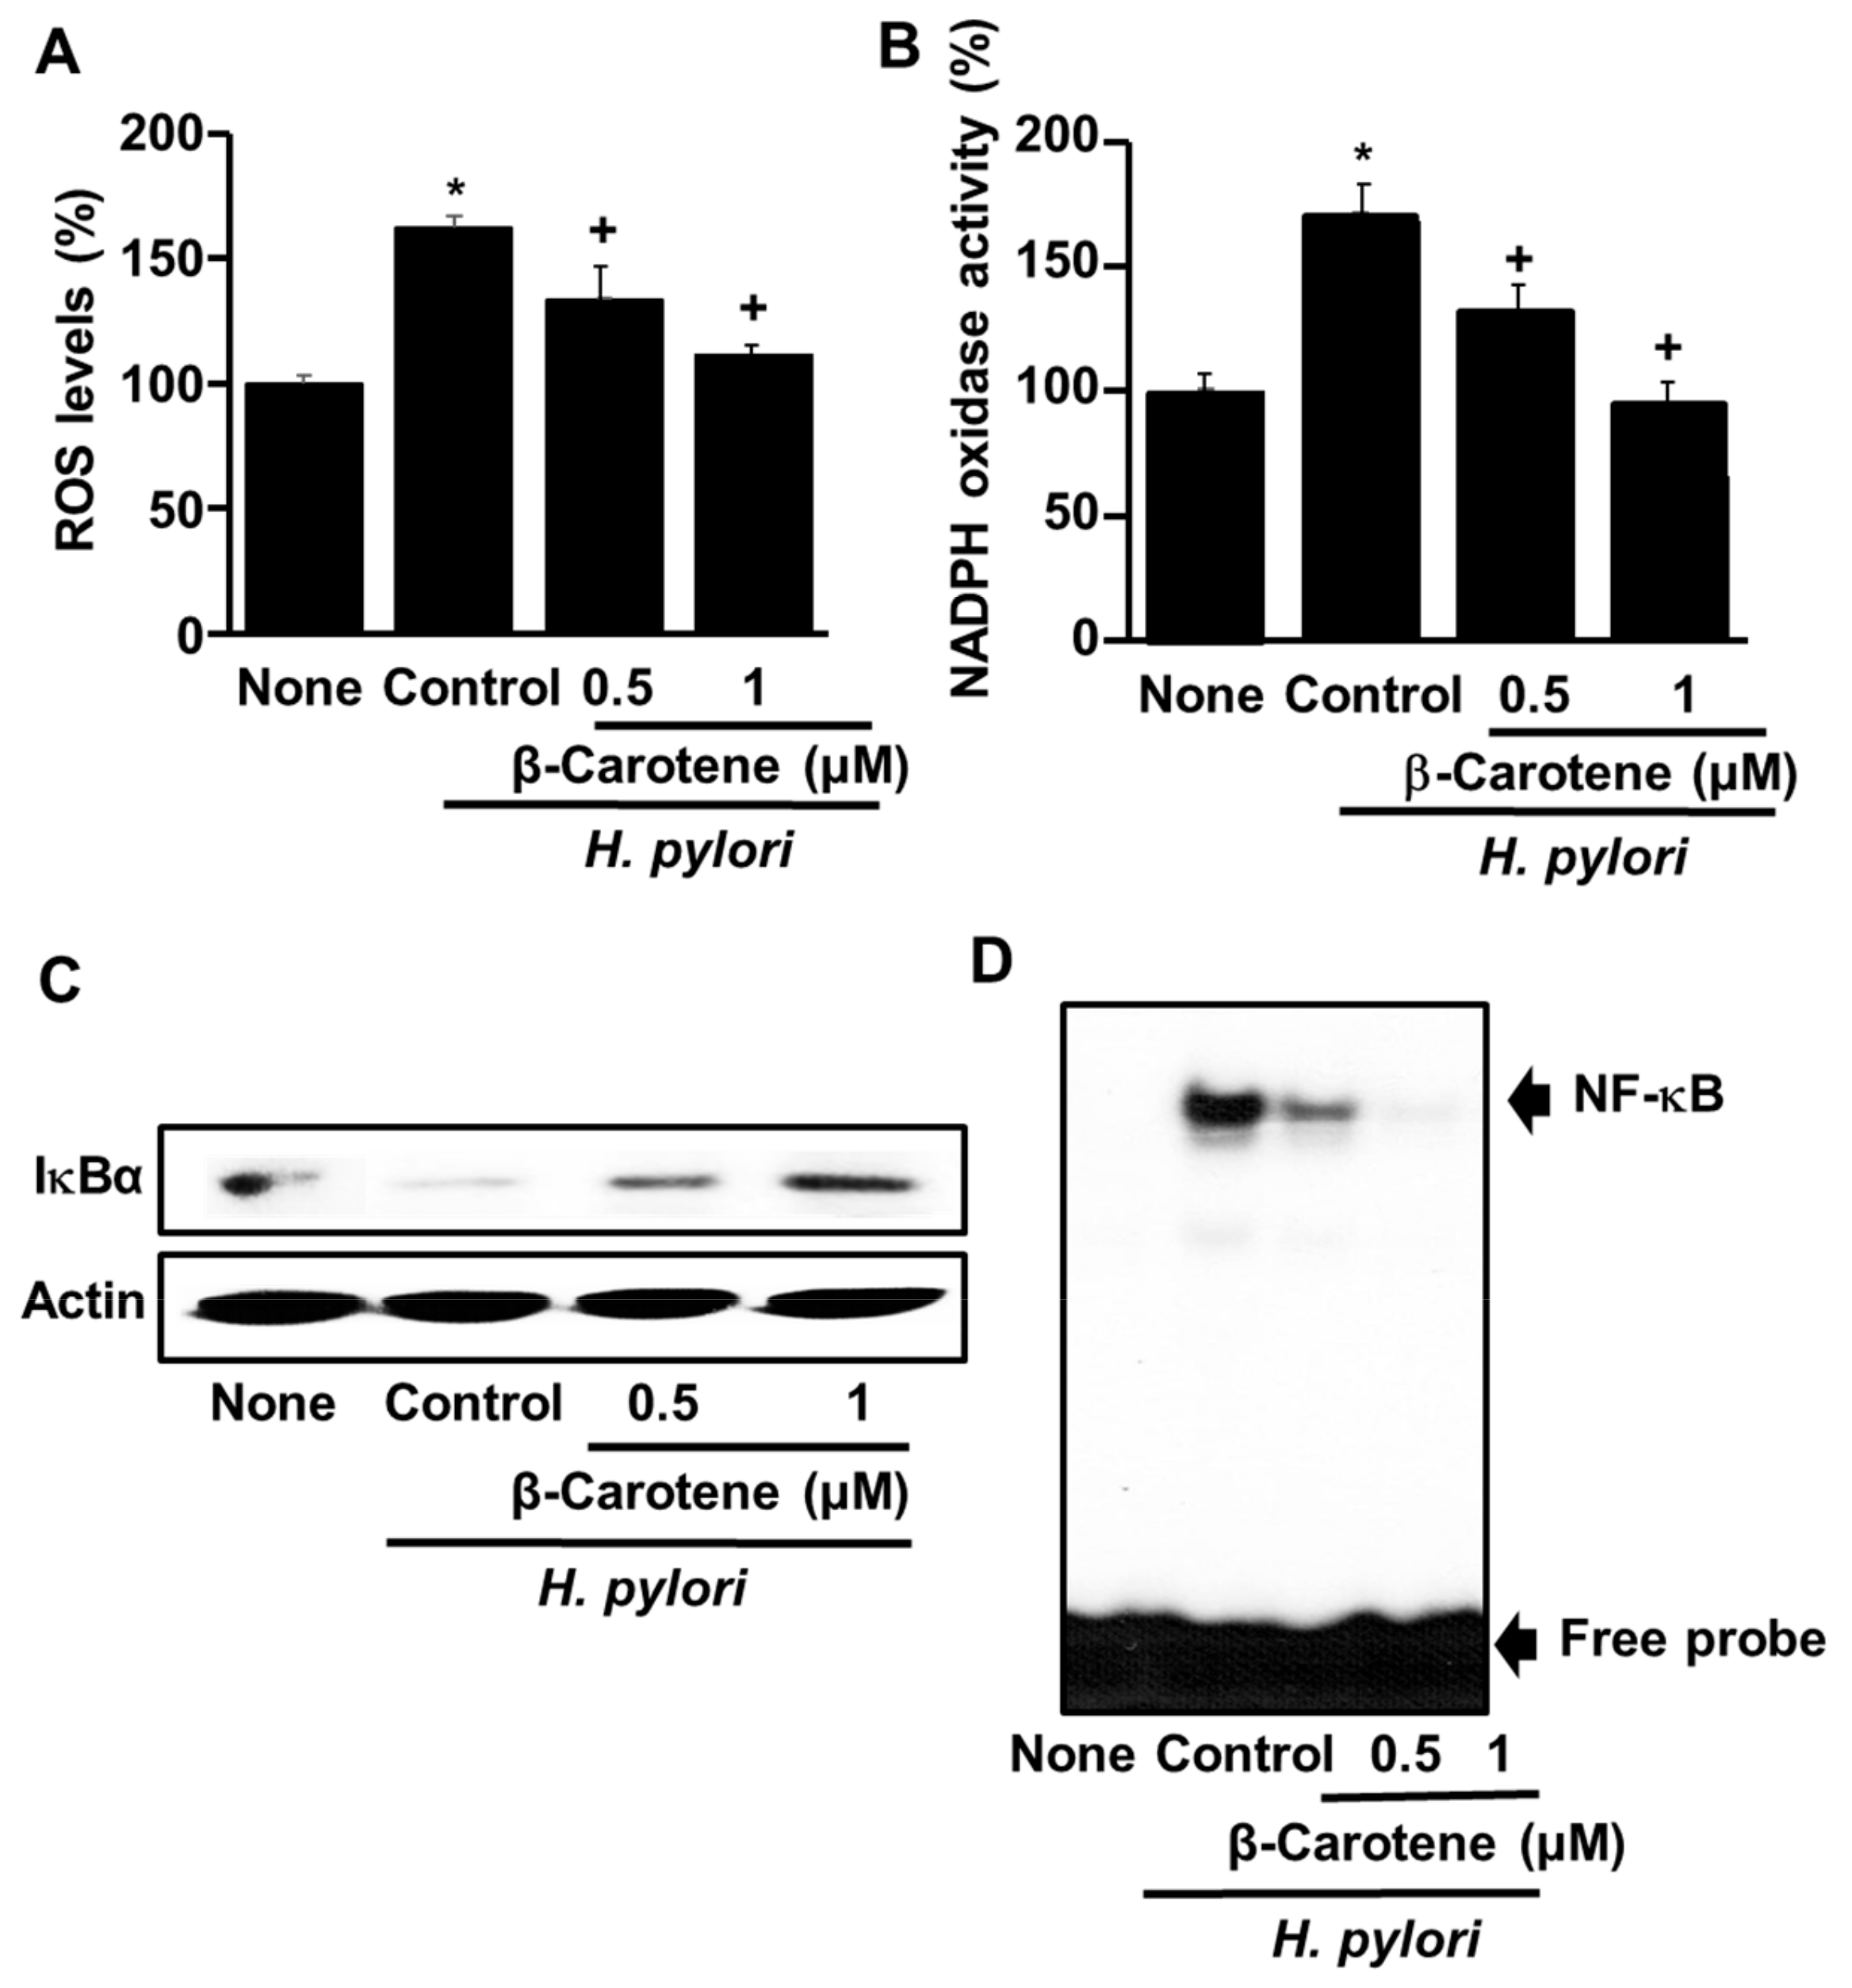
3.2. β-Carotene Inhibits H. pylori-Induced Expression of TRAF1 and TRAF2 and Hyper-Proliferation in AGS Cells
3.3. β-Carotene Inhibits H. pylori-Induced ROS Production, NADPH Oxidase Activation, IκBα Degradation, and NF-κB Activation in AGS Cells
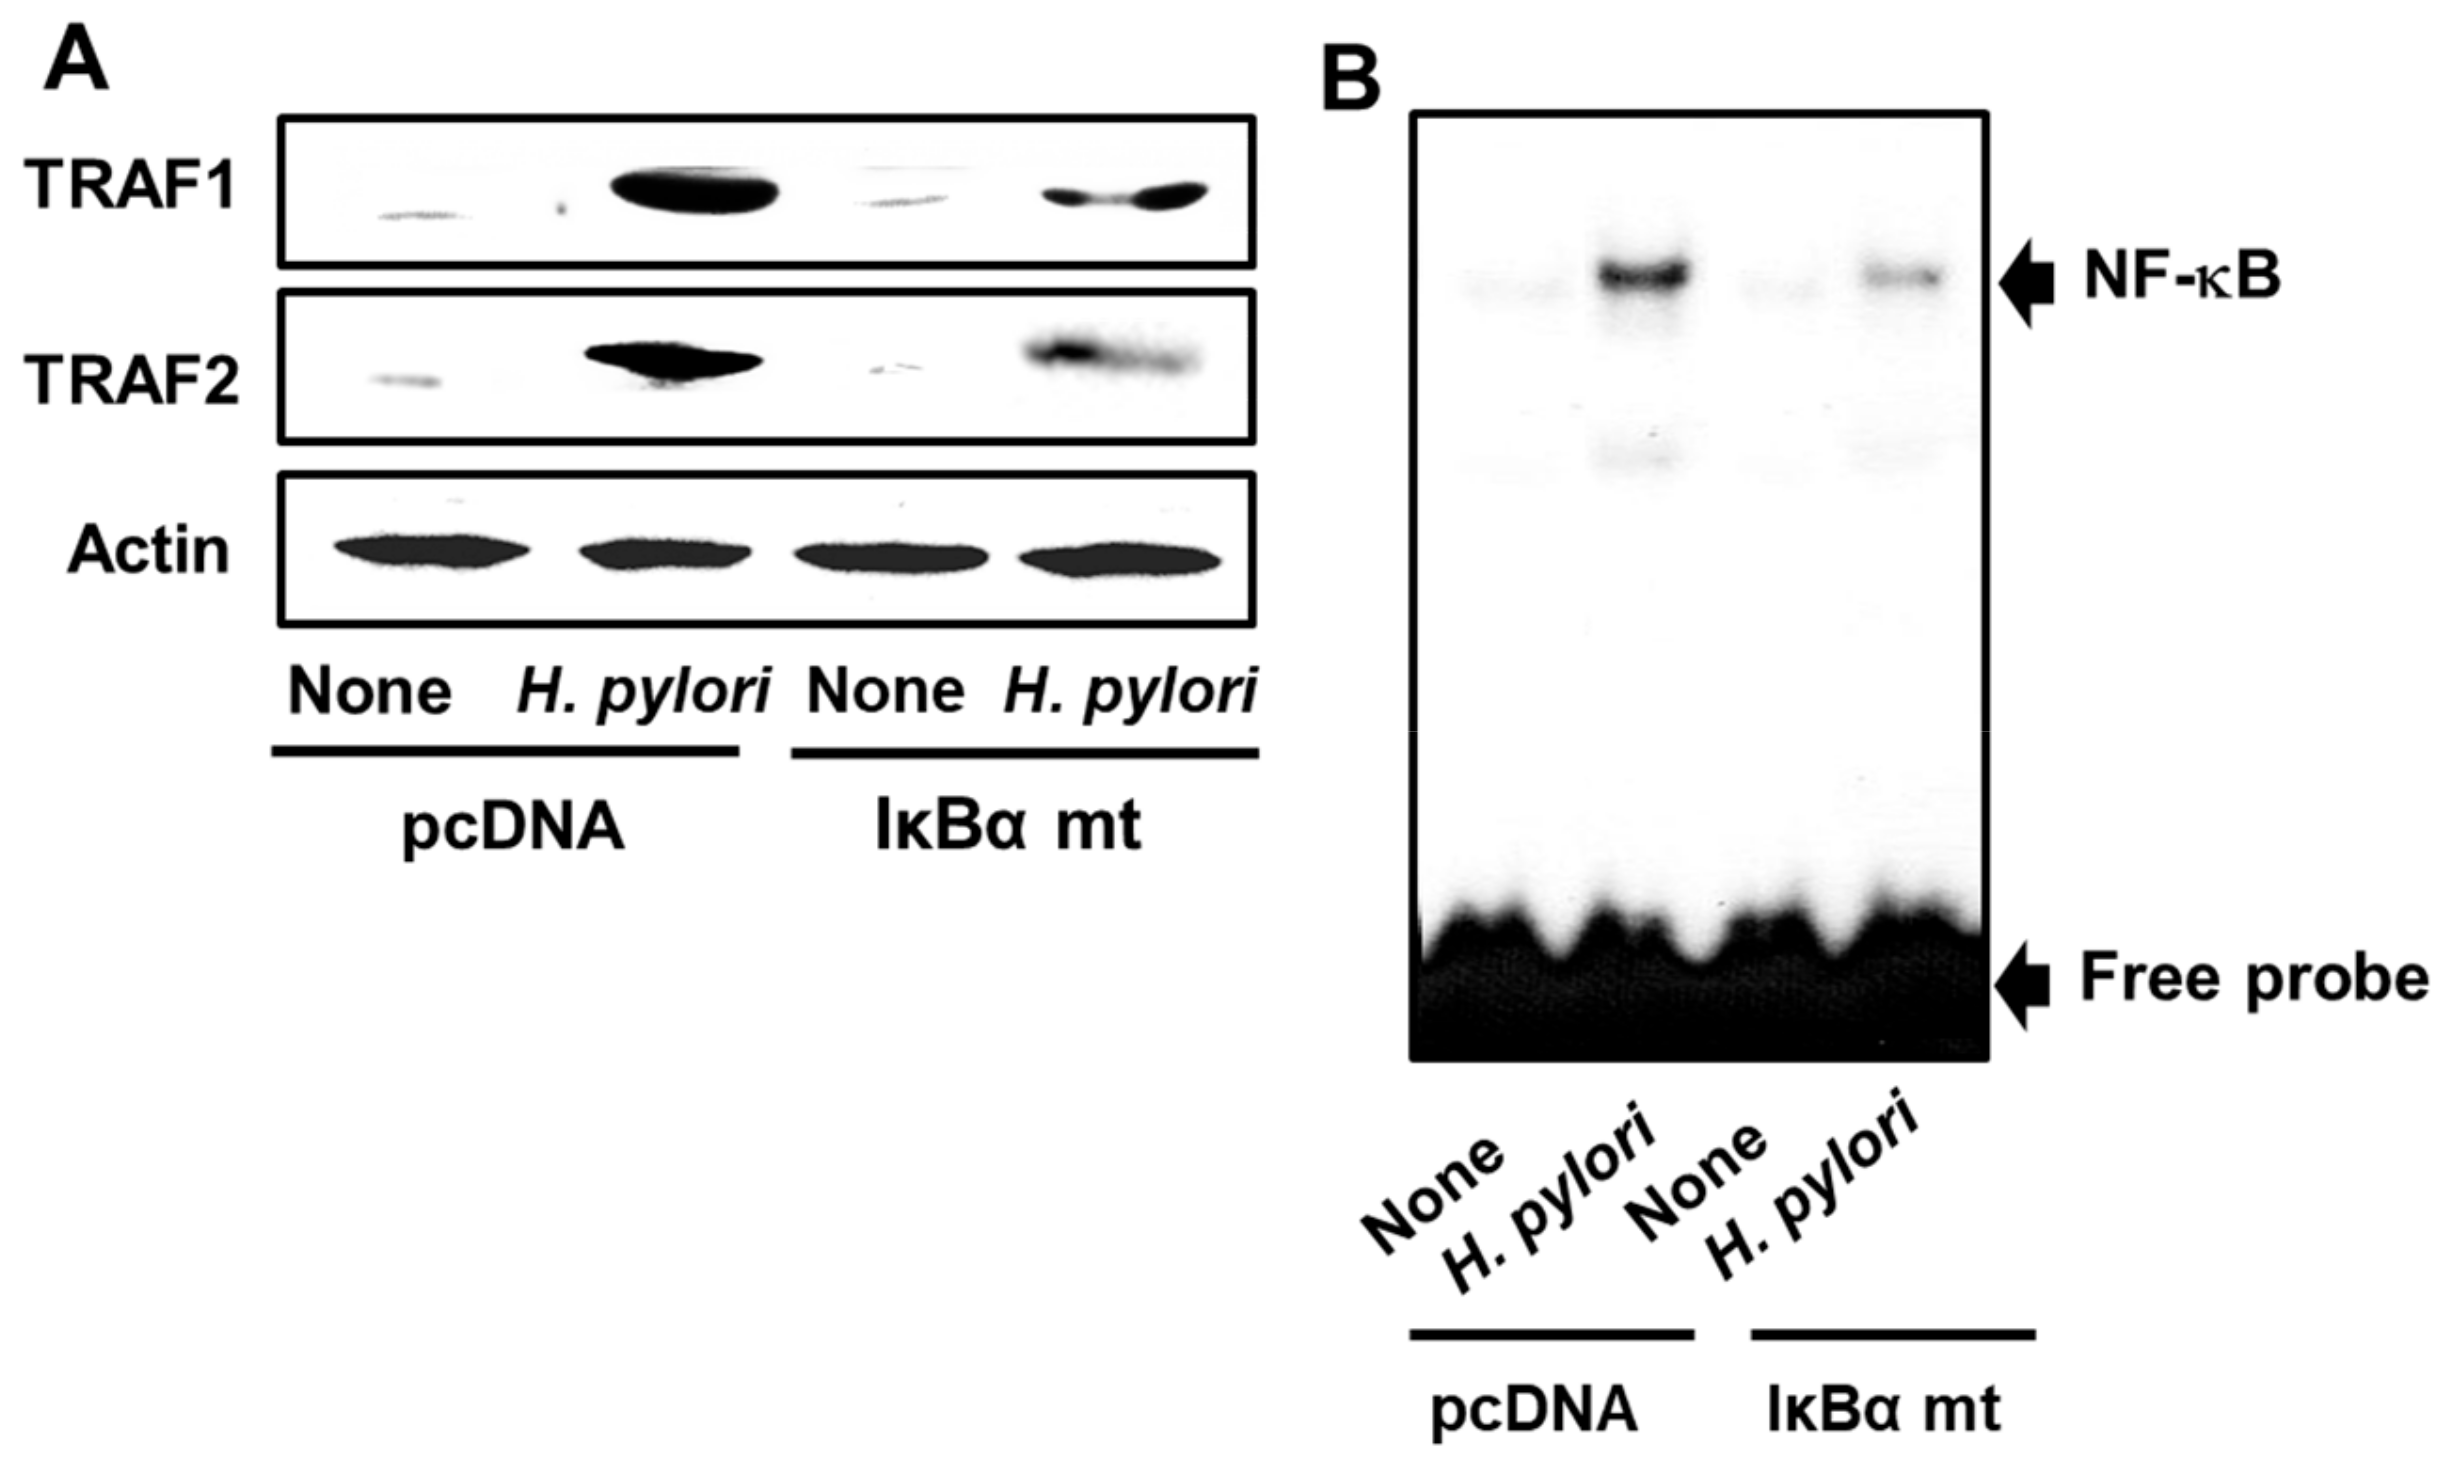
3.4. Transfection of AGS Cells with a Mutated IκBα Gene Inhibits H. pylori-Induced Expression of TRAF1 and TRAF2 and NF-κB Activation
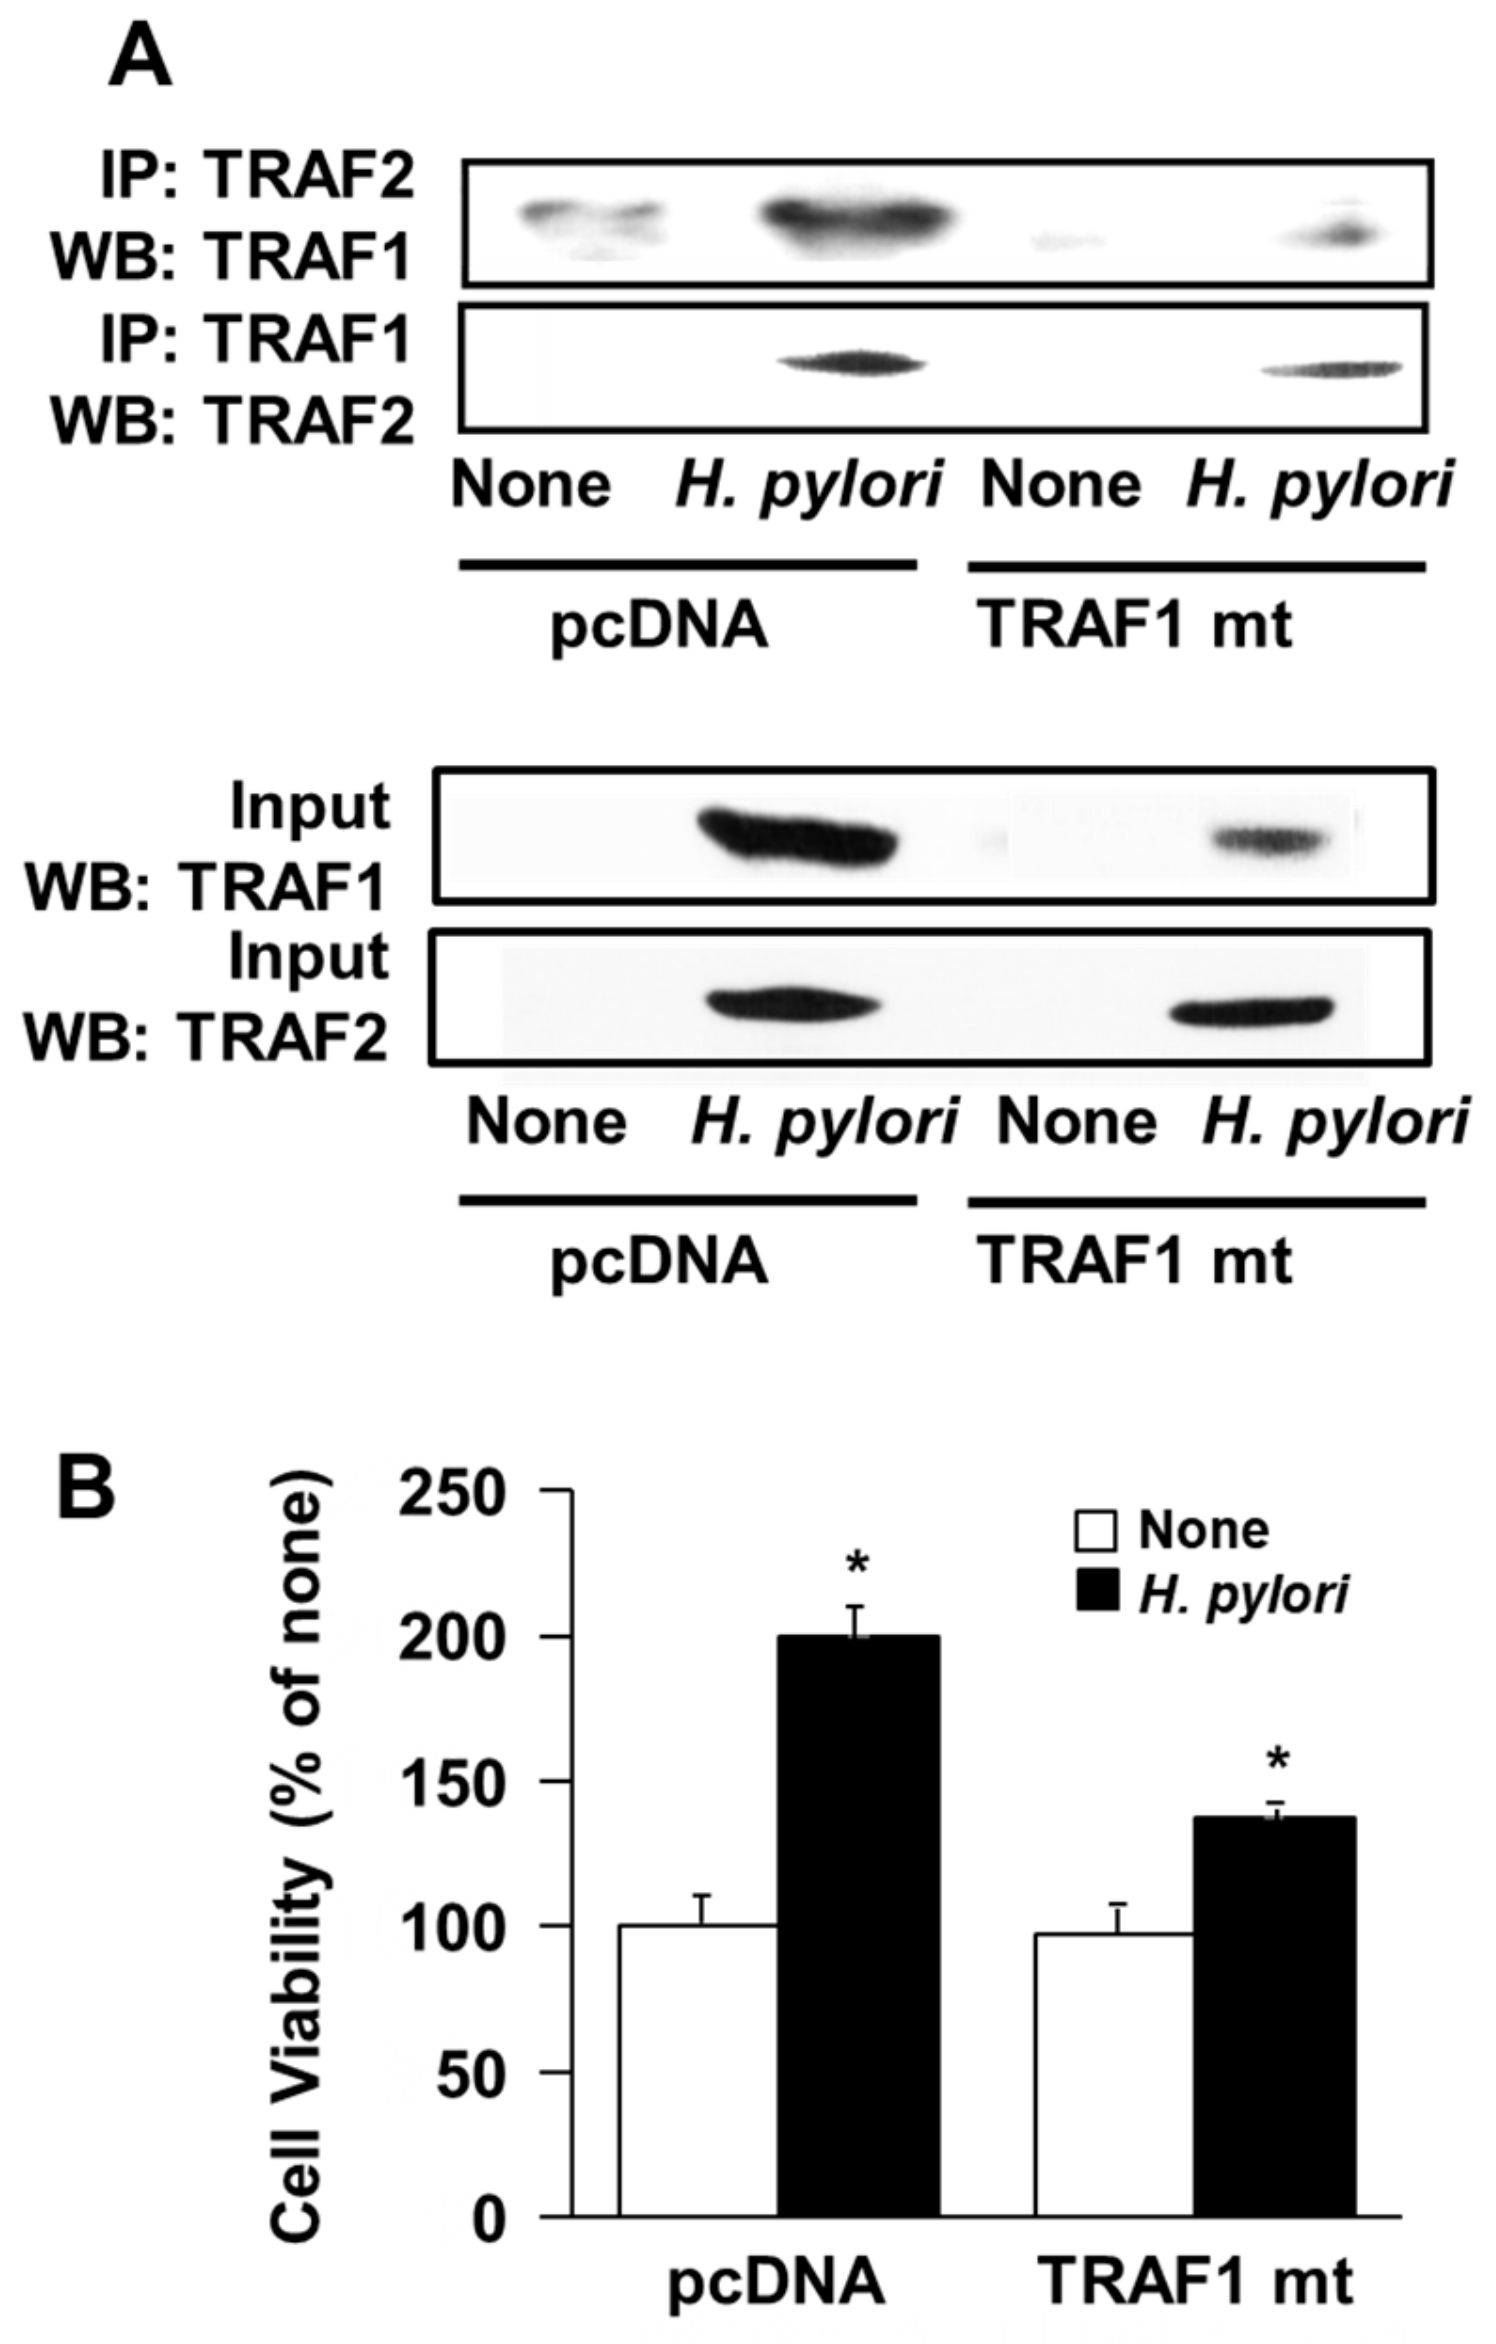
3.5. Transfection of Dominant Negative Mutant TRAF1 Gene Decreased Interaction of TRAF1 and TRAF2 and Cell Proliferation in H. Pylori-Infected AGS Cells
4. Discussion
5. Conclusions
Author Contributions
Funding
Conflicts of Interest
References
- Tonkic, A.; Tonkic, M.; Lehours, P.; Mégraud, F. Epidemiology and diagnosis of Helicobacter pylori infection. Helicobacter 2012, 17, 1–8. [Google Scholar] [CrossRef] [PubMed]
- Keilberg, D.; Ottemann, K.M. How Helicobacter pylori senses, targets and interacts with the gastric epithelium. Environ. Microbiol. 2016, 18, 791–806. [Google Scholar] [CrossRef] [PubMed]
- Subhash, V.V.; Ho, B. Inflammation and proliferation—A causal event of host response to Helicobacter pylori infection. Microbiology 2015, 161, 1150–1160. [Google Scholar] [CrossRef] [PubMed]
- Byun, E.; Lim, J.W.; Kim, J.M.; Kim, H. α-Lipoic acid inhibits Helicobacter pylori-induced oncogene expression and hyperproliferation by suppressing the activation of NADPH oxidase in gastric epithelial cells. Med. Inflamm. 2014, 2014, 380830. [Google Scholar] [CrossRef]
- Jang, S.H.; Lim, J.W.; Kim, H. Beta-carotene inhibits Helicobacter pylori-induced expression of inducible nitric oxide synthase and cyclooxygenase-2 in human gastric epithelial AGS cells. J. Physiol. Pharmacol. 2009, 7, 131–137. [Google Scholar]
- Kim, D.; Lim, J.W.; Kim, H. β-carotene inhibits expression of c-myc and cyclin E in Helicobacter pylori-infected gastric epithelial cells. J. Cancer Prev. 2019, 24, 192–196. [Google Scholar] [CrossRef]
- Kim, S.H.; Lim, J.W.; Kim, H. Astaxanthin prevents decreases in superoxide dismutase 2 level and superoxide dismutase activity in Helicobacter pylori-infected gastric epithelial cells. J. Cancer Prev. 2019, 24, 54–58. [Google Scholar] [CrossRef]
- Kim, S.H.; Lim, J.W.; Kim, H. Astaxanthin inhibits mitochondrial dysfunction an interleukin-8 expression in Helicobacter pylori-infected gastric epithelial cells. Nutrients 2018, 10, 1320. [Google Scholar] [CrossRef]
- Park, B.; Lim, J.W.; Kim, H. Lycopene treatment inhibits activation of Jak1/Stat3 and Wnt/β-catenin signaling and attenuates hyperproliferation in gastric epithelial cells. Nutr. Res. 2019, 70, 70–81. [Google Scholar] [CrossRef]
- Kang, H.; Kim, H. Astaxanthin and β-carotene in Helicobacter pylori-induced gastric inflammation: A mini-review on action mechanisms. J. Cancer Prev. 2017, 22, 57–61. [Google Scholar] [CrossRef]
- Kyung, S.Y.; Lim, J.W.; Kim, H. α-Lipoic acid inhibits IL-8 expression by activating Nrf2 signaling in Helicobacter pylori-infected gastric epithelial cells. Nutrients 2019, 11, 2524. [Google Scholar] [CrossRef] [PubMed]
- Rossi, A.F.L.; Contiero, J.C.; Manoel-Caetano, F.S.; Severino, F.E.; Silva, A.E. Up-regulation of tumor necrosis factor-α pathway survival genes and of the receptor TNFR2 in gastric cancer. World J. Gastrointest. Oncol. 2019, 11, 281–294. [Google Scholar] [CrossRef] [PubMed]
- Wan, X.K.; Yuan, S.L.; Tao, H.X.; Diao, L.P.; Wang, Y.C.; Cao, C.; Liu, C.J. The upregulation of TRAF1 induced by Helicobacter pylori plays an antiapoptotic effect on the infected cells. Helicobacter 2016, 21, 554–564. [Google Scholar] [CrossRef] [PubMed]
- Zhang, J.; Dai, W.J.; Yang, X.Z. Methylation status of TRAF2 is associated with the diagnosis and prognosis of gastric cancer. Int. J. Clin. Exp. Pathol. 2015, 8, 14228–14234. [Google Scholar] [PubMed]
- Zapata, J.M.; Reed, J.C. TRAF1: Lord without a RING. Sci. Signal. 2002, 133, pe27. [Google Scholar] [CrossRef] [PubMed]
- Lalani, A.I.; Zhu, S.; Gokhale, S.; Jin, J.; Xie, P. TRAF molecules in inflammation and inflammatory diseases. Curr. Pharmacol. Rep. 2018, 4, 64–90. [Google Scholar] [CrossRef] [PubMed]
- Bowie, A.; O’Neill, L.A. Oxidative stress and nuclear factor-kappaB activation: A reassessment of the evidence in the light of recent discoveries. Biochem. Pharmacol. 2000, 59, 13–23. [Google Scholar] [CrossRef]
- Shimoyama, T.; Fukuda, S.; Liu, Q.; Nakaji, S.; Fukuda, Y.; Sugawara, K. Production of chemokines and reactive oxygen species by human neutrophils stimulated by Helicobacter pylori. Helicobacter 2002, 7, 170–174. [Google Scholar] [CrossRef]
- Keenan, J.I.; Peterson, R.A., 2nd; Hampton, M.B. NADPH oxidase involvement in the pathology of Helicobacter pylori infection. Free Rad. Biol. Med. 2005, 38, 1188–1196. [Google Scholar] [CrossRef]
- Tominaga, K.; Kawahara, T.; Sano, T.; Toida, K.; Kuwano, Y.; Sasaki, H.; Kawai, T.; Teshima-Kondo, S.; Rokutan, K. Evidence for cancer-associated expression of NADPH oxidase 1 (Nox1)-based oxidase system in the human stomach. Free Rad. Biol. Med. 2007, 43, 1627–1638. [Google Scholar] [CrossRef]
- Kim, H.; Seo, J.Y.; Kim, K.H. Inhibition of lipid peroxidation, NF-kappaB activation and IL-8 production by rebamipide in Helicobacter pylori-stimulated gastric epithelial cells. Dig. Dis. Sci. 2000, 45, 621–628. [Google Scholar] [CrossRef] [PubMed]
- Palozza, P.; Serini, S.; Maggiano, N.; Tringali, G.; Navarra, P.; Ranelletti, F.O.; Calviello, G. beta-Carotene downregulates the steady-state and heregulin-alpha-induced COX-2 pathways in colon cancer cells. J. Nutr. 2005, 135, 129–136. [Google Scholar] [CrossRef] [PubMed]
- Cui, Y.; Lu, Z.; Bai, L.; Shi, Z.; Zhao, W.E.; Zhao, B. β-Carotene induces apoptosis and up-regulates peroxisome proliferator-activated receptor gamma expression and reactive oxygen species production in MCF-7 cancer cells. Eur. J. Cancer. 2007, 43, 2590–2601. [Google Scholar] [CrossRef] [PubMed]
- Sicinschi, L.A.; Correa, P.; Peek, R.M.; Camargo, M.C.; Piazuelo, M.B.; Romero-Gallo, J.; Hobbs, S.S.; Krishna, U.; Delgado, A.; Mera, R.; et al. CagA C-terminal variations in Helicobacter pylori strains from Colombian patients with gastric precancerous lesions. Clin. Microbiol. Infect. 2010, 16, 369–378. [Google Scholar] [CrossRef]
- Maeda, S.; Yoshida, H.; Ogura, K.; Mitsuno, Y.; Hirata, Y.; Yamaji, Y.; Akanuma, M.; Shiratori, Y.; Omata, M. H. pylori activates NF-kappaB through a signaling pathway involving IkappaB kinases, NF-kappaB-inducing kinase, TRAF2, and TRAF6 in gastric cancer cells. Gastroenterology 2000, 119, 97–108. [Google Scholar] [CrossRef]
- Seo, J.H.; Lim, J.W.; Kim, H.; Kim, K.H. Helicobacter pylori in a Korean isolate activates mitogen-activated protein kinases, AP-1, and NF-kappaB and induces chemokine expression in gastric epithelial AGS cells. Lab. Investig. 2004, 84, 49–62. [Google Scholar] [CrossRef]
- Brenes, F.; Ruiz, B.; Correa, P.; Hunter, F.; Rhamakrishnan, T.; Fontham, E.; Shi, T.Y. Helicobacter pylori causes hyperproliferation of the gastric epithelium: Pre-and post-eradication indices of proliferating cell nuclear antigen. Am. J. Gastroenterol. 1993, 88, 1870–1875. [Google Scholar]
- Jones, N.L.; Shannon, P.T.; Cutz, E.; Yeger, H.; Sherman, P.M. Increase in proliferation and apoptosis of gastric epithelial cells early in the natural history of Helicobacter pylori infection. Am. J. Pathol. 1997, 151, 1695–1703. [Google Scholar]
- Wang, F.; Luo, L.D.; Pan, J.H.; Huang, L.H.; Lv, H.W.; Guo, Q.; Xu, C.X.; Shen, S.R. Comparative genomic study of gastric epithelial cells co-cultured with Helicobacter pylori. World J. Gastroenterol. 2012, 18, 7212–7224. [Google Scholar] [CrossRef]
- Butcher, L.D.; den Hartog, G.; Ernst, P.B.; Crowe, S.E. Oxidative stress resulting from Helicobacter pylori infection contributes to gastric carcinogenesis. Cell Mol. Gastroenterol. Hepathol. 2017, 3, 316–322. [Google Scholar] [CrossRef]
- Wang, F.; Bu, G.; Feng, Q.; Liu, Z.; Xu, C.; Shen, S.; Yuan, Y. The expression level of TRAF1 in human gastric mucosa is related to virulence genotypes of Helicobacter pylori. Scand. J. Gastroenterol. 2014, 49, 925–932. [Google Scholar] [CrossRef] [PubMed]
- Zu, S.; Jin, J.; Gokhale, S.; Lu, A.M.; Shan, H.; Feng, J.; Xie, P. Genetic alterations of TRAF proteins in human cancers. Front. Immunol. 2018, 9, 2111. [Google Scholar]
- Wang, C.Y.; Mayo, M.W.; Korneluk, R.G.; Goeddel, D.V.; Baldwin, A.S., Jr. NF-kappaB antiapoptosis: Induction of TRAF1 and TRAF2 and c-IAP1 and c-IAP2 to suppress caspase-8 activation. Science 1998, 281, 1680–1683. [Google Scholar] [CrossRef] [PubMed]
- Gu, H.; Huang, T.; Shen, Y.; Liu, Y.; Zhou, F.; Jin, Y.; Sattar, H.; Wei, Y. Reactive oxygen species-mediated tumor microenvironment transformation: The mechanism of radioresistant gastric cancer. Oxid. Med. Cell Longev. 2018, 2018, 5801209. [Google Scholar] [CrossRef]
- Linnewiel-Hermoni, K.; Motro, Y.; Miller, Y.; Levy, J.; Sharoni, Y. Carotenoid derivatives inhibit nuclear factor kappa B activity in bone and cancer cells by targeting key thiol groups. Free Radic. Biol. Med. 2014, 75, 105–120. [Google Scholar] [CrossRef]
- Vince, J.E.; Pantaki, D.; Feltham, R.; Mace, P.D.; Cordier, S.M.; Schmukle, A.C.; Davidson, A.J.; Callus, B.A.; Wong, W.W.; Gentle, I.E.; et al. TRAF2 must bind to cellular inhibitors of apoptosis for tumor necrosis factor (tnf) to efficiently activate nf-{kappa}b and to prevent tnf-induced apoptosis. J. Biol. Chem. 2009, 284, 35906–35915. [Google Scholar] [CrossRef]
- Chew, B.P.; Park, J.S.; Wong, M.W.; Wong, T.S. A comparison of the anticancer activities of dietary beta-carotene, canthaxanthin and astaxanthin in mice in vivo. Anticancer Res. 1999, 19, 1849–1853. [Google Scholar]
- Sowmya Shree, G.; Yogendra Prasad, K.; Arpitha, H.S.; Deepika, U.R.; Nawneet Kumar, K.; Mondal, P.; Ganesan, P. β-Carotene at physiologically attainable concentration induces apoptosis and down-regulates cell survival and antioxidant markers in human breast cancer (MCF-7) cells. Mol. Cell. Biochem. 2017, 436, 1–12. [Google Scholar] [CrossRef]
- Park, Y.; Choi, J.; Lim, J.W.; Kim, H. β-Carotene-induced apoptosis is mediated with loss of Ku proteins in gastric cancer AGS cells. Genes Nutr. 2015, 10, 467. [Google Scholar] [CrossRef]
- Wang, N.; Gao, Y.; Zhou, Z.; Liu, W.; Pan, C.; Yin, P.; Yu, X.; Tang, M. β-Carotene suppresses osteoclastogenesis and bone resorption by suppressing NF-κB signaling pathway. Life Sci. 2017, 174, 15–20. [Google Scholar] [CrossRef]
- Li, R.; Hong, P.; Zheng, X. β-Carotene attenuates lipopolysaccharide-induced inflammation via inhibition of the NF-κB, JAK2/STAT3 and JNK/p38 MAPK signaling pathways in macrophages. Anim. Sci. J. 2019, 90, 140–148. [Google Scholar] [CrossRef] [PubMed]
- Kim, Y.; Seo, J.H.; Kim, H. β-Carotene and lutein inhibit hydrogen peroxide-induced activation of NF-κB and IL-8 expression in gastric epithelial AGS cells. J. Nutr. Sci. Vitaminol. 2011, 57, 216–223. [Google Scholar] [CrossRef] [PubMed]
- Ahn, K.S.; Sethi, G.; Krishnan, K.; Aggarwal, B.B. Gamma-tocotrienol inhibits nuclear factor-kappaB signaling pathway through inhibition of receptor-interacting protein and TAK1 leading to suppression of antiapoptotic gene products and potentiation of apoptosis. J. Biol. Chem. 2007, 282, 809–820. [Google Scholar] [CrossRef] [PubMed]
- Qureshi, A.A.; Tan, X.; Reis, J.C.; Badr, M.Z.; Papasian, C.J.; Morrison, D.C.; Qureshi, N. Inhibition of nitric oxide in LPS-stimulated macrophages of young and senescent mice by δ-tocotrienol and quercetin. Lipids Health Dis. 2011, 10, 239. [Google Scholar] [CrossRef]
- Li, F.; Zhang, X.; Li, Y.; Lu, K.; Yin, R.; Ming, J. Phenolics extracted from tartary (Fagopyrum tartaricum L. Gaerth) buckwheat bran exhibit antioxidant activity, and an antiproliferative effect on human breast cancer MDA-MB-231 cells through the p38/MAP kinase pathway. Food Funct. 2017, 8, 177–188. [Google Scholar] [CrossRef]
- Zhang, J.; Zhang, S.; Bi, J.; Gu, J.; Deng, Y.; Liu, C. Astaxanthin pretreatment attenuates acetaminophen-induced liver injury in mice. Int. Immunopharmacol. 2017, 45, 26–33. [Google Scholar] [CrossRef]
- Bai, S.K.; Lee, S.J.; Na, H.J.; Ha, K.S.; Han, J.A.; Lee, H.; Kwon, Y.G.; Chung, C.K.; Kim, Y.M. β-Carotene inhibits inflammatory gene expression in lipopolysaccharide-stimulated macrophages by suppressing redox-based NF-kappaB activation. Exp. Mol. Med. 2005, 37, 323–334. [Google Scholar] [CrossRef]
- Hadad, N.; Levy, R. The synergistic anti-inflammatory effects of lycopene, lutein, β-carotene, and carnosic acid combinations via redox-based inhibition of NF-κB signaling. Free Radic. Biol. Med. 2012, 53, 1381–1391. [Google Scholar] [CrossRef]
- Di Tomo, P.; Canali, R.; Ciavardelli, D.; Di Silvestre, S.; De Marco, A.; Giardinelli, A.; Pipino, C.; Di Pietro, N.; Virgili, F.; Pandolfi, A. β-Carotene and lycopene affect endothelial response to TNF-α reducing nitro-oxidative stress and interaction with monocytes. Mol. Nutr. Food Res. 2012, 56, 217–227. [Google Scholar] [CrossRef]
- Palozza, P.; Serini, S.; Torsello, A.; Di Nicuolo, F.; Piccioni, E.; Ubaldi, V.; Pioli, C.; Wolf, F.I.; Calviello, G. Beta-carotene regulates NF-kappaB DNA-binding activity by a redox mechanism in human leukemia and colon adenocarcinoma cells. J. Nutr. 2003, 133, 381–388. [Google Scholar] [CrossRef]
- Zhou, Y.; Wang, T.; Meng, Q.; Zhai, S. Association of carotenoids with risk of gastric cancer: A meta-analysis. Clin. Nutr. 2016, 35, 109–116. [Google Scholar] [CrossRef] [PubMed]
- Kim, J.H.; Lee, J.; Choi, I.J.; Kim, Y.I.; Kwon, O.; Kim, H.; Kim, J. Dietary Carotenoids Intake and the Risk of Gastric Cancer: A Case-Control Study in Korea. Nutrients 2018, 10, E1031. [Google Scholar] [CrossRef] [PubMed]
- Larsson, S.C.; Bergkvist, L.; Näslund, I.; Rutegård, J.; Wolk, A. Vitamin A, retinol, and carotenoids and the risk of gastric cancer: A prospective cohort study. Am. J. Clin. Nutr. 2007, 85, 497–503. [Google Scholar] [CrossRef] [PubMed]
- Kim, H.J.; Kim, M.K.; Chang, W.K.; Choi, H.S.; Choi, B.Y.; Lee, S.S. Effect of nutrient intake and Helicobacter pylori infection on gastric cancer in Korea: A case-control study. Nutr. Cancer 2005, 52, 138–146. [Google Scholar] [CrossRef]
- Epplein, M.; Signorello, L.B.; Zheng, W.; Cai, Q.; Hargreaves, M.K.; Michel, A.; Pawlita, M.; Fowke, J.H.; Correa, P.; Blot, W.J. Helicobacter pylori prevalence and circulating micronutrient levels in a low-income United States population. Cancer Prev. Res. 2011, 4, 871–878. [Google Scholar] [CrossRef]


© 2019 by the authors. Licensee MDPI, Basel, Switzerland. This article is an open access article distributed under the terms and conditions of the Creative Commons Attribution (CC BY) license (http://creativecommons.org/licenses/by/4.0/).
Share and Cite
Park, Y.; Lee, H.; Lim, J.W.; Kim, H. Inhibitory Effect of β-Carotene on Helicobacter pylori-Induced TRAF Expression and Hyper-Proliferation in Gastric Epithelial Cells. Antioxidants 2019, 8, 637. https://doi.org/10.3390/antiox8120637
Park Y, Lee H, Lim JW, Kim H. Inhibitory Effect of β-Carotene on Helicobacter pylori-Induced TRAF Expression and Hyper-Proliferation in Gastric Epithelial Cells. Antioxidants. 2019; 8(12):637. https://doi.org/10.3390/antiox8120637
Chicago/Turabian StylePark, Yongchae, Hanbit Lee, Joo Weon Lim, and Hyeyoung Kim. 2019. "Inhibitory Effect of β-Carotene on Helicobacter pylori-Induced TRAF Expression and Hyper-Proliferation in Gastric Epithelial Cells" Antioxidants 8, no. 12: 637. https://doi.org/10.3390/antiox8120637
APA StylePark, Y., Lee, H., Lim, J. W., & Kim, H. (2019). Inhibitory Effect of β-Carotene on Helicobacter pylori-Induced TRAF Expression and Hyper-Proliferation in Gastric Epithelial Cells. Antioxidants, 8(12), 637. https://doi.org/10.3390/antiox8120637